
Capacity pressure and risk prediction anchor demand
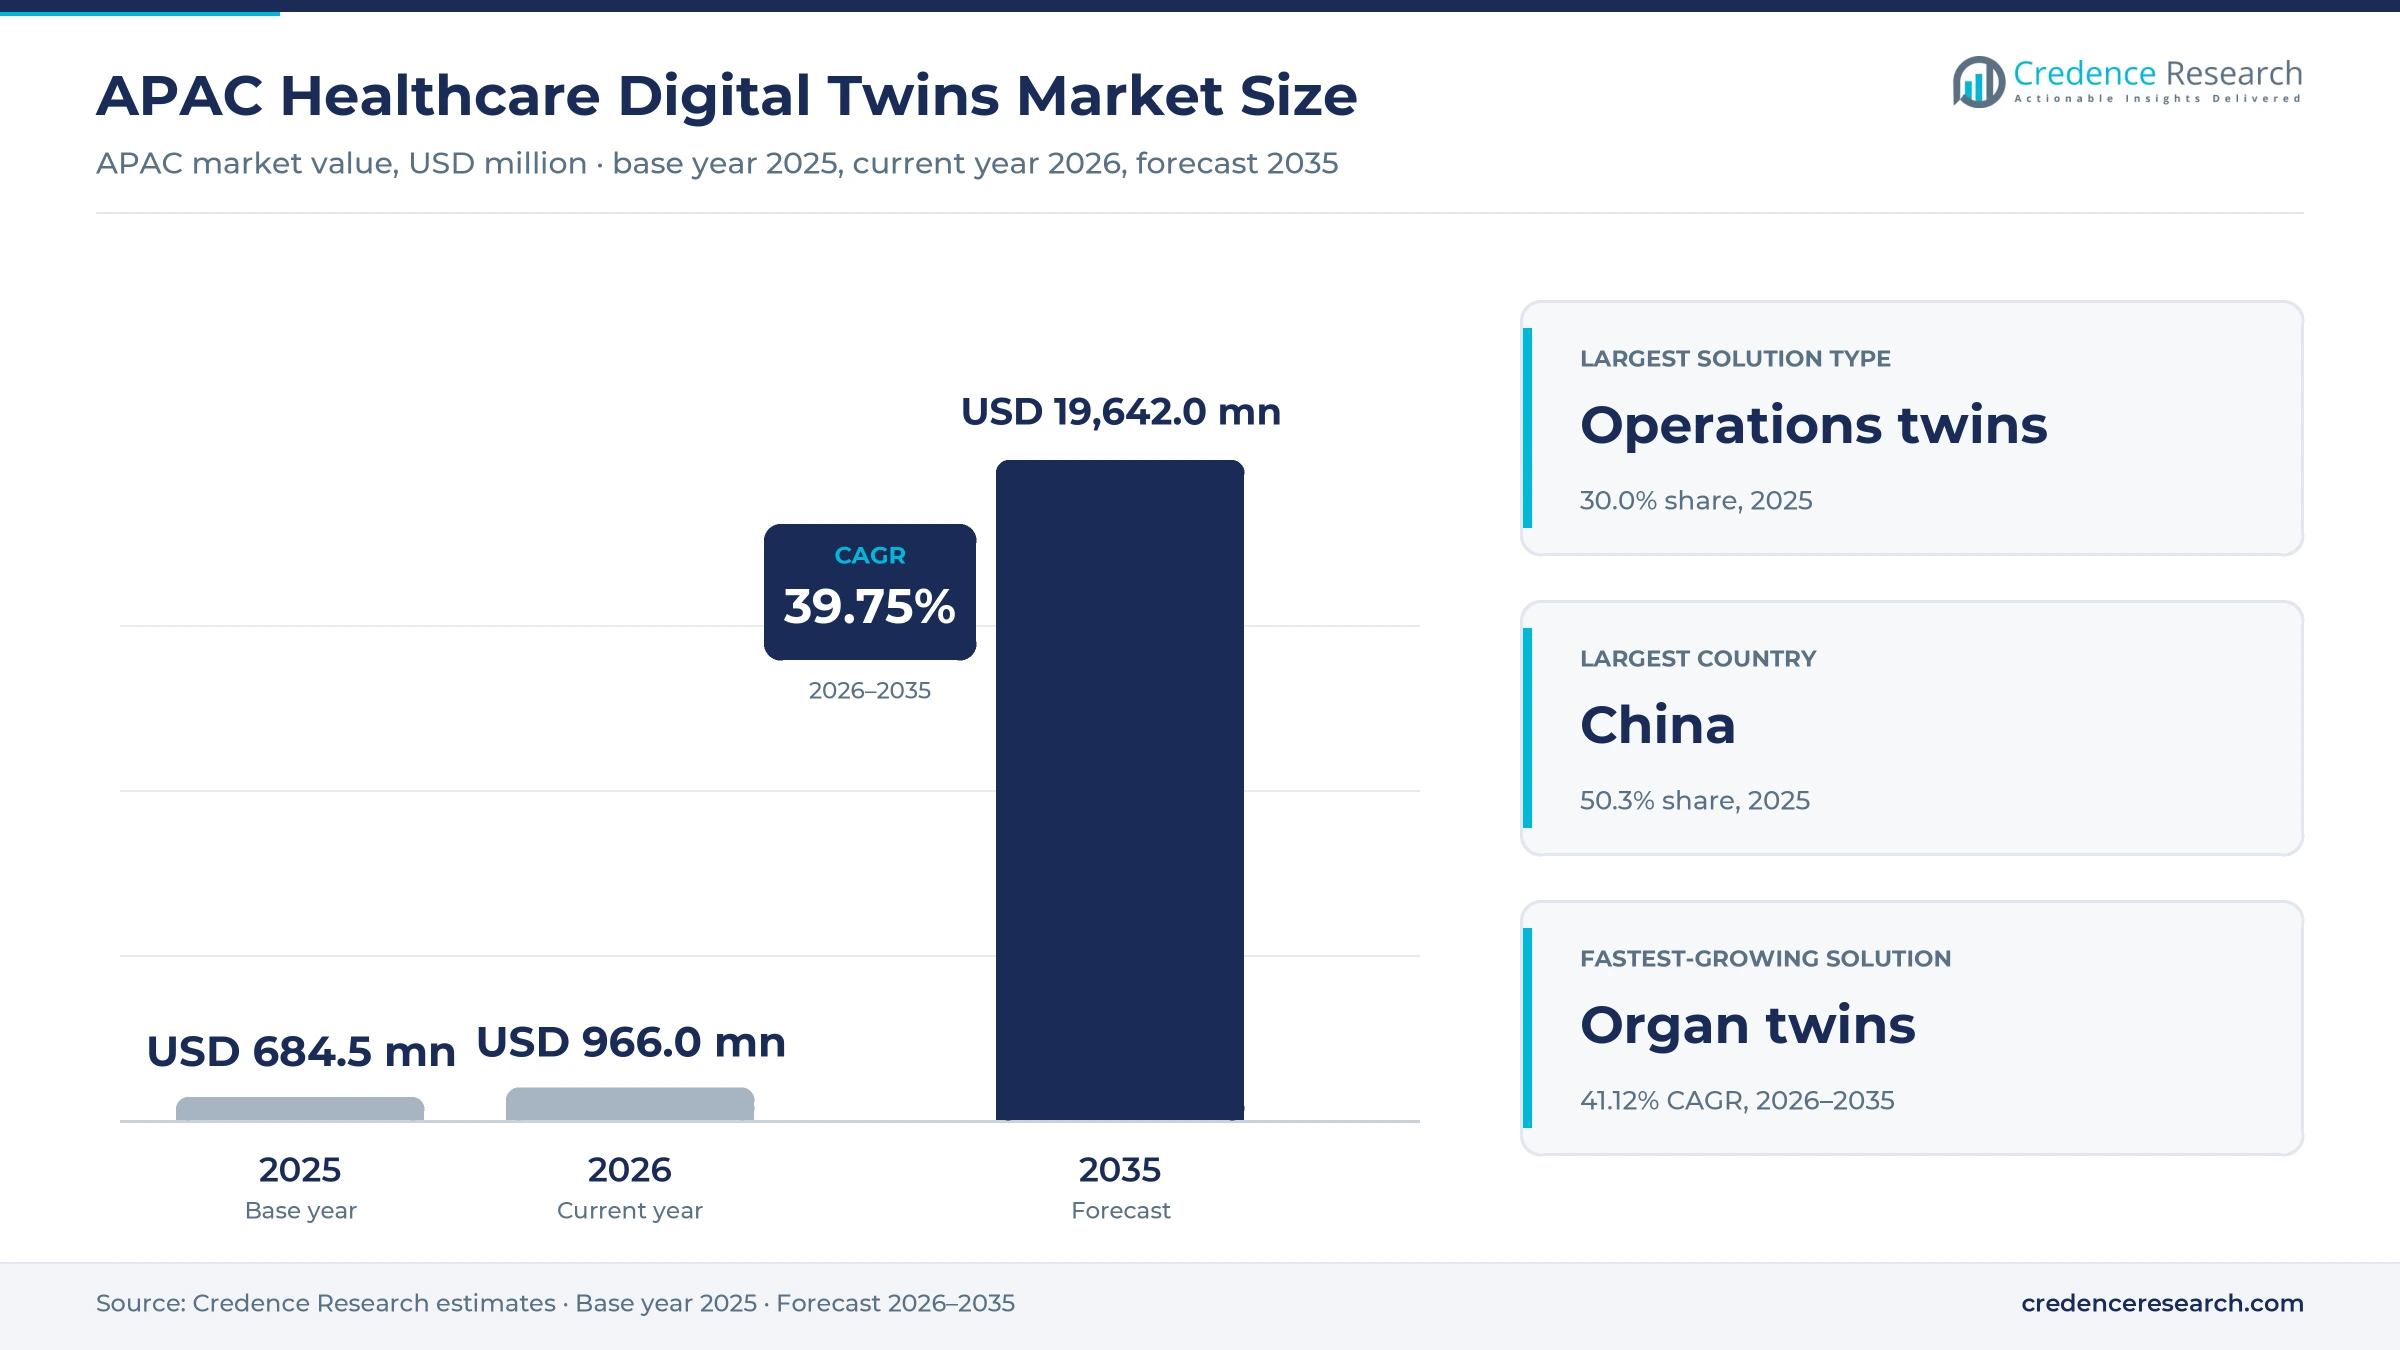
The APAC healthcare digital twins market was valued at USD 684.5 million in 2025 and is projected to increase from USD 966.0 million in 2026 to USD 19.64 billion by 2035, registering a CAGR of 39.75% during 2026–2035. Demand comes from hospitals that model beds, staff and patient flow, drug and device makers that test designs in software, and public health agencies that plan services for aging populations. China held the largest country share, 50.3% in 2025, because national policy pushes artificial intelligence into hospital care and its hospital network is the largest in the region. India is the fastest-growing country at 41.65% a year, as national digital health records create the data base that patient models need. Japan, South Korea and the remaining markets add demand from aging populations and advanced hospital systems. Regulators have also started to clear patient risk models as medical software, which moves them from research into routine care.
Which solutions and services does the regional estimate cover?
The estimate measures spending on software, platforms and related services that build virtual replicas of organs, patients, hospital operations, drug programs, populations and medical devices in the Asia-Pacific region. It covers subscriptions, licenses, maintenance and usage-based or outcome-based contracts. Values are measured at the first point of sale to the hospital, drug or device maker, agency or insurer.
The estimate excludes general electronic health record systems, imaging hardware and building management systems that do not run simulation models. The value chain runs from cloud and computing providers through simulation software developers, medical technology vendors and health technology start-ups to hospitals, drug makers, device makers, insurers and public health agencies across China, Japan, South Korea, India and the rest of the region.
APAC Healthcare Digital Twins Market Insights
- The APAC healthcare digital twins market was valued at USD 684.5 million in 2025 and is projected to reach USD 19.64 billion by 2035, registering a CAGR of 39.75% during 2026–2035.
- China held a 50.3% share of 2025 value, because national policy pushes artificial intelligence into hospitals at the second grade and above.
- Hospital operations twins led solution demand with a 30.0% share of 2025 value, because hospitals need to plan beds, staff and patient flow.
- Singapore hospitals planned to trial a regulator-cleared kidney risk model in early 2025, which was built from data on 7,000 patients.
- GE HealthCare said in December 2024 that its Command Center software was used in more than 300 hospitals worldwide.
Operations twins lead while organ models grow fastest
Why do hospital operations models lead solution demand?
Based on solution type, the market is categorized into organ and physiological twins, hospital operations twins, drug discovery twins, population health twins and medical device twins. Hospital Operations Twins led with a 30.0% share of 2025 value, because hospitals buy them to plan beds, staff and patient flow. Organ and Physiological Twins grow fastest at 41.12% a year, as regulators clear patient risk models for routine care.
Why does public cloud lead deployment?
Based on deployment model, the market is categorized into public cloud, private cloud, on-premises and hybrid deployment. Public Cloud led with a 40.0% share of 2025 value, because simulation workloads need flexible computing power. Public Cloud also grows fastest at 40.53% a year, as buyers prefer subscription access over owning servers for large models. Private and hybrid setups remain common where hospitals must keep patient data on site.
Why do healthcare providers lead customer demand?
Based on customer type, the market is categorized into healthcare providers, pharmaceutical companies, public health agencies, health insurers and medical device manufacturers. Healthcare Providers led with a 42.0% share of 2025 value, because hospitals face the most direct pressure on capacity and outcomes. Health Insurers grow fastest at 40.50% a year, as they test risk models to manage chronic disease costs.
How does clinical decision support shape application demand?
Based on application, the market is categorized into clinical decision support, capacity optimization, research validation and population planning. Clinical Decision Support led with a 34.0% share of 2025 value, because clinicians use patient models to guide treatment choices. Clinical Decision Support also grows fastest at 40.49% a year, as hospitals move validated risk scores into routine clinics and digital prescribing.
| Segment Group | Leading Sub-segment | Share, 2025 | Fastest-growing Sub-segment | CAGR, 2026–2035 |
|---|---|---|---|---|
| By Solution Type | Hospital Operations Twins | 30.0% | Organ and Physiological Twins | 41.12% |
| By Deployment Model | Public Cloud | 40.0% | Public Cloud | 40.53% |
| By Customer Type | Healthcare Providers | 42.0% | Health Insurers | 40.50% |
| By Application | Clinical Decision Support | 34.0% | Clinical Decision Support | 40.49% |
Request a Free Sample
Fill in your details and we'll send you a free sample report.
- Sample data tables & charts
- Research methodology
Capacity, validated risk models and AI policy lift use
How does hospital capacity pressure lift operations models?
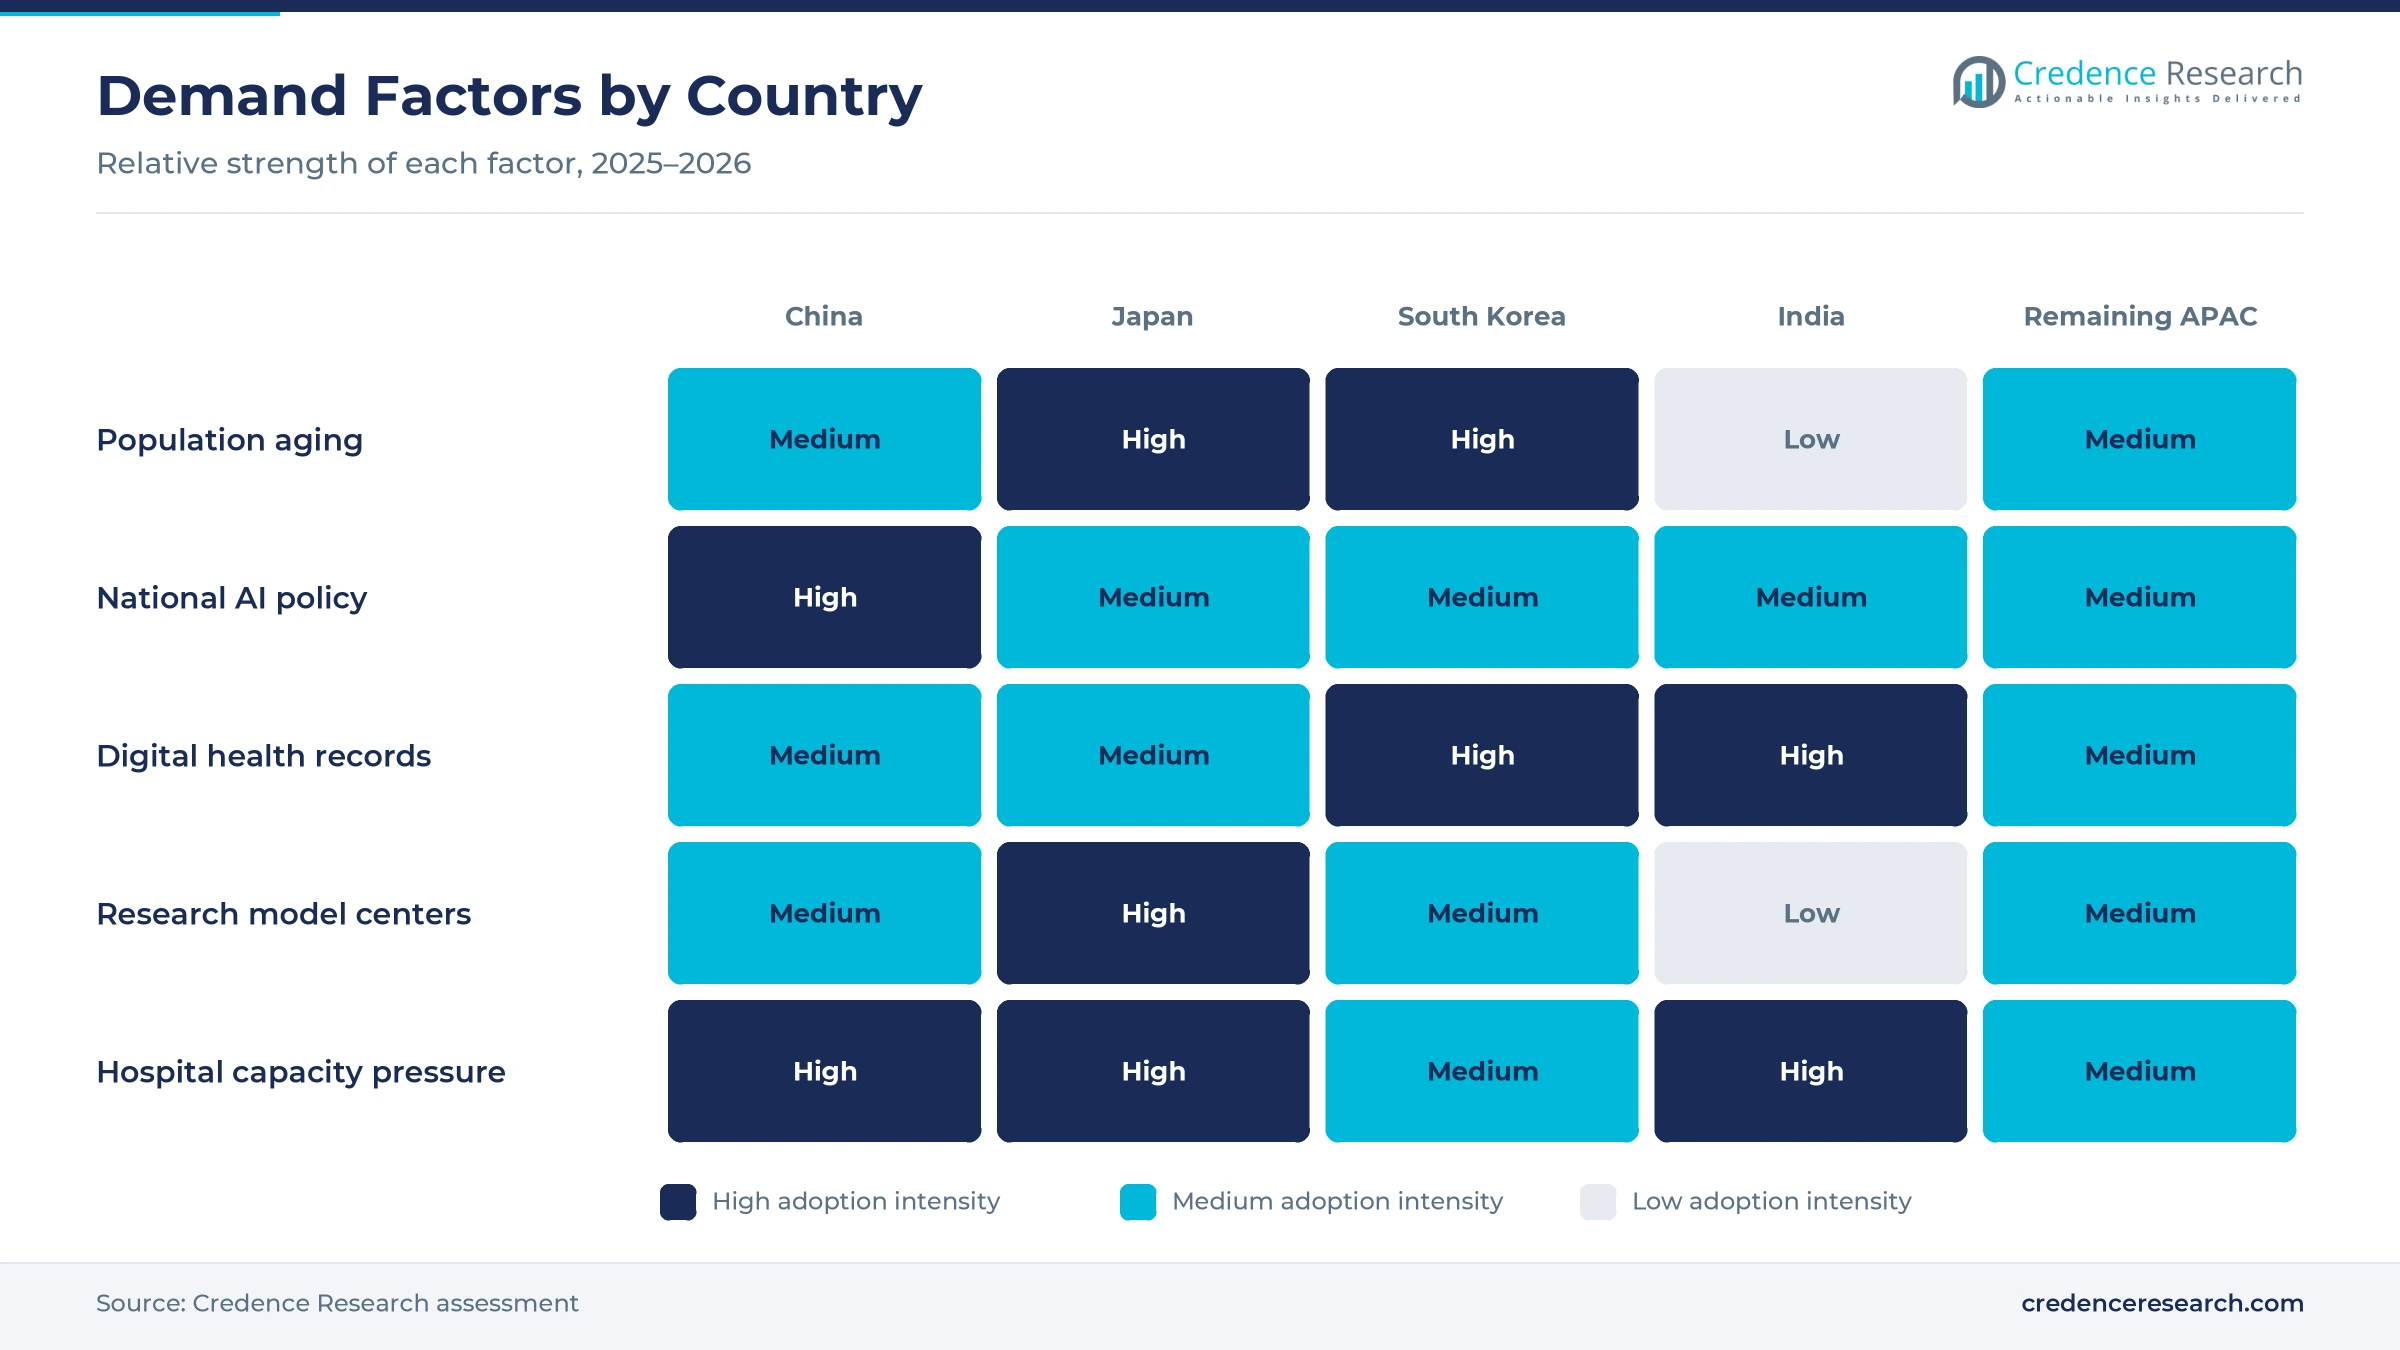
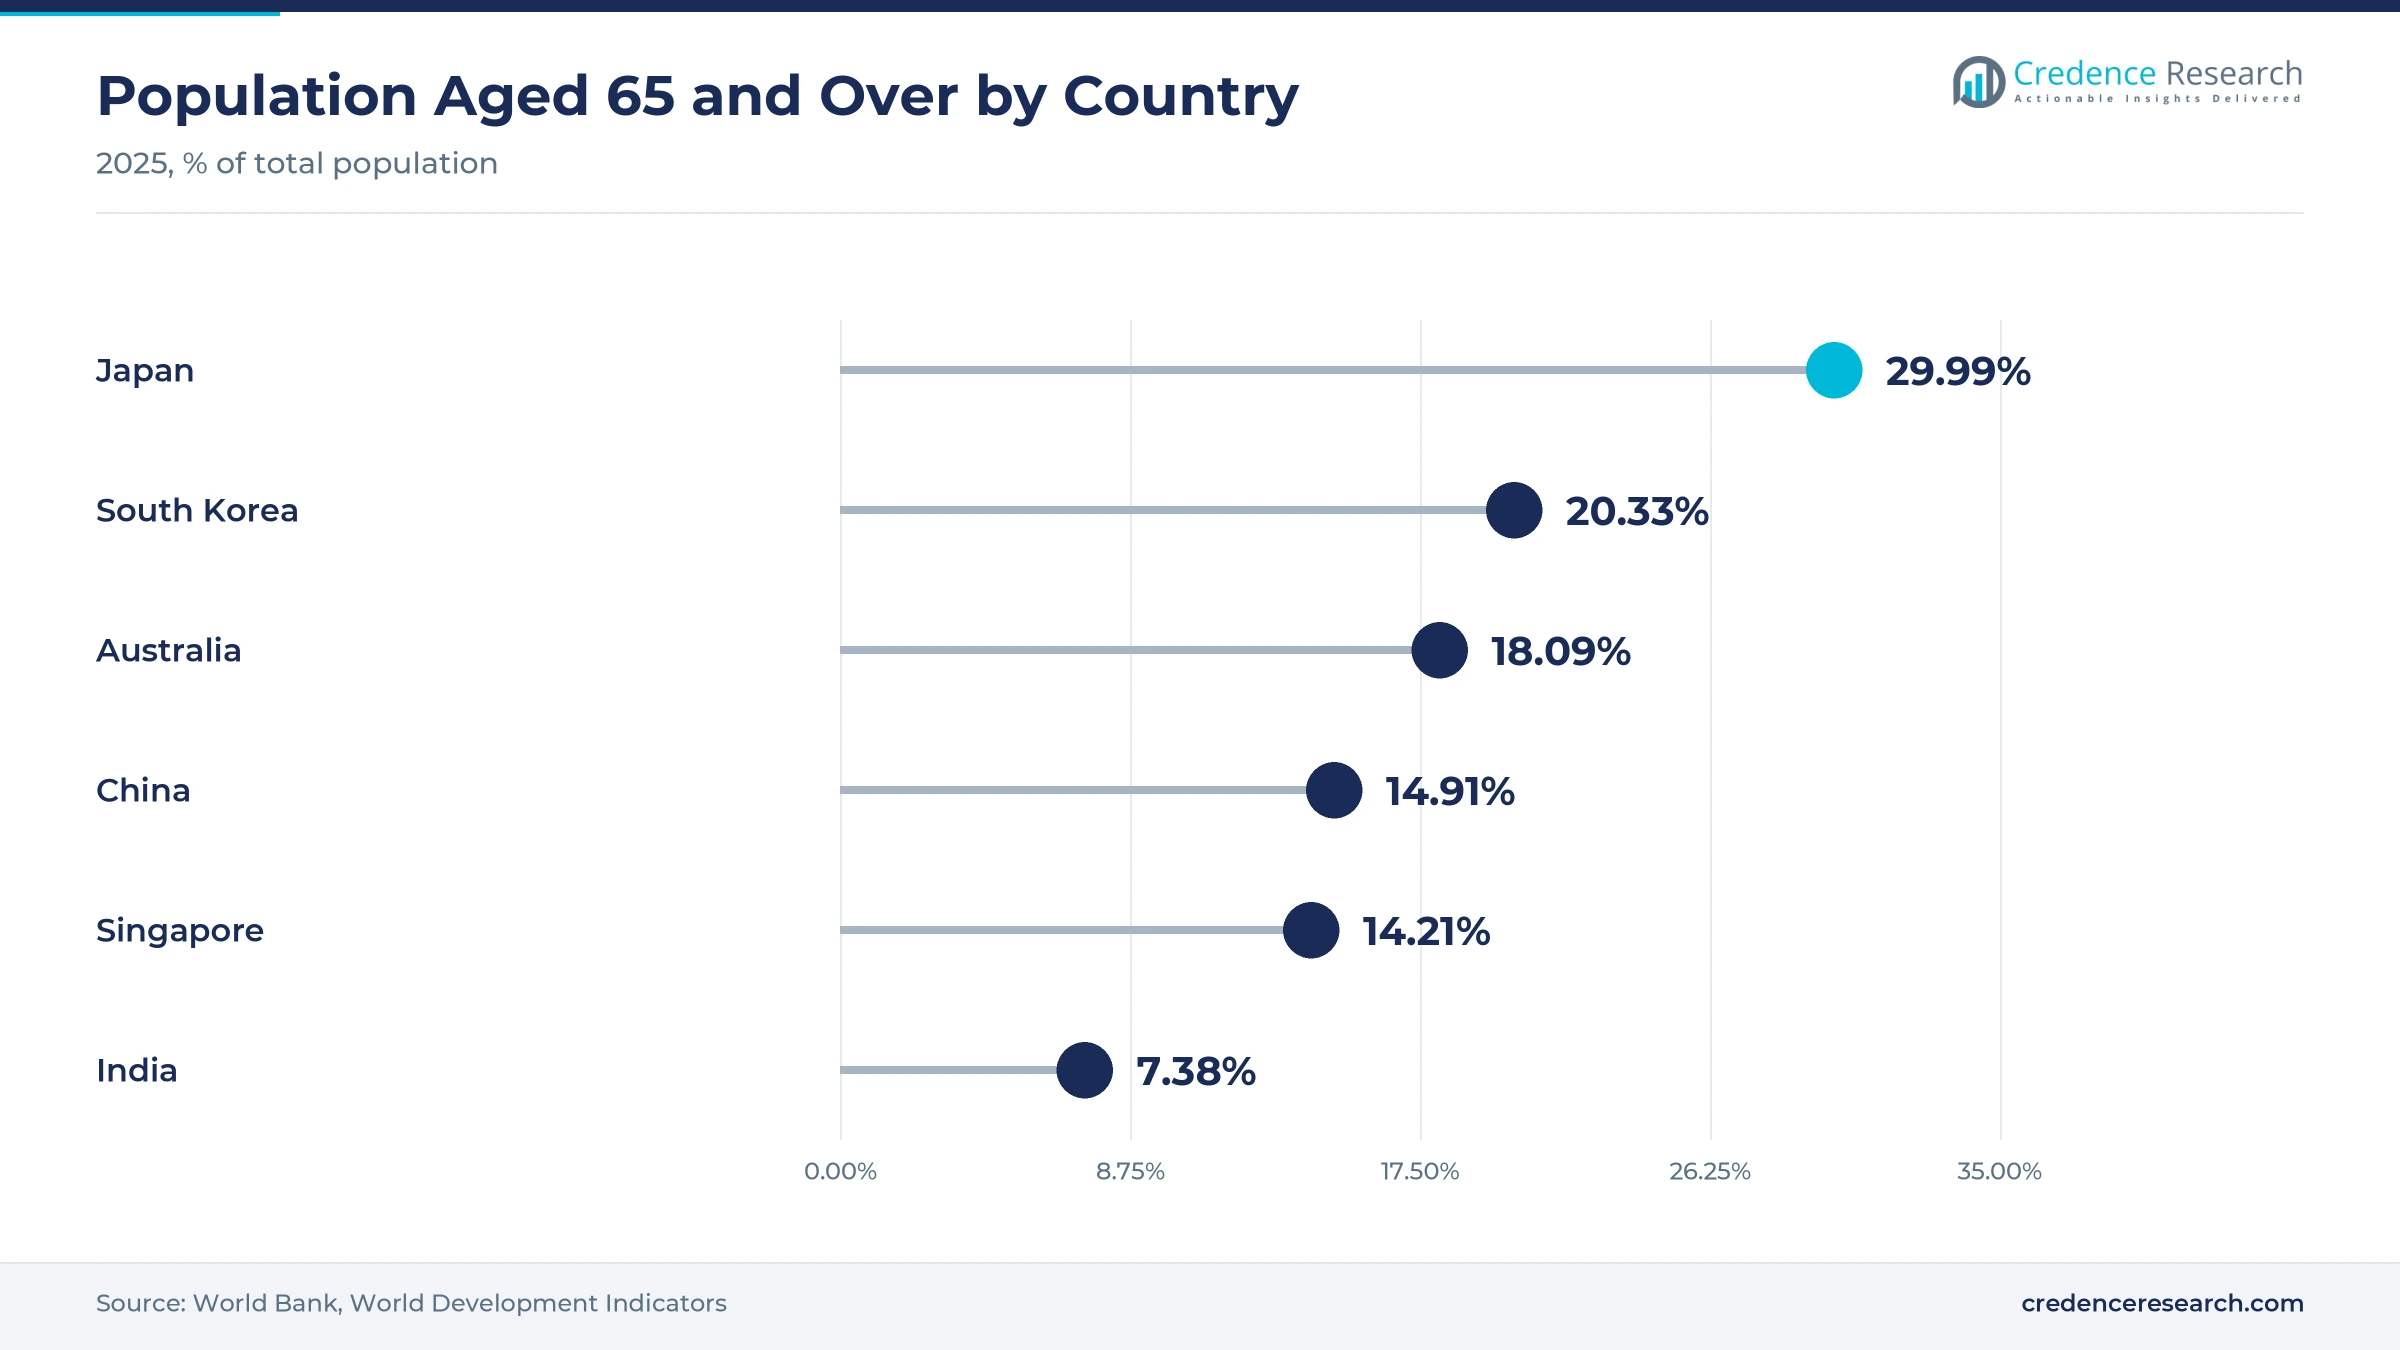
Hospital capacity optimization lifts demand, because aging populations fill beds faster than hospitals can add staff and space. People aged 65 and over made up about 30% of the population in Japan and 20% in South Korea in 2025, according to World Bank data. Alfred Health in Melbourne adopted GE HealthCare Command Center software for capacity management and patient flow, as GE HealthCare announced in a company release dated Dec. 11, 2024. Changi General Hospital in Singapore also uses simulation models to forecast emergency staffing and resource needs. As a result, hospital operations twins hold a 30.0% share of 2025 value, the largest solution share.
Why does validated clinical risk prediction speed adoption?
Validated clinical risk prediction speeds adoption, because regulator clearance lets hospitals use patient models in routine care. Mesh Bio built HealthVector Diabetes, a model cleared by the Health Sciences Authority that predicts three-year kidney disease risk in type 2 diabetes. The risk score was derived from data on 7,000 patients and published in May 2024, according to a Singapore General Hospital report. Singapore has more than 470,000 adults with diabetes, and about half of them have chronic kidney disease. Diabetes also causes 67% of new kidney failure cases in the country. In turn, organ and physiological twins grow at 41.12% a year, the fastest solution rate.
How does reusable simulation infrastructure cut project costs?
Reusable simulation infrastructure cuts project costs, because one validated model can serve many hospitals, trials and devices. NTT Research and the National Cerebral and Cardiovascular Center set up a Bio Digital Twin Center in Suita, Japan, in 2023. In November 2025, NTT Research said it had updated its cardiovascular model with a virtual healthy population and built virtual heart failure populations. Siemens Healthineers also signed a three-year partnership in December 2023 with an Indonesian heart center to study heart disease with patient replicas. In turn, drug makers can reuse these models for in silico clinical trials, which lowers the cost of each new study.
Why does national AI policy widen hospital use?
National artificial intelligence policy widens hospital use, because governments now set dates for clinical AI adoption. China's National Health Commission and four other authorities released a plan on Nov. 4, 2025, according to a government notice. It calls for intelligent diagnosis assistance to be universal at primary-level clinics by 2030. It also expects hospitals at the second grade and above to widely adopt imaging AI and clinical decision-making support. Samsung Seoul Hospital reached the top HIMSS stage in 4 of 6 digital health areas, which shows that leading hospitals have the data maturity that patient models need. As a result, clinical decision support holds a 34.0% share of 2025 value.
Hospital-wide models and virtual patients reshape demand
How is the shift to hospital-wide models changing projects?
The shift to hospital-wide models is changing projects, because hospitals want one replica for outbreaks, beds and staffing. SingHealth began its 3D outbreak surveillance projects at Singapore General Hospital in 2020. Its next version was planned to link with bed management and clinical data systems across more SingHealth institutions. Manual outbreak analysis in hospitals had a data delay of 24 to 36 hours, which real-time replicas aim to remove. SingHealth also uses a digital replica with building information models to plan the future Eastern General Hospital. As a result, healthcare providers hold a 42.0% share of 2025 value, the largest customer share.
Why is the rise of virtual patient populations gaining weight?
The rise of virtual patient populations is gaining weight, because drug and device makers can test ideas on simulated patients before trials. NTT Research announced on Nov. 5, 2025, that it had built virtual populations for two types of heart failure. The National Cerebral and Cardiovascular Center in Osaka is adding the heart model to its closed-loop intervention system for acute heart failure. NTT Research also has 3 joint research agreements for the program, with Harvard University, the Technical University of Munich and the Osaka center. Its Bio Digital Twin Center was established in Suita in 2023. In turn, drug discovery twins and medical device twins gain buyers among companies that use simulation software for product design.
Can southeast Asian expansion open new customer demand?
Southeast Asian expansion opens new customer demand, because regional start-ups now sell proven models beyond their home markets. Mesh Bio announced a $3.5 million Series A investment round led by East Ventures, according to trade press reporting on Feb. 1, 2024. The company plans to scale its digital twin platform in Hong Kong, Indonesia and the Philippines. Siemens Healthineers also works with Harapan Kita National Cardiovascular Center Hospital in Jakarta on a patient replica project witnessed by the Indonesian health ministry. As a result, the remaining APAC markets, with a 22.9% share of 2025 value, can add new hospital and insurer contracts.
Is there room for growth in Indian digital health data?
Indian digital health data creates room for growth, because patient models need large linked record sets to learn from. India had created about 79.71 crore digital health accounts and linked about 65.09 crore health records by July 28, 2025, according to a written reply to parliament. About 4.17 lakh health facilities had also joined the national facility registry. India had only 1.59 hospital beds per 1,000 people in 2021, which makes capacity planning urgent for public and private hospitals and state health departments. In turn, hospitals that move records to cloud infrastructure can build risk and capacity models at lower cost.
Data access, validation costs and skills gaps slow uptake
How does fragmented data access slow model building?
Fragmented data access slows model building, because patient records sit in separate hospital, laboratory and insurance systems. Many countries also restrict how health data can leave a hospital or cross borders. As a result, vendors spend months on data cleaning and consent before a model can run. Governments respond with national health record programs and data-sharing rules, while vendors use federated methods that keep data inside hospitals. These steps should shorten the time from data access to a working model.
Why do validation costs delay clinical use?
Validation costs delay clinical use, because each patient model must prove accuracy on local populations before regulators clear it. Studies can take years and need thousands of patient records. In turn, smaller vendors may run out of funding before their models reach routine care. Vendors respond by partnering with public hospital groups, publishing results in peer-reviewed journals and seeking clearance for narrow uses first. This approach builds evidence step by step before vendors seek wider clinical claims.
How do skills gaps limit hospital adoption?
Skills gaps limit hospital adoption, because building and running replicas needs data engineers, modelers and clinical champions. Many hospitals in the region lack these teams and depend on outside vendors. As a result, projects can stall after a pilot when vendor support ends. Hospitals respond by creating data science units, while vendors offer managed services and training that help staff run models on their own. Universities are also adding courses that combine clinical work with data science and simulation.
Why do unclear payment models slow scale-up?
Unclear payment models slow scale-up, because most insurers and public payers do not yet pay directly for model-guided care. Hospitals must fund projects from their own budgets or research grants. In turn, many replicas stay at pilot scale in a few wards. Vendors respond with subscription and outcome-based contracts that link fees to saved bed days, avoided admissions or faster trials. Clear evidence of savings should help public payers fund wider rollouts across hospital networks.
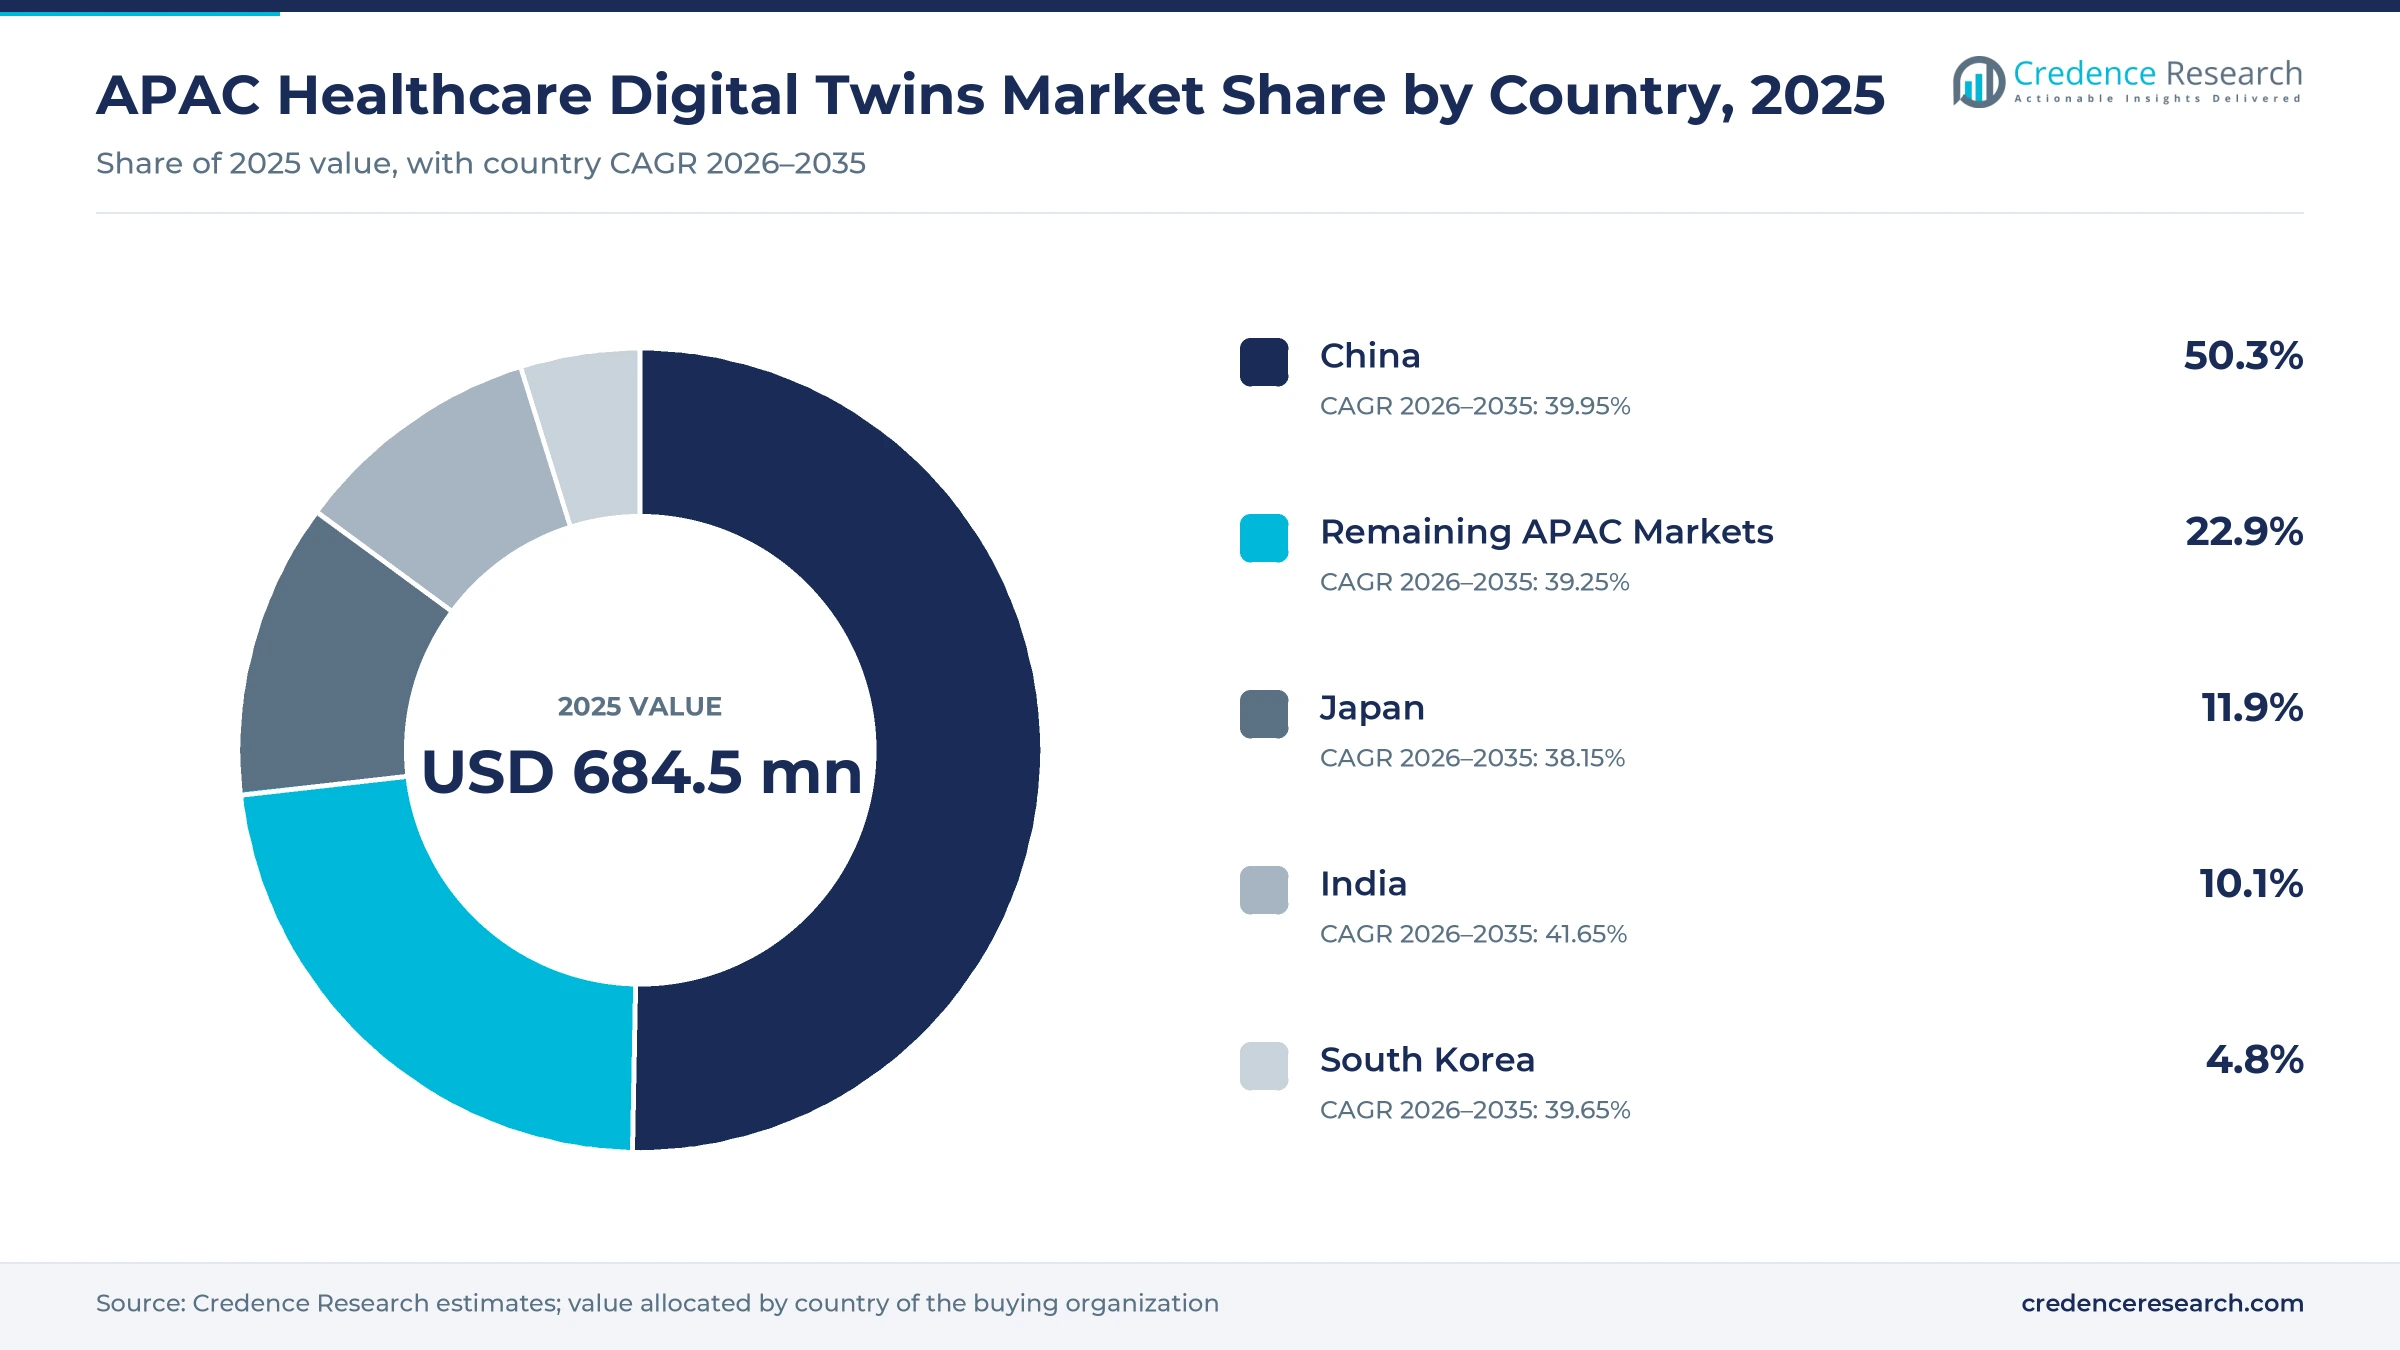
China leads while India grows fastest
| Country | Value, 2025 (USD million) | Share, 2025 | CAGR, 2026–2035 |
|---|---|---|---|
| China | 344.3 | 50.3% | 39.95% |
| Remaining APAC Markets | 156.8 | 22.9% | 39.25% |
| Japan | 81.5 | 11.9% | 38.15% |
| India | 69.1 | 10.1% | 41.65% |
| South Korea | 32.9 | 4.8% | 39.65% |
Why does China hold the largest share?
China held a 50.3% share of 2025 value and grows at 39.95% a year, because it has the largest hospital network and a national plan for clinical AI. The November 2025 plan expects hospitals at the second grade and above to widely adopt clinical decision support. People aged 65 and over made up about 15% of the population in 2025, which adds pressure on hospital capacity.
How does Japan support research demand?
Japan held an 11.9% share of 2025 value and grows at 38.15% a year, because its aging population and research centers create demand for patient and capacity models. About 30% of people were aged 65 and over in 2025, the highest share in the region. NTT Research and its partners established a Bio Digital Twin Center in Suita in 2023 to build heart models with the National Cerebral and Cardiovascular Center.
Why is India the fastest-growing country?
India held a 10.1% share of 2025 value and grows fastest at 41.65% a year, because national digital health records give model builders a large data base. The country had about 79.71 crore digital health accounts by July 2025. India also had only 1.59 hospital beds per 1,000 people in 2021, which makes capacity planning a priority for public and private hospitals.
How does South Korea add advanced hospital demand?
South Korea held a 4.8% share of 2025 value and grows at 39.65% a year, because its leading hospitals run mature digital systems. Samsung Seoul Hospital reached the top HIMSS stage in 4 of 6 digital health areas in 2025. People aged 65 and over made up about 20% of the population in 2025, which raises demand for capacity planning.
What shapes demand in the remaining markets?
The remaining APAC markets held a 22.9% share of 2025 value and grow at 39.25% a year. Singapore hospitals use replicas for outbreak tracking, emergency staffing and kidney risk, while Alfred Health in Australia announced its adoption of capacity software in December 2024. Indonesia adds demand through a heart disease replica project in Jakarta.
Pilots, funding and policy milestones from 2024 to 2026
| Development | Status and market relevance |
|---|---|
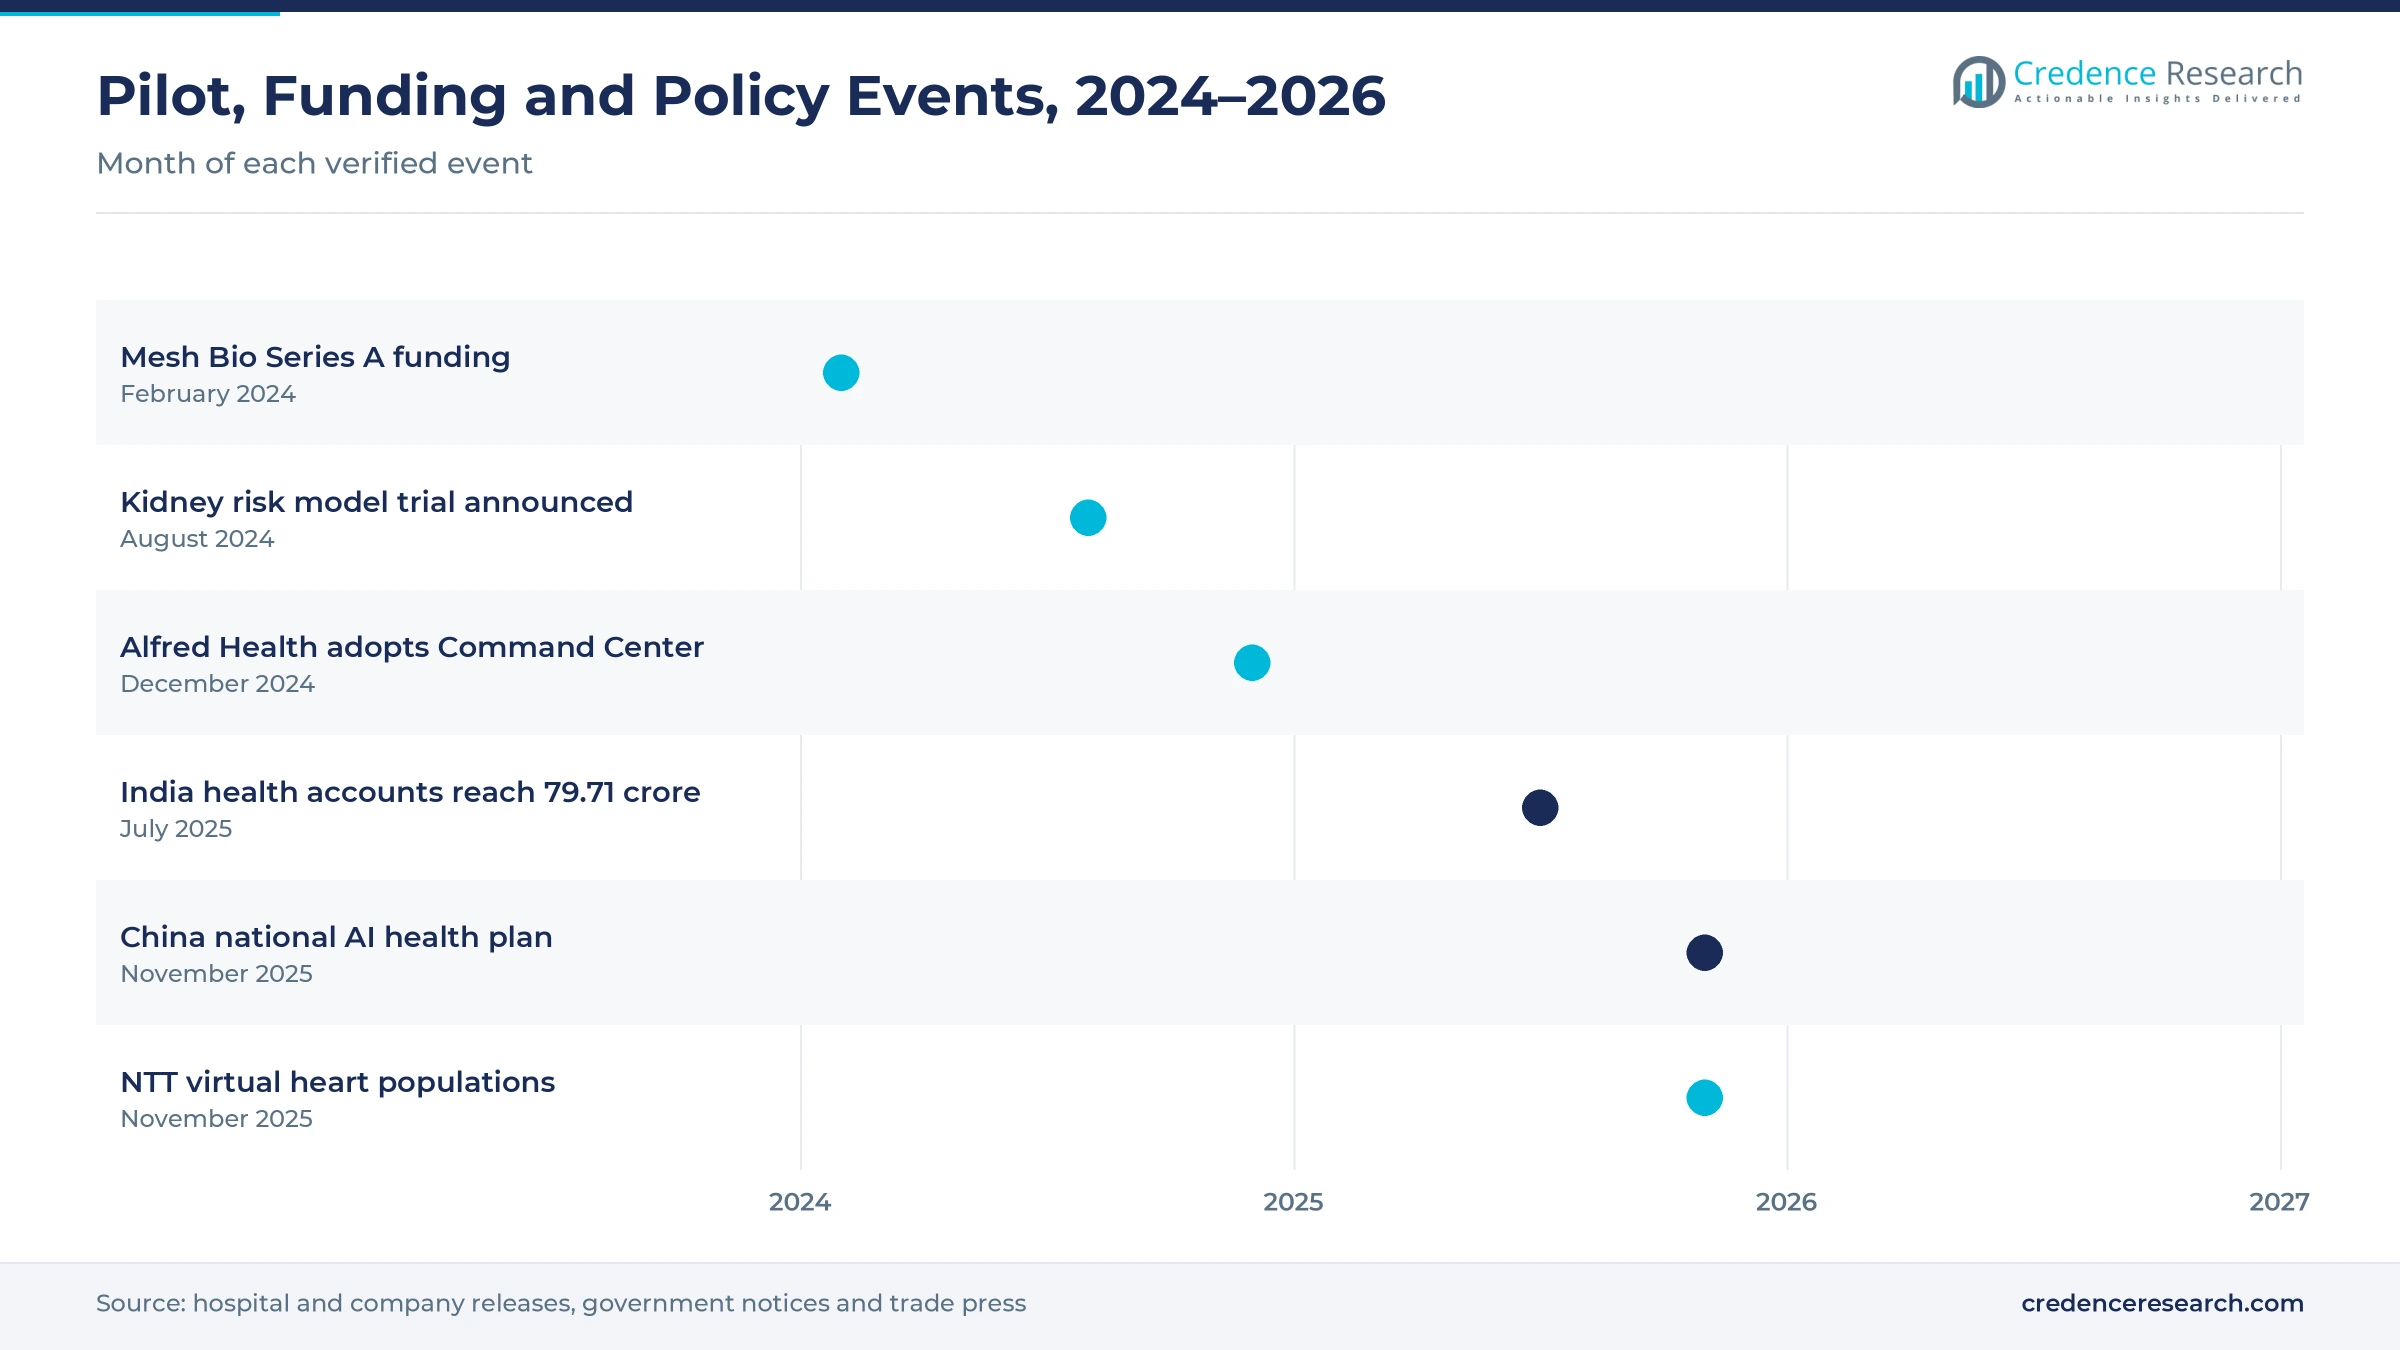
| In February 2024, Mesh Bio raised $3.5 million to expand its digital twin platform in Hong Kong, Indonesia and the Philippines. | Widens regional access to patient risk models |
| In August 2024, Singapore General Hospital said a kidney risk model would be trialled in early 2025. | Moves a cleared patient model into routine care |
| In December 2024, Alfred Health in Melbourne adopted GE HealthCare Command Center software. | Adds hospital capacity software in Australia |
| In November 2025, China released a national plan for AI use in health care to 2030. | Sets adoption targets for clinical decision support |
| In November 2025, NTT Research reported virtual heart failure populations for its cardiovascular model. | Expands patient simulation for drug and device testing |
Simulation, streaming data and physiological models
- Discrete event simulation models how patients move through wards and emergency departments, which helps hospitals plan beds and staff for busy periods.
- Streaming data integration feeds records, bed status and device data into the model, which keeps forecasts close to real time.
- Physiological models simulate organs such as the heart and kidneys, which lets clinicians test treatment choices on a virtual patient first.
- Virtual populations create large sets of simulated patients that match real clinical values, which supports trial design and device testing.
Need a Custom Version of This Report?
Tailor the scope, geography, or segments to your exact requirements.
- Custom geography or segment scope
- Direct access to our analyst team
Vendors compete on clinical proof, data links and scale
Competition combines global medical technology companies with software developers and regional start-ups. Siemens Healthineers works with an Indonesian heart center on a project that uses digital twins of patients, while GE HealthCare sells Command Center capacity software, which Alfred Health adopted in Melbourne in December 2024. Philips has invested in digital twin research since 2020 and promotes digital twins to hospitals across the region. Mesh Bio, based in Singapore, sells a regulator-cleared kidney risk model and is expanding to Hong Kong, Indonesia and the Philippines. Companies compete on clinical proof, links to hospital data systems and the ability to scale from one ward to a whole network. Vendors that win regulatory clearance and publish results gain trust faster with public hospital groups.
Companies profiled and their roles in this market
| Company | Type | Role in the market |
|---|---|---|
| Siemens Healthineers | Medical technology company | Runs a patient replica project with an Indonesian heart center |
| GE HealthCare | Medical technology company | Supplies Command Center capacity software to Alfred Health |
| Philips | Health technology company | Invests in digital twin research and promotes it in the region |
| Mesh Bio | Regional start-up | Sells a cleared kidney risk model in Singapore |
Credence Research view on regional virtual replica demand
Credence Research's view is that Asia-Pacific demand for virtual replicas in health care will grow very fast because aging, capacity pressure and national AI plans all point the same way. Hospital operations models remain the largest segment, while organ and physiological digital twins grow fastest as regulators clear them. China keeps the largest share, and India grows fastest among the major countries. However, data access, validation costs and unclear payment will slow scale-up. Vendors that combine clinical proof with strong data links should gain share fastest.
How the regional virtual replica estimate was built
The report uses 2025 as the base year on a calendar basis, and market values come from the Credence Research model. That model combines population and hospital statistics, digital health program data, government policy documents and company information on products, pilots and contracts. Segment splits and country growth rates are Credence Research estimates, while country shares follow the client-defined split. Sources used are official statistics, government notices, hospital and company releases, trade press and peer-reviewed research, and no interviews or surveys were used.
Capacity planning and personal risk models carry demand
Regional value for these virtual replicas is expected to reach USD 19.64 billion by 2035, a 39.75% CAGR during 2026–2035, as hospitals move from pilots to network-wide use. Growth should be fastest through 2030 while China meets its AI targets and India builds on its health record base. After that, patient digital twins and virtual trials will carry more growth as payers start to fund model-guided care. Faster regulatory clearance would raise this outlook, while strict data rules would lower it.
Frequently Asked Questions
How big is the APAC healthcare digital twins market?
Which solution type leads regional demand?
Which country leads the regional market?
Why do healthcare providers lead customer demand?
How do regulators affect adoption?
Which deployment model leads the market?
Who are the leading companies in the region?
What are the main challenges for vendors?
Table of Content
Chapter 1 Market Segmentation
- 1.1 Segmentation Framework
- 1.1.1 Product and Service Classification
- 1.1.2 Application and End-Use Classification
- 1.1.3 Technology and Solution Classification
- 1.1.4 Customer and Distribution Channel Classification
- 1.1.5 Geographic Segmentation
- 1.1.6 Market Segment Definitions and Boundaries
- 1.2 By Solution Type
- 1.2.1 Organ and Physiological Twins
- 1.2.2 Hospital Operations Twins
- 1.2.3 Drug Discovery Twins
- 1.2.4 Population Health Twins
- 1.2.5 Medical Device Twins
- 1.3 By Deployment Model
- 1.3.1 Public Cloud
- 1.3.2 Private Cloud
- 1.3.3 On-Premises
- 1.3.4 Hybrid Deployment
- 1.4 By Customer Type
- 1.4.1 Healthcare Providers
- 1.4.2 Pharmaceutical Companies
- 1.4.3 Public Health Agencies
- 1.4.4 Health Insurers
- 1.4.5 Medical Device Manufacturers
- 1.5 By Application
- 1.5.1 Clinical Decision Support
- 1.5.2 Capacity Optimization
- 1.5.3 Research Validation
- 1.5.4 Population Planning
- 1.6 By Country
- 1.6.1 China
- 1.6.2 Japan
- 1.6.3 South Korea
- 1.6.4 India
- 1.6.5 Remaining APAC Markets
Chapter 2 Introduction
- 2.1 Report Objectives and Scope
- 2.2 Product Definition and Industry Terminology
- 2.3 Market Inclusions and Exclusions
- 2.4 Research Process
- 2.4.1 Primary Research and Expert Interviews
- 2.4.2 Secondary Research and Source Review
- 2.4.3 Top-Down and Bottom-Up Estimation
- 2.4.4 Data Triangulation and Verification
- 2.5 Market Size Measurement Basis
- 2.5.1 2025: USD 684.5 million → 2035: USD 19.64 billion
- 2.6 Historical and Forecast Reference Periods
- 2.6.1 Historical Period: 2018-2025
- 2.6.2 Base Year: 2025
- 2.6.3 Forecast Period: 2025-2035
- 2.7 Research Assumptions and Limitations
Chapter 3 Executive Summary
- 3.1 Market Snapshot and Key Findings
- 3.2 Base-Year Market Size, 2025
- 3.3 Forecast Market Size, 2035
- 3.4 Revenue and Volume Growth Outlook
- 3.5 Key Demand and Supply Indicators
- 3.6 Leading Market Segments
- 3.7 Fastest-Growing Market Opportunities
- 3.8 Regional Performance Highlights
- 3.9 Technology and Industry Transformation
- 3.10 Competitive Landscape Summary
- 3.11 Analyst View and Strategic Implications
Chapter 4 APAC Healthcare Digital Twins Market Trends and Developments
- 4.1 Historical Industry Development, 2018-2025
- 4.2 Recent Market Trends and Developments
- 4.3 Demand and Customer Behavior Trends
- 4.4 Technology and Product Innovation
- 4.5 Artificial Intelligence, Automation and Digitalization
- 4.6 Local Manufacturing and Supply Chain Realignment
- 4.7 Industry Partnerships, Mergers and Acquisitions
- 4.8 Sustainability and Circular Economy Developments
- 4.9 Government and Private Sector Investment Trends
- 4.10 Emerging Business Models and Commercialization
- 4.11 Industry Developments and Announcements
Chapter 5 APAC Healthcare Digital Twins Market Production, Supply and Demand Analysis
- 5.1 Demand Trend and Consumption Analysis, 2018-2025
- 5.2 Demand Forecast, 2025-2035
- 5.3 Production and Output Trend, 2018-2025
- 5.4 Production and Output Forecast, 2025-2035
- 5.5 Installed Capacity and Capacity Utilization
- 5.6 Company-Wise Production Plants and Statistics
- 5.6.1 Installed Production Capacity
- 5.6.2 Actual Production
- 5.6.3 Planned Capacity and Expansion Targets
- 5.7 Supply Chain Structure and Procurement Trends
- 5.8 Supply-Demand Gap and Bottlenecks
- 5.9 Import Dependence and Sourcing Structure
- 5.10 Contract Manufacturing and Outsourcing
- 5.11 Regional Supply and Demand Concentration
Chapter 6 APAC Healthcare Digital Twins Market Pricing Analysis
- 6.1 Pricing Structure and Measurement
- 6.2 Historical Pricing Trends, 2018-2025
- 6.3 Pricing Outlook, 2025-2035
- 6.4 Average Selling Price and Unit Economics
- 6.5 Pricing by Product and Market Segment
- 6.6 Geographic Pricing Differences
- 6.7 Key Input, Energy, Labor and Logistics Costs
- 6.8 Contract Pricing and Purchasing Models
- 6.9 Pricing Sensitivity and Competitive Positioning
- 6.10 Price, Margin and Profitability Implications
Chapter 7 APAC Healthcare Digital Twins Market Dynamics
- 7.1 Market Growth Drivers
- 7.1.1 Demand-Side Drivers
- 7.1.2 Technology and Innovation Drivers
- 7.1.3 Infrastructure and Investment Drivers
- 7.1.4 Regulatory and Policy Drivers
- 7.2 Market Restraints
- 7.2.1 Cost and Affordability Constraints
- 7.2.2 Technology and Adoption Barriers
- 7.2.3 Supply Chain and Operational Constraints
- 7.3 Market Challenges
- 7.3.1 Competitive Pressure and Margin Erosion
- 7.3.2 Skills, Infrastructure and Implementation Gaps
- 7.4 Emerging Market Opportunities
- 7.5 Market Dynamics Impact and Time-Horizon Assessment
Chapter 8 APAC Healthcare Digital Twins Value Chain Analysis
- 8.1 Industry Value Chain Overview
- 8.2 Upstream Suppliers and Critical Inputs
- 8.3 Technology and Component Providers
- 8.4 Manufacturing or Service Delivery
- 8.5 Distribution, Channel Partners and Integrators
- 8.6 Downstream Applications and End Users
- 8.7 Value Addition and Profit Pools
- 8.8 Vertical Integration and Outsourcing
- 8.9 Supplier Concentration and Risk
- 8.10 Supply Chain Localization and Resilience
Chapter 9 APAC Healthcare Digital Twins Market Regulations and Policies
- 9.1 Relevant Laws, Standards and Compliance Frameworks
- 9.2 Product, Service, Safety and Quality Requirements
- 9.3 Government Policies, Incentives and Subsidies
- 9.4 Imports, Exports and Trade Barriers
- 9.5 Public Procurement and Local Content Requirements
- 9.6 Environmental and Sustainability Compliance
- 9.7 Upcoming Policy Changes and Market Implications
Chapter 10 APAC Healthcare Digital Twins Market Hotspots and Opportunities
- 10.1 Market Opportunity Mapping and Growth Hotspots
- 10.2 High-Growth Applications and Customer Groups
- 10.3 Underserved Markets and White-Space Opportunities
- 10.4 Emerging Technology and Product Opportunities
- 10.5 New Capacity and Investment Hotspots
- 10.6 Market Entry and Expansion Opportunities
- 10.7 Distribution and Partnership Opportunities
- 10.8 Near-Term and Long-Term Commercial Potential
- 10.9 Opportunity Attractiveness and Execution Risks
Chapter 11 APAC Healthcare Digital Twins Market Outlook, 2025-2035
- 11.1 Market Size and Analysis
- 11.1.1 Revenue (Market Measurement: 2025: USD 684.5 million → 2035: USD 19.64 billion)
- 11.1.2 Market Volume and Quantity Sold
- 11.1.3 Historical Market Size, 2018-2025
- 11.1.4 Base-Year Market Size, 2025
- 11.2 Market Forecast, 2025-2035
- 11.2.1 Revenue Forecast to 2035
- 11.2.2 Volume Forecast to 2035
- 11.2.3 CAGR and Year-on-Year Growth
- 11.2.4 Incremental Revenue Opportunity
- 11.3 Forecast Assumptions and Scenario Analysis
- 11.3.1 Base-Case Forecast
- 11.3.2 Optimistic and Conservative Scenarios
- 11.3.3 Technology, Pricing and Policy Sensitivities
- 11.4 Market Attractiveness and Growth Outlook
Chapter 12 APAC Healthcare Digital Twins Market Segmentation and Outlook
- 12.1 Segmentation Summary and Market Shares, 2025
- 12.2 Largest and Fastest-Growing Segments
- 12.3 By Solution Type - Market Size and Forecast, 2025-2035
- 12.3.1 Segment Definition and Scope
- 12.3.2 Historical Market Size, 2018-2025
- 12.3.3 Revenue Forecast, 2025-2035
- 12.3.4 Volume Forecast, 2025-2035
- 12.3.5 Base-Year Market Share, 2025
- 12.3.6 Segment CAGR and Growth Drivers
- 12.3.7 Subsegment Market Size and Forecast
- 12.3.7.1 Organ and Physiological Twins
- 12.3.7.2 Hospital Operations Twins
- 12.3.7.3 Drug Discovery Twins
- 12.3.7.4 Population Health Twins
- 12.3.7.5 Medical Device Twins
- 12.3.8 Subsegment Pricing and Adoption Trends
- 12.3.9 Leading Suppliers and Competition
- 12.3.10 Regional Demand and Opportunities
- 12.4 By Deployment Model - Market Size and Forecast, 2025-2035
- 12.4.1 Segment Definition and Scope
- 12.4.2 Historical Market Size, 2018-2025
- 12.4.3 Revenue Forecast, 2025-2035
- 12.4.4 Volume Forecast, 2025-2035
- 12.4.5 Base-Year Market Share, 2025
- 12.4.6 Segment CAGR and Growth Drivers
- 12.4.7 Subsegment Market Size and Forecast
- 12.4.7.1 Public Cloud
- 12.4.7.2 Private Cloud
- 12.4.7.3 On-Premises
- 12.4.7.4 Hybrid Deployment
- 12.4.8 Subsegment Pricing and Adoption Trends
- 12.4.9 Leading Suppliers and Competition
- 12.4.10 Regional Demand and Opportunities
- 12.5 By Customer Type - Market Size and Forecast, 2025-2035
- 12.5.1 Segment Definition and Scope
- 12.5.2 Historical Market Size, 2018-2025
- 12.5.3 Revenue Forecast, 2025-2035
- 12.5.4 Volume Forecast, 2025-2035
- 12.5.5 Base-Year Market Share, 2025
- 12.5.6 Segment CAGR and Growth Drivers
- 12.5.7 Subsegment Market Size and Forecast
- 12.5.7.1 Healthcare Providers
- 12.5.7.2 Pharmaceutical Companies
- 12.5.7.3 Public Health Agencies
- 12.5.7.4 Health Insurers
- 12.5.7.5 Medical Device Manufacturers
- 12.5.8 Subsegment Pricing and Adoption Trends
- 12.5.9 Leading Suppliers and Competition
- 12.5.10 Regional Demand and Opportunities
- 12.6 By Application - Market Size and Forecast, 2025-2035
- 12.6.1 Segment Definition and Scope
- 12.6.2 Historical Market Size, 2018-2025
- 12.6.3 Revenue Forecast, 2025-2035
- 12.6.4 Volume Forecast, 2025-2035
- 12.6.5 Base-Year Market Share, 2025
- 12.6.6 Segment CAGR and Growth Drivers
- 12.6.7 Subsegment Market Size and Forecast
- 12.6.7.1 Clinical Decision Support
- 12.6.7.2 Capacity Optimization
- 12.6.7.3 Research Validation
- 12.6.7.4 Population Planning
- 12.6.8 Subsegment Pricing and Adoption Trends
- 12.6.9 Leading Suppliers and Competition
- 12.6.10 Regional Demand and Opportunities
- 12.7 By Country - Market Size and Forecast, 2025-2035
- 12.7.1 Segment Definition and Scope
- 12.7.2 Historical Market Size, 2018-2025
- 12.7.3 Revenue Forecast, 2025-2035
- 12.7.4 Volume Forecast, 2025-2035
- 12.7.5 Base-Year Market Share, 2025
- 12.7.6 Segment CAGR and Growth Drivers
- 12.7.7 Subsegment Market Size and Forecast
- 12.7.7.1 China
- 12.7.7.2 Japan
- 12.7.7.3 South Korea
- 12.7.7.4 India
- 12.7.7.5 Remaining APAC Markets
- 12.7.8 Subsegment Pricing and Adoption Trends
- 12.7.9 Leading Suppliers and Competition
- 12.7.10 Regional Demand and Opportunities
- 12.8 Segment Growth Comparison
- 12.9 Segment Attractiveness and Priority Matrix
Chapter 13 APAC Healthcare Digital Twins End-Use and Application Market Outlook
- 13.1 End-Use Industry and Customer Demand Structure
- 13.2 Leading Applications and Customer Groups
- 13.3 End-Use Market Size, Share and Forecast
- 13.4 Major End-Use Industry Deep Dives
- 13.4.1 Customer Requirements and Use Cases
- 13.4.2 Demand and Replacement Cycles
- 13.4.3 Technical and Regulatory Considerations
- 13.4.4 Purchasing and Procurement Models
- 13.4.5 Leading Vendors and Distribution Channels
- 13.4.6 Forecast and Commercial Opportunities
- 13.5 Emerging Applications and Cross-Segment Demand
- 13.6 End-Use Industry Investment Priorities
Chapter 14 APAC Healthcare Digital Twins Geographic Market Outlook, 2025-2035
- 14.1 Regional Market Size and Country-Level Shares, 2025
- 14.2 Country Market Size Comparison, 2025
- 14.3 Country Market Forecasts, 2025-2035
- 14.4 Subregional Industrial and Demand Clusters
- 14.5 Intra-Regional Pricing and Cost Differences
- 14.6 Cross-Border Trade and Supply Networks
- 14.7 Regional Supply and Demand Balances
- 14.8 Country Opportunity Comparison and Prioritization
Note: Every listed country is covered on the structure shown under the first country.
Chapter 15 APAC Healthcare Digital Twins Technology, Innovation and Sustainability Outlook
- 15.1 Technology Landscape and Maturity
- 15.2 Product, Process and Service Innovation
- 15.3 AI, Automation and Digital Tools in the Industry
- 15.4 Technology Adoption and Performance Benchmarking
- 15.5 Innovation Pipeline and R&D Investment
- 15.6 Patent and Intellectual Property Trends
- 15.7 Energy Efficiency and Resource Management
- 15.8 Sustainability, Recycling and Circularity
- 15.9 Technology Roadmap, 2025-2035
- 15.10 Risks of Obsolescence and Technology Substitution
Chapter 16 APAC Healthcare Digital Twins Market Key Strategic Imperatives
- 16.1 Growth and Market Entry Priorities
- 16.2 High-Return Products and Segments
- 16.3 Pricing, Profitability and Cost Optimization
- 16.4 Technology Investment and Product Differentiation
- 16.5 Supply Chain Localization and Resilience
- 16.6 Distribution and Customer Acquisition
- 16.7 Partnership, Acquisition and Capacity Strategy
- 16.8 Regional Expansion Priorities
- 16.9 Short-, Medium- and Long-Term Actions
Chapter 17 Competition Outlook
- 17.1 Industry Competition Characteristics
- 17.2 Market Structure and Concentration
- 17.3 Market Share and Competitive Positioning, 2025
- 17.4 Company-Wise Revenue and Product Benchmarking
- 17.5 Production and Service Capacity Benchmarking
- 17.6 Technology, Pricing and Differentiation
- 17.7 Regional Footprint and Distribution Strength
- 17.8 Mergers, Acquisitions and Strategic Alliances
- 17.9 New Entrants and Competitive Threats
- 17.10 Porter's Five Forces and Industry Attractiveness
- 17.11 Competitive Outlook, 2025-2035
Chapter 18 Company Profiles
- 18.1 Company Coverage and Selection Criteria
- 18.2 Siemens Healthineers
- 18.2.1 Business Description
- 18.2.2 Company Ownership and Geographic Presence
- 18.2.3 Product and Service Portfolio
- 18.2.4 Manufacturing and Operating Footprint
- 18.2.5 Production Capacity and Expansion Plans
- 18.2.6 Financial Performance and Investment
- 18.2.7 Market Share and Competitive Position
- 18.2.8 Technology and Innovation Capabilities
- 18.2.9 Strategic Alliances or Partnerships
- 18.2.10 Recent Developments
- 18.2.11 Growth Strategy and Outlook
- 18.3 GE HealthCare
- 18.4 Philips
- 18.5 Dassault Systèmes
- 18.6 Mesh Bio
- 18.7 Other Relevant Market Participants
Note: Every listed company is profiled on the structure shown under the first company. The company list is preliminary and may change based on research findings, market developments, data availability and client requirements.
Chapter 19 Disclaimer
- 19.1 Research and Forecast Disclaimer
- 19.2 Data Source and Estimation Limitations
Note: The depth of individual sections depends on data availability for this market. Volume, capacity, trade and other unit-based metrics are included where applicable.

