
Market Overview
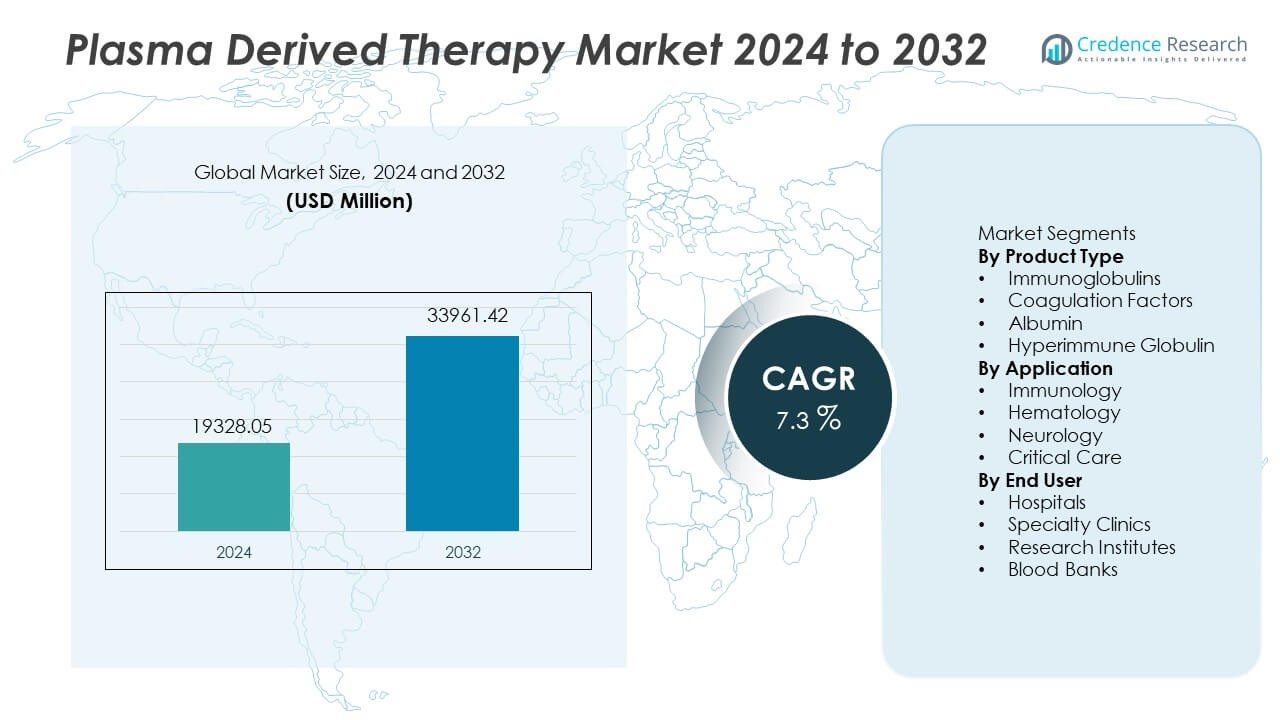
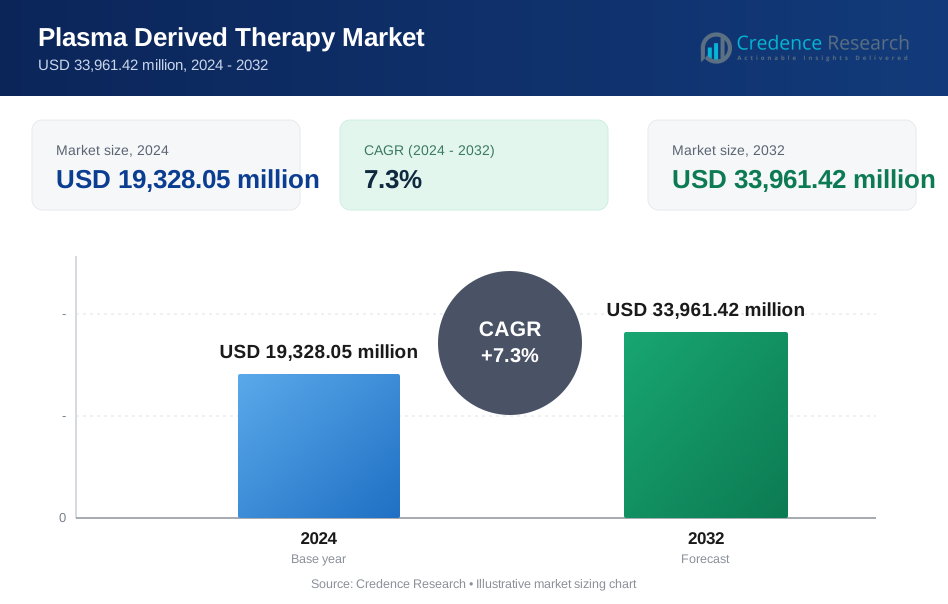
The Plasma Derived Therapy Market was valued at USD 19,328.05 million in 2024 and is projected to reach USD 33,961.42 million by 2032, registering a CAGR of 7.3% during the forecast period.
| REPORT ATTRIBUTE | DETAILS |
|---|---|
| Historical Period | 2020-2023 |
| Base Year | 2024 |
| Forecast Period | 2025-2032 |
| Plasma Derived Therapy Market Size 2024 | USD 19,328.05 Million |
| Plasma Derived Therapy Market, CAGR | 7.3% |
| Plasma Derived Therapy Market Size 2032 | USD 33,961.42 Million |
Top players in the Plasma Derived Therapy market include CSL Behring, Grifols, Takeda Pharmaceutical, Octapharma, Kedrion Biopharma, Bio Products Laboratory, China Biologic Products, LFB Group, Biotest AG, and Sanquin. These companies strengthen their position through plasma collection expansion, improved fractionation processes, and targeted therapies for immunodeficiency, hemophilia, and critical care applications. North America remains the dominant region with a 41% share, supported by advanced plasma collection networks and strong insurance coverage for immunoglobulin therapies. Europe follows with a 29% share, driven by high treatment adoption for immune and hematology disorders, while Asia Pacific continues to grow rapidly through expanding healthcare access and increasing diagnosis rates.
Market Insights
- The Plasma Derived Therapy market reached USD 19,328.05 million in 2024 and will reach USD 33,961.42 million by 2032 at a CAGR of 7.3% during the forecast period.
- Strong demand for immunoglobulins drives market expansion as the product type holds a 48% share supported by rising autoimmune disorders, improved diagnostics, and higher prescribing rates across hospitals and specialty infusion centers.
- Market trends include investment in advanced plasma fractionation, high-purity formulations, and expanded donor programs that improve supply, safety, and clinical performance in immunology and hematology care.
- Competitive activity focuses on expanding plasma collection networks, regulatory compliance, viral inactivation systems, and new treatment indications, while limited donor availability and high production cost remain major restraints for plasma derived therapy providers.
- North America leads regional demand with a 41% share, followed by Europe at 29% and Asia Pacific at 21%, supported by expanding critical care use, strong reimbursement, and rising diagnosis of immune deficiency cases.
 Market Segmentation Analysis:
By Product Type
Immunoglobulins lead this segment with a 48% share, driven by strong demand for treating primary immunodeficiency disorders and autoimmune diseases across major healthcare systems. Rising prevalence of immune-related conditions and greater awareness of antibody-based therapies support rapid uptake in developed markets. Coagulation factors follow due to the growing hemophilia patient pool and improved access to replacement therapies. Albumin usage expands in liver disorders and shock management, while hyperimmune globulin gains traction in rare infections and post-exposure settings. Advancements in plasma fractionation continue to strengthen production capacity and improve availability across regulated markets.
- For instance, Takeda reported scaling Gammagard Liquid production capacity to 7 million grams yearly at its U.S. plasma sites and expanded plasma collection to more than 200 centers worldwide.
By Application
Immunology dominates this segment with a 51% share, supported by increased diagnosis of immune deficiencies and rising prescription rates for autoimmune treatment protocols. Hematology benefits from routine use of coagulation factors for hereditary bleeding disorders and surgical control. Neurology sees growing use of IVIG in neuromuscular and inflammatory neuropathies where antibody modulation delivers clinical benefit. Critical care relies on albumin for shock, burns, and trauma management. Demand rises as therapeutic guidelines expand clinical indications for immunoglobulin and coagulation-based therapies across hospitals and specialty care providers in many regions.
- For instance, Octapharma recorded use of Octagam for chronic inflammatory demyelinating polyneuropathy in a large number of countries worldwide following its regulatory expansion in Europe.
By End User
Hospitals account for a 55% share, driven by broad adoption of plasma-derived therapies in critical care units, hematology departments, and immune disorder treatment centers. Large public and private hospitals manage complex immunology and hemophilia patients that require routine infusion support and close clinical supervision. Specialty clinics follow due to increased outpatient immunoglobulin delivery for chronic autoimmune cases. Research institutes contribute to development and evaluation of next-generation plasma derivatives targeting new indications. Blood banks support plasma collection and supply chain, enabling higher throughput under regulated quality standards. Growing therapy awareness expands treatment access across developed healthcare networks.
Key Growth Drivers
Rising Prevalence of Immune and Autoimmune Disorders
Global incidence of immune deficiency and autoimmune diseases continues to rise, creating sustained demand for plasma derived immunoglobulins. Improved diagnostics and awareness enable early detection of immune dysfunction in many healthcare systems. Clinical guidelines support immunoglobulin use in primary immunodeficiency, chronic inflammatory neuropathies, and autoimmune platelet disorders. Growing adoption in pediatric and geriatric care expands therapeutic volumes. Healthcare providers invest in infusion services that improve treatment access. These factors strengthen market growth across developed and emerging regions with expanding specialty care.
- For instance, CSL Behring expanded Hizentra dosing options by offering various prefilled syringe sizes to support individuals with chronic inflammatory demyelinating polyneuropathy and primary immunodeficiency.
Increasing Demand for Coagulation and Hemophilia Therapies
Hemophilia and rare bleeding disorders require routine factor replacement therapies derived from human plasma. Expanded newborn screening improves early diagnosis and long-term clinical management. Rising use of coagulation factors during major surgeries supports adoption in hospitals. Advanced plasma fractionation technologies improve safety profiles and viral inactivation standards. Patient access programs and improved reimbursement support wider availability of coagulation therapies. These measures drive demand across developed healthcare networks, especially where hereditary bleeding disorders have higher clinical follow-up.
- For instance, Kedrion Biopharma operates a global manufacturing network with multiple plasma fractionation facilities that produce a range of therapies, including treatments for coagulation disorders, immunodeficiencies, and other conditions.
Growth in Critical Care and Surgical Applications
Growing use of albumin and hyperimmune globulin in critical care supports strong adoption across hospitals. Albumin plays a vital role in shock, trauma, burns, and liver failure therapy, which remain common across many regions. Surgical recovery protocols use plasma derivatives for volume replacement and immunomodulation. Investment in hospital intensive care units increases demand for plasma products used in emergency medicine. These therapies support patient stabilization and improve recovery outcomes. Expanded clinical research encourages new indications that strengthen market relevance in acute care and multi-specialty hospitals.
Key Trends and Opportunities
Shift Toward High-Purity and Enhanced Fractionation Technologies
Manufacturers invest in purification, viral inactivation, and chromatographic techniques that improve product safety and clinical performance. High-purity immunoglobulin and albumin products reduce risk of contamination and hypersensitivity. Demand grows for technologies that enable better separation yields and stable supply through advanced fractionation. These improvements expand product availability for expanding immune and hematology conditions. Suppliers focus on regulatory compliance that supports commercial expansion across global markets.
- For instance, Grifols operates a fractionation platform in the Barcelona area designed to process a substantial volume of plasma each year, applying a validated multi-stage purification process, including chromatography steps, for IVIG.
Expansion of Plasma Collection Networks and Donor Programs
Increasing plasma collection centers and donor recruitment programs improve supply security for producers. Regions with strong donor infrastructure support steady volume growth for immunoglobulin and coagulation factor production. Public health initiatives encourage voluntary donation and increase plasma availability for manufacturing. This trend supports long-term sustainability of plasma derived therapies as demand rises globally. Companies invest in donor screening and advanced collection technology to ensure safety and high-quality processing.
- For instance, Biotest AG operates donor centers across Germany and Hungary that together collect more than 450,000 liters of source plasma yearly for IVIG and coagulation products.
Key Challenges
Limited Plasma Supply and Dependency on Donor Availability
Plasma products depend heavily on human donor availability, making the supply chain sensitive to donor participation, regulation, and public health restrictions. Seasonal disease outbreaks or pandemic conditions can disrupt donation cycles. Limited availability increases cost and poses supply constraints for high-demand immunoglobulin and coagulation products. Manufacturers face challenges in scaling output without sufficient donor pools.
Stringent Regulatory Framework and High Production Cost
Plasma fractionation requires complex purification and viral inactivation processes that increase manufacturing cost. Regulatory pathways demand strict compliance, safety validation, and extensive quality standards for clinical use. These requirements extend approval timelines and raise operational expense. Smaller producers find it difficult to enter the market due to high capital needs and regulatory investment.
Regional Analysis
North America
North America holds a 41% share, supported by strong plasma collection infrastructure and high treatment adoption for immunodeficiency, hemophilia, and autoimmune disorders. The United States leads usage due to advanced specialty infusion services and broad reimbursement coverage. Large plasma collection networks ensure supply stability for fractionation companies that operate globally. Hospitals and specialty clinics rely on immunoglobulins and coagulation factors for routine patient management. Canada and the US continue expanding critical care use of albumin and hyperimmune products. Strong clinical guidelines and advanced regulatory frameworks support long-term consumption across major healthcare systems.
Europe
Europe accounts for a 29% share, driven by strong healthcare systems in Germany, France, Italy, and the United Kingdom. High treatment adoption for chronic immune disorders and rare bleeding diseases drives sustained demand for immunoglobulins and coagulation factors. Public health authorities promote plasma donation and advanced fractionation for self-sufficiency. Hospitals integrate albumin and hyperimmune products in critical care and surgical protocols. Ongoing investment in research encourages wider clinical use of plasma derived therapies across neurology and hematology. Compliance with quality and safety standards strengthens product uptake and regulatory approval for expanded indications.
Asia Pacific
Asia Pacific holds a 21% share, supported by rising prevalence of immune disorders and increasing access to blood products in China, Japan, South Korea, and India. Expanding healthcare expenditure and improved diagnosis drive strong growth for immunoglobulin and coagulation therapy. Local plasma collection capacity continues to develop, supported by donor programs and public health initiatives. Hospitals increase dependence on albumin for critical care and liver diseases. Growing investment in specialty care and rising insurance coverage support long-term adoption. Asia Pacific remains a high-growth region due to unmet clinical needs and expanding patient awareness.
Latin America
Latin America represents a 6% share, driven by gradual adoption of immunoglobulin and coagulation products across Brazil, Mexico, and Argentina. Hospitals rely on imported plasma derivatives due to limited local fractionation capacity. Rising healthcare access supports immunology and hematology treatment in major urban centers. Governments increase support for rare disease management, expanding patient access. Critical care units adopt albumin in trauma and emergency treatment. Market expansion remains moderate due to economic constraints, but improving healthcare infrastructure strengthens demand.
Middle East and Africa
Middle East and Africa account for a 3% share, driven by growing hospital investments and increased treatment capacity for immune and hematology disorders in Gulf countries. Import-based supply supports demand in Saudi Arabia, UAE, and Qatar, where specialty care expands rapidly. Albumin and immunoglobulin use rises in tertiary hospitals and critical care units. Limited plasma collection capabilities and regulatory gaps restrain wider availability across Africa. Gradual improvement in healthcare infrastructure and international supply partnerships support long-term growth across major markets.
Market Segmentations:
By Product Type
- Immunoglobulins
- Coagulation Factors
- Albumin
- Hyperimmune Globulin
By Application
- Immunology
- Hematology
- Neurology
- Critical Care
By End User
- Hospitals
- Specialty Clinics
- Research Institutes
- Blood Banks
By Geography
- North America
- U.S.
- Canada
- Mexico
- Europe
- Germany
- France
- U.K.
- Italy
- Spain
- Rest of Europe
- Asia Pacific
- China
- Japan
- India
- South Korea
- South-east Asia
- Rest of Asia Pacific
- Latin America
- Brazil
- Argentina
- Rest of Latin America
- Middle East & Africa
- GCC Countries
- South Africa
- Rest of the Middle East and Africa
Competitive Landscape
Competitive landscape in the Plasma Derived Therapy market features major companies such as CSL Behring, Grifols, Takeda Pharmaceutical, Octapharma, Kedrion Biopharma, Bio Products Laboratory, China Biologic Products, LFB Group, Biotest AG, and Sanquin. Leading manufacturers expand plasma collection capacity and invest in advanced fractionation technologies to secure supply and improve product purity across immunoglobulin, coagulation factors, and albumin therapies. Companies focus on viral inactivation, chromatographic purification, and regulatory compliance to enhance clinical safety profiles while supporting wider adoption in immunology and critical care. Strong emphasis on hemophilia and rare disease therapies drives strategic partnerships, licensing agreements, and geographic expansion into high-growth markets in Asia Pacific and Latin America. Several players invest in donor recruitment, screening systems, and specialized collection infrastructure to meet rising global demand, while strict regulatory requirements shape product development, approval timelines, and pricing strategies across regions.
Key Player Analysis
- CSL Behring
- Grifols
- Takeda Pharmaceutical
- Octapharma
- Kedrion Biopharma
- Bio Products Laboratory
- China Biologic Products
- LFB Group
- Biotest AG
- Sanquin
Recent Developments
- In October 2025, CSL Behring signed a Letter of Intent with the pan‑Canadian Pharmaceutical Alliance (pCPA) for public reimbursement of HEMGENIX (gene therapy for Hemophilia B).
- In April 2025, CSL Behring launched ANDEMBRY for prevention of acute attacks in hereditary angioedema in Japan.
Report Coverage
The research report offers an in-depth analysis based on Product Type, Application, End User and Geography. It details leading market players, providing an overview of their business, product offerings, investments, revenue streams, and key applications. Additionally, the report includes insights into the competitive environment, SWOT analysis, current market trends, as well as the primary drivers and constraints. Furthermore, it discusses various factors that have driven market expansion in recent years. The report also explores market dynamics, regulatory scenarios, and technological advancements that are shaping the industry. It assesses the impact of external factors and global economic changes on market growth. Lastly, it provides strategic recommendations for new entrants and established companies to navigate the complexities of the market.
Future Outlook
- Future demand will rise as immune disorders continue to grow worldwide.
- Immunoglobulin use will expand in chronic autoimmune and inflammatory diseases.
- Coagulation factor therapy will increase due to improved hemophilia diagnosis.
- Albumin consumption will grow in critical care and liver failure management.
- Hyperimmune globulin applications will widen in infection prevention and treatment.
- Plasma collection networks will expand in developed and emerging markets.
- High-purity and advanced fractionation processes will improve safety standards.
- Research will develop new clinical indications and specialty formulations.
- Regional access programs will improve patient availability in developing regions.
- Rising cost pressure will drive efficiency and supply chain optimization.
Request a Free Sample
Fill in your details and we'll send you a free sample report.
- Sample data tables & charts
- Research methodology
Need a Custom Version of This Report?
Tailor the scope, geography, or segments to your exact requirements.
- Custom geography or segment scope
- Direct access to our analyst team
Frequently Asked Questions
What is the current market size for the Plasma Derived Therapy market, and what is its projected size in 2032?
At what Compound Annual Growth Rate is the Plasma Derived Therapy market projected to grow between 2024 and 2032?
Which Plasma Derived Therapy market segment held the largest share in 2024?
What are the primary factors fueling the growth of the Plasma Derived Therapy market?
Who are the leading companies in the Plasma Derived Therapy market?
Which region commanded the largest share of the Plasma Derived Therapy market in 2024?
Table of Content
Chapter 1. Report Introduction
- 1.1 Report Description & Purpose
- 1.1.1 Report Title & Market Definition
- 1.1.2 Unique Selling Propositions (USP) & Key Differentiators
- 1.1.3 Value Proposition for Stakeholders
- 1.2 Research Objectives
- 1.2.1 Market Sizing Objectives (Volume & Revenue)
- 1.2.2 Segmentation Objectives
- 1.2.3 Competitive Intelligence Objectives
- 1.2.4 Forecast & Scenario Objectives
- 1.3 Report Scope
- 1.3.1 Plasma Derived Therapy Scope – Types & Subtypes Covered
- 1.3.2 Geographic Scope – Regions & Countries Covered
- 1.3.3 Historical Period, Base Year & Forecast Period (2024; forecast to 2032)
- 1.3.4 Inclusions & Exclusions
- 1.4 HS Code & Classification Framework
- 1.5 Currency, Units & Pricing Basis
- 1.6 Target Stakeholders
- 1.7 Limitations & Assumptions
Chapter 2. Executive Summary
- 2.1 Global Plasma Derived Therapy Market Snapshot
- 2.1.1 Market Size – Historical (2024) & Forecast (2024-2032) (2024: USD 19,328.05 million → 2032: USD 33,961.42 million)
- 2.1.2 Volume & Revenue – Global Totals
- 2.1.3 Key Market Highlights – Top Five Facts
- 2.2 Plasma Derived Therapy Market Segmentation Snapshot
- 2.2.1 Market Split by Region – 2024 vs. 2032
- 2.3 Competitive Snapshot
- 2.3.1 Top 10 Players by Revenue Share – 2024
- 2.3.2 Top 10 Players by Volume Share – 2024
- 2.3.3 Recent Strategic Developments (18-Month Summary)
- 2.4 Key Investment Highlights & Strategic Conclusions
Chapter 3. Plasma Derived Therapy Market Dynamics & Industry Analysis
- 3.1 Market Overview & Context
- 3.1.1 Plasma Derived Therapy Market Position in the Broader Automotive Value Chain
- 3.1.2 OEM vs. Replacement Market Dynamics
- 3.1.3 Market Maturity & Development Stage by Region
- 3.2 Plasma Derived Therapy Market Drivers
- 3.3 Plasma Derived Therapy Market Restraints & Challenges
- 3.4 Plasma Derived Therapy Market Opportunities
- 3.5 Porter's Five Forces Analysis
- 3.5.1 Threat of New Entrants
- 3.5.2 Bargaining Power of Suppliers
- 3.5.3 Bargaining Power of Buyers
- 3.5.4 Threat of Substitutes
- 3.5.5 Competitive Rivalry – Intensity Assessment
- 3.6 Plasma Derived Therapy Value Chain Analysis
- 3.6.1 Upstream – Raw Material/Input Suppliers
- 3.6.1.1 Raw Material/Input 1
- 3.6.1.2 Raw Material/Input 2
- 3.6.1.3 Raw Material/Input 3
- 3.6.2 Midstream – Production/Manufacturing/Service Delivery
- 3.6.2.1 Production/Process Overview
- 3.6.2.2 Key Facility Locations & Capacity by Manufacturer
- 3.6.3 Downstream – Distribution & End Consumer
- 3.6.3.1 Primary Channel – B2B/OEM
- 3.6.3.2 Secondary Channels – Dealer, Retail, Online, Direct
- 3.6.4 Value Chain Profitability Analysis
- 3.6.1 Upstream – Raw Material/Input Suppliers
- 3.7 PESTEL Analysis
- 3.7.1 Political Factors
- 3.7.2 Economic Factors
- 3.7.3 Social Factors
- 3.7.4 Technological Factors
- 3.7.5 Environmental Factors
- 3.7.6 Legal Factors
- 3.8 Plasma Derived Therapy Supply Chain Analysis
- 3.8.1 Raw Material/Input Supply Risk Assessment
- 3.8.2 Manufacturing Concentration Risk (Geographic Exposure)
- 3.8.3 Trade Disruption Impact Analysis
- 3.9 Regulatory & Policy Landscape
Note: The regulatory and policy landscape section covers regulations based on their applicability to the market, Plasma Derived Therapy category, geography, and scope of the study. Only regulatory frameworks with a material impact on operations, compliance, trade, sustainability, or market access are analyzed in detail.
Chapter 4. Key Investment Pockets & Opportunity Analysis
- 4.1 Plasma Derived Therapy Market Attractiveness Analysis
- 4.1.1 By Region – Investment Attractiveness Matrix (Volume × CAGR)
- 4.2 Absolute Revenue Growth Opportunity
- 4.2.1 By Region – Absolute USD Growth Through 2032
- 4.3 Incremental Volume Opportunity
- 4.3.1 By Region – Incremental Volume Through 2032
- 4.3.2 Segment – Incremental Volume
- 4.4 Emerging Submarket Opportunity Deep Dive (Subject to Applicability)
- 4.5 Emerging Market Opportunity Scorecards
- 4.5.1 United States
- 4.5.2 Europe
- 4.5.3 Asia
- 4.5.4 Middle East & Africa
Note: Emerging Market Opportunity Scorecards will be included based on relevance and strategic importance. Regions listed are indicative and may vary depending on data availability and market dynamics.
Chapter 5. Plasma Derived Therapy Import-Export Analysis & Trade Flows
- 5.1 Global Trade Overview
- 5.1.1 Global Export Value by Country (2024)
- 5.1.2 Global Export Volume by Country (2024)
- 5.1.3 Global Import Value by Country (2024)
- 5.1.4 Global Import Volume by Country (2024)
- 5.1.5 Net Trade Balance by Country (2024)
- 5.2 Export Analysis – Segment
- 5.2.1 Type 1 (HS Code)
- 5.2.2 Type 2 (HS Code)
- 5.2.3 Type 3 (HS Code)
- 5.2.4 Type 4 (HS Code)
- 5.2.5 Type 5 (HS Code)
- 5.3 Import Analysis – Segment
- 5.3.1 Type 1 (HS Code)
- 5.3.2 Type 2 (HS Code)
- 5.3.3 Type 3 (HS Code)
- 5.3.4 Type 4 (HS Code)
- 5.3.5 Type 5 (HS Code)
- 5.4 Average Unit Trade Prices
- 5.4.1 Average Export Price – Segment & Country
- 5.4.2 Average Import Price – Segment & Source Country
- 5.4.3 Price Trends (2024)
- 5.5 Key Trade Route Analysis
- 5.5.1 Trade Route 1
- 5.5.2 Trade Route 2
- 5.5.3 Trade Route 3
- 5.5.4 Trade Route 4
- 5.5.5 Trade Route 5
- 5.6 Trade Policy Impact Assessment
- 5.6.1 US Anti-Dumping & Section 301 Tariffs
- 5.6.2 EU Customs Union Impact
- 5.6.3 Major Free Trade Agreements
- 5.6.4 USMCA Rules of Origin
Note: Trade policy analysis will be included only where relevant to the Plasma Derived Therapy market.
Chapter 6. Competitive Landscape & Company Benchmarking
- 6.1 Plasma Derived Therapy Market Concentration & Structure
- 6.1.1 Herfindahl-Hirschman Index (HHI) – vs. 2024
- 6.1.2 Tier 1, Tier 2 & Tier 3 Market Structure
- 6.1.3 Global, Regional & Local Player Dynamics
- 6.2 Plasma Derived Therapy Market Share Analysis – 2024
- 6.2.1 Global Revenue Share by Company
- 6.2.2 Global Volume Share by Company
- 6.2.3 Regional Revenue Share
- 6.2.4 Market Share Evolution ( vs. 2024)
- 6.2.5 OEM Segment Share by Company
- 6.2.6 Replacement Segment Share by Company
- 6.3 Production/Delivery Capacity & Facility Analysis
- 6.3.1 Global Installed Capacity
- 6.3.2 Capacity Utilization Rates
- 6.3.3 Production/Output Volume
- 6.3.4 Facility Locations & Capacity Map
- 6.3.5 Planned Capacity Additions
- 6.4 Plasma Derived Therapy Competitive Benchmarking Matrix
- 6.4.1 Revenue, Volume, CAGR & Profitability Comparison
- 6.4.2 Channel Revenue Mix
- 6.4.3 Geographic Revenue Exposure
- 6.4.4 R&D Intensity
- 6.4.5 Sustainability Maturity
- 6.5 Strategic Developments in Plasma Derived Therapy (Last 24 Months)
- 6.5.1 Mergers, Acquisitions & Divestments
- 6.5.2 New Plasma Derived Therapy Launches
- 6.5.3 Facility Expansions
- 6.5.4 Strategic Alliances, Joint Ventures & Partnerships
- 6.5.5 Distribution Expansion & Market Entry
- 6.5.6 Sustainability & ESG Initiatives
- 6.6 Competitive Strategy Mapping
- 6.6.1 Leader, Challenger, Follower & Niche Classification
- 6.6.2 Pricing Strategy Comparison
- 6.6.3 Channel Strategy Matrix
Note: Strategic developments are included based on their materiality and the availability of reliable information.
Chapter 7. Global Plasma Derived Therapy Market – By Distribution Channel
- 7.1 Segment Overview
- 7.1.1 Volume & Revenue Split by Channel (2024 & 2032)
- 7.1.2 Channel Mix Evolution (2024-2032)
Chapter 8. Regional Market Analysis – Global Overview
- 8.1 Global Regional Overview
- 8.1.1 Regional Volume Share
- 8.1.2 Regional Revenue Share
- 8.1.3 Regional Volume by Region
- 8.1.4 Regional Revenue by Region
- 8.1.5 Regional Forecast Through 2032
- 8.2 Cross-Regional Segment Analysis
- 8.2.1 By Distribution Channel
- 8.2.2 By Brand/Price Tier
Chapter 9. North America Plasma Derived Therapy Market
- 9.1 United States
- 9.2 Canada
- 9.3 Mexico
Chapter 10. Europe Plasma Derived Therapy Market
- 10.1 Germany
- 10.2 France
- 10.3 Italy
- 10.4 United Kingdom
- 10.5 Spain
- 10.6 Poland
- 10.7 Russia
- 10.8 Netherlands
- 10.9 Belgium
- 10.10 Sweden
- 10.11 Denmark
- 10.12 Norway
- 10.13 Rest of Europe
Chapter 11. Asia Pacific Plasma Derived Therapy Market
- 11.1 China
- 11.2 India
- 11.3 Japan
- 11.4 South Korea
- 11.5 Thailand
- 11.6 Indonesia
- 11.7 Vietnam
- 11.8 Malaysia
- 11.9 Australia
- 11.10 Rest of Asia Pacific
Chapter 12. Latin America Plasma Derived Therapy Market
- 12.1 Brazil
- 12.2 Argentina
- 12.3 Colombia
- 12.4 Chile
- 12.5 Rest of Latin America
Chapter 13. Middle East Plasma Derived Therapy Market
- 13.1 Saudi Arabia
- 13.2 United Arab Emirates
- 13.3 Turkey
- 13.4 Israel
- 13.5 Iran
- 13.6 Rest of the Middle East
Chapter 14. Africa Plasma Derived Therapy Market
- 14.1 South Africa
- 14.2 Egypt
- 14.3 Nigeria
- 14.4 Morocco
- 14.5 Rest of Africa
Chapter 15. Plasma Derived Therapy Company Profiles
- 15.1 [Company 01]
- 15.1.1 Company Overview
- 15.1.2 Key Management Personnel
- 15.1.3 Products & Services Portfolio
- 15.1.4 Financial Performance
- 15.1.5 Key Market Focus & Geographic Presence
- 15.1.6 Recent Developments & Strategic Initiatives
Note: The company profile list is preliminary and may change based on research findings, market developments, data availability, and client requirements.
Chapter 16. Appendices
- Appendix A – List of Abbreviations & Acronyms
- Appendix B – Industry Classification Code Reference – Full Series
- Appendix C – Production & Capacity Data Tables
- Appendix D – End-Use & Demand Base Tables
- Appendix E – Consumption & Replacement Rate Assumptions
- Appendix F – ASP Reference Tables
- Appendix G – Manufacturing & Facility Database
- Appendix H – Import-Export Data Tables
- Appendix I – Regulatory Summary Tables
- Appendix J – Primary Research Participant List (Anonymized)
- Appendix K – Primary Research Questionnaire Framework
- Appendix L – Data Sources & Bibliography
- Appendix M – Market Size Divergence & Source Comparison
Chapter 17. Research Methodology
- 17.1 Research Framework & Philosophy
- 17.2 Secondary Research – Sources, Hierarchy & Data Extraction
- 17.3 Data Modeling – Bottom-Up & Top-Down Market Sizing
- 17.4 Primary Research – Stakeholder Framework, LOI & Sample Sizes
- 17.5 Forecast Methodology – Regression, Scenario & Sensitivity Analysis
- 17.6 Quality Control – Four-Layer Validation Framework
- 17.7 Limitations & Standard Assumptions
- 17.8 Disclaimer
