
Rare disease medicines move into the pharma mainstream
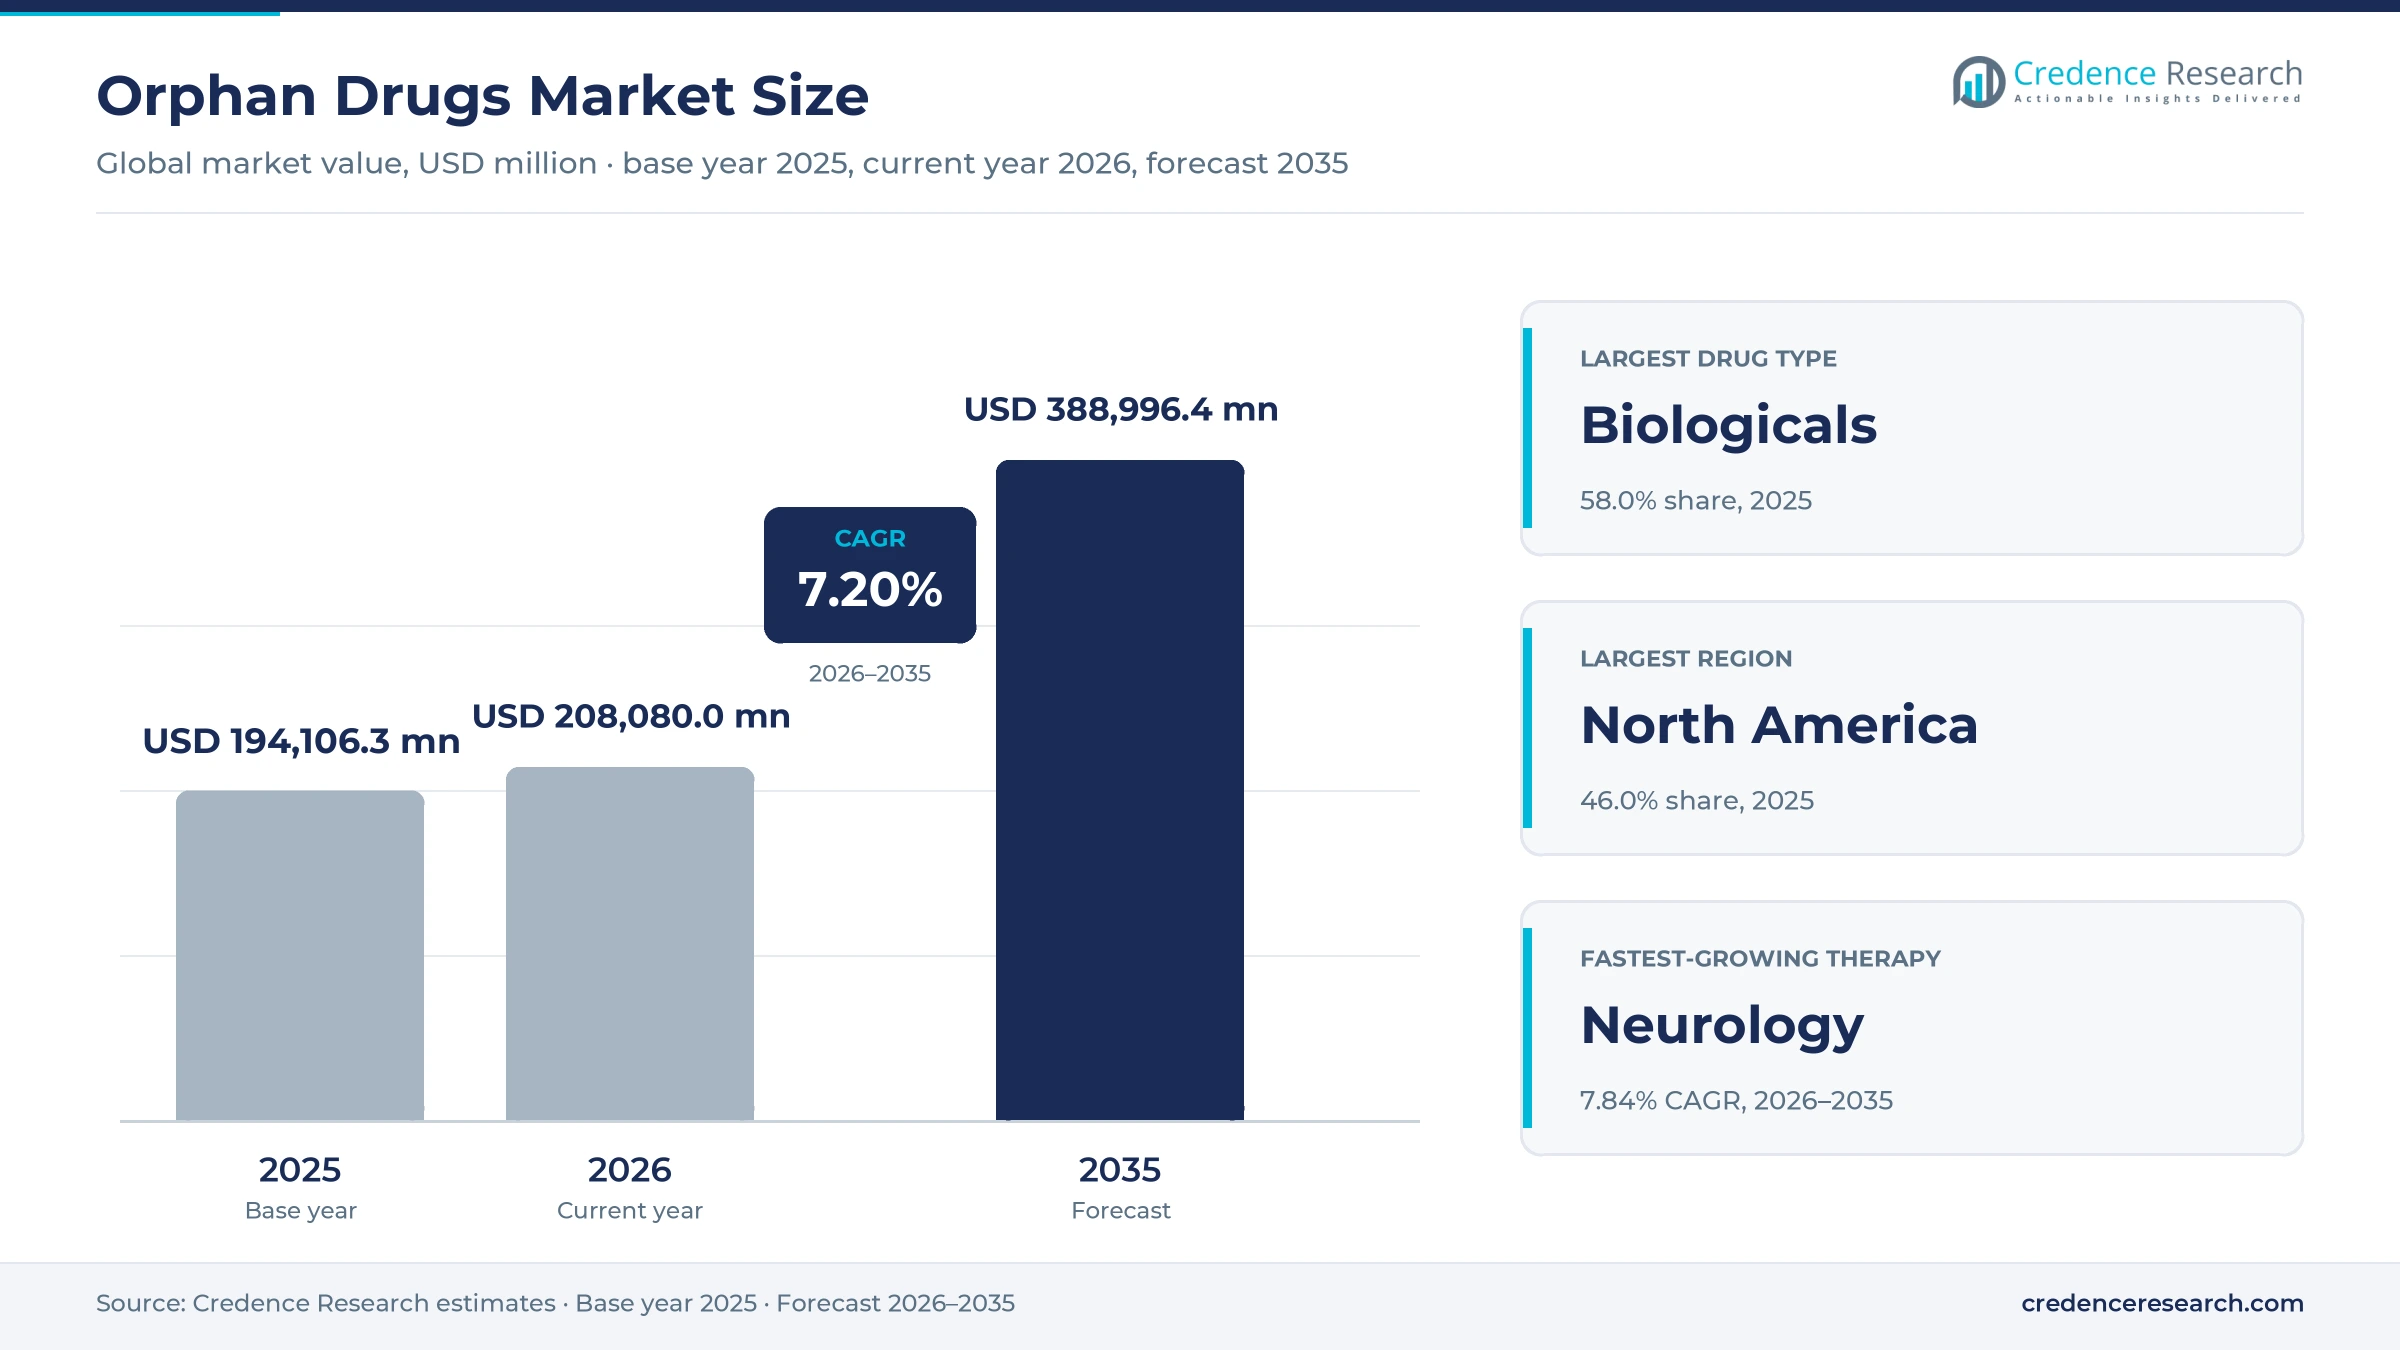
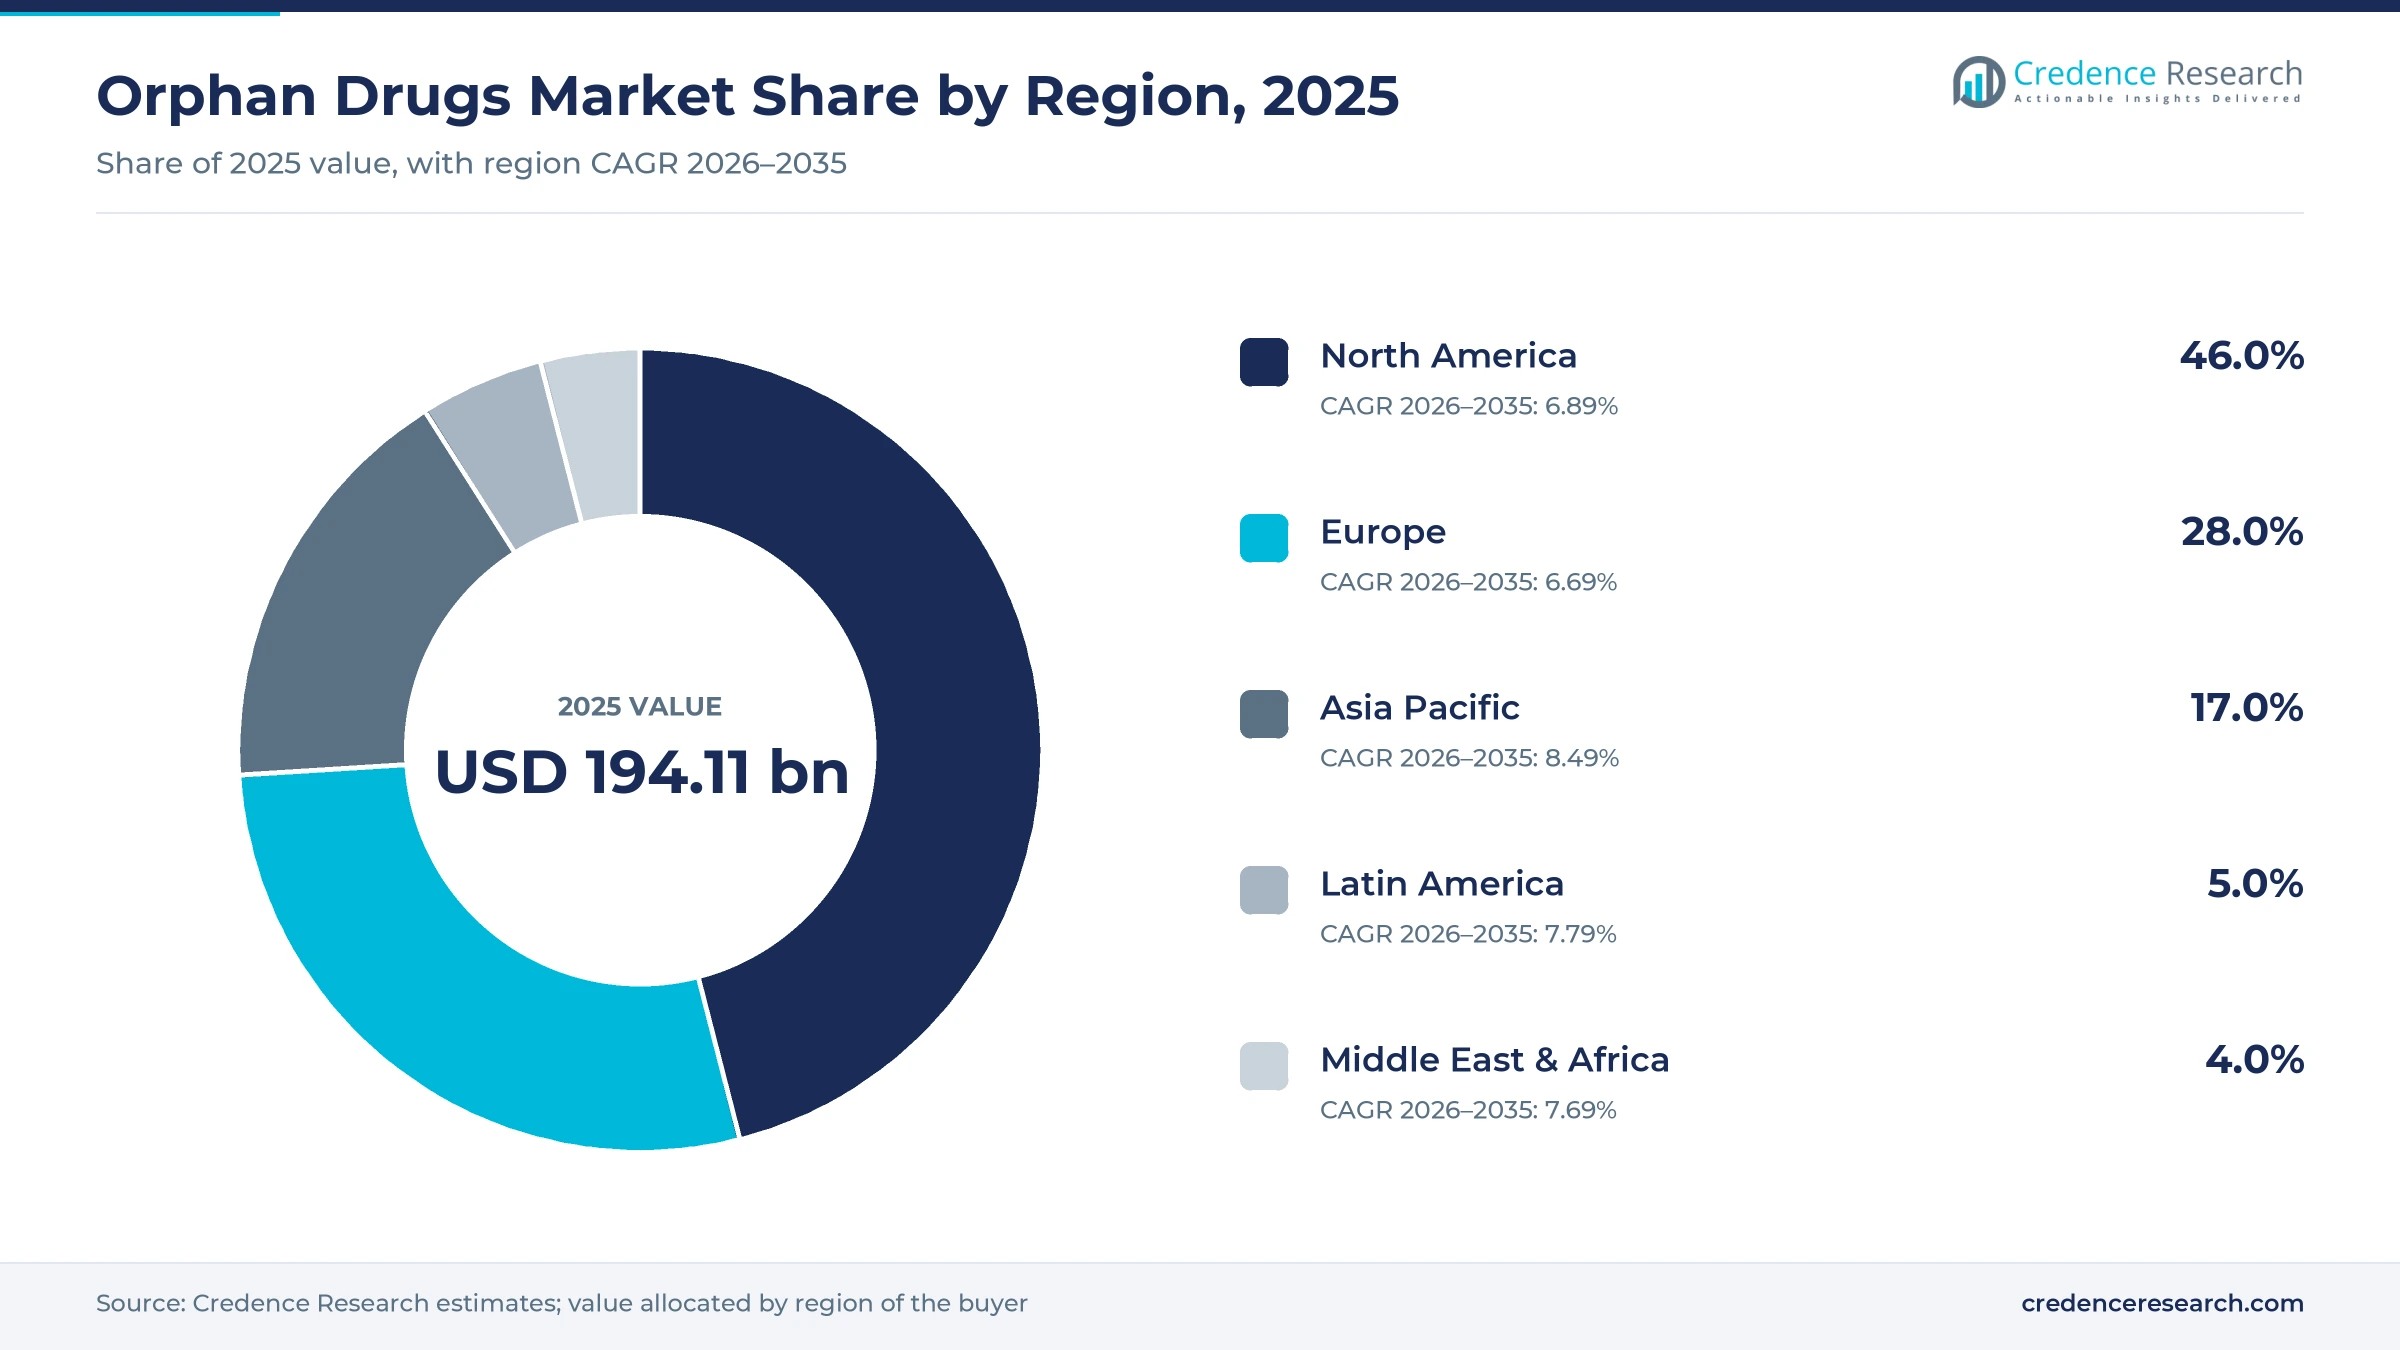
The global orphan drugs market was valued at USD 194.11 billion in 2025 and is projected to increase from USD 208.08 billion in 2026 to USD 389.00 billion by 2035, registering a CAGR of 7.20% during 2026–2035. Demand comes from thousands of rare conditions that still lack any approved treatment, a steady flow of new regulatory approvals and pricing that reflects small patient groups and high development cost. North America held the largest regional share, 46.0% in 2025, because U.S. incentives, payer coverage and specialty distribution support early launches. Asia Pacific is the fastest-growing region at 8.49% a year, as Japan, China and Australia widen rare disease programs and approvals. The regulatory picture changed in September 2025, when the U.S. regulator set out principles that let a single well-controlled study with strong confirmatory evidence support approval for very small genetic diseases. As a result, developers of ultra-rare therapies gained a clearer route to market.
Which rare disease medicines does this analysis count?
The analysis counts prescription medicines approved for rare diseases, including biologicals such as antibodies, enzymes and gene-based therapies, and non-biological small molecules and oligonucleotides. Values are based on manufacturer net selling prices across hospital, retail and online pharmacy channels.
Diagnostics, medical foods, supportive care and unapproved compassionate use supplies sit outside the scope of this analysis. The value chain runs from discovery biotechs and large drugmakers through contract manufacturers and specialty distributors to hospitals, specialty pharmacies, payers and patient support programs.
Orphan Drugs Market Insights
- The orphan drugs market grows from USD 194.11 billion in 2025 to USD 389.00 billion by 2035, a 7.20% CAGR as rare disease approvals keep rising.
- North America held 46.0% of global rare disease medicine value in 2025, supported by U.S. incentives and specialty pharmacy networks.
- Biologicals led drug types with 58.0% of 2025 value, while oncology led therapy areas with 38.0% as cancer subgroups qualify as rare.
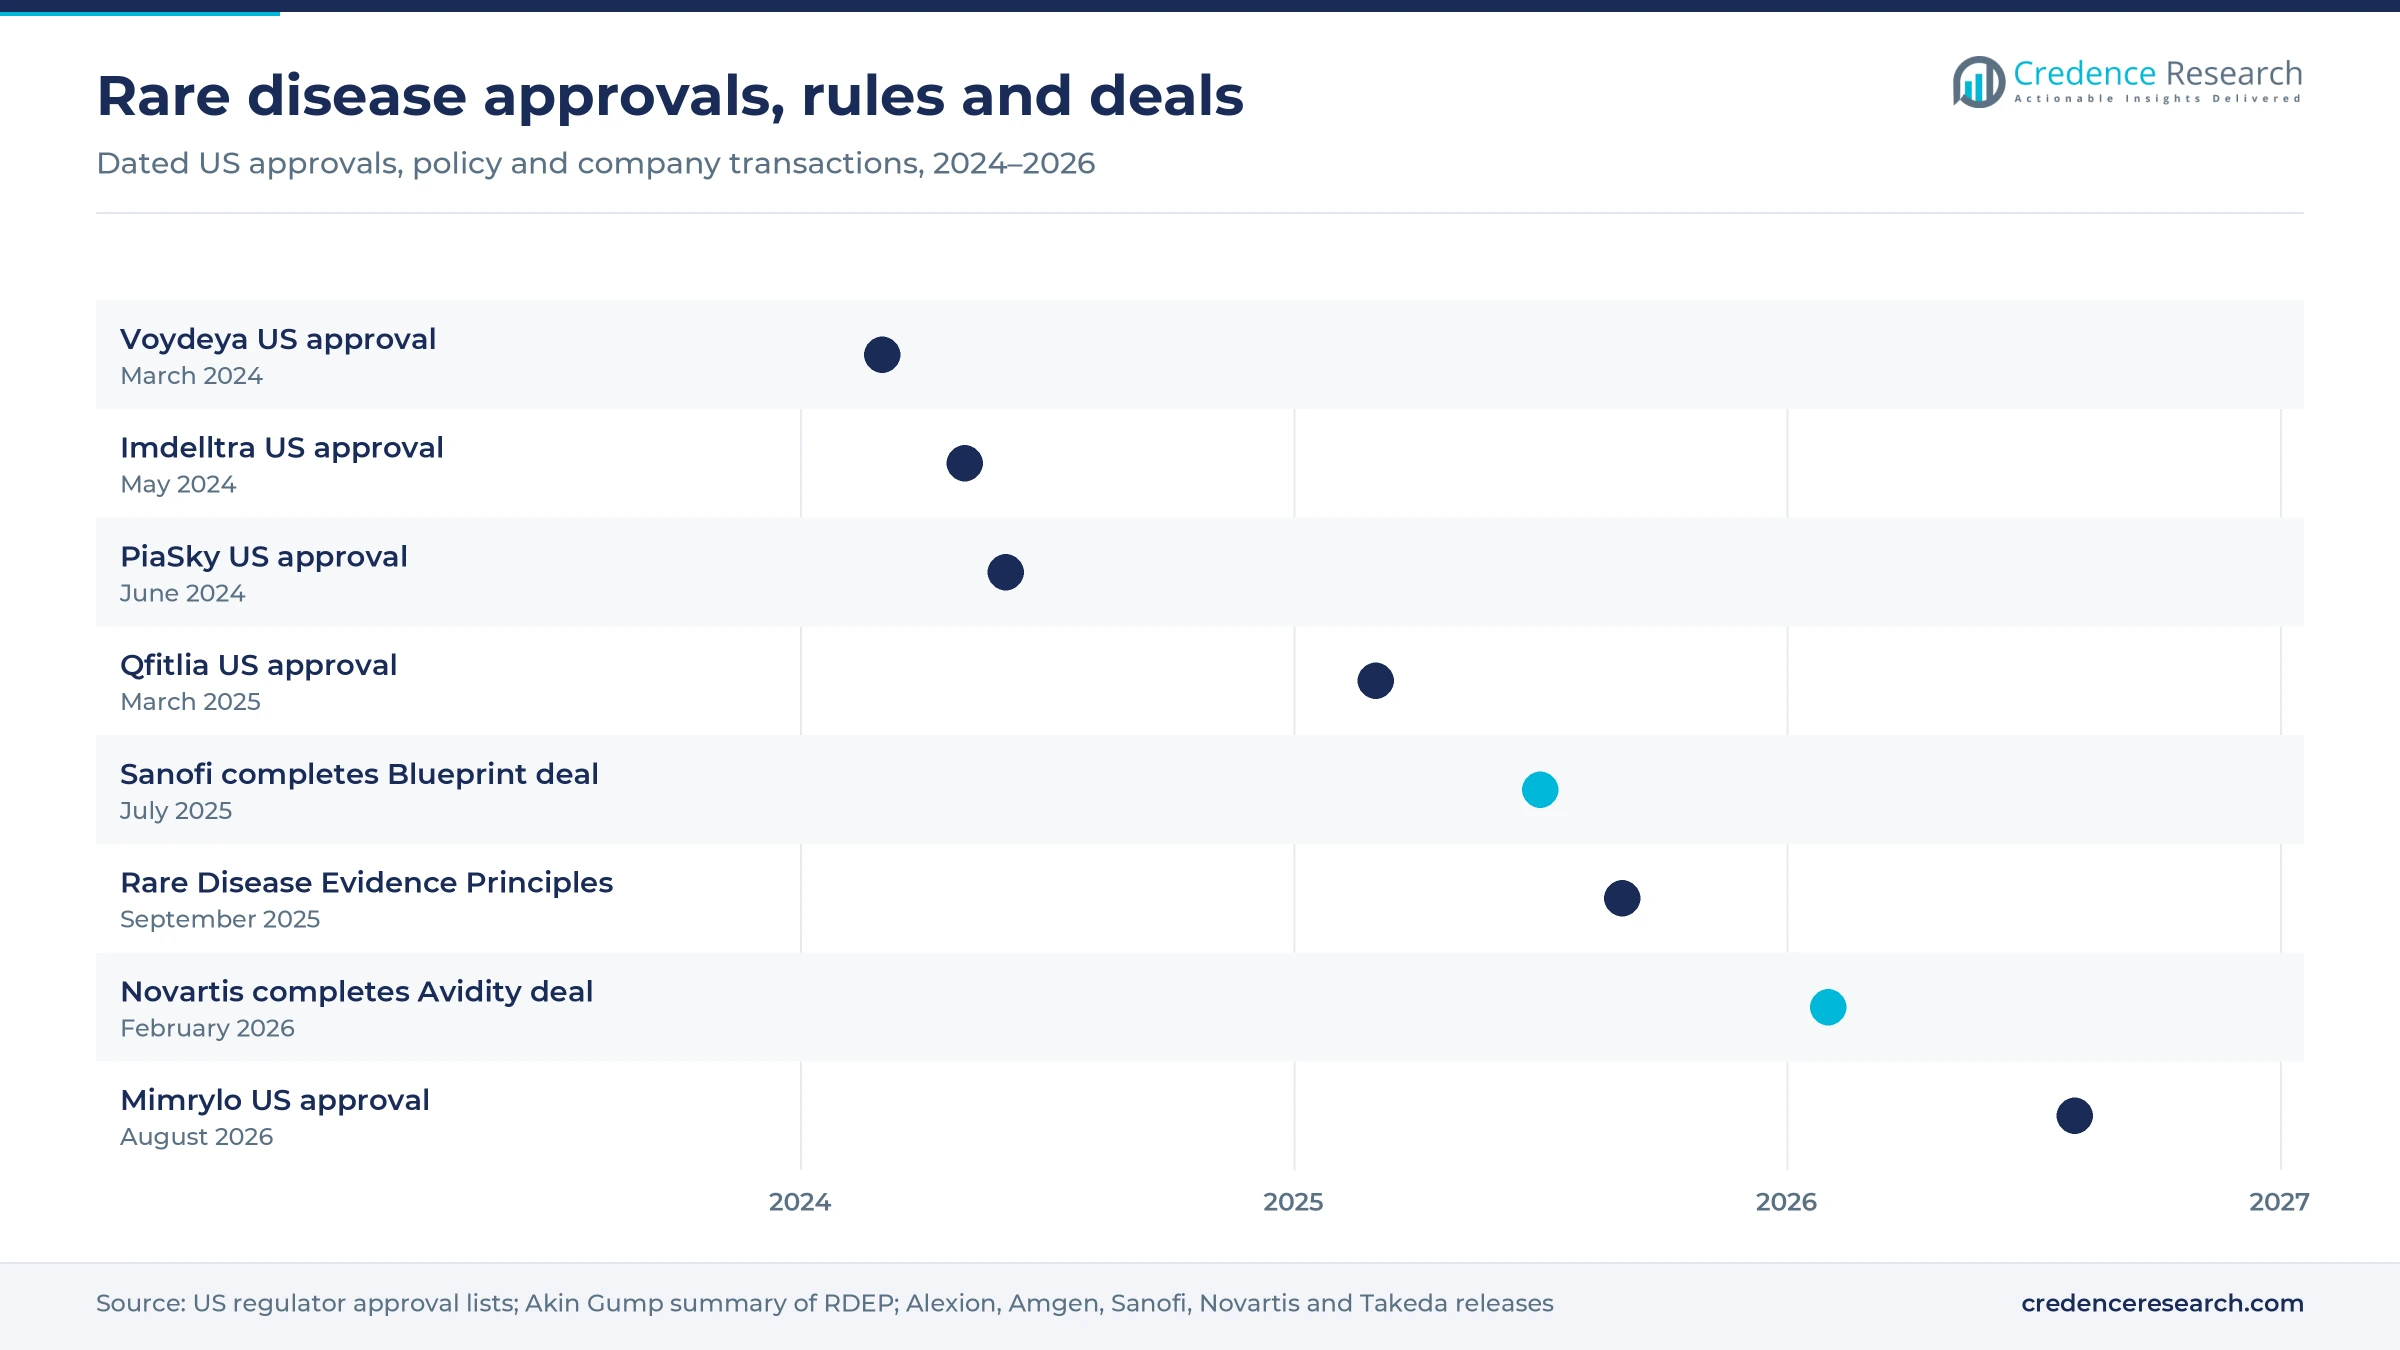
- In September 2025, the FDA announced Rare Disease Evidence Principles for very small genetic diseases with significant unmet need.
- In February 2026, Novartis completed its acquisition of Avidity Biosciences, adding late-stage medicines for genetic neuromuscular diseases to its neuroscience pipeline.
Biologicals and oncology lead rare disease spending
Why do biologicals lead rare disease spending?
Based on drug type, the market is categorized into biologicals and non-biologicals. Biologicals led with a 58.0% share of 2025 value and also grow fastest at 7.57% a year. This position reflects the high price of antibodies, enzyme therapies and gene therapies used in inherited conditions. Non-biologicals still matter, because oral small molecules and RNA medicines reach many genetic and oncology indications.
Why does neurology grow fastest among therapy areas?
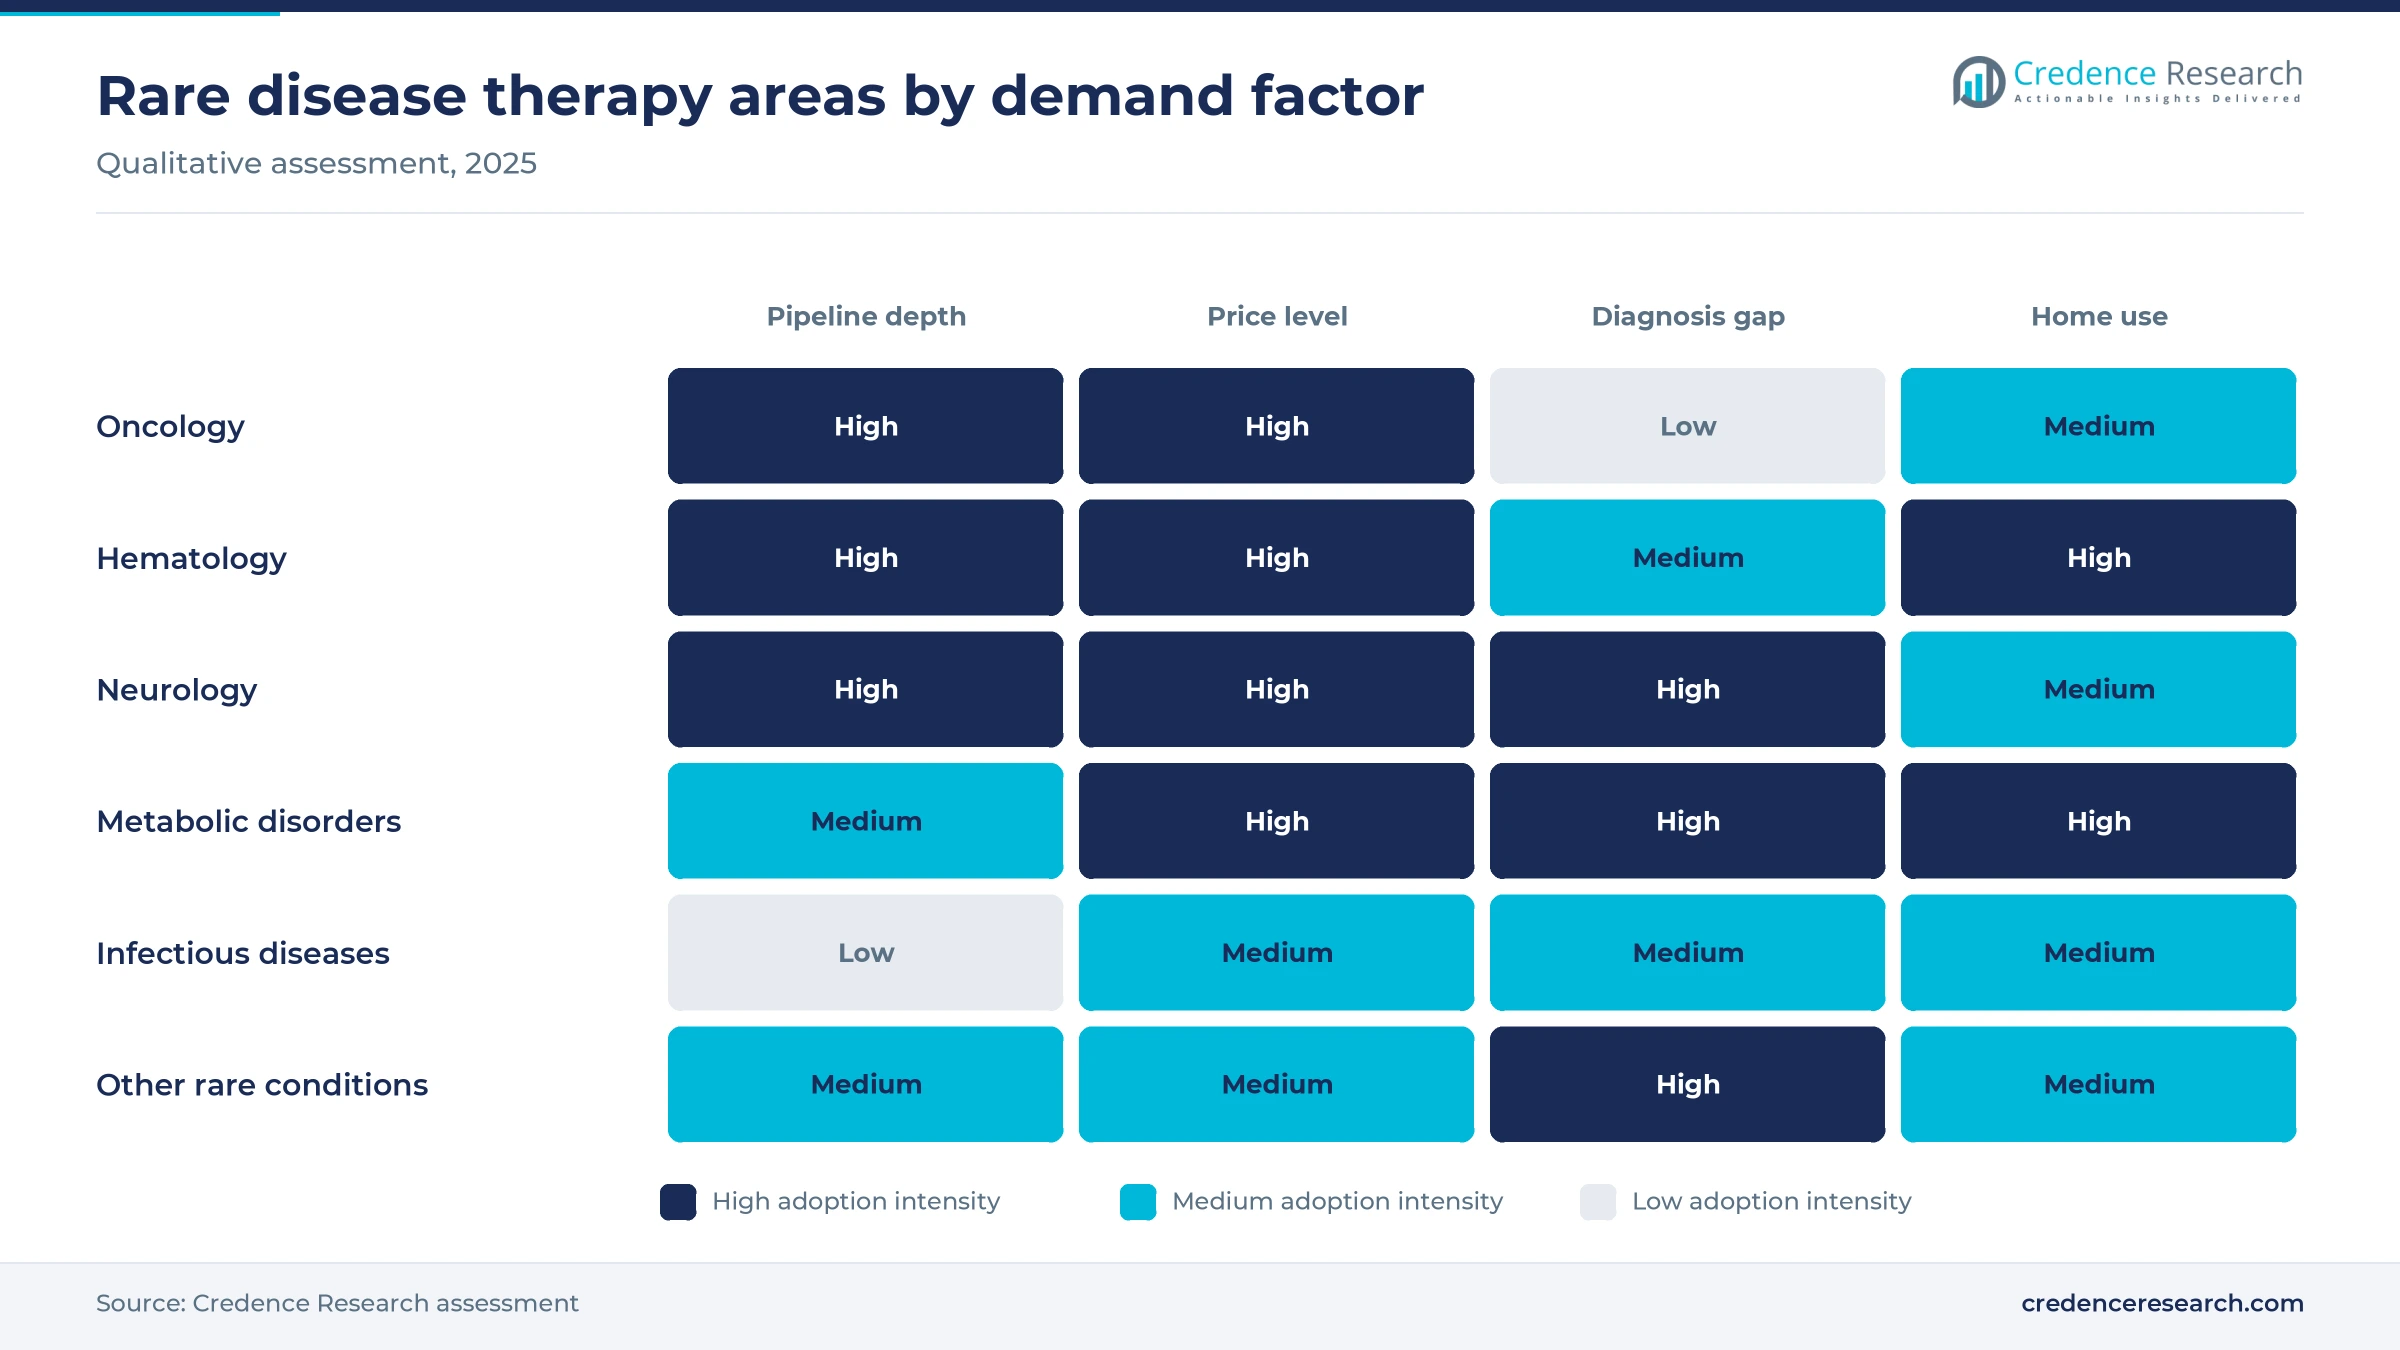
Based on therapy, the market is categorized into oncology, hematology, neurology, infectious diseases, metabolic disorders and others. Oncology led with a 38.0% share of 2025 value, because many cancers with small molecular subgroups qualify for rare disease status. Neurology grows fastest at 7.84% a year, as new medicines reach neuromuscular conditions such as spinal muscular atrophy and Alexander disease.
Where do patients obtain rare disease medicines?
Based on distribution channel, the market is categorized into hospital pharmacies, retail pharmacies and online pharmacies. Hospital Pharmacies led with a 52.0% share of 2025 value, because infused biologicals and cancer regimens are given in hospital settings. Online Pharmacies grow fastest at 8.37% a year, as self-injected and oral therapies move to home delivery through specialty programs.
| Segment Group | Leading Sub-segment | Share, 2025 | Fastest-growing Sub-segment | CAGR, 2026–2035 |
|---|---|---|---|---|
| By Drug Type | Biologicals | 58.0% | Biologicals | 7.57% |
| By Therapy | Oncology | 38.0% | Neurology | 7.84% |
| By Distribution Channel | Hospital Pharmacies | 52.0% | Online Pharmacies | 8.37% |
Request a Free Sample
Fill in your details and we'll send you a free sample report.
- Sample data tables & charts
- Research methodology
Approvals, unmet need and incentives lift demand
How does unmet need across rare diseases sustain demand?
Unmet need across rare diseases sustains demand, because most conditions still lack an approved medicine. The National Library of Medicine notes that more than 10,000 rare diseases affect up to 400 million people worldwide, including over 30 million people in the United States. Many of these diseases are genetic and appear in childhood, which means patients need treatment for decades. As a result, each new approval adds a long-term patient group rather than a short course of therapy. In 2025 alone, at least nine of the 46 novel U.S. approvals treated inherited conditions such as hemophilia, hereditary angioedema and phenylketonuria. In turn, better newborn and genetic screening keeps adding diagnosed patients in other regions.
Why does the steady flow of approvals lift spending?
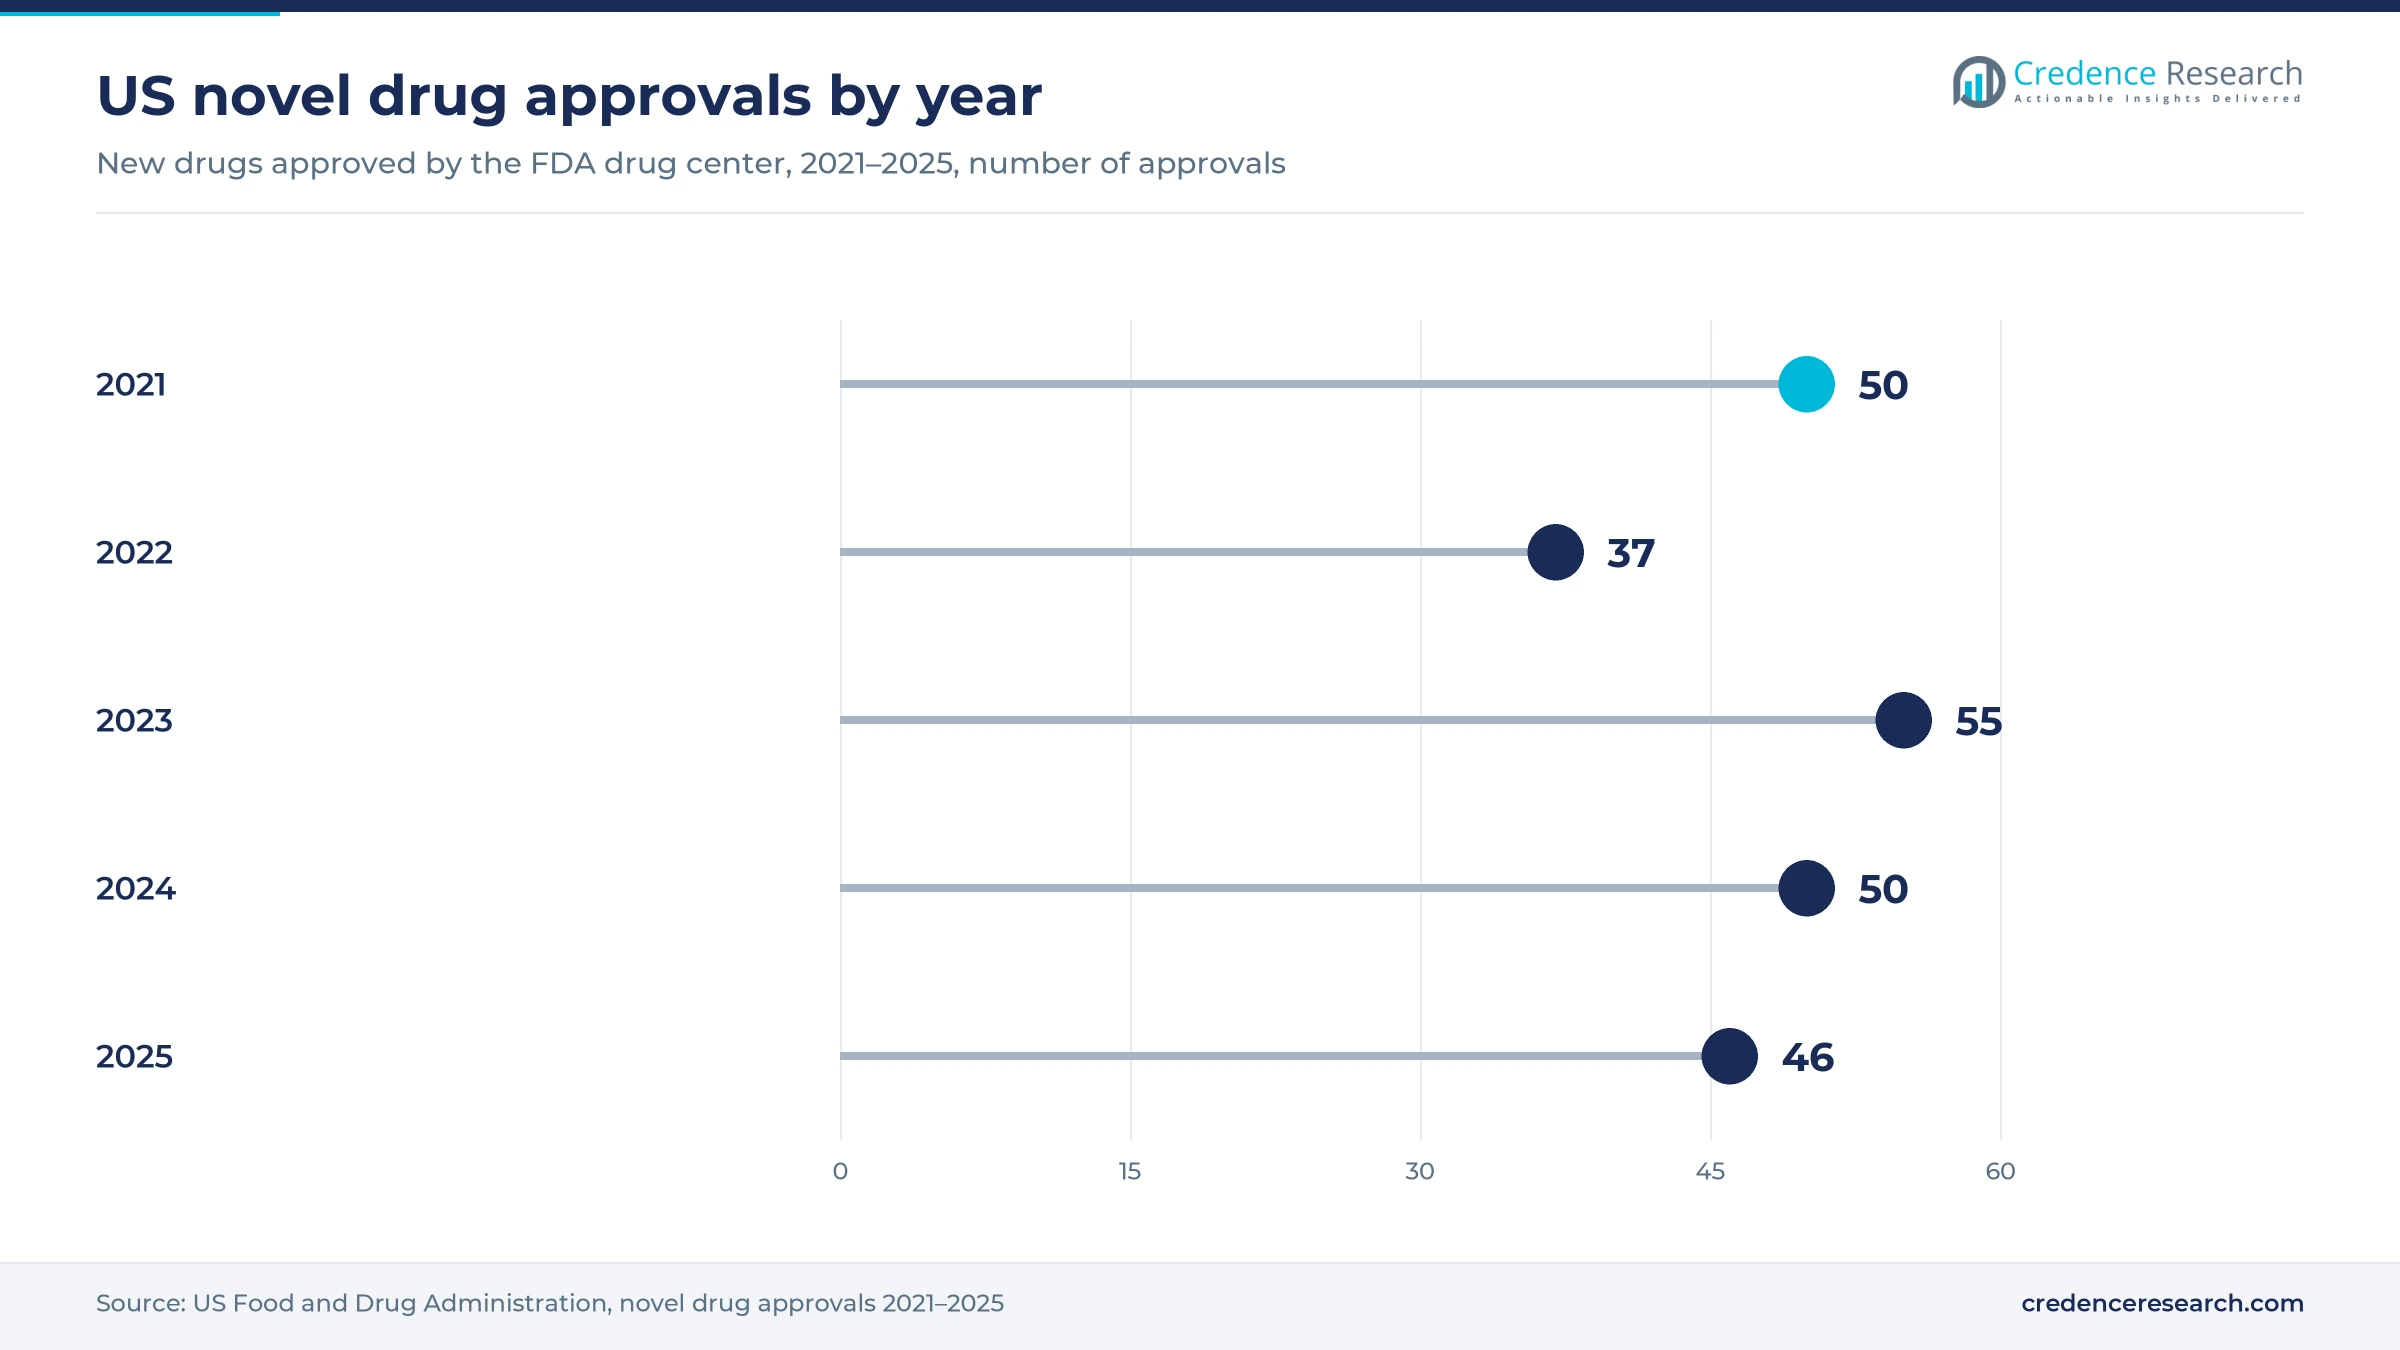
The steady flow of approvals lifts spending, because each new medicine opens a market where none existed before. The U.S. regulator approved 50 novel drugs in 2024 and 46 novel drugs in 2025, and more than half of the 2024 approvals were for rare diseases. Approvals in 2025 covered hemophilia, phenylketonuria, Barth syndrome, thymidine kinase 2 deficiency and familial chylomicronemia syndrome. By Oct. 20, 2026, the agency had already approved 47 novel drugs, including treatments for Hunter syndrome and fibrodysplasia ossificans progressiva. As a result, the number of treatable rare conditions keeps growing every year, which supports steady value growth through 2035.
How do regulatory incentives support rare disease development?
Regulatory incentives support rare disease development, because they lower the cost and risk of studying small patient groups. On Sept. 3, 2025, the U.S. regulator announced Rare Disease Evidence Principles for very small genetic diseases with significant unmet need. Under this process, one adequate and well-controlled study with robust confirmatory evidence can establish effectiveness. Confirmatory evidence may include biomarker data, natural history studies, nonclinical models and expanded access data. In turn, developers of ultra-rare therapies can plan shorter programs, which encourages more companies to enter the field. Europe, which held 28.0% of 2025 value, also rewards orphan developers with market exclusivity, and spending there still grows at 6.69% a year through 2035.
Why do hematology launches raise treatment value?
Hematology launches raise treatment value, because new medicines offer less frequent dosing and new mechanisms for lifelong blood disorders. In March 2025, Sanofi won U.S. approval for Qfitlia, the first antithrombin-lowering therapy for hemophilia A or B, with as few as six injections a year. In March 2024, Alexion won U.S. approval for Voydeya, a first-in-class oral factor D inhibitor, as an add-on for patients with extravascular hemolysis. AstraZeneca said about 10% to 20% of these patients experience clinically significant hemolysis on C5 inhibitors. As a result, hematology ranks second among therapy areas by value, and new dosing options widen use at home.
Genetic medicines and dealmaking reshape rare care
How are acquisitions shifting rare disease portfolios?
Acquisitions are shifting rare disease portfolios toward large drugmakers, because buyers want late-stage assets with clear regulatory paths. In July 2025, Sanofi completed its acquisition of Blueprint Medicines, adding Ayvakit, the only approved medicine for advanced and indolent systemic mastocytosis. In February 2026, Novartis completed its acquisition of Avidity Biosciences to strengthen its pipeline in genetic neuromuscular diseases. Earlier, AstraZeneca built its rare disease unit around Alexion, which it acquired in 2021. As a result, commercial reach for small biotech discoveries is rising, and launches now reach more countries faster than before. Large buyers also bring manufacturing scale and payer teams that small developers often lack.
Why are RNA-based medicines rising in rare care?
RNA-based medicines are rising in rare care, because they can silence or adjust the faulty genes behind many conditions. Sanofi says Qfitlia, approved in March 2025, uses small interfering RNA technology, which enables low treatment frequency, subcutaneous dosing and low-volume injections. In February 2026, Novartis described its Avidity purchase as a step in advancing its xRNA strategy for genetic neuromuscular diseases. In September 2026, the U.S. regulator approved Zanvastro to treat Alexander disease in pediatric and adult patients, one of 47 novel drugs approved by Oct. 20, 2026. Biologicals still lead at 58.0% of 2025 value, but RNA platforms widen the non-biological pipeline. In turn, developers can move from one RNA platform to many rare targets with similar manufacturing, which shortens development cycles and widens the pipeline.
Can new mechanisms open demand in rare blood cancers?
Developers have a clear opening in rare blood cancers, because many patients still rely on older treatments such as repeated blood removal. In August 2026, Takeda announced U.S. approval of Mimrylo, a first-in-class hepcidin mimetic for erythrocytosis in adults with polycythemia vera. Protagonist discovered the medicine and led its development through Phase 3. In June 2024, PiaSky, developed by Chugai with Roche, gained U.S. approval in paroxysmal nocturnal hemoglobinuria. As a result, blood disorders with few options can grow into valuable treatment areas, and hematology already ranks second among therapy areas by 2025 value. Long-term safety data will decide how fast doctors adopt these new options.
Where can neuromuscular disease add new demand?
Neuromuscular disease gives drugmakers room to add demand, because many conditions progress quickly and have few treatments. In September 2026, the U.S. regulator approved Isembyld for spinal muscular atrophy in patients two years of age and older who already receive SMN2-targeted treatment. The Novartis purchase of Avidity in February 2026 added late-stage programs in genetic neuromuscular disease. In September 2025, the U.S. regulator also approved Forzinity to improve muscle strength in Barth syndrome patients weighing at least 30 kg. In turn, neurology grows at 7.84% a year, the fastest therapy area, as combination use and new mechanisms extend treatment.
Pricing, small trials and access gaps slow uptake
Why does high pricing strain payers and patients?
High pricing strains payers and patients, because rare disease medicines spread development cost across very few people. Health systems face rising budgets as more lifelong therapies reach the market. Some payers now require outcome data or limit access to specialist centers before coverage begins. As a result, companies increasingly offer outcome based contracts, patient support programs and staged payments to secure coverage. These schemes add administrative work for hospitals and specialty pharmacies.
How do small trials complicate approval and coverage?
Small trials complicate approval and coverage, because a few hundred or even a few dozen patients make results harder to confirm. Regulators may accept new evidence models, but payers often ask for more proof of long-term benefit. Confirmatory studies can take several years to complete in very small populations. In turn, companies invest in natural history registries and real-world data to support both regulators and payers. Patient advocacy groups often help recruit participants across several countries.
Why do diagnosis delays limit treated patient numbers?
Diagnosis delays limit treated patient numbers, because many rare diseases are confused with common conditions for years. Access to genetic testing remains uneven across regions and income levels. Patients outside major centers often see several specialists before reaching a diagnosis. As a result, wider genetic screening is needed before new medicines reach their full patient groups. Newborn screening panels and clinician education programs are slowly closing this gap in several countries.
How do manufacturing demands raise supply risk?
Manufacturing demands raise supply risk, because biologicals and gene-based therapies need complex production and cold chain handling. Small batch sizes reduce economies of scale for each product. Quality problems at one site can delay supply for an entire patient group. In turn, companies are adding backup sites and long-term supply contracts to protect treatment continuity. Regulators also expect detailed comparability data whenever a production process changes, which adds time.
North America leads as Asia Pacific gains pace
| Region | Value, 2025 (USD billion) | Share, 2025 | CAGR, 2026–2035 |
|---|---|---|---|
| North America | 89.29 | 46.0% | 6.89% |
| Europe | 54.35 | 28.0% | 6.69% |
| Asia Pacific | 33.00 | 17.0% | 8.49% |
| Latin America | 9.71 | 5.0% | 7.79% |
| Middle East & Africa | 7.76 | 4.0% | 7.69% |
Why do U.S. incentives keep North America in the lead?
North America held a 46.0% share of 2025 value and grows at 6.89% a year through 2035. The United States drives this position, because orphan incentives, broad payer coverage and specialty pharmacy networks support early launches. More than half of the 50 U.S. novel approvals in 2024 were for rare diseases, which keeps new products entering the market. Canada adds steady demand through public drug programs for rare conditions.
How do European access processes shape rare disease uptake?
Europe held a 28.0% share of 2025 value and grows at 6.69% a year, the slowest pace of the five regions. Germany, France, Italy and the United Kingdom account for much of the spending. European Union orphan rules offer market exclusivity, although national price and access reviews delay launches in many countries. As a result, uptake and time to access vary widely across the region.
Why are Japan and China lifting Asia Pacific growth?
Asia Pacific held a 17.0% share of 2025 value and is the fastest-growing region at 8.49% a year. Japan has an established rare disease designation system and is home to Takeda Pharmaceutical Company Limited. China is widening its rare disease list and speeding reviews for imported medicines, which brings new therapies to a large population. Australia and South Korea add steady demand through public reimbursement.
How is Latin America widening rare disease access?
Latin America held a 5.0% share of 2025 value and grows at 7.79% a year through 2035. Brazil and Mexico lead regional spending, and many patients still obtain medicines through court orders or special public programs. Wider newborn screening is raising the number of diagnosed patients across the region.
Why does the Middle East and Africa remain a small market?
The Middle East and Africa held a 4.0% share of 2025 value and grows at 7.69% a year through 2035. Gulf states fund rare disease care and genetic screening, partly because of high rates of inherited conditions. However, limited diagnosis and budgets restrict access across much of Africa.
Rare disease approvals and deals since 2024
| Development | Status and market relevance |
|---|---|
| In March 2024, Alexion, AstraZeneca Rare Disease, received U.S. approval for Voydeya as an add-on therapy in PNH. | Approved; first-in-class oral factor D inhibitor for extravascular hemolysis |
| In May 2024, Amgen received U.S. approval for Imdelltra in extensive-stage small cell lung cancer. | Approved; first T-cell engager therapy for this cancer, according to Amgen |
| In March 2025, Sanofi received U.S. approval for Qfitlia to prevent or reduce bleeding in hemophilia A or B. | Approved; first antithrombin-lowering therapy, given as few as six times a year |
| In July 2025, Sanofi completed its acquisition of Blueprint Medicines and its systemic mastocytosis medicine Ayvakit. | Completed; adds a commercial rare immunology medicine and pipeline |
| In August 2026, Takeda received U.S. approval for Mimrylo for erythrocytosis in adults with polycythemia vera. | Approved; first-in-class hepcidin mimetic discovered by Protagonist |
RNA silencing, hepcidin mimetics and gene tools advance
- Small interfering RNA silences disease-related genes with infrequent injections, which suits lifelong blood and metabolic disorders.
- Antisense oligonucleotides adjust faulty gene products in the nervous system, which opens treatment for neuromuscular and leukodystrophy conditions.
- Hepcidin mimetics copy a natural iron-regulating hormone, which controls excess red blood cell production in polycythemia vera.
- Complement inhibitors block parts of the immune cascade in rare blood and kidney diseases, with oral and subcutaneous options now available.
- Antibody-oligonucleotide conjugates carry RNA medicines into muscle tissue, which supports new programs in genetic neuromuscular disease.
Need a Custom Version of This Report?
Tailor the scope, geography, or segments to your exact requirements.
- Custom geography or segment scope
- Direct access to our analyst team
Large drugmakers compete through rare disease deals
Competition is led by large drugmakers that build rare disease units through acquisitions and in-house research. AstraZeneca and Alexion Pharmaceuticals Inc. focus on complement medicines for blood, kidney and neurological conditions. Roche competes in hematology and rare cancers, while Celgene Corporation, now part of a larger drugmaker, brought blood cancer medicines into the field. Sanofi strengthened hemophilia and rare immunology with Qfitlia and the Blueprint Medicines purchase. Novartis AG adds neuromuscular programs through Avidity, and Takeda Pharmaceutical Company Limited extends hematology with Mimrylo. Amgen Inc., Merck & Co., Inc. and Eli Lilly and Company compete in rare cancers and specialty indications. As a result, success depends on pipeline depth, patient finding and payer access programs.
Companies profiled and their roles in this market
| Company | Type | Role in the market |
|---|---|---|
| AstraZeneca | Diversified | Rare disease medicines through its Alexion unit |
| Alexion Pharmaceuticals Inc. | Specialist | Complement inhibitors including Voydeya |
| Sanofi | Diversified | Hemophilia and rare immunology, including Qfitlia and Ayvakit |
| Novartis AG | Diversified | Rare kidney, blood and neuromuscular programs |
| F. Hoffmann-La Roche Ltd. | Diversified | Hematology and rare cancers, including PiaSky with Chugai |
| Takeda Pharmaceutical Company Limited | Diversified | Rare blood disorders, including Mimrylo |
| Amgen Inc. | Diversified | Rare cancers and inflammatory conditions, including Imdelltra |
| Celgene Corporation | Originator | Blood cancer medicines and pipeline |
| Merck & Co., Inc. | Diversified | Oncology and rare pulmonary indications |
| Eli Lilly and Company | Diversified | Targeted cancer and specialty medicines |
Hematology and neurology set the next growth phase
Credence Research's view is that hematology and neurology will set the next phase of growth, because new mechanisms are reaching conditions that had few options. The overall market grows at 7.20% a year, supported by steady approvals, clearer evidence rules for very small populations and active dealmaking by large drugmakers. Biologicals keep the largest share as antibodies and gene-based therapies expand. Companies that combine strong pipelines with patient finding and payer programs will capture the most value.
How Credence Research sized rare disease medicines
The report uses 2025 as the base year and 2026 to 2035 as the forecast period. Market values come from the Credence Research model, which builds spending by drug type, therapy, distribution channel and region. Regional and segment splits are Credence Research estimates informed by U.S. regulator approval lists, National Library of Medicine data and company press releases. No primary interviews or surveys were used in preparing this edition of the report.
Rare disease medicines outlook to 2035
By 2035, the orphan drugs market is projected to reach USD 389.00 billion, with growth led by hematology, neurology and genetic medicines. Biologicals will remain the largest drug type, while oral and self-injected therapies move more spending to home delivery. North America keeps the highest spending per patient, and Asia Pacific adds the most new patients as diagnosis improves. Clearer evidence rules for very small populations will bring more ultra-rare therapies to market. As a result, advantage will depend on pipelines, access programs and manufacturing reliability.
Frequently Asked Questions
How big is the global orphan drugs market?
Which drug type leads rare disease medicine spending?
Which region leads spending on rare disease medicines?
Which therapy area leads and which grows fastest?
How did U.S. rules for very small genetic diseases change?
What recent approvals and deals affect rare disease medicines?
Who are the leading orphan drug companies?
What restrains growth in rare disease medicines?
Table of Content
Chapter 1 Market Segmentation
- 1.1 Segmentation Framework
- 1.1.1 Product and Service Classification
- 1.1.2 Application and End-Use Classification
- 1.1.3 Technology and Solution Classification
- 1.1.4 Customer and Distribution Channel Classification
- 1.1.5 Geographic Segmentation
- 1.1.6 Market Segment Definitions and Boundaries
- 1.2 By Drug Type
- 1.2.1 Biologicals
- 1.2.2 Non-biologicals
- 1.3 By Therapy
- 1.3.1 Oncology
- 1.3.2 Hematology
- 1.3.3 Neurology
- 1.3.4 Infectious Diseases
- 1.3.5 Metabolic Disorders
- 1.3.6 Others
Chapter 2 Introduction
- 2.1 Report Objectives and Scope
- 2.2 Product Definition and Industry Terminology
- 2.3 Market Inclusions and Exclusions
- 2.4 Research Process
- 2.4.1 Primary Research and Expert Interviews
- 2.4.2 Secondary Research and Source Review
- 2.4.3 Top-Down and Bottom-Up Estimation
- 2.4.4 Data Triangulation and Verification
- 2.5 Market Size Measurement Basis
- 2.5.1 2025: USD 194.11 billion → 2035: USD 389.00 billion
- 2.6 Historical and Forecast Reference Periods
- 2.6.1 Historical Period: 2018-2025
- 2.6.2 Base Year: 2025
- 2.6.3 Forecast Period: 2025-2035
- 2.7 Research Assumptions and Limitations
Chapter 3 Executive Summary
- 3.1 Market Snapshot and Key Findings
- 3.2 Base-Year Market Size, 2025
- 3.3 Forecast Market Size, 2035
- 3.4 Revenue and Volume Growth Outlook
- 3.5 Key Demand and Supply Indicators
- 3.6 Leading Market Segments
- 3.7 Fastest-Growing Market Opportunities
- 3.8 Regional Performance Highlights
- 3.9 Technology and Industry Transformation
- 3.10 Competitive Landscape Summary
- 3.11 Analyst View and Strategic Implications
Chapter 4 Global Orphan Drugs Market Trends and Developments
- 4.1 Historical Industry Development, 2018-2025
- 4.2 Recent Market Trends and Developments
- 4.3 Demand and Customer Behavior Trends
- 4.4 Technology and Product Innovation
- 4.5 Artificial Intelligence, Automation and Digitalization
- 4.6 Local Manufacturing and Supply Chain Realignment
- 4.7 Industry Partnerships, Mergers and Acquisitions
- 4.8 Sustainability and Circular Economy Developments
- 4.9 Government and Private Sector Investment Trends
- 4.10 Emerging Business Models and Commercialization
- 4.11 Industry Developments and Announcements
Chapter 5 Global Orphan Drugs Market Production, Supply and Demand Analysis
- 5.1 Demand Trend and Consumption Analysis, 2018-2025
- 5.2 Demand Forecast, 2025-2035
- 5.3 Production and Output Trend, 2018-2025
- 5.4 Production and Output Forecast, 2025-2035
- 5.5 Installed Capacity and Capacity Utilization
- 5.6 Company-Wise Production Plants and Statistics
- 5.6.1 Installed Production Capacity
- 5.6.2 Actual Production
- 5.6.3 Planned Capacity and Expansion Targets
- 5.7 Supply Chain Structure and Procurement Trends
- 5.8 Supply-Demand Gap and Bottlenecks
- 5.9 Import Dependence and Sourcing Structure
- 5.10 Contract Manufacturing and Outsourcing
- 5.11 Regional Supply and Demand Concentration
Chapter 6 Global Orphan Drugs Market Pricing Analysis
- 6.1 Pricing Structure and Measurement
- 6.2 Historical Pricing Trends, 2018-2025
- 6.3 Pricing Outlook, 2025-2035
- 6.4 Average Selling Price and Unit Economics
- 6.5 Pricing by Product and Market Segment
- 6.6 Geographic Pricing Differences
- 6.7 Key Input, Energy, Labor and Logistics Costs
- 6.8 Contract Pricing and Purchasing Models
- 6.9 Pricing Sensitivity and Competitive Positioning
- 6.10 Price, Margin and Profitability Implications
Chapter 7 Global Orphan Drugs Market Dynamics
- 7.1 Market Growth Drivers
- 7.1.1 Demand-Side Drivers
- 7.1.2 Technology and Innovation Drivers
- 7.1.3 Infrastructure and Investment Drivers
- 7.1.4 Regulatory and Policy Drivers
- 7.2 Market Restraints
- 7.2.1 Cost and Affordability Constraints
- 7.2.2 Technology and Adoption Barriers
- 7.2.3 Supply Chain and Operational Constraints
- 7.3 Market Challenges
- 7.3.1 Competitive Pressure and Margin Erosion
- 7.3.2 Skills, Infrastructure and Implementation Gaps
- 7.4 Emerging Market Opportunities
- 7.5 Market Dynamics Impact and Time-Horizon Assessment
Chapter 8 Global Orphan Drugs Value Chain Analysis
- 8.1 Industry Value Chain Overview
- 8.2 Upstream Suppliers and Critical Inputs
- 8.3 Technology and Component Providers
- 8.4 Manufacturing or Service Delivery
- 8.5 Distribution, Channel Partners and Integrators
- 8.6 Downstream Applications and End Users
- 8.7 Value Addition and Profit Pools
- 8.8 Vertical Integration and Outsourcing
- 8.9 Supplier Concentration and Risk
- 8.10 Supply Chain Localization and Resilience
Chapter 9 Global Orphan Drugs Market Regulations and Policies
- 9.1 Relevant Laws, Standards and Compliance Frameworks
- 9.2 Product, Service, Safety and Quality Requirements
- 9.3 Government Policies, Incentives and Subsidies
- 9.4 Imports, Exports and Trade Barriers
- 9.5 Public Procurement and Local Content Requirements
- 9.6 Environmental and Sustainability Compliance
- 9.7 Upcoming Policy Changes and Market Implications
Chapter 10 Global Orphan Drugs Market Hotspots and Opportunities
- 10.1 Market Opportunity Mapping and Growth Hotspots
- 10.2 High-Growth Applications and Customer Groups
- 10.3 Underserved Markets and White-Space Opportunities
- 10.4 Emerging Technology and Product Opportunities
- 10.5 New Capacity and Investment Hotspots
- 10.6 Market Entry and Expansion Opportunities
- 10.7 Distribution and Partnership Opportunities
- 10.8 Near-Term and Long-Term Commercial Potential
- 10.9 Opportunity Attractiveness and Execution Risks
Chapter 11 Global Orphan Drugs Market Outlook, 2025-2035
- 11.1 Market Size and Analysis
- 11.1.1 Revenue (Market Measurement: 2025: USD 194.11 billion → 2035: USD 389.00 billion)
- 11.1.2 Market Volume and Quantity Sold
- 11.1.3 Historical Market Size, 2018-2025
- 11.1.4 Base-Year Market Size, 2025
- 11.2 Market Forecast, 2025-2035
- 11.2.1 Revenue Forecast to 2035
- 11.2.2 Volume Forecast to 2035
- 11.2.3 CAGR and Year-on-Year Growth
- 11.2.4 Incremental Revenue Opportunity
- 11.3 Forecast Assumptions and Scenario Analysis
- 11.3.1 Base-Case Forecast
- 11.3.2 Optimistic and Conservative Scenarios
- 11.3.3 Technology, Pricing and Policy Sensitivities
- 11.4 Market Attractiveness and Growth Outlook
Chapter 12 Global Orphan Drugs Market Segmentation and Outlook
- 12.1 Segmentation Summary and Market Shares, 2025
- 12.2 Largest and Fastest-Growing Segments
- 12.3 By Drug Type - Market Size and Forecast, 2025-2035
- 12.3.1 Segment Definition and Scope
- 12.3.2 Historical Market Size, 2018-2025
- 12.3.3 Revenue Forecast, 2025-2035
- 12.3.4 Volume Forecast, 2025-2035
- 12.3.5 Base-Year Market Share, 2025
- 12.3.6 Segment CAGR and Growth Drivers
- 12.3.7 Subsegment Market Size and Forecast
- 12.3.7.1 Biologicals
- 12.3.7.2 Non-biologicals
- 12.3.8 Subsegment Pricing and Adoption Trends
- 12.3.9 Leading Suppliers and Competition
- 12.3.10 Regional Demand and Opportunities
- 12.4 By Therapy - Market Size and Forecast, 2025-2035
- 12.4.1 Segment Definition and Scope
- 12.4.2 Historical Market Size, 2018-2025
- 12.4.3 Revenue Forecast, 2025-2035
- 12.4.4 Volume Forecast, 2025-2035
- 12.4.5 Base-Year Market Share, 2025
- 12.4.6 Segment CAGR and Growth Drivers
- 12.4.7 Subsegment Market Size and Forecast
- 12.4.7.1 Oncology
- 12.4.7.2 Hematology
- 12.4.7.3 Neurology
- 12.4.7.4 Infectious Diseases
- 12.4.7.5 Metabolic Disorders
- 12.4.7.6 Others
- 12.4.8 Subsegment Pricing and Adoption Trends
- 12.4.9 Leading Suppliers and Competition
- 12.4.10 Regional Demand and Opportunities
- 12.5 Segment Growth Comparison
- 12.6 Segment Attractiveness and Priority Matrix
Chapter 13 Global Orphan Drugs Geographic Market Outlook, 2025-2035
- 13.1 Regional Market Size and Share, 2025
- 13.2 Regional Market Forecast, 2025-2035
- 13.3 Regional Pricing, Production and Demand Differences
- 13.4 North America
- 13.4.1 United States
- 13.4.2 Canada
- 13.4.3 Mexico
- 13.5 Europe
- 13.5.1 Germany
- 13.5.2 France
- 13.5.3 Italy
- 13.5.4 United Kingdom
- 13.5.5 Spain
- 13.5.6 Poland
- 13.5.7 Russia
- 13.5.8 Netherlands
- 13.5.9 Belgium
- 13.5.10 Sweden
- 13.5.11 Denmark
- 13.5.12 Norway
- 13.5.13 Rest of Europe
- 13.6 Asia Pacific
- 13.6.1 China
- 13.6.2 India
- 13.6.3 Japan
- 13.6.4 South Korea
- 13.6.5 Thailand
- 13.6.6 Indonesia
- 13.6.7 Vietnam
- 13.6.8 Malaysia
- 13.6.9 Australia
- 13.6.10 Rest of Asia Pacific
- 13.7 Latin America
- 13.7.1 Brazil
- 13.7.2 Argentina
- 13.7.3 Colombia
- 13.7.4 Chile
- 13.7.5 Rest of Latin America
- 13.8 Middle East
- 13.8.1 Saudi Arabia
- 13.8.2 United Arab Emirates
- 13.8.3 Turkey
- 13.8.4 Israel
- 13.8.5 Iran
- 13.8.6 Rest of the Middle East
- 13.9 Africa
- 13.9.1 South Africa
- 13.9.2 Egypt
- 13.9.3 Nigeria
- 13.9.4 Morocco
- 13.9.5 Rest of Africa
- 13.10 Regional Investment, Policy and Supply Chain Differences
- 13.11 Regional Competitive Landscape
- 13.12 Geographic Growth Hotspots
Chapter 14 Global Orphan Drugs Technology, Innovation and Sustainability Outlook
- 14.1 Technology Landscape and Maturity
- 14.2 Product, Process and Service Innovation
- 14.3 AI, Automation and Digital Tools in the Industry
- 14.4 Technology Adoption and Performance Benchmarking
- 14.5 Innovation Pipeline and R&D Investment
- 14.6 Patent and Intellectual Property Trends
- 14.7 Energy Efficiency and Resource Management
- 14.8 Sustainability, Recycling and Circularity
- 14.9 Technology Roadmap, 2025-2035
- 14.10 Risks of Obsolescence and Technology Substitution
Chapter 15 Global Orphan Drugs Market Key Strategic Imperatives
- 15.1 Growth and Market Entry Priorities
- 15.2 High-Return Products and Segments
- 15.3 Pricing, Profitability and Cost Optimization
- 15.4 Technology Investment and Product Differentiation
- 15.5 Supply Chain Localization and Resilience
- 15.6 Distribution and Customer Acquisition
- 15.7 Partnership, Acquisition and Capacity Strategy
- 15.8 Regional Expansion Priorities
- 15.9 Short-, Medium- and Long-Term Actions
Chapter 16 Competition Outlook
- 16.1 Industry Competition Characteristics
- 16.2 Market Structure and Concentration
- 16.3 Market Share and Competitive Positioning, 2025
- 16.4 Company-Wise Revenue and Product Benchmarking
- 16.5 Production and Service Capacity Benchmarking
- 16.6 Technology, Pricing and Differentiation
- 16.7 Regional Footprint and Distribution Strength
- 16.8 Mergers, Acquisitions and Strategic Alliances
- 16.9 New Entrants and Competitive Threats
- 16.10 Porter's Five Forces and Industry Attractiveness
- 16.11 Competitive Outlook, 2025-2035
Chapter 17 Company Profiles
- 17.1 Company Coverage and Selection Criteria
- 17.2 F. Hoffmann-La Roche Ltd.
- 17.2.1 Business Description
- 17.2.2 Company Ownership and Geographic Presence
- 17.2.3 Product and Service Portfolio
- 17.2.4 Manufacturing and Operating Footprint
- 17.2.5 Production Capacity and Expansion Plans
- 17.2.6 Financial Performance and Investment
- 17.2.7 Market Share and Competitive Position
- 17.2.8 Technology and Innovation Capabilities
- 17.2.9 Strategic Alliances or Partnerships
- 17.2.10 Recent Developments
- 17.2.11 Growth Strategy and Outlook
- 17.3 Celgene Corporation
- 17.4 Merck & Co., Inc.
- 17.5 Novartis AG
- 17.6 Sanofi
- 17.7 Takeda Pharmaceutical Company Limited
- 17.8 AstraZeneca
- 17.9 Alexion Pharmaceuticals Inc.
- 17.10 Eli Lilly and Company
- 17.11 Amgen Inc.
- 17.12 Other Relevant Market Participants
Note: Every listed company is profiled on the structure shown under the first company. The company list is preliminary and may change based on research findings, market developments, data availability and client requirements.
Chapter 18 Disclaimer
- 18.1 Research and Forecast Disclaimer
- 18.2 Data Source and Estimation Limitations
Note: The depth of individual sections depends on data availability for this market. Volume, capacity, trade and other unit-based metrics are included where applicable.

