
Child-specific medicines gain labels and funding
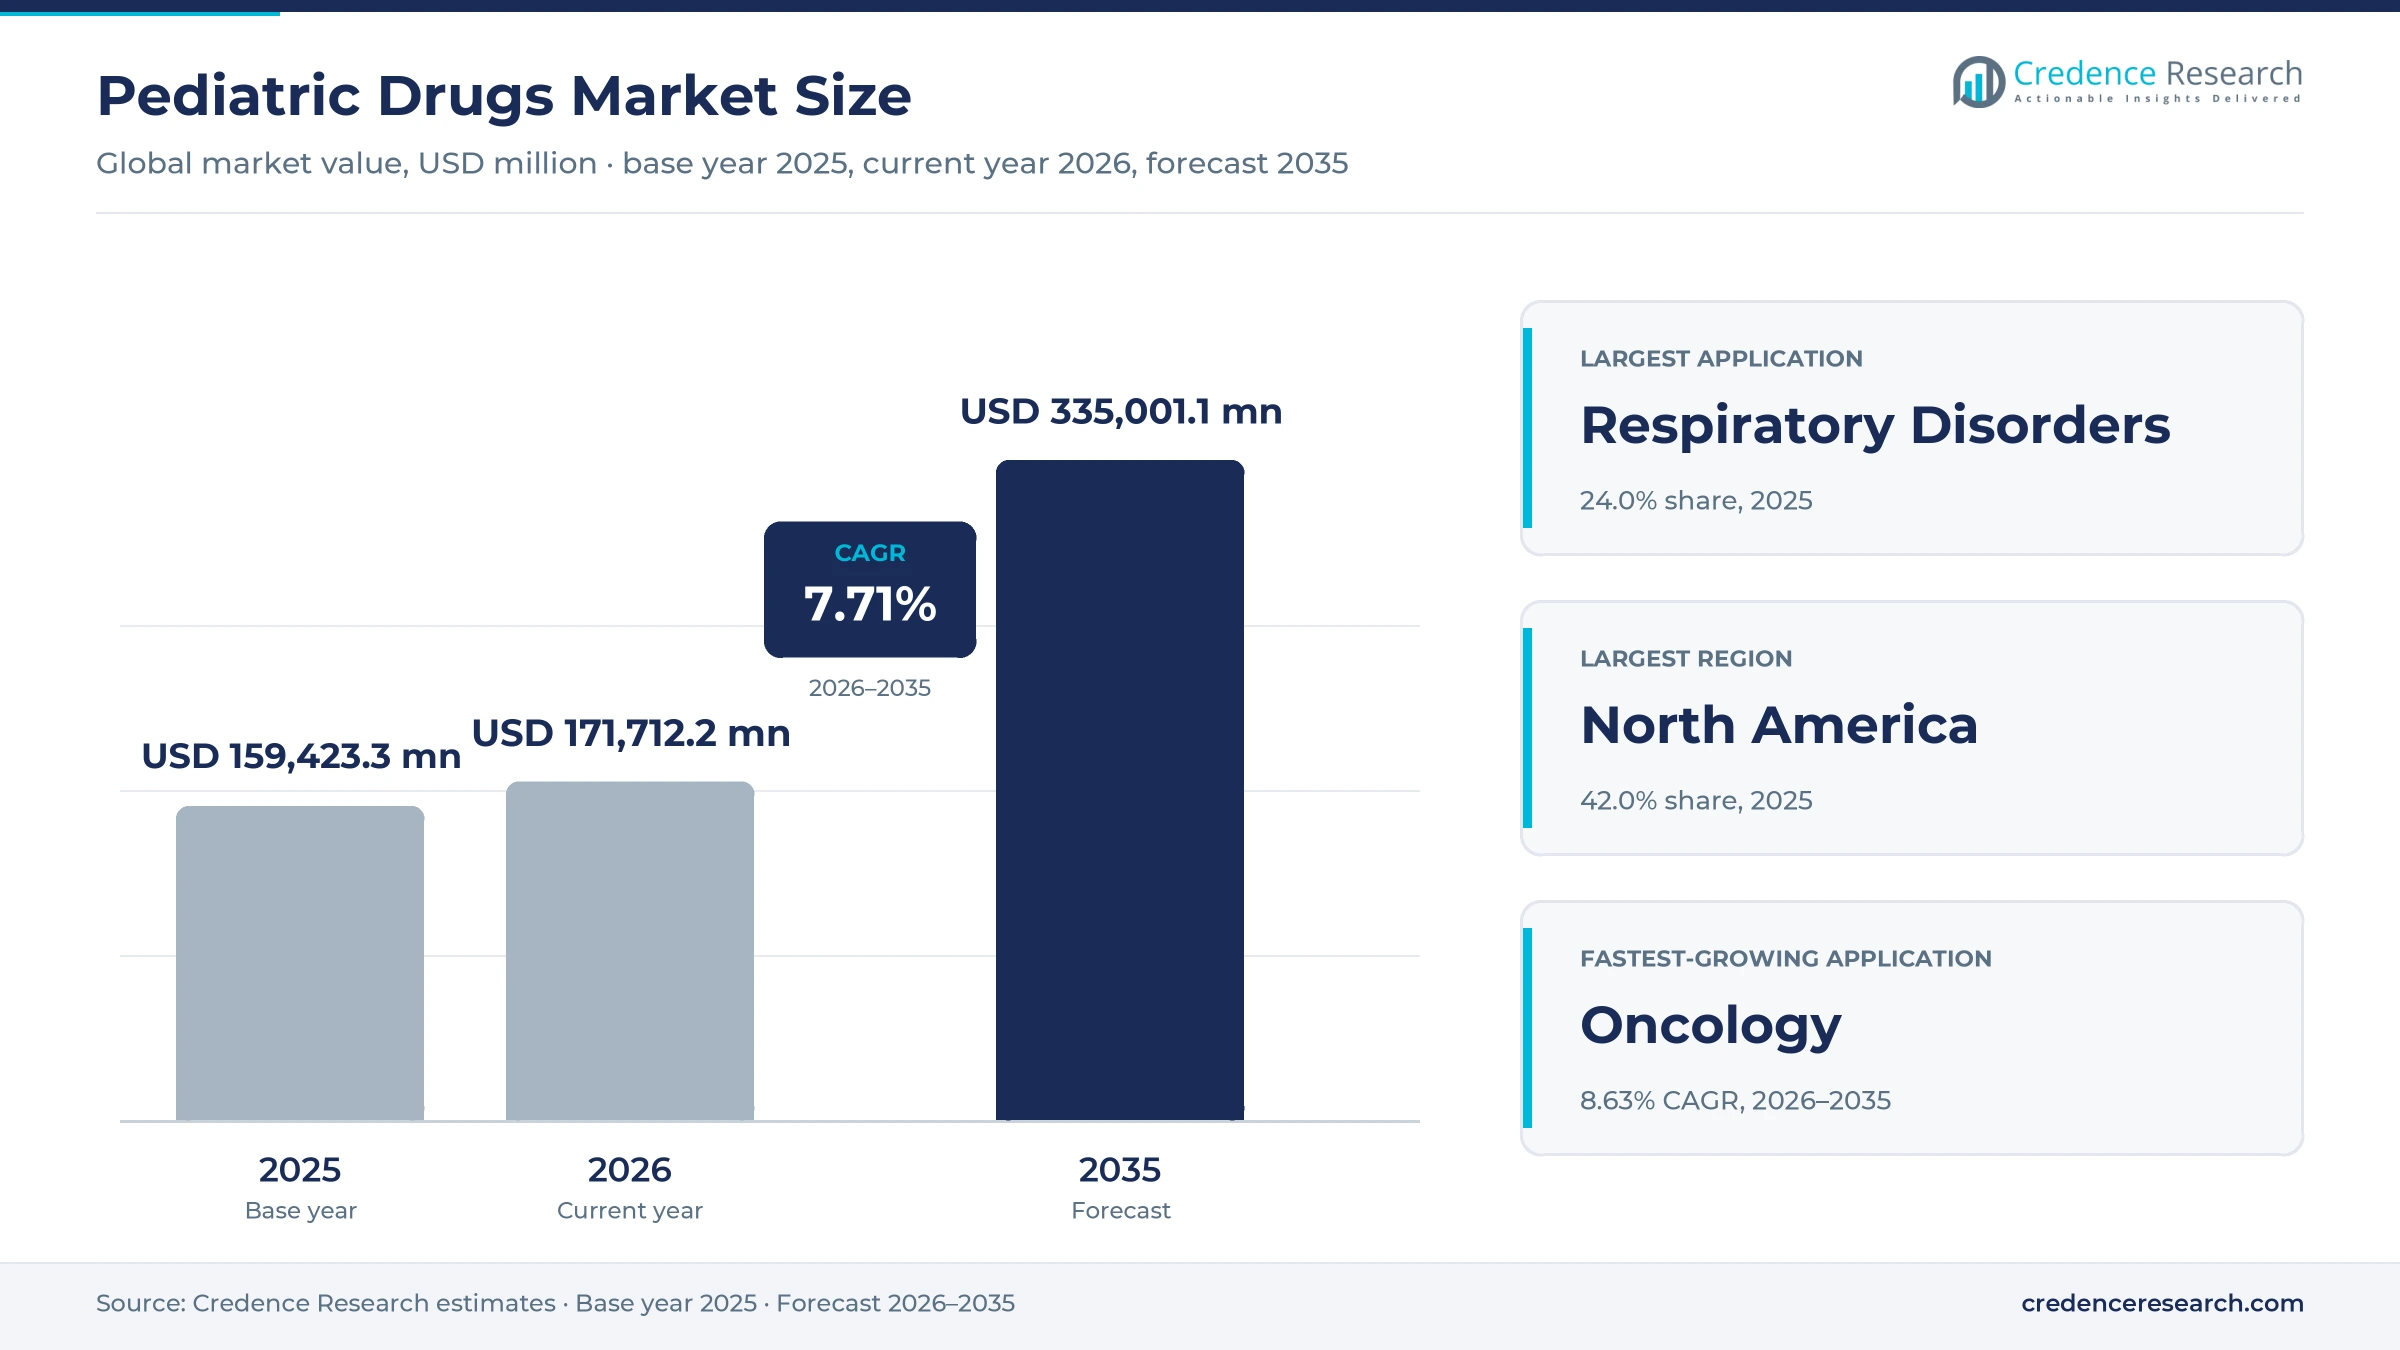
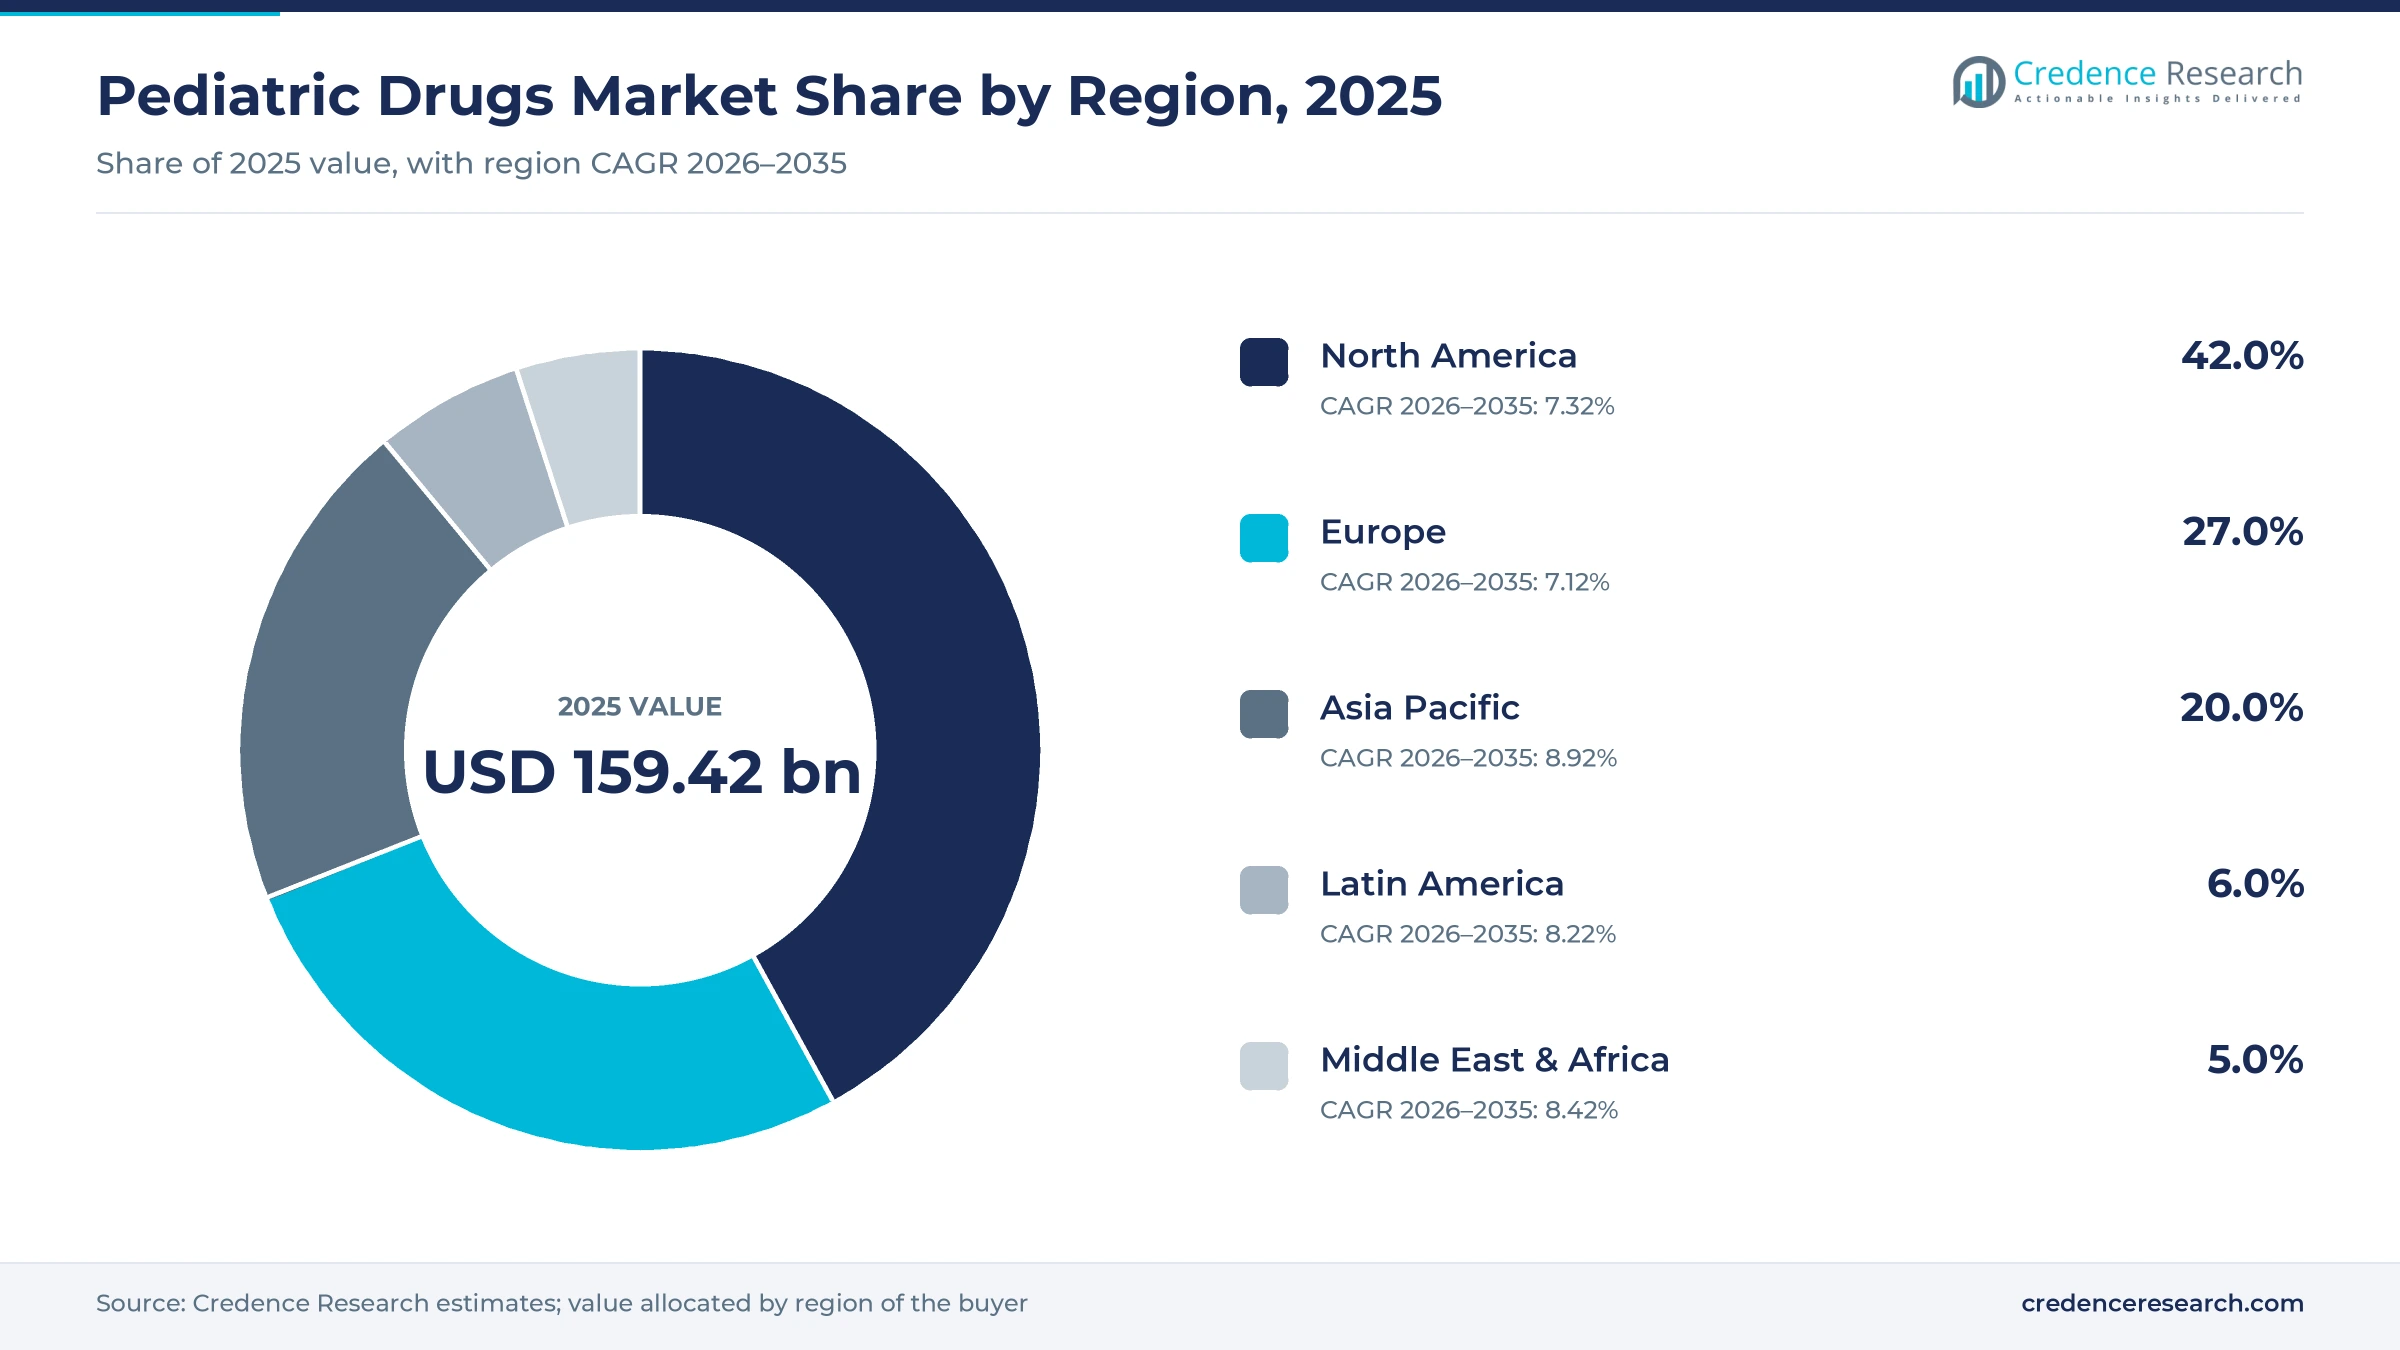
The global pediatric drugs market was valued at USD 159.42 billion in 2025 and is projected to increase from USD 171.71 billion in 2026 to USD 335.00 billion by 2035, registering a CAGR of 7.71% during 2026–2035. Demand comes from asthma, attention disorders, infections, autoimmune conditions and childhood cancers, together with a growing list of rare genetic diseases that now have approved treatments. North America held the largest regional share, 42.0% in 2025, because U.S. pediatric study rules and high prices for specialty therapies concentrate value there. Asia Pacific is the fastest-growing region at 8.92% a year, as China and India widen insurance for children and add specialist hospitals. The policy picture changed in February 2026, when the United States revived its priority review voucher program for rare diseases in children. As a result, developers regained a strong commercial reason to pursue small pediatric indications.
Which child medicines does this analysis cover?
The analysis counts prescription medicines used in infants, children and adolescents, including respiratory, autoimmune, gastrointestinal, cardiovascular, neurology and attention, cancer and other treatments. Values are based on manufacturer selling prices for products given by mouth, on the skin, by injection or infusion, by inhalation and by other routes.
Routine childhood vaccines, infant formula, vitamins and over-the-counter cough and cold products sit outside the scope of this analysis. The value chain runs from drug developers and contract manufacturers through wholesalers to hospital, retail and online pharmacies that dispense medicines to families and care teams.
Pediatric Drugs Market Insights
- The pediatric drugs market grows from USD 159.42 billion in 2025 to USD 335.00 billion by 2035, a 7.71% CAGR as child-specific approvals and specialty therapies expand.
- North America held 42.0% of global child medicine value in 2025, supported by U.S. pediatric study rules and specialty therapy prices.
- Respiratory disorder treatments led applications with 24.0% of 2025 value, while oncology grows fastest at 8.63% a year.
- In November 2025, the FDA approved Novartis Itvisma, a one-time gene replacement therapy for spinal muscular atrophy in patients aged 2 and older.
- In February 2026, the United States reauthorized the rare pediatric disease priority review voucher program through fiscal year 2029.
Respiratory care leads as oncology grows fastest
Why do respiratory treatments lead child medicine spending?
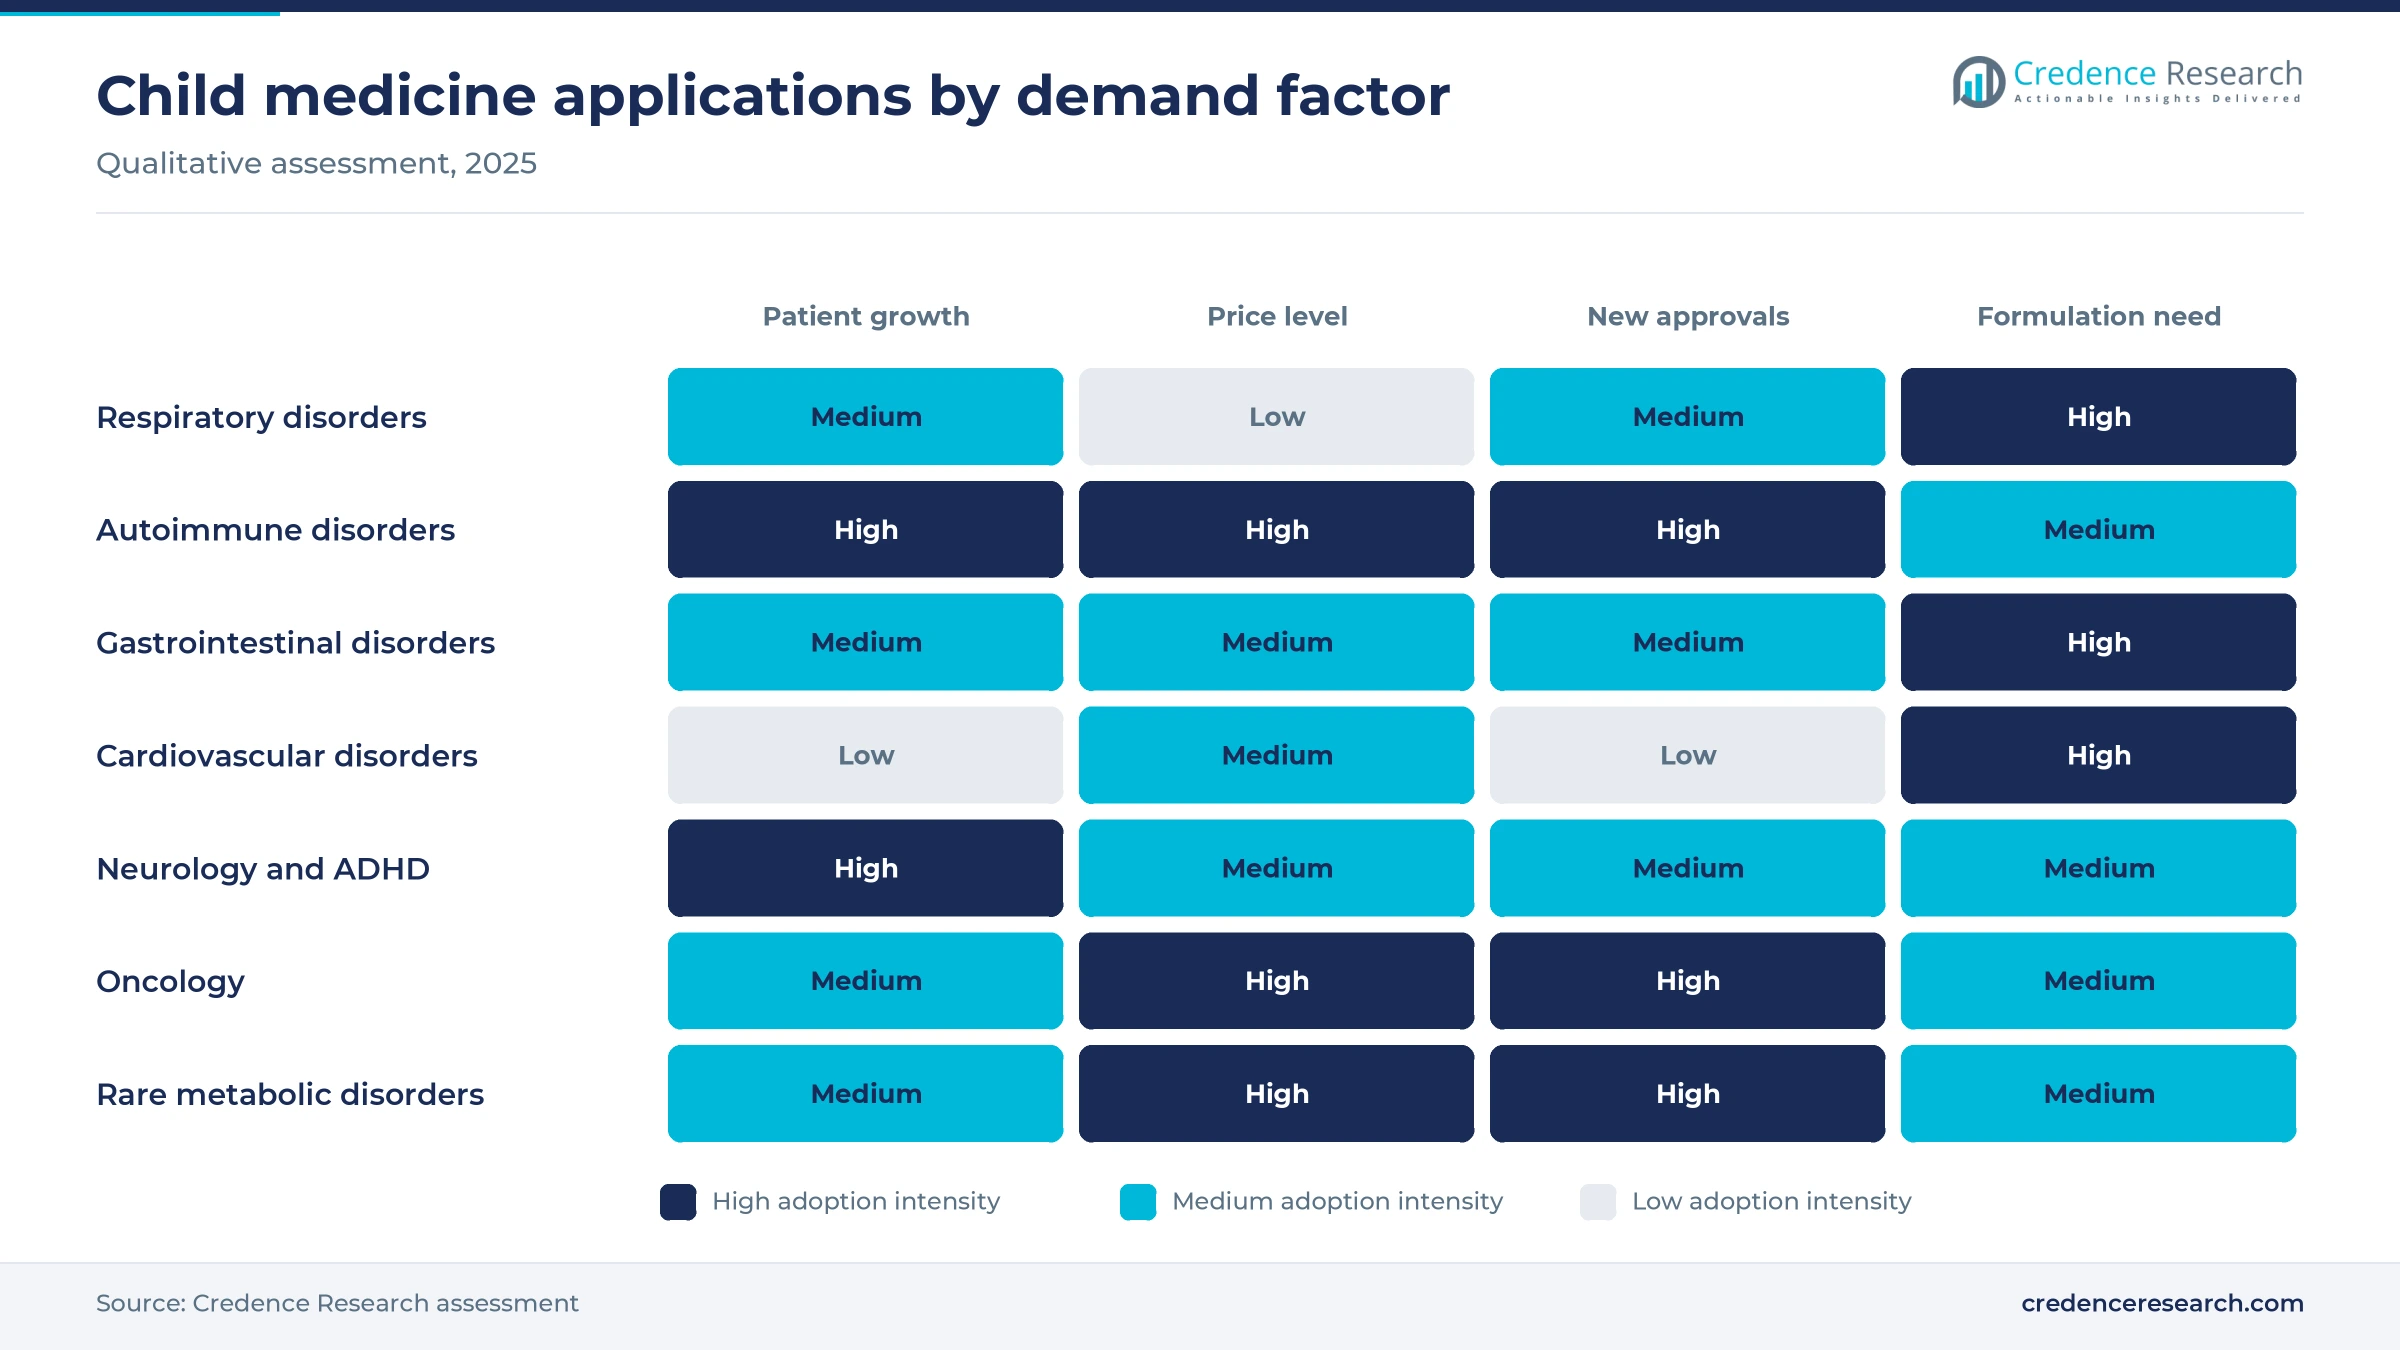
Based on application, the market is categorized into respiratory disorder, autoimmune disorder, gastrointestinal, cardiovascular, neurology and ADHD, oncology and other treatments. Respiratory Disorder Drugs led with a 24.0% share of 2025 value, because asthma and respiratory infections are the most common reasons children need regular medicine. Oncology Drugs grow fastest at 8.63% a year, as targeted therapies reach childhood brain and blood cancers. Neurology spending also rises with wider diagnosis of attention disorders.
Why does parenteral delivery grow fastest?
Based on route of administration, the market is categorized into oral, topical, parenteral, inhalation and other routes. Oral products led with a 46.0% share of 2025 value, because liquids, chewables and dispersible tablets suit most children. Parenteral delivery grows fastest at 8.56% a year, as antibodies, gene therapies and biologic treatments reach more children. Inhaled products remain central in daily asthma care for school-age children.
Why do online pharmacies grow fastest?
Based on distribution channel, the market is categorized into hospital pharmacy, retail pharmacy, online pharmacy and others. Retail Pharmacy led with a 45.0% share of 2025 value, because families fill most chronic prescriptions close to home. Online Pharmacy grows fastest at 9.18% a year, as parents use home delivery for repeat prescriptions. Hospital pharmacies dispense most cancer, rare disease and newborn treatments.
| Segment Group | Leading Sub-segment | Share, 2025 | Fastest-growing Sub-segment | CAGR, 2026–2035 |
|---|---|---|---|---|
| By Application | Respiratory Disorder Drugs | 24.0% | Oncology Drugs | 8.63% |
| By Route of Administration | Oral | 46.0% | Parenteral | 8.56% |
| By Distribution Channel | Retail Pharmacy | 45.0% | Online Pharmacy | 9.18% |
Request a Free Sample
Fill in your details and we'll send you a free sample report.
- Sample data tables & charts
- Research methodology
Chronic childhood illness and rare disease lift spending
How does childhood asthma sustain respiratory demand?
Childhood asthma sustains respiratory demand, because children with the disease need daily controller medicine and rescue treatment. The World Health Organization describes asthma as the most common chronic disease among children. WHO estimates that asthma affected 363 million people in 2023 and caused 442,000 deaths. The agency also notes that inhalers can be difficult for children to use, especially during emergencies. As a result, respiratory disorder treatments hold the largest application share at 24.0% of 2025 value. Demand for spacers, child inhaler designs and nebulized forms also supports steady spending on respiratory inhalers for young patients who cannot use standard adult devices.
Why does wider diagnosis of attention disorders lift neurology spending?
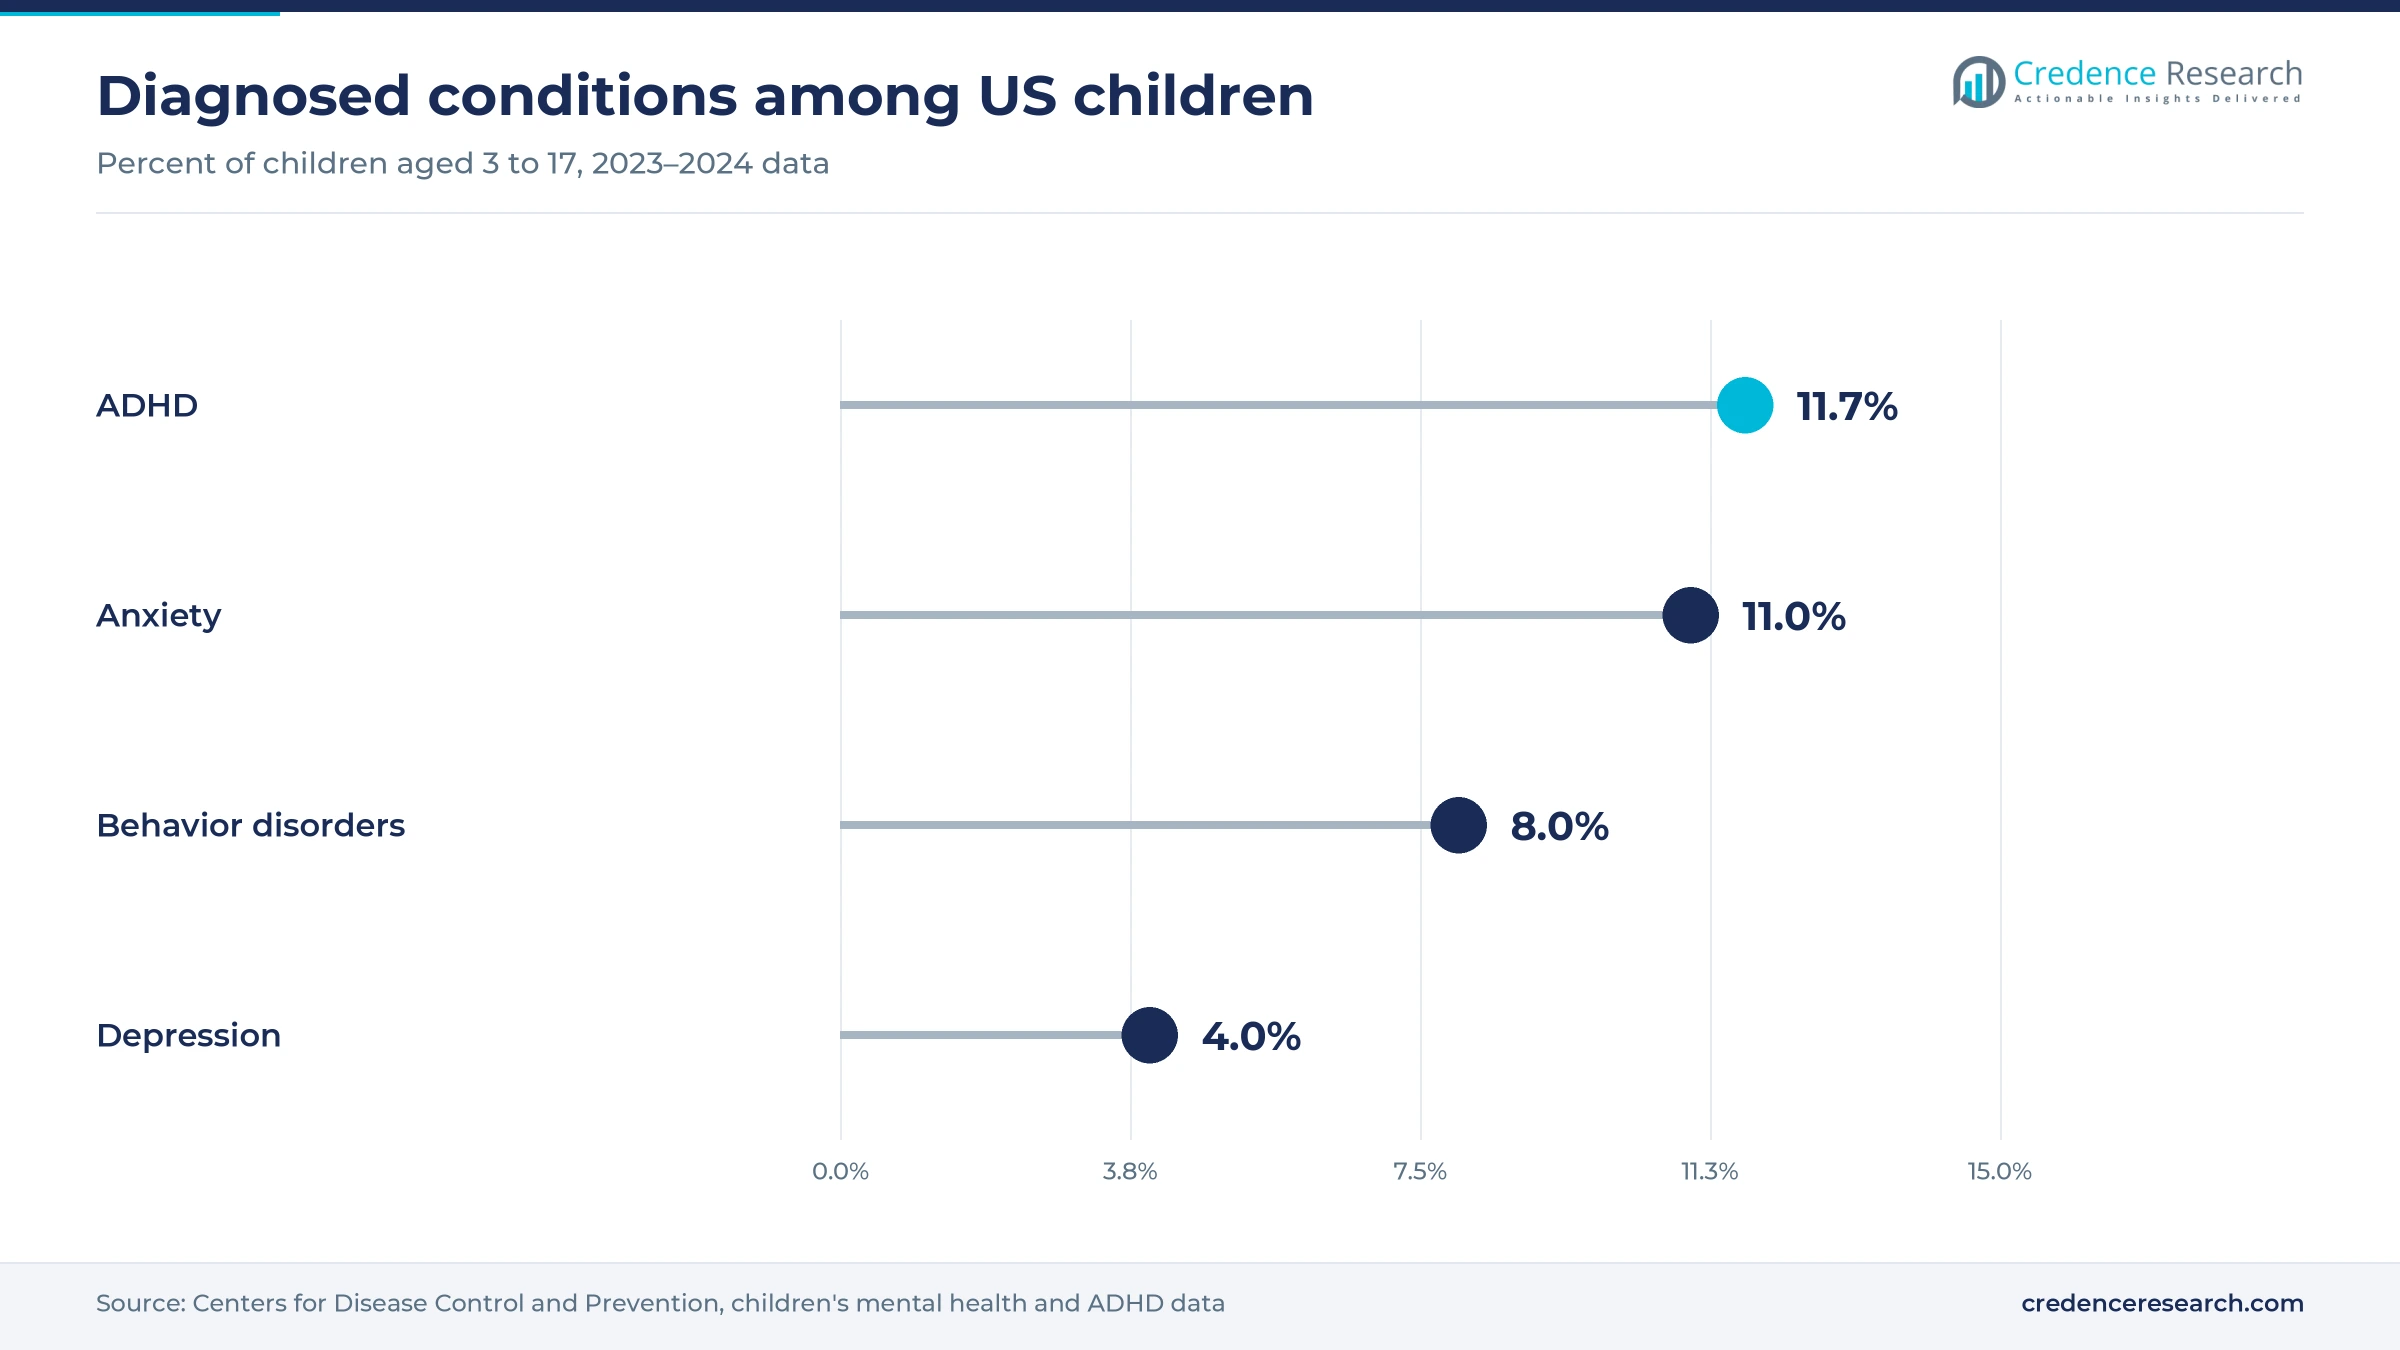
Wider diagnosis of attention disorders lifts neurology spending, because most diagnosed children receive long-term treatment. The Centers for Disease Control and Prevention estimates that 7 million U.S. children aged 3 to 17, or 11.7%, had a current ADHD diagnosis in 2024. CDC data also show that 11% of children in that age group had diagnosed anxiety and 8% had diagnosed behavior disorders in 2023 and 2024. These conditions often need medicine together with behavioral care for several years. In turn, stimulant and nonstimulant ADHD treatment supports neurology spending, which grows with each newly diagnosed school-age child and continues into the teenage years.
How do rare disease approvals raise spending per child?
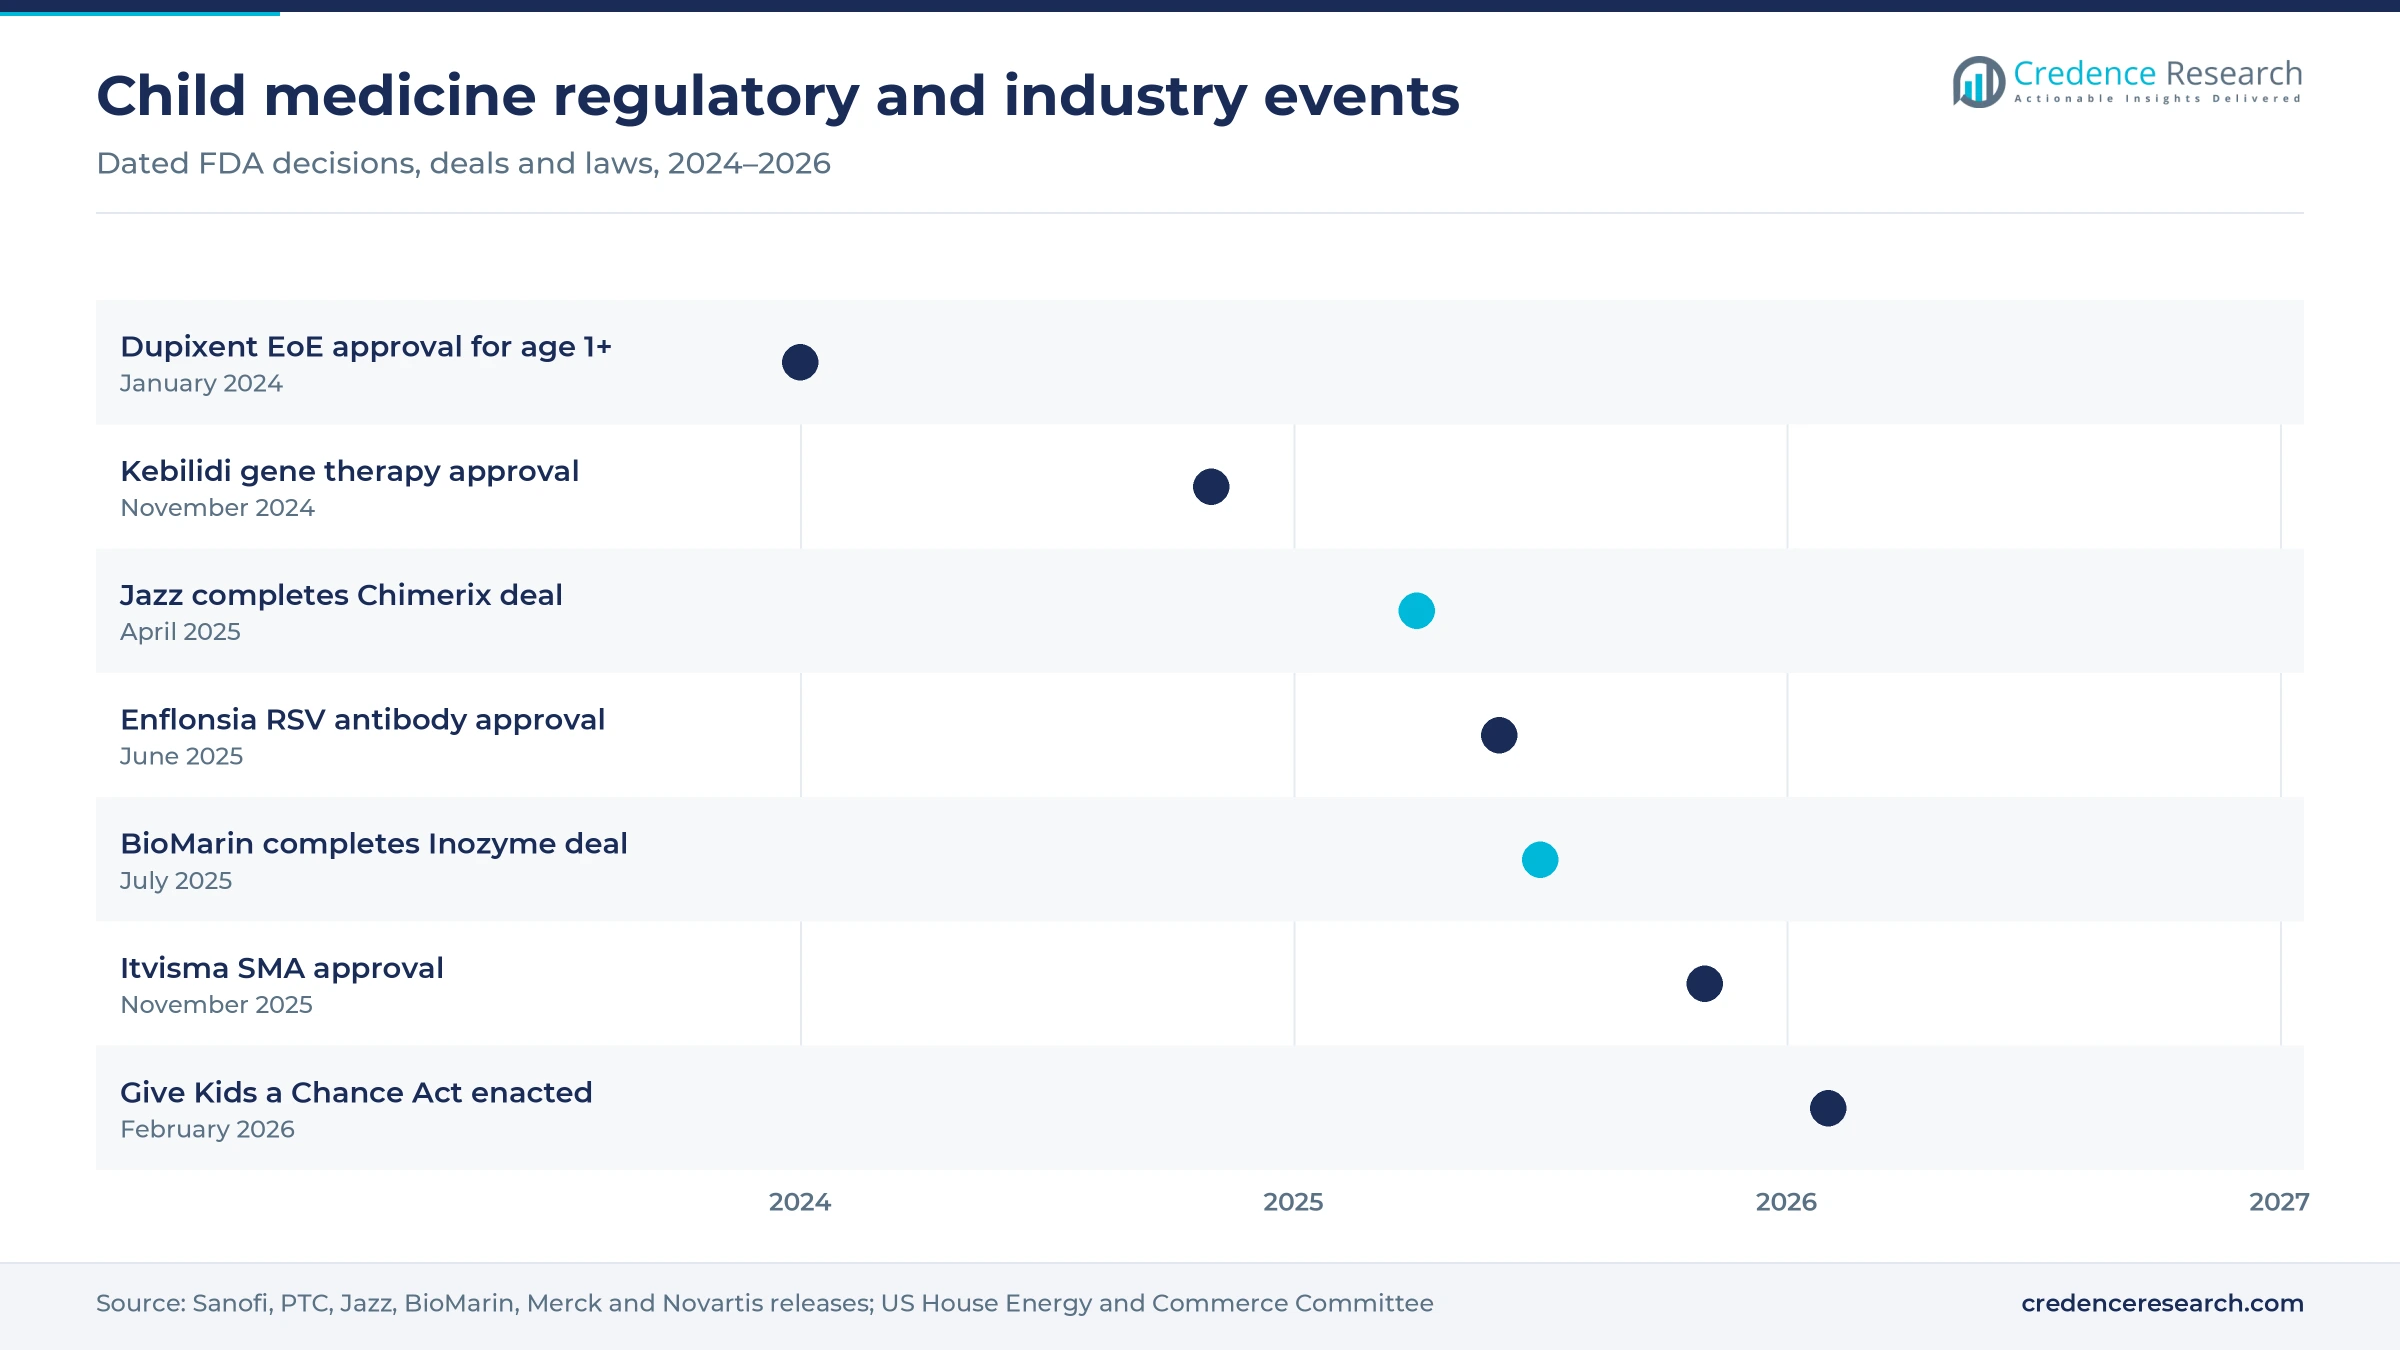
Rare disease approvals raise spending per child, because new gene and enzyme therapies carry high prices for small groups. In July 2025, PTC Therapeutics received FDA approval for Sephience for phenylketonuria in patients 1 month of age and older. The company estimates that about 58,000 people live with this condition worldwide. In November 2024, PTC also received FDA approval for Kebilidi, the first gene therapy given directly to the brain in the United States. In July 2025, BioMarin completed its acquisition of Inozyme, adding a treatment candidate for a rare bone and blood vessel disorder. As a result, specialty therapies take a growing share of child medicine value through 2035.
Why does U.S. voucher policy encourage child-specific research?
U.S. voucher policy encourages child-specific research, because a priority review voucher can be sold or used to speed another approval. In February 2026, the President signed the Mikaela Naylon Give Kids a Chance Act after the House passed it on Feb. 3, 2026. The law reauthorizes the rare pediatric disease voucher program through fiscal year 2029. It also gives the FDA added authority to require pediatric cancer trials for new drug combinations. In turn, developers have stronger reasons to run trials in children, which keeps the United States the first market for many new pediatric labels in rare conditions and childhood cancers.
Gene therapy and long-acting antibodies reshape child care
How is one-time gene therapy shifting rare disease care?
One-time gene therapy is shifting rare disease care away from lifelong treatment, because a single dose can replace a missing gene. In November 2025, Novartis announced FDA approval of Itvisma for children two years and older, teens and adults with spinal muscular atrophy. The company said Itvisma uses a one-time fixed dose that does not need adjusting for age or body weight. Novartis also noted that the first gene therapy for the disease was approved six years earlier. As a result, parenteral delivery grows fastest among routes at 8.56% a year, as infused and injected therapies reach older children and teens who were not eligible for earlier gene therapy.
Why are long-acting antibodies rising in infant protection?
Long-acting antibodies are rising in infant protection, because a single injection can cover a full respiratory virus season. In June 2025, Merck announced that the FDA approved Enflonsia to prevent lower respiratory disease from RSV in infants entering their first season. Merck said the antibody provides protection through five months with the same 105 mg dose regardless of weight. The company also noted that RSV is the leading cause of infant hospitalization in the United States. In January 2024, Sanofi received FDA approval for Dupixent in eosinophilic esophagitis for children aged 1 year and older. In turn, injectable biologics are taking a larger share of infant and toddler treatment spending.
Can targeted brain tumor therapy open pediatric oncology value?
Developers have a clear opening in childhood brain tumors, because few approved medicines exist for these cancers. In April 2025, Jazz Pharmaceuticals completed its acquisition of Chimerix, adding the brain tumor candidate dordaviprone. In August 2025, the FDA granted accelerated approval to Modeyso for H3 K27M-mutant diffuse midline glioma in patients aged 1 year and older. The approval rested on a 22% overall response rate across 50 patients in five open-label studies. Continued approval depends on the confirmatory Phase 3 ACTION trial, which keeps clinical investment in this field active. As a result, oncology treatments grow fastest among applications at 8.63% a year, as targeted medicines reach childhood brain and blood cancers.
Where can metabolic disorder treatments add new demand?
Metabolic disorders give developers room to add demand, because newborn screening finds these conditions early in life. Sephience received FDA approval in July 2025 for patients with phenylketonuria from 1 month of age, covering all disease subtypes. PTC noted that the treatment was also authorized by the European Commission, with reviews ongoing in Japan and Brazil. BioMarin signed its merger agreement with Inozyme in May 2025 and completed the deal on July 1, 2025, which shows that large rare disease companies are buying early-life metabolic programs. In turn, treatments for inherited metabolic disease can add steady value, because children often stay on therapy for many years.
Trial limits, dosing gaps and prices slow child access
Why do small trial populations slow child-specific approvals?
Small trial populations slow child-specific approvals, because developers must recruit children across several age bands and weights. Ethical rules limit placebo use and the number of blood samples in young patients. Rare diseases make recruitment even harder, as each country may have only a few eligible children. As a result, many medicines reach children years after adults, while doctors prescribe some products without a pediatric label.
How do formulation gaps limit safe dosing in young children?
Formulation gaps limit safe dosing in young children, because many medicines exist only as adult tablets or capsules. Pharmacists often crush tablets or prepare liquids by hand, which can change dose accuracy and taste. Infants also need excipients that are safe at low body weight. In turn, developers must invest in liquids, minitablets and dispersible forms, which raises costs for products with modest pediatric sales.
Why do high prices restrict access to gene therapies?
High prices restrict access to gene therapies, because one-time treatments carry very high upfront costs for payers. Public health systems in Europe, Asia and Latin America often delay coverage while they assess long-term value. Families in lower-income countries rarely have access to these therapies at all. As a result, rare disease spending stays concentrated in the United States and a few wealthy markets, while companies test outcome-based payment models.
How does limited care access hold back treatment in poorer regions?
Limited care access holds back treatment in poorer regions, because many children never reach a specialist. UN data show that 4.8 million children died before their fifth birthday in 2023, many from preventable causes. Weak supply chains also cause shortages of basic antibiotics, asthma inhalers and child formulations. In turn, demand in Africa and parts of Asia remains far below medical need, even as donors and governments expand programs.
North America leads as Asia Pacific gains pace
| Region | Value, 2025 (USD billion) | Share, 2025 | CAGR, 2026–2035 |
|---|---|---|---|
| North America | 66.96 | 42.0% | 7.32% |
| Europe | 43.04 | 27.0% | 7.12% |
| Asia Pacific | 31.88 | 20.0% | 8.92% |
| Latin America | 9.57 | 6.0% | 8.22% |
| Middle East & Africa | 7.97 | 5.0% | 8.42% |
Why do U.S. study rules keep North America in the lead?
North America held a 42.0% share of 2025 value and grows at 7.32% a year through 2035. The United States drives this position, because pediatric study rules, voucher incentives and specialty therapy prices concentrate value there. U.S. regulators approved Sephience, Modeyso, Enflonsia and Itvisma in 2025, which widened treatment for children. Commercial insurers and Medicaid also cover most prescription medicines for children.
Why do China and India drive Asia Pacific growth?
Asia Pacific held a 20.0% share of 2025 value and is the fastest-growing region at 8.92% a year. China and India have the largest child populations in the region and are widening insurance and specialist hospital networks. Japan hosts suppliers such as Sumitomo Pharma Co. Ltd., while multinational companies expand child formulations across the region. This mix of volume growth and new coverage supports demand.
How do European pediatric plans shape medicine use?
Europe held a 27.0% share of 2025 value and grows at 7.12% a year, the slowest pace of the five regions. Germany, France, the United Kingdom and Italy account for much of the spending, and companies such as Sanofi SA, Novartis AG, GlaxoSmithKline plc and Boehringer Ingelheim GmbH are based in the region. However, price controls and health technology reviews keep value growth below the global average.
Why are private insurers lifting Latin American demand?
Latin America held a 6.0% share of 2025 value and grows at 8.22% a year through 2035. Brazil and Mexico lead regional spending, because private insurance and public programs cover more chronic childhood conditions. Rare disease therapies are also under regulatory review in Brazil, which may widen specialty spending.
Why does access remain uneven across the Middle East and Africa?
The Middle East and Africa held a 5.0% share of 2025 value and grows at 8.42% a year through 2035. Gulf states fund specialist children's hospitals and newborn screening, while much of Africa relies on donor programs. This gap limits access to specialty therapies outside major cities.
FDA approvals and deals in child medicine since 2024
| Development | Status and market relevance |
|---|---|
| In January 2024, Sanofi received FDA approval for Dupixent in eosinophilic esophagitis for children aged 1 year and older. | Approved; first treatment indicated for this age group, according to Sanofi |
| In April 2025, Jazz Pharmaceuticals completed its acquisition of Chimerix, adding the brain tumor candidate dordaviprone. | Completed; dordaviprone later approved as Modeyso in August 2025 |
| In July 2025, PTC Therapeutics received FDA approval for Sephience for phenylketonuria in patients 1 month of age and older. | Approved; also authorized by the European Commission |
| In November 2025, Novartis received FDA approval for Itvisma for spinal muscular atrophy in patients aged 2 and older. | Approved; one-time fixed dose regardless of age or weight |
| In February 2026, the United States enacted the Mikaela Naylon Give Kids a Chance Act. | Enacted; reauthorizes the rare pediatric disease voucher program through fiscal year 2029 |
Gene therapy, fixed dosing and child formulations advance
- Gene replacement therapy delivers a working copy of a missing gene in one dose, which can replace years of repeated treatment for rare diseases.
- Long-acting antibodies protect infants for a full season with one injection, which reduces hospital visits for respiratory infections.
- Fixed-dose designs use the same dose regardless of body weight, which simplifies dosing for infants and young children.
- Child-friendly formulations such as minitablets, dispersible tablets and taste-masked liquids make medicines easier to give at home.
- Targeted cancer medicines act on specific tumor mutations, which brings new options to childhood brain and blood cancers.
Need a Custom Version of This Report?
Tailor the scope, geography, or segments to your exact requirements.
- Custom geography or segment scope
- Direct access to our analyst team
Drugmakers compete on rare disease and child formulations
Competition is led by large multinational drugmakers with broad pediatric portfolios and by specialists focused on rare diseases. Pfizer Inc., Johnson & Johnson Services Inc., GlaxoSmithKline plc, Sanofi SA, Novartis AG and Boehringer Ingelheim GmbH compete in respiratory, immunology, infection and neurology treatments. PTC Therapeutics Inc. and BioMarin Pharmaceutical Inc. focus on rare genetic and metabolic diseases that often start in childhood. Jazz Pharmaceuticals plc added a childhood brain tumor medicine when it acquired Chimerix in April 2025. Horizon Therapeutics plc, Gilead Sciences Inc. and Sumitomo Pharma Co. Ltd. add rare disease, antiviral and central nervous system products. As a result, companies compete on child-specific formulations, rare disease labels, pediatric trial programs and access agreements with payers.
Companies profiled and their roles in this market
| Company | Type | Role in the market |
|---|---|---|
| Pfizer Inc. | Diversified | Vaccines, anti-infectives and specialty care |
| Johnson & Johnson Services Inc. | Diversified | Neuroscience, immunology and oncology treatments |
| GlaxoSmithKline plc | Diversified | Respiratory and infectious disease treatments |
| Sanofi SA | Diversified | Dupixent and immunology and rare disease therapies |
| Novartis AG | Diversified | Itvisma and Zolgensma gene therapy for SMA |
| PTC Therapeutics Inc. | Specialist | Sephience and Kebilidi for rare childhood disorders |
| BioMarin Pharmaceutical Inc. | Specialist | Enzyme and rare bone disorder therapies |
| Jazz Pharmaceuticals plc | Specialist | Modeyso for diffuse midline glioma |
| Horizon Therapeutics plc | Specialist | Rare disease medicines |
| Gilead Sciences Inc. | Diversified | Antiviral treatments |
| Sumitomo Pharma Co. Ltd. | Diversified | Central nervous system treatments |
| Boehringer Ingelheim GmbH | Diversified | Respiratory and other prescription treatments |
Rare disease and oncology set the growth pace
Credence Research's view is that rare disease and oncology therapies will set the pace of growth through 2035, because each new approval adds high-value treatment for small groups of children. The overall market grows at 7.71% a year, supported by asthma, attention disorders and new specialty labels. Respiratory treatments keep the largest share, yet injected biologics and gene therapies raise spending per treated child. Companies that pair child-specific formulations with rare disease programs will win the most new prescriptions.
How Credence Research sized child medicine spending
The report uses 2025 as the base year and 2026 to 2035 as the forecast period. Market values come from the Credence Research model, which builds spending by application, route of administration, distribution channel and region. Regional and segment splits are Credence Research estimates informed by World Health Organization and U.S. government statistics, FDA decisions, U.S. legislation and company press releases. No primary interviews or surveys were used in preparing this edition of the report.
Child medicine outlook to 2035
By 2035, the pediatric drugs market is projected to reach USD 335.00 billion, with growth led by rare disease therapies, childhood cancer treatments and long-acting biologics. Respiratory treatments will remain the largest application, as asthma stays the most common chronic disease among children. North America keeps the highest spending per child, while Asia Pacific adds the most newly treated patients. Voucher incentives will keep developers focused on small pediatric labels. As a result, advantage will depend on child-specific data, formulations and payer access.
Frequently Asked Questions
How big is the global pediatric drugs market?
Which application leads the pediatric drugs market?
Which region leads spending on child medicines?
Which route of administration leads child medicine use?
What new pediatric approvals did the FDA grant in 2025?
How does the Give Kids a Chance Act affect drug development?
Who are the leading pediatric drug companies?
What restrains growth in pediatric drugs?
Table of Content
Chapter 1 Market Segmentation
- 1.1 Segmentation Framework
- 1.1.1 Product and Service Classification
- 1.1.2 Application and End-Use Classification
- 1.1.3 Technology and Solution Classification
- 1.1.4 Customer and Distribution Channel Classification
- 1.1.5 Geographic Segmentation
- 1.1.6 Market Segment Definitions and Boundaries
- 1.2 By Application
- 1.2.1 Respiratory Disorder Drugs
- 1.2.2 Autoimmune Disorder Drugs
- 1.2.3 Gastrointestinal Drugs
- 1.2.4 Cardiovascular Drugs
- 1.2.5 Neurology & ADHD Drugs
- 1.2.6 Oncology Drugs
- 1.2.7 Other Drug Types
- 1.3 By Route of Administration
- 1.3.1 Oral
- 1.3.2 Topical
- 1.3.3 Parenteral
- 1.3.4 Inhalation
- 1.3.5 Others
Chapter 2 Introduction
- 2.1 Report Objectives and Scope
- 2.2 Product Definition and Industry Terminology
- 2.3 Market Inclusions and Exclusions
- 2.4 Research Process
- 2.4.1 Primary Research and Expert Interviews
- 2.4.2 Secondary Research and Source Review
- 2.4.3 Top-Down and Bottom-Up Estimation
- 2.4.4 Data Triangulation and Verification
- 2.5 Market Size Measurement Basis
- 2.5.1 2025: USD 159.42 billion → 2035: USD 335.00 billion
- 2.6 Historical and Forecast Reference Periods
- 2.6.1 Historical Period: 2018-2025
- 2.6.2 Base Year: 2025
- 2.6.3 Forecast Period: 2025-2035
- 2.7 Research Assumptions and Limitations
Chapter 3 Executive Summary
- 3.1 Market Snapshot and Key Findings
- 3.2 Base-Year Market Size, 2025
- 3.3 Forecast Market Size, 2035
- 3.4 Revenue and Volume Growth Outlook
- 3.5 Key Demand and Supply Indicators
- 3.6 Leading Market Segments
- 3.7 Fastest-Growing Market Opportunities
- 3.8 Regional Performance Highlights
- 3.9 Technology and Industry Transformation
- 3.10 Competitive Landscape Summary
- 3.11 Analyst View and Strategic Implications
Chapter 4 Global Pediatric Drugs Market Trends and Developments
- 4.1 Historical Industry Development, 2018-2025
- 4.2 Recent Market Trends and Developments
- 4.3 Demand and Customer Behavior Trends
- 4.4 Technology and Product Innovation
- 4.5 Artificial Intelligence, Automation and Digitalization
- 4.6 Local Manufacturing and Supply Chain Realignment
- 4.7 Industry Partnerships, Mergers and Acquisitions
- 4.8 Sustainability and Circular Economy Developments
- 4.9 Government and Private Sector Investment Trends
- 4.10 Emerging Business Models and Commercialization
- 4.11 Industry Developments and Announcements
Chapter 5 Global Pediatric Drugs Market Production, Supply and Demand Analysis
- 5.1 Demand Trend and Consumption Analysis, 2018-2025
- 5.2 Demand Forecast, 2025-2035
- 5.3 Production and Output Trend, 2018-2025
- 5.4 Production and Output Forecast, 2025-2035
- 5.5 Installed Capacity and Capacity Utilization
- 5.6 Company-Wise Production Plants and Statistics
- 5.6.1 Installed Production Capacity
- 5.6.2 Actual Production
- 5.6.3 Planned Capacity and Expansion Targets
- 5.7 Supply Chain Structure and Procurement Trends
- 5.8 Supply-Demand Gap and Bottlenecks
- 5.9 Import Dependence and Sourcing Structure
- 5.10 Contract Manufacturing and Outsourcing
- 5.11 Regional Supply and Demand Concentration
Chapter 6 Global Pediatric Drugs Market Pricing Analysis
- 6.1 Pricing Structure and Measurement
- 6.2 Historical Pricing Trends, 2018-2025
- 6.3 Pricing Outlook, 2025-2035
- 6.4 Average Selling Price and Unit Economics
- 6.5 Pricing by Product and Market Segment
- 6.6 Geographic Pricing Differences
- 6.7 Key Input, Energy, Labor and Logistics Costs
- 6.8 Contract Pricing and Purchasing Models
- 6.9 Pricing Sensitivity and Competitive Positioning
- 6.10 Price, Margin and Profitability Implications
Chapter 7 Global Pediatric Drugs Market Dynamics
- 7.1 Market Growth Drivers
- 7.1.1 Demand-Side Drivers
- 7.1.2 Technology and Innovation Drivers
- 7.1.3 Infrastructure and Investment Drivers
- 7.1.4 Regulatory and Policy Drivers
- 7.2 Market Restraints
- 7.2.1 Cost and Affordability Constraints
- 7.2.2 Technology and Adoption Barriers
- 7.2.3 Supply Chain and Operational Constraints
- 7.3 Market Challenges
- 7.3.1 Competitive Pressure and Margin Erosion
- 7.3.2 Skills, Infrastructure and Implementation Gaps
- 7.4 Emerging Market Opportunities
- 7.5 Market Dynamics Impact and Time-Horizon Assessment
Chapter 8 Global Pediatric Drugs Value Chain Analysis
- 8.1 Industry Value Chain Overview
- 8.2 Upstream Suppliers and Critical Inputs
- 8.3 Technology and Component Providers
- 8.4 Manufacturing or Service Delivery
- 8.5 Distribution, Channel Partners and Integrators
- 8.6 Downstream Applications and End Users
- 8.7 Value Addition and Profit Pools
- 8.8 Vertical Integration and Outsourcing
- 8.9 Supplier Concentration and Risk
- 8.10 Supply Chain Localization and Resilience
Chapter 9 Global Pediatric Drugs Market Regulations and Policies
- 9.1 Relevant Laws, Standards and Compliance Frameworks
- 9.2 Product, Service, Safety and Quality Requirements
- 9.3 Government Policies, Incentives and Subsidies
- 9.4 Imports, Exports and Trade Barriers
- 9.5 Public Procurement and Local Content Requirements
- 9.6 Environmental and Sustainability Compliance
- 9.7 Upcoming Policy Changes and Market Implications
Chapter 10 Global Pediatric Drugs Market Hotspots and Opportunities
- 10.1 Market Opportunity Mapping and Growth Hotspots
- 10.2 High-Growth Applications and Customer Groups
- 10.3 Underserved Markets and White-Space Opportunities
- 10.4 Emerging Technology and Product Opportunities
- 10.5 New Capacity and Investment Hotspots
- 10.6 Market Entry and Expansion Opportunities
- 10.7 Distribution and Partnership Opportunities
- 10.8 Near-Term and Long-Term Commercial Potential
- 10.9 Opportunity Attractiveness and Execution Risks
Chapter 11 Global Pediatric Drugs Market Outlook, 2025-2035
- 11.1 Market Size and Analysis
- 11.1.1 Revenue (Market Measurement: 2025: USD 159.42 billion → 2035: USD 335.00 billion)
- 11.1.2 Market Volume and Quantity Sold
- 11.1.3 Historical Market Size, 2018-2025
- 11.1.4 Base-Year Market Size, 2025
- 11.2 Market Forecast, 2025-2035
- 11.2.1 Revenue Forecast to 2035
- 11.2.2 Volume Forecast to 2035
- 11.2.3 CAGR and Year-on-Year Growth
- 11.2.4 Incremental Revenue Opportunity
- 11.3 Forecast Assumptions and Scenario Analysis
- 11.3.1 Base-Case Forecast
- 11.3.2 Optimistic and Conservative Scenarios
- 11.3.3 Technology, Pricing and Policy Sensitivities
- 11.4 Market Attractiveness and Growth Outlook
Chapter 12 Global Pediatric Drugs Market Segmentation and Outlook
- 12.1 Segmentation Summary and Market Shares, 2025
- 12.2 Largest and Fastest-Growing Segments
- 12.3 By Application - Market Size and Forecast, 2025-2035
- 12.3.1 Segment Definition and Scope
- 12.3.2 Historical Market Size, 2018-2025
- 12.3.3 Revenue Forecast, 2025-2035
- 12.3.4 Volume Forecast, 2025-2035
- 12.3.5 Base-Year Market Share, 2025
- 12.3.6 Segment CAGR and Growth Drivers
- 12.3.7 Subsegment Market Size and Forecast
- 12.3.7.1 Respiratory Disorder Drugs
- 12.3.7.2 Autoimmune Disorder Drugs
- 12.3.7.3 Gastrointestinal Drugs
- 12.3.7.4 Cardiovascular Drugs
- 12.3.7.5 Neurology & ADHD Drugs
- 12.3.7.6 Oncology Drugs
- 12.3.7.7 Other Drug Types
- 12.3.8 Subsegment Pricing and Adoption Trends
- 12.3.9 Leading Suppliers and Competition
- 12.3.10 Regional Demand and Opportunities
- 12.4 By Route of Administration - Market Size and Forecast, 2025-2035
- 12.4.1 Segment Definition and Scope
- 12.4.2 Historical Market Size, 2018-2025
- 12.4.3 Revenue Forecast, 2025-2035
- 12.4.4 Volume Forecast, 2025-2035
- 12.4.5 Base-Year Market Share, 2025
- 12.4.6 Segment CAGR and Growth Drivers
- 12.4.7 Subsegment Market Size and Forecast
- 12.4.7.1 Oral
- 12.4.7.2 Topical
- 12.4.7.3 Parenteral
- 12.4.7.4 Inhalation
- 12.4.7.5 Others
- 12.4.8 Subsegment Pricing and Adoption Trends
- 12.4.9 Leading Suppliers and Competition
- 12.4.10 Regional Demand and Opportunities
- 12.5 Segment Growth Comparison
- 12.6 Segment Attractiveness and Priority Matrix
Chapter 13 Global Pediatric Drugs End-Use and Application Market Outlook
- 13.1 End-Use Industry and Customer Demand Structure
- 13.2 Leading Applications and Customer Groups
- 13.3 End-Use Market Size, Share and Forecast
- 13.4 Major End-Use Industry Deep Dives
- 13.4.1 Customer Requirements and Use Cases
- 13.4.2 Demand and Replacement Cycles
- 13.4.3 Technical and Regulatory Considerations
- 13.4.4 Purchasing and Procurement Models
- 13.4.5 Leading Vendors and Distribution Channels
- 13.4.6 Forecast and Commercial Opportunities
- 13.5 Emerging Applications and Cross-Segment Demand
- 13.6 End-Use Industry Investment Priorities
Chapter 14 Global Pediatric Drugs Geographic Market Outlook, 2025-2035
- 14.1 Regional Market Size and Share, 2025
- 14.2 Regional Market Forecast, 2025-2035
- 14.3 Regional Pricing, Production and Demand Differences
- 14.4 North America
- 14.4.1 United States
- 14.4.2 Canada
- 14.4.3 Mexico
- 14.5 Europe
- 14.5.1 Germany
- 14.5.2 France
- 14.5.3 Italy
- 14.5.4 United Kingdom
- 14.5.5 Spain
- 14.5.6 Poland
- 14.5.7 Russia
- 14.5.8 Netherlands
- 14.5.9 Belgium
- 14.5.10 Sweden
- 14.5.11 Denmark
- 14.5.12 Norway
- 14.5.13 Rest of Europe
- 14.6 Asia Pacific
- 14.6.1 China
- 14.6.2 India
- 14.6.3 Japan
- 14.6.4 South Korea
- 14.6.5 Thailand
- 14.6.6 Indonesia
- 14.6.7 Vietnam
- 14.6.8 Malaysia
- 14.6.9 Australia
- 14.6.10 Rest of Asia Pacific
- 14.7 Latin America
- 14.7.1 Brazil
- 14.7.2 Argentina
- 14.7.3 Colombia
- 14.7.4 Chile
- 14.7.5 Rest of Latin America
- 14.8 Middle East
- 14.8.1 Saudi Arabia
- 14.8.2 United Arab Emirates
- 14.8.3 Turkey
- 14.8.4 Israel
- 14.8.5 Iran
- 14.8.6 Rest of the Middle East
- 14.9 Africa
- 14.9.1 South Africa
- 14.9.2 Egypt
- 14.9.3 Nigeria
- 14.9.4 Morocco
- 14.9.5 Rest of Africa
- 14.10 Regional Investment, Policy and Supply Chain Differences
- 14.11 Regional Competitive Landscape
- 14.12 Geographic Growth Hotspots
Chapter 15 Global Pediatric Drugs Technology, Innovation and Sustainability Outlook
- 15.1 Technology Landscape and Maturity
- 15.2 Product, Process and Service Innovation
- 15.3 AI, Automation and Digital Tools in the Industry
- 15.4 Technology Adoption and Performance Benchmarking
- 15.5 Innovation Pipeline and R&D Investment
- 15.6 Patent and Intellectual Property Trends
- 15.7 Energy Efficiency and Resource Management
- 15.8 Sustainability, Recycling and Circularity
- 15.9 Technology Roadmap, 2025-2035
- 15.10 Risks of Obsolescence and Technology Substitution
Chapter 16 Global Pediatric Drugs Market Key Strategic Imperatives
- 16.1 Growth and Market Entry Priorities
- 16.2 High-Return Products and Segments
- 16.3 Pricing, Profitability and Cost Optimization
- 16.4 Technology Investment and Product Differentiation
- 16.5 Supply Chain Localization and Resilience
- 16.6 Distribution and Customer Acquisition
- 16.7 Partnership, Acquisition and Capacity Strategy
- 16.8 Regional Expansion Priorities
- 16.9 Short-, Medium- and Long-Term Actions
Chapter 17 Competition Outlook
- 17.1 Industry Competition Characteristics
- 17.2 Market Structure and Concentration
- 17.3 Market Share and Competitive Positioning, 2025
- 17.4 Company-Wise Revenue and Product Benchmarking
- 17.5 Production and Service Capacity Benchmarking
- 17.6 Technology, Pricing and Differentiation
- 17.7 Regional Footprint and Distribution Strength
- 17.8 Mergers, Acquisitions and Strategic Alliances
- 17.9 New Entrants and Competitive Threats
- 17.10 Porter's Five Forces and Industry Attractiveness
- 17.11 Competitive Outlook, 2025-2035
Chapter 18 Company Profiles
- 18.1 Company Coverage and Selection Criteria
- 18.2 Pfizer Inc.
- 18.2.1 Business Description
- 18.2.2 Company Ownership and Geographic Presence
- 18.2.3 Product and Service Portfolio
- 18.2.4 Manufacturing and Operating Footprint
- 18.2.5 Production Capacity and Expansion Plans
- 18.2.6 Financial Performance and Investment
- 18.2.7 Market Share and Competitive Position
- 18.2.8 Technology and Innovation Capabilities
- 18.2.9 Strategic Alliances or Partnerships
- 18.2.10 Recent Developments
- 18.2.11 Growth Strategy and Outlook
- 18.3 Johnson & Johnson Services Inc.
- 18.4 GlaxoSmithKline plc
- 18.5 Sanofi SA
- 18.6 Novartis AG
- 18.7 PTC Therapeutics Inc.
- 18.8 BioMarin Pharmaceutical Inc.
- 18.9 Horizon Therapeutics plc
- 18.10 Jazz Pharmaceuticals plc
- 18.11 Gilead Sciences Inc.
- 18.12 Sumitomo Pharma Co. Ltd.
- 18.13 Boehringer Ingelheim GmbH
- 18.14 Other Relevant Market Participants
Note: Every listed company is profiled on the structure shown under the first company. The company list is preliminary and may change based on research findings, market developments, data availability and client requirements.
Chapter 19 Disclaimer
- 19.1 Research and Forecast Disclaimer
- 19.2 Data Source and Estimation Limitations
Note: The depth of individual sections depends on data availability for this market. Volume, capacity, trade and other unit-based metrics are included where applicable.

