
RNA drugs, genomics and testing anchor regional demand
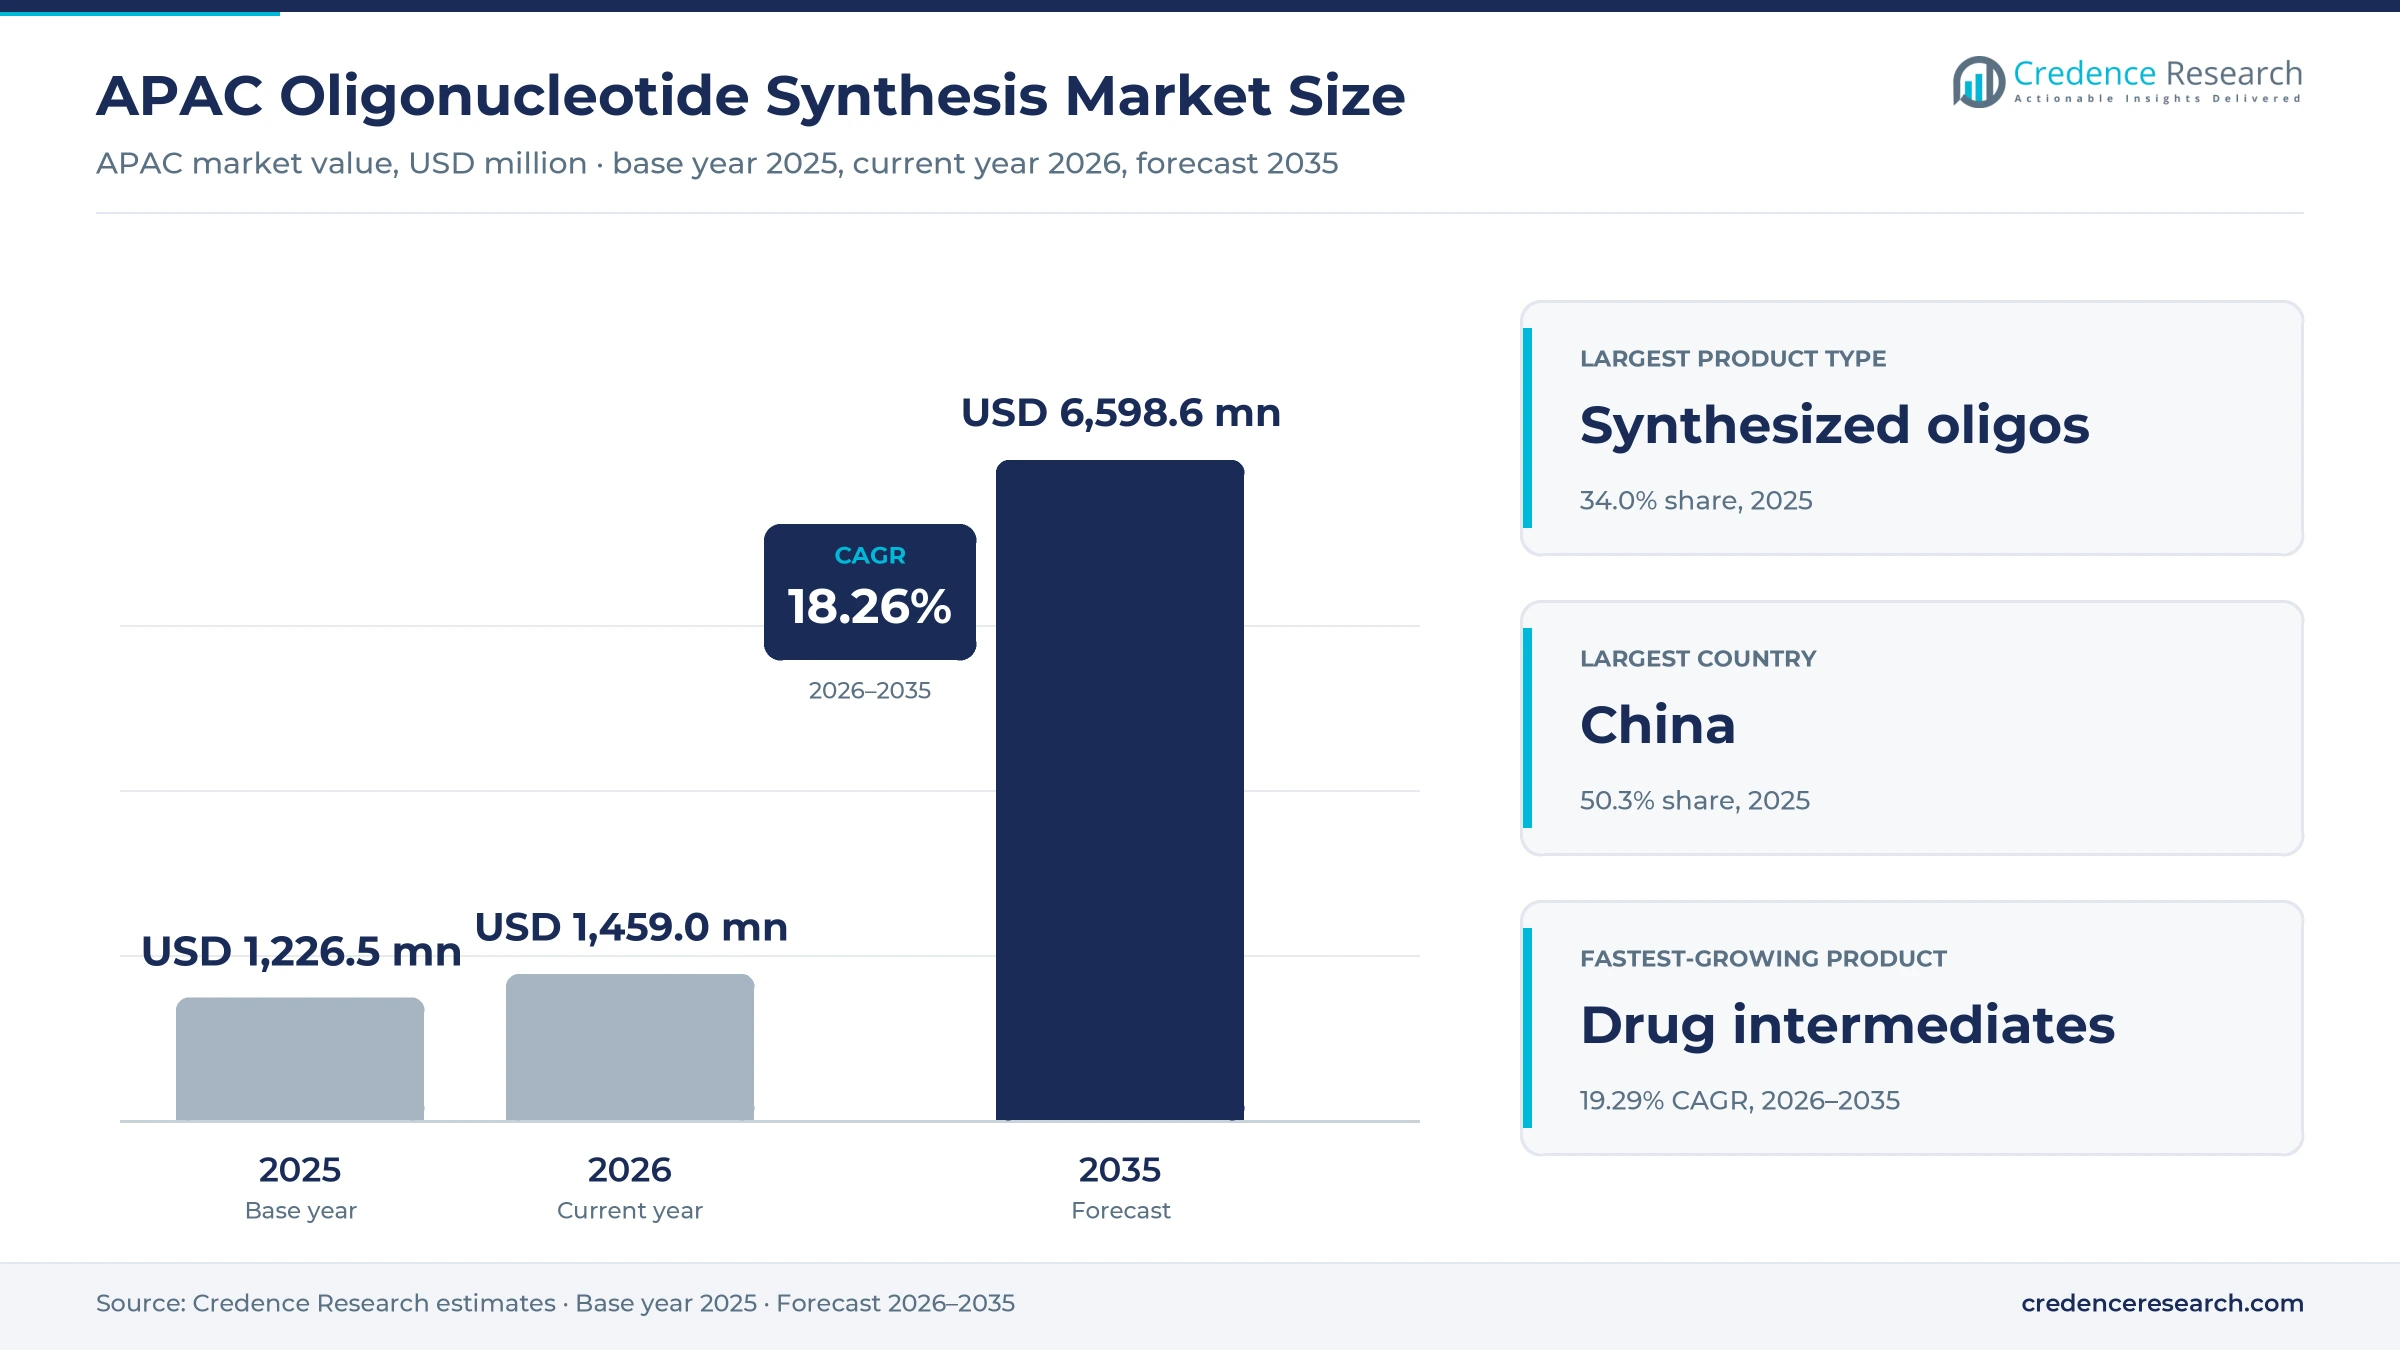
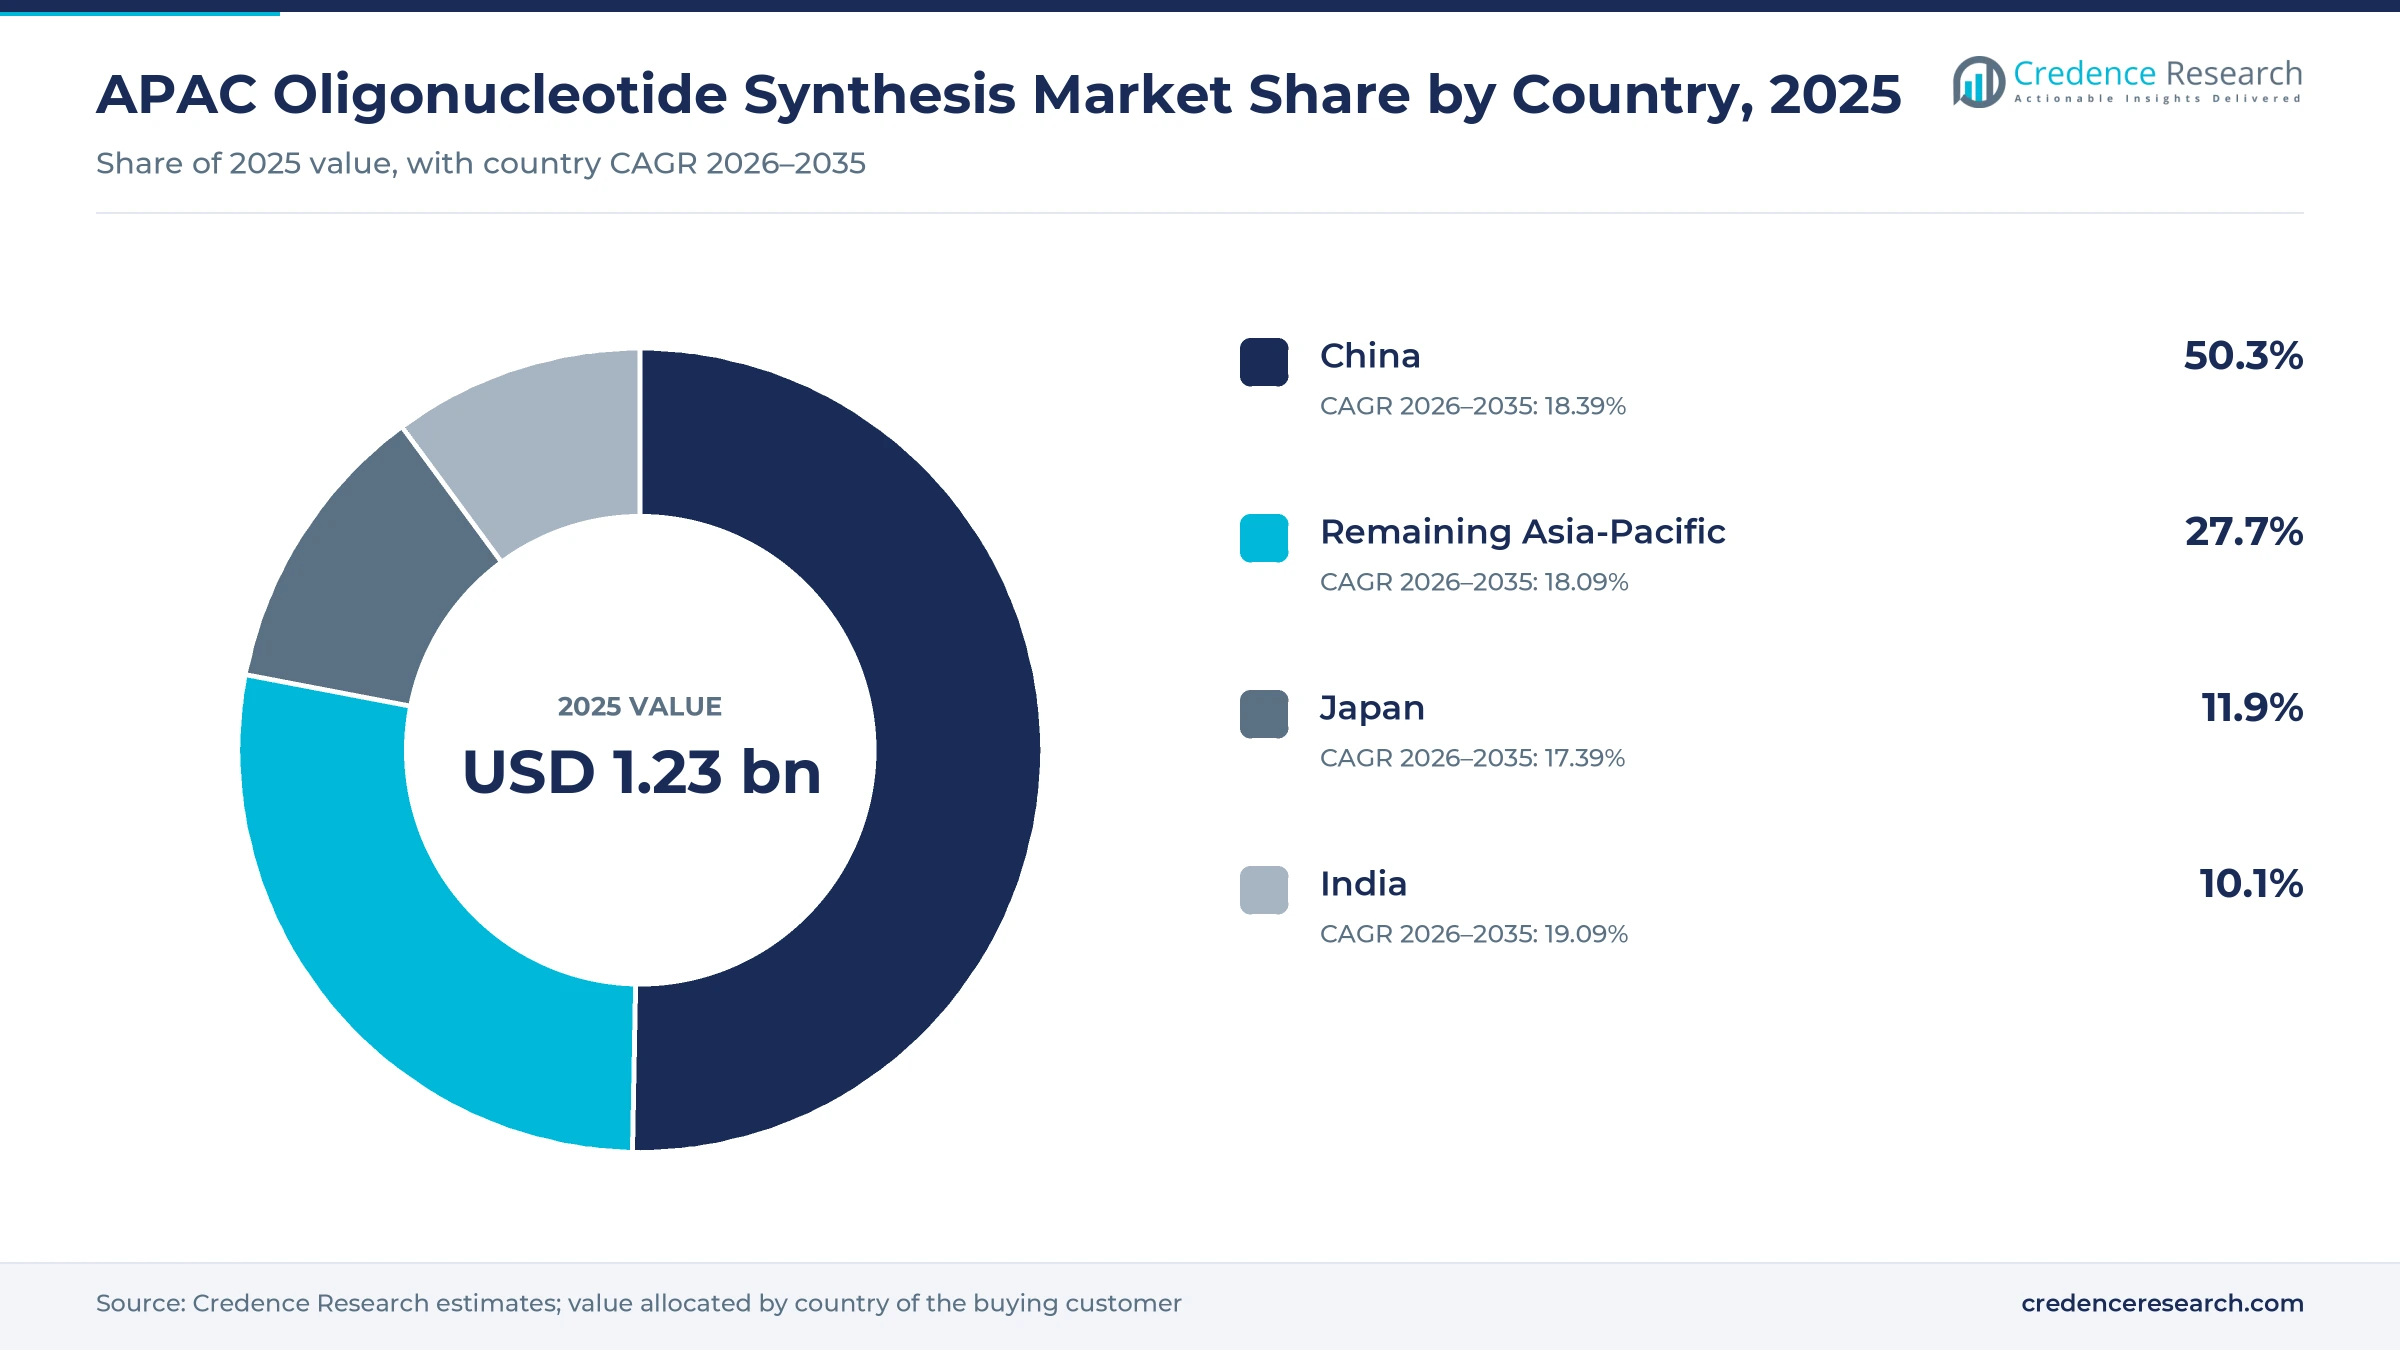
The APAC oligonucleotide synthesis market was valued at USD 1.23 billion in 2025 and is projected to increase from USD 1.46 billion in 2026 to USD 6.60 billion by 2035, registering a CAGR of 18.26% during 2026–2035. Demand comes from drug developers that make antisense and small interfering RNA medicines, research labs that order primers and probes, and diagnostic makers that build PCR test kits. China held the largest country share, 50.3% in 2025, because it has the largest base of contract manufacturers, primer suppliers and test kit makers in the region. India is the fastest-growing country at 19.09% a year, as genome programs and contract manufacturing expand. Japan and the rest of the region add demand from pharmaceutical research and specialist manufacturing. China approved an RNA interference drug for familial chylomicronemia syndrome in January 2026, which adds commercial drug volumes to research demand.
Which products and services does the regional estimate cover?
The estimate measures the value of oligonucleotide drug intermediates, synthesized oligonucleotides, reagents and consumables, and equipment and synthesizers sold to buyers in the Asia-Pacific region. It covers therapeutic manufacturing, research workflows and molecular diagnostics across the whole region. Values are measured at the first point of sale to the buying company, laboratory or institute.
The estimate excludes finished drug products, full diagnostic kits and long gene fragments sold as gene synthesis services. The value chain runs from phosphoramidite, solid support and solvent suppliers through custom primer makers, contract manufacturers and instrument makers to drug developers, universities, hospitals and diagnostic laboratories across China, Japan, India and the rest of the region.
APAC Oligonucleotide Synthesis Market Insights
- The APAC oligonucleotide synthesis market was valued at USD 1.23 billion in 2025 and is projected to reach USD 6.60 billion by 2035, registering a CAGR of 18.26% during 2026–2035.
- China held a 50.3% share of 2025 value, because it hosts the largest base of primer suppliers, contract manufacturers and test kit makers.
- Synthesized oligonucleotides led product demand with a 34.0% share of 2025 value, because research labs order primers and probes every day.
- India released 10,000 whole genome sequences through its national genome program on Jan. 15, 2025, which widens sequencing and primer demand.
- WuXi AppTec said its total solid-phase reactor scale for these molecules exceeded 8 mol, with two more Chinese plants due in 2027.
Custom oligos lead while drug intermediates grow fastest
Why do custom synthesized oligos lead the product mix?
Based on product type, the market is categorized into oligonucleotide drug intermediates, synthesized oligonucleotides, reagents and consumables, and equipment and synthesizers. Synthesized Oligonucleotides led with a 34.0% share of 2025 value, because research and test labs order primers and probes in large volumes. Oligonucleotide Drug Intermediates grow fastest at 19.29% a year, as RNA medicines move from trials to commercial supply.
How does therapeutic manufacturing change application demand?
Based on application, the market is categorized into therapeutic manufacturing, research workflows and molecular diagnostics. Research Workflows led with a 40.0% share of 2025 value, because universities, biotech companies and sequencing labs order primers, probes and guide RNA every week. Therapeutic Manufacturing grows fastest at 19.15% a year, as contract manufacturers add GMP capacity for RNA drugs.
Why do drug developers lead end-user demand?
Based on end user, the market is categorized into pharmaceutical and biotechnology companies, academic and research institutes, CROs and CDMOs, and diagnostic laboratories. Pharmaceutical and Biotechnology Companies led with a 44.0% share of 2025 value, because they buy research oligos and clinical batches. CROs and CDMOs grow fastest at 19.20% a year, as drug developers hand more contract development and manufacturing work to regional partners.
How do new chemistries challenge column-based methods?
Based on technology, the market is categorized into column-based solid-phase synthesis, array-based synthesis, liquid-phase synthesis and enzymatic and hybrid synthesis. Column-Based Solid-Phase Synthesis led with a 62.0% share of 2025 value, because it is the proven route for primers and drug batches. Enzymatic and Hybrid Synthesis grows fastest at 19.60% a year, as makers seek routes that use less solvent and handle longer sequences.
| Segment Group | Leading Sub-segment | Share, 2025 | Fastest-growing Sub-segment | CAGR, 2026–2035 |
|---|---|---|---|---|
| By Product Type | Synthesized Oligonucleotides | 34.0% | Oligonucleotide Drug Intermediates | 19.29% |
| By Application | Research Workflows | 40.0% | Therapeutic Manufacturing | 19.15% |
| By End User | Pharmaceutical and Biotechnology Companies | 44.0% | CROs and CDMOs | 19.20% |
| By Technology | Column-Based Solid-Phase Synthesis | 62.0% | Enzymatic and Hybrid Synthesis | 19.60% |
Request a Free Sample
Fill in your details and we'll send you a free sample report.
- Sample data tables & charts
- Research methodology
Drug output, genome programs and local testing lift use
How does therapeutic manufacturing expansion lift demand?
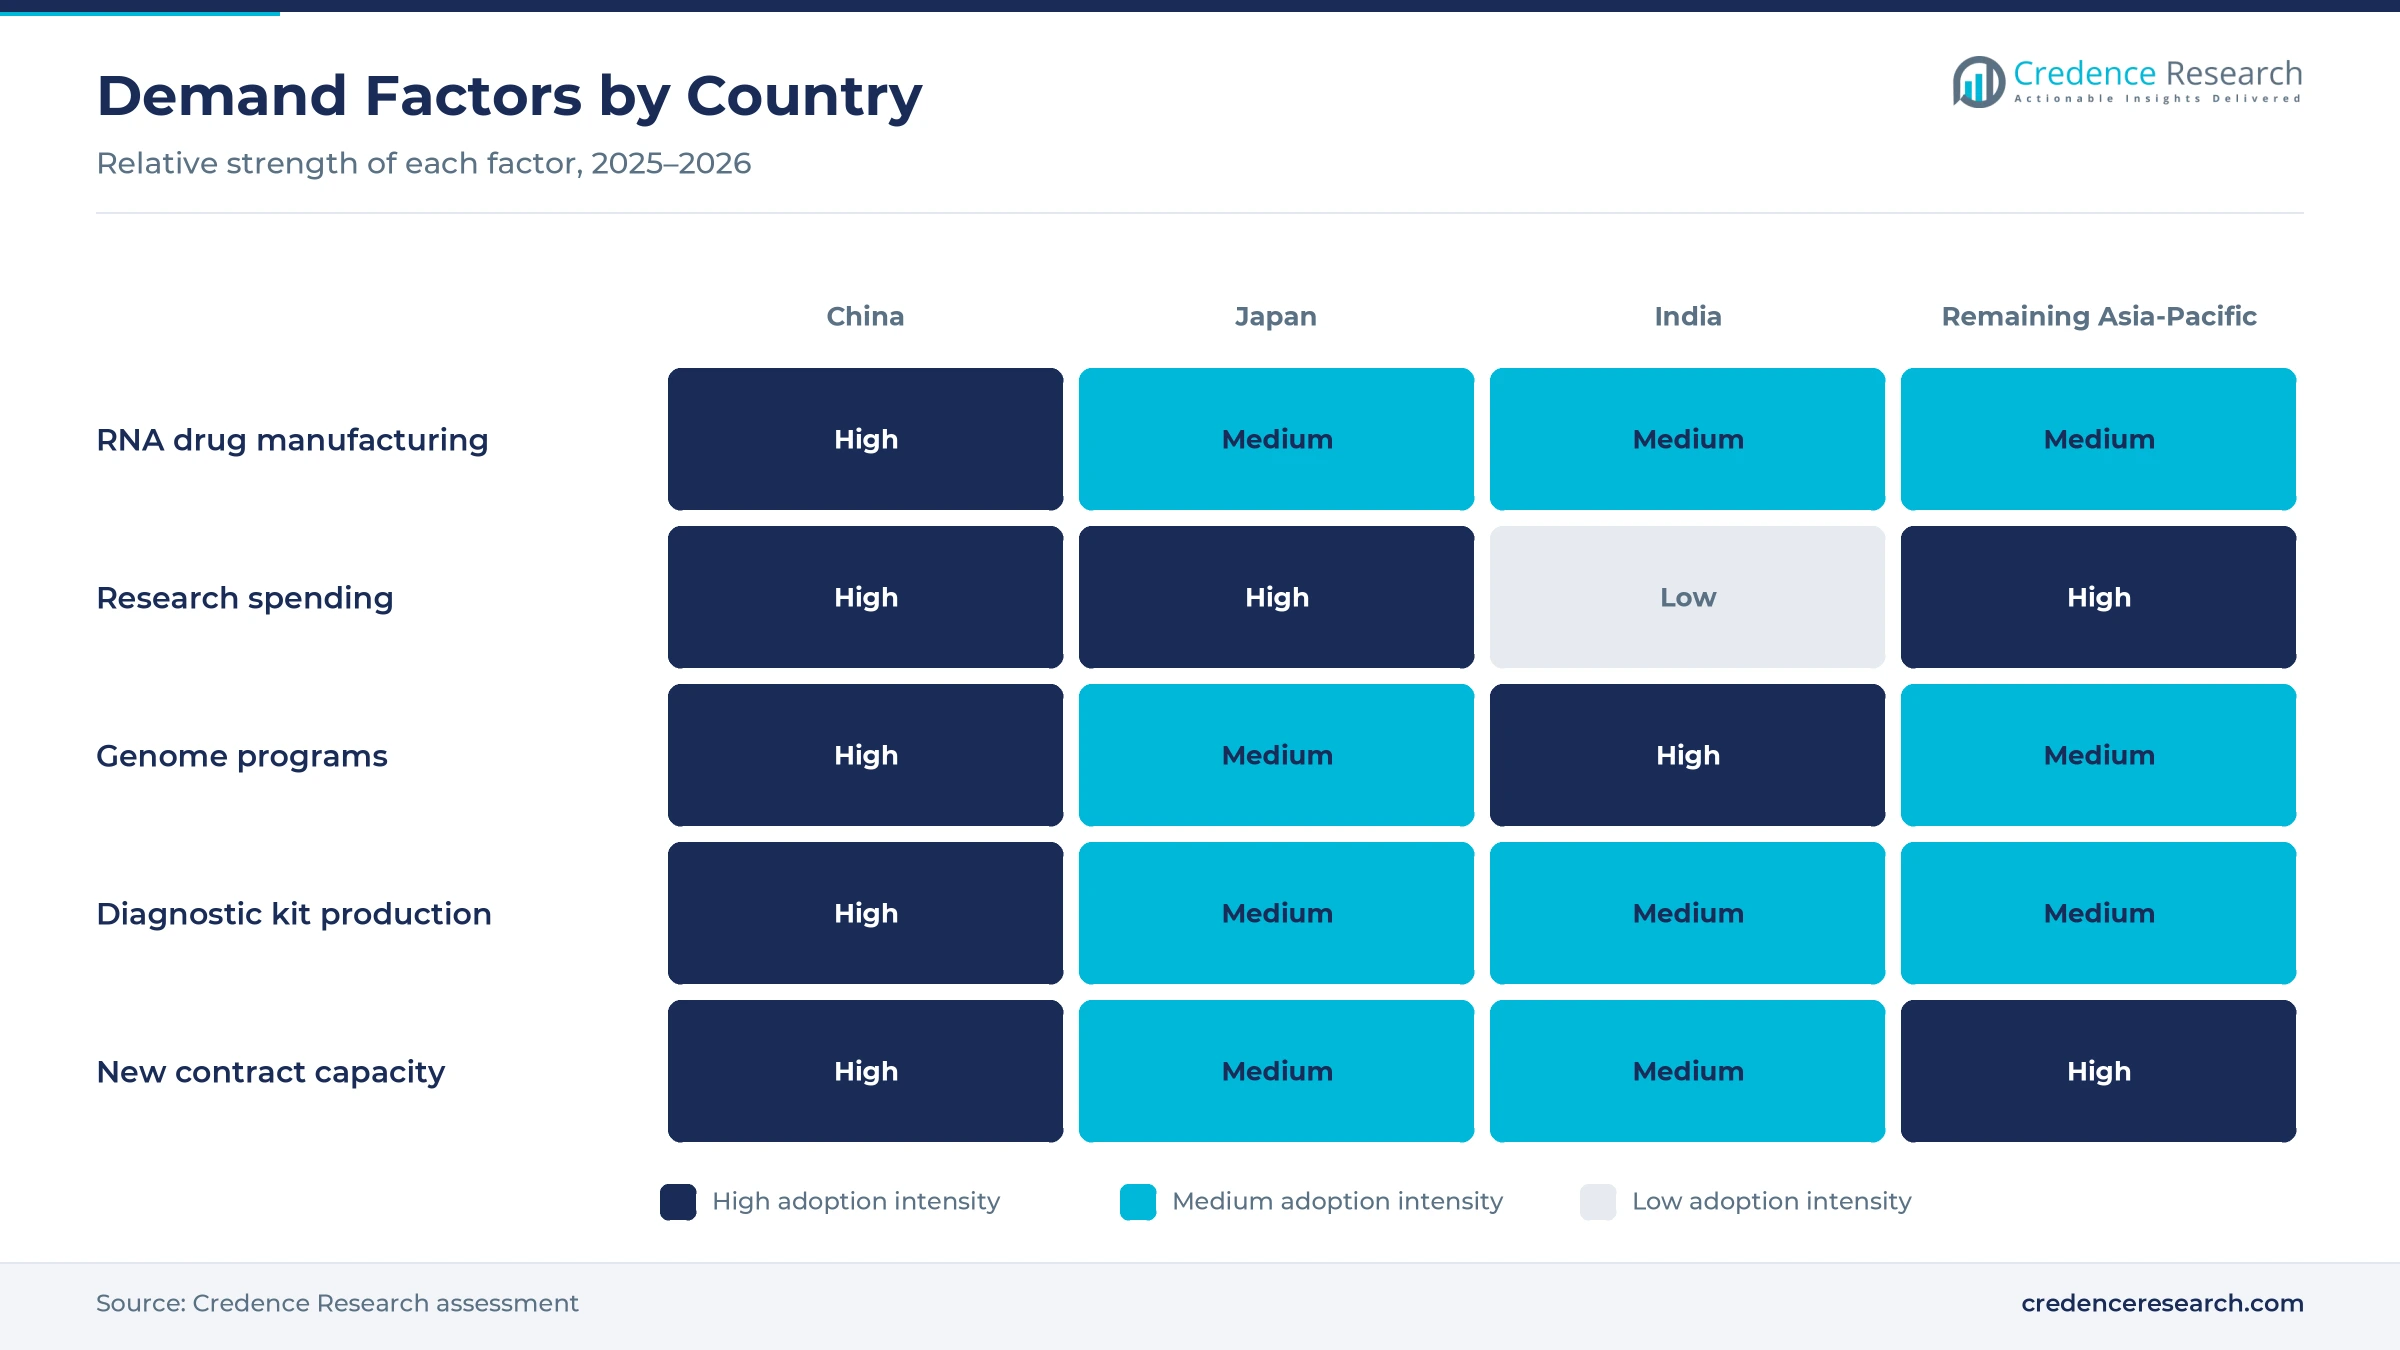
Therapeutic manufacturing expansion lifts demand, because each approved RNA medicine needs kilogram batches of high-purity drug substance. China approved the small interfering RNA drug Redemplo for familial chylomicronemia syndrome, which Arrowhead announced on Jan. 7, 2026, according to the company release. The drug is injected once every three months, which creates steady repeat demand for the active ingredient. WuXi AppTec said its total solid-phase reactor scale for these molecules exceeded 8 mol, according to a company interview published on May 19, 2026. It also has two more plants in Taixing due in 2027. As a result, oligonucleotide drug intermediates grow at 19.29% a year, the fastest product rate.
Why do population genomics programs widen research use?
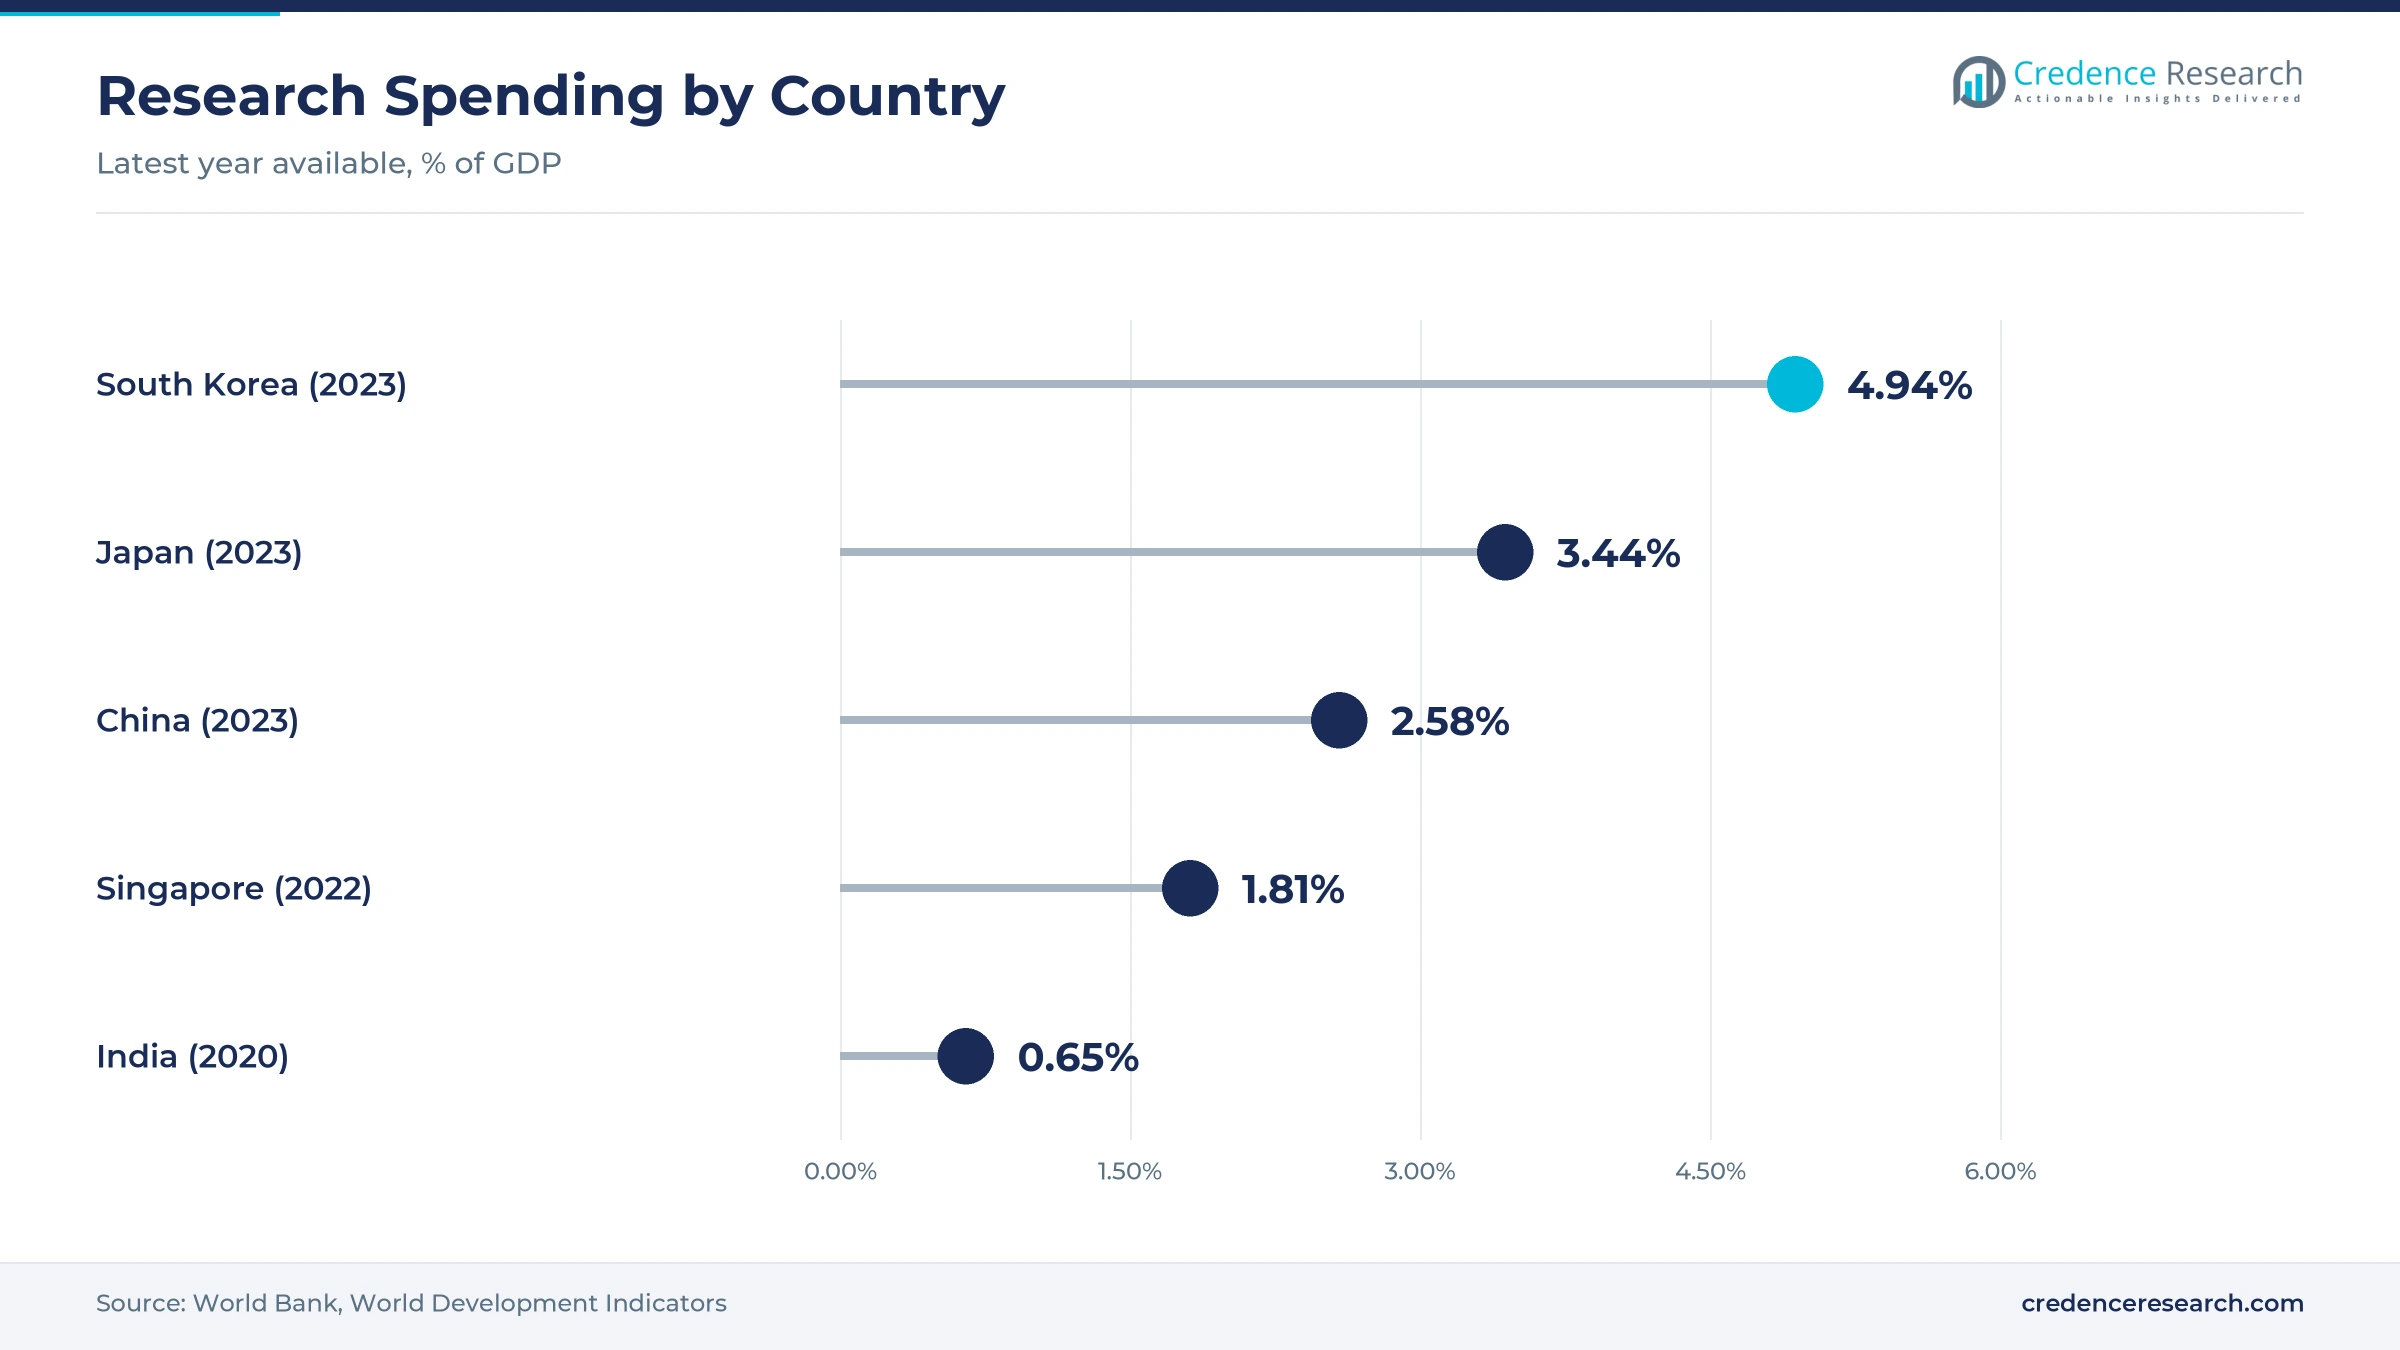
Population genomics and research workflows widen use, because sequencing projects need primers, probes, adapters and capture baits for every sample. India released 10,000 whole genome sequences under its national genome program on Jan. 15, 2025, according to a policy summary, and archived them at the Indian Biological Data Centre. Chinese researchers also proposed a second human genome project in September 2024 that would sequence about 80 million people from more than 100 countries. Research spending is high across the region, at 4.94% of GDP in South Korea and 3.44% in Japan in 2023, according to World Bank data. In turn, research workflows hold a 40.0% share of 2025 value.
How does diagnostic workflow localization raise local sourcing?
Diagnostic workflow localization raises local sourcing, because test kit makers now compete on price in national and provincial tenders. China launched centralized volume-based procurement for diagnostic tests in 2022, according to trade press reporting. An Anhui-led alliance of 25 provinces covers reagents, including HPV PCR typing tests, rather than instruments. In those provinces, about 80% to 90% of market share typically goes to the awarded companies, which favors suppliers with low costs. Domestic makers such as Maccura Biotechnology won contracts in that program. As a result, test kit makers buy more primers and probes from regional suppliers such as Sangon Biotech, which supplies DNA synthesis services for research and diagnostic customers.
Why does regional custom supply capacity speed adoption?
Regional custom supply capacity speeds adoption, because labs want primers and probes delivered in days rather than weeks. GenScript opened a 91,310 sq. ft. life science building in Zhenjiang, China, in May 2023 that makes DNA oligos up to 200 bases and RNA oligos up to 180 bases. Integrated DNA Technologies opened a custom nucleic acid plant in Singapore in July 2013 for 11 regional markets, from Malaysia and Indonesia to Vietnam and Sri Lanka. Thermo Fisher Scientific sells custom DNA oligos with modified bases, custom RNAi oligos and synthetic guide RNA in China. In turn, synthesized oligonucleotides keep a 34.0% share of 2025 value, because local supply shortens research cycles.
Greener chemistry and new hubs reshape regional supply
How is the shift to greener chemistry changing production?
The shift to greener chemistry is changing production, because classic solid-phase routes use large volumes of solvent and reagents for each gram of product. Ajinomoto Bio-Pharma Services offers its AJIPHASE liquid-phase platform for peptides and oligonucleotides, which it says creates less waste than solid-phase methods. The company runs contract sites in Japan and India, among 4 site locations it lists worldwide. WuXi AppTec also uses thin film evaporation, continuous flow chromatography and biocatalytic fragment ligation to handle longer sequences with less solvent. Its interview listed 2 new Taixing plants and 1 Singapore site under construction. As a result, enzymatic and hybrid synthesis grows at 19.60% a year, the fastest technology rate.
Why is the rise of RNA drug partnerships gaining weight?
The rise of RNA drug partnerships is gaining weight, because global drug companies now license Chinese rights to late-stage RNA medicines. Sanofi bought the Greater China rights to plozasiran from Visirna, a majority-owned Arrowhead subsidiary, in 2025. The approval in China triggers a $10 million milestone payment from Sanofi to Visirna under that agreement. The drug targets apoC-III, a liver protein that raises triglyceride levels, and is given once every three months. In turn, more clinical and commercial batches of RNA interference therapies need regional contract supply, which lifts demand for GMP drug intermediates and analytical testing services in China.
Can southeast Asian manufacturing hubs open new capacity?
Southeast Asian manufacturing hubs open new capacity, because drug developers want supply outside China to spread their risk. WuXi AppTec is building a Singapore site for these molecules, peptides and conjugate drug substances, with Phase I operations expected in 2027 and its first plant in 2028. Integrated DNA Technologies has run a Singapore plant since 2013 that served 11 regional markets at opening, which shows that the city can support custom nucleic acid supply. Singapore spent 1.81% of GDP on research in 2022, according to World Bank data. As a result, the remaining Asia-Pacific countries, with a 27.7% share of 2025 value, can win more GMP and research supply contracts.
Is there room for growth in Korean bioprocess supply?
Korean bioprocess supply creates room for growth, because the country combines high research spending with large biologics plants. MilliporeSigma, the U.S. and Canada life science business of Merck KGaA, announced a new Daejeon site worth more than 300 million euros on March 20, 2024. The site will make cell culture media, process liquids and small-scale pre-GMP materials, and it is expected to add about 300 jobs by the end of 2028. South Korea also spent 4.94% of GDP on research in 2023, the highest rate among the countries in this report. In turn, regional supply of reagents and consumables for mRNA medicines and gene editing can expand alongside drug substance work.
Price cuts, purity demands and IP rules weigh on suppliers
How do procurement price cuts squeeze diagnostic suppliers?
Procurement price cuts squeeze diagnostic suppliers, because volume-based tenders award most volume to the lowest bids. Test kit makers then push primer and probe suppliers for lower prices on every order. As a result, smaller suppliers with high costs can lose customers to large regional producers. Suppliers respond with automated plate synthesis, larger batch sizes and long-term supply agreements that protect volume while cutting unit costs.
Why do purity and impurity rules raise GMP costs?
Purity and impurity rules raise GMP costs, because drug regulators require close control of shortened sequences and other process impurities. Each new RNA drug needs validated analytical methods, stability data and process records. In turn, contract manufacturers must invest in purification columns, mass spectrometry and quality staff before they win commercial work. Suppliers respond by sharing platform methods across projects and building dedicated GMP suites for late-stage programs.
How does raw material concentration add supply risk?
Raw material concentration adds supply risk, because a small number of companies make most phosphoramidites, solid supports and specialty reagents. A plant outage or export rule change can delay batches for weeks or months. As a result, drug developers ask contract manufacturers to qualify second sources for key inputs. Suppliers respond with regional raw material plants, larger safety stocks and multi-year agreements with chemical suppliers.
Why do patent and licensing rules slow some programs?
Patent and licensing rules slow some programs, because chemistries, delivery conjugates and sequences for antisense drugs are often protected by global patents. Regional developers must license these rights or design around them before they can scale production. In turn, some follow-on and generic projects wait until patents expire. Companies respond with licensing deals, new conjugate designs and partnerships with global drug owners.
China leads while India grows fastest
| Country | Value, 2025 (USD billion) | Share, 2025 | CAGR, 2026–2035 |
|---|---|---|---|
| China | 0.62 | 50.3% | 18.39% |
| Remaining Asia-Pacific | 0.34 | 27.7% | 18.09% |
| Japan | 0.15 | 11.9% | 17.39% |
| India | 0.12 | 10.1% | 19.09% |
Why does China hold the largest share?
China held a 50.3% share of 2025 value and grows at 18.39% a year, because the country has the largest base of contract manufacturers, primer suppliers and test kit makers in the region. China spent 2.58% of GDP on research in 2023, up from 2.38% in 2021. WuXi AppTec is adding two plants in Taixing, while Sangon Biotech and GenScript supply custom oligos to research and diagnostic labs across the country.
How does Japan support specialist demand?
Japan held an 11.9% share of 2025 value and grows at 17.39% a year, because its drug companies run large research programs and buy high-purity oligos for clinical work. Japan spent 3.44% of GDP on research in 2023, among the highest rates in the region. Ajinomoto Bio-Pharma Services runs a contract site in Japan that offers liquid-phase manufacturing, which supports local demand for greener routes.
Why is India the fastest-growing country?
India held a 10.1% share of 2025 value and grows fastest at 19.09% a year, because its national genome program and contract manufacturing base are expanding together. The country released 10,000 whole genome sequences in January 2025, which supports follow-up studies that need primers and probes. Ajinomoto Bio-Pharma Services also runs a site in India, which adds regional manufacturing options for drug developers.
What shapes demand in the remaining Asia-Pacific countries?
The remaining Asia-Pacific countries held a 27.7% share of 2025 value and grow at 18.09% a year. South Korea adds demand from biologics plants and high research spending, while Singapore hosts custom nucleic acid supply and new contract manufacturing capacity. Australia also adds research demand from universities and medical institutes.
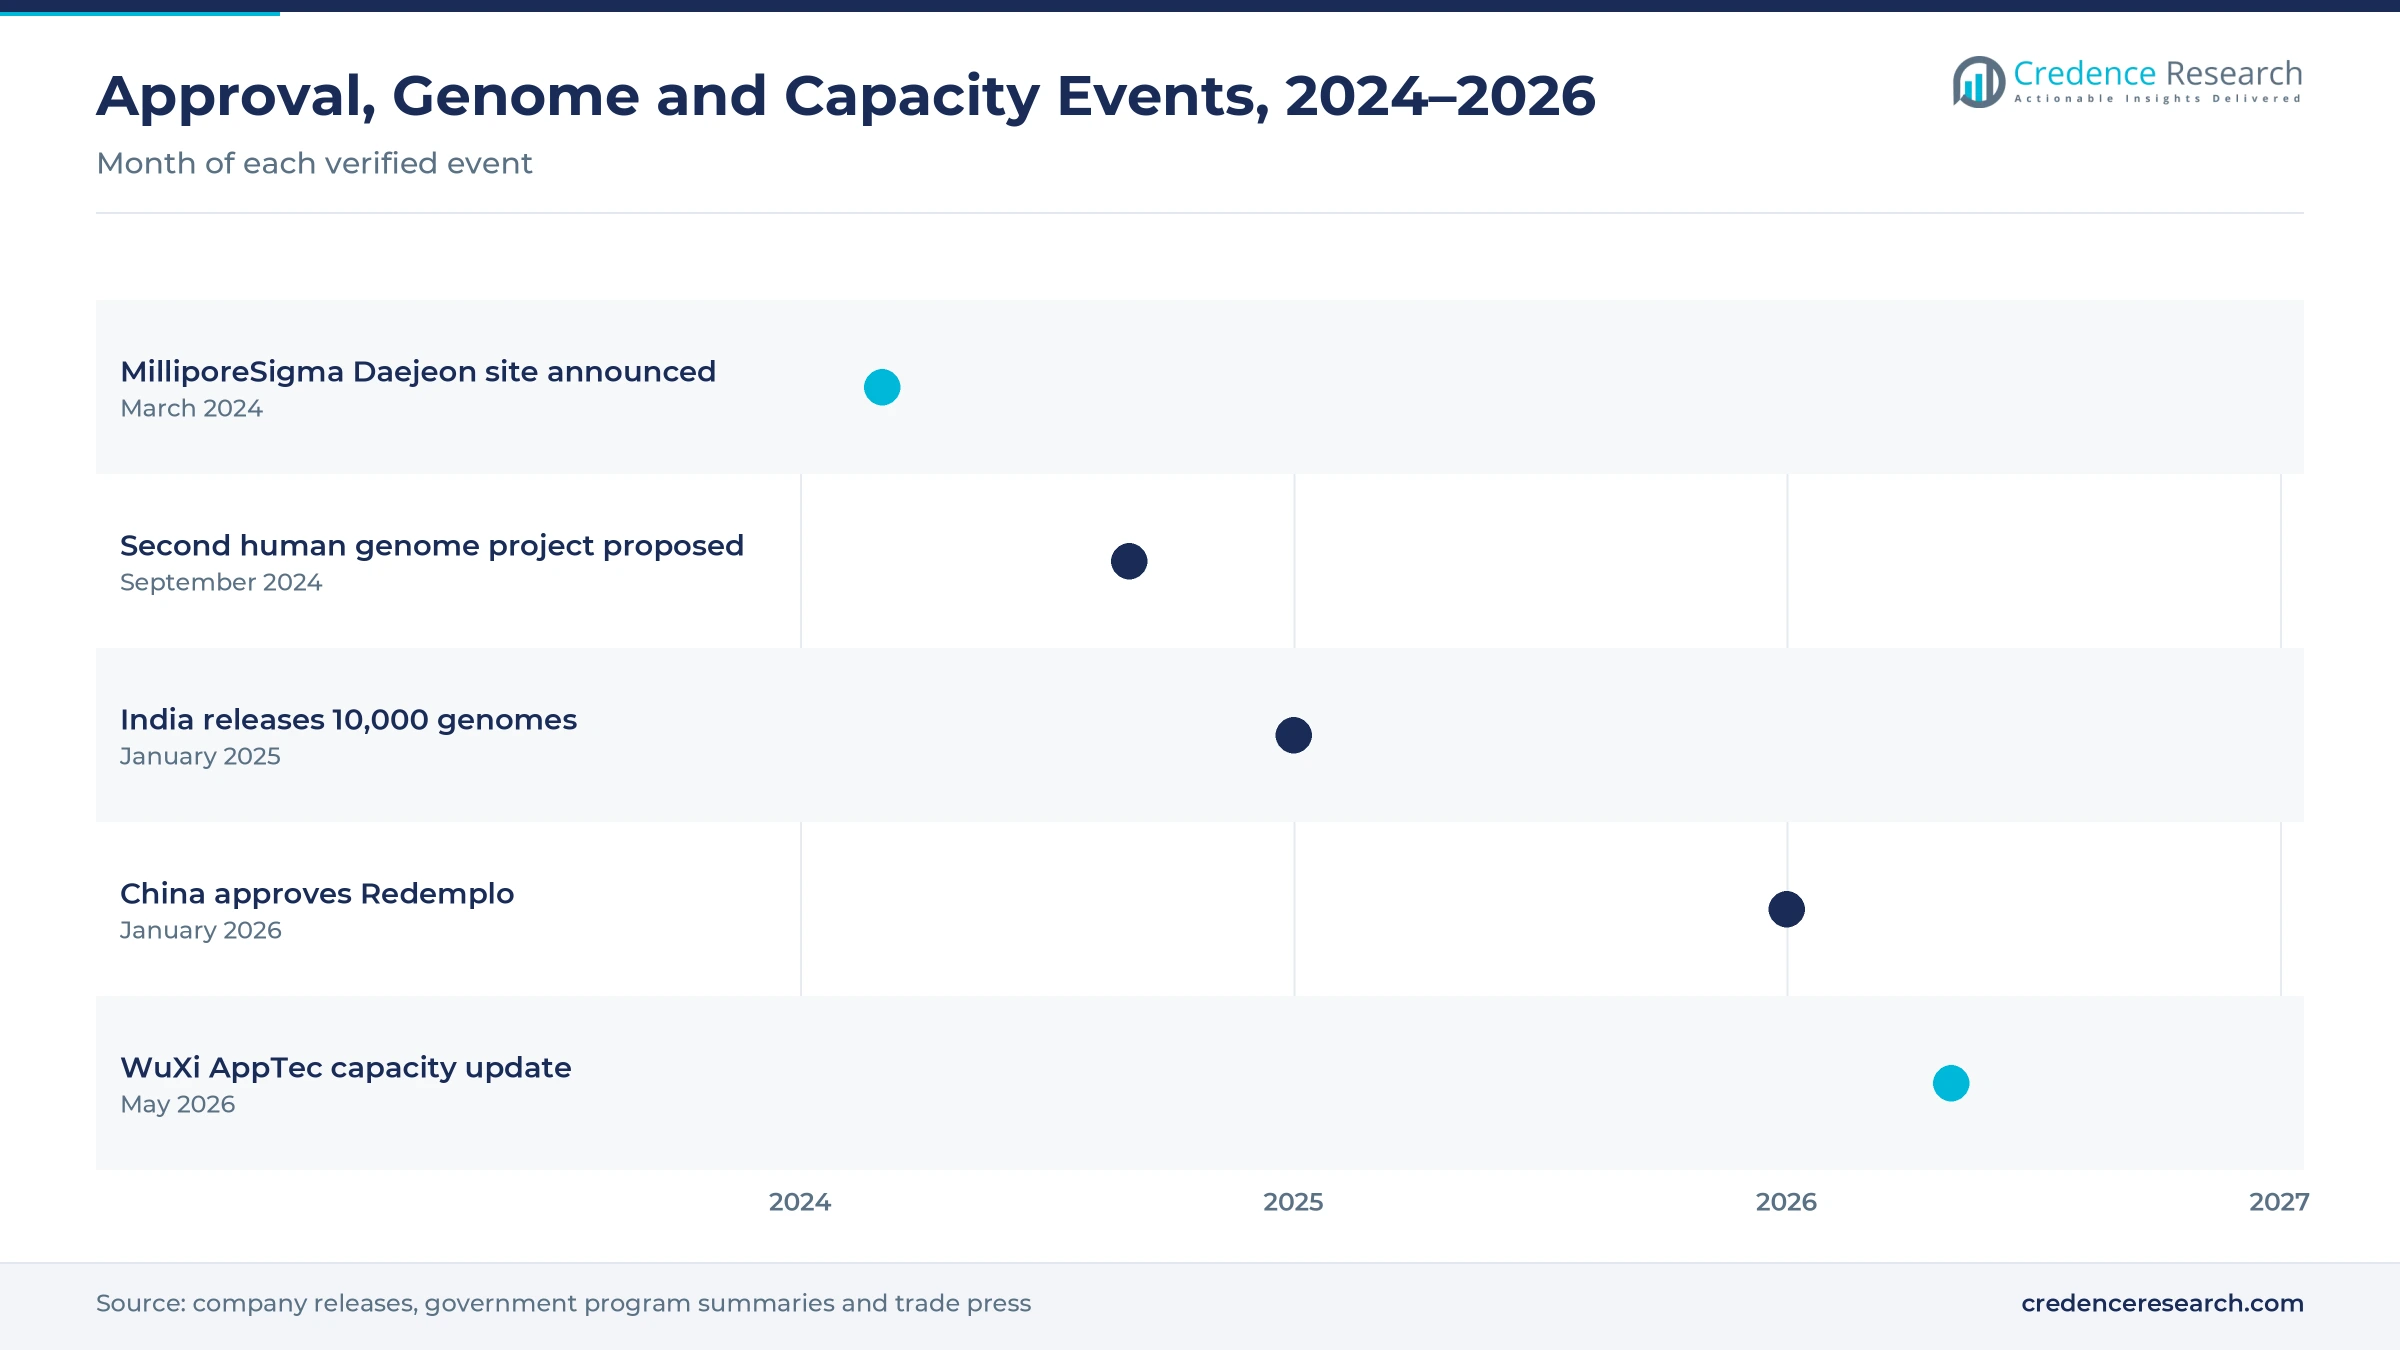
Approvals, genome data and new plants marked 2024 to 2026
| Development | Status and market relevance |
|---|---|
| In March 2024, MilliporeSigma announced a new life science production site in Daejeon, South Korea. | Adds regional supply of process materials |
| In September 2024, Chinese researchers proposed a second human genome project to sequence about 80 million people. | Signals long-term demand for sequencing reagents |
| In January 2025, India released 10,000 whole genome sequences under its national genome program. | Widens research demand for primers and probes |
| In January 2026, Arrowhead announced China approval of the RNA interference drug Redemplo. | Adds commercial drug substance demand in China |
| In May 2026, WuXi AppTec said its solid-phase reactor scale for these molecules exceeded 8 mol. | Expands contract manufacturing capacity with new plants due in 2027 |
Solid-phase scale-up, liquid-phase and enzymatic routes
- Large-scale solid-phase reactors build sequences on a solid support at mole scale, which suits commercial RNA drug batches.
- Liquid-phase platforms build sequences in solution with an anchor molecule, which cuts solvent use and waste.
- Biocatalytic fragment ligation joins shorter pieces with enzymes, which helps makers produce longer and more complex sequences.
- Continuous flow chromatography purifies product in a steady stream, which shortens turnaround and lowers solvent use.
Need a Custom Version of This Report?
Tailor the scope, geography, or segments to your exact requirements.
- Custom geography or segment scope
- Direct access to our analyst team
Suppliers compete on turnaround, purity and GMP scale
Competition combines global life science suppliers with large regional producers and contract manufacturers. Integrated DNA Technologies serves research labs from a Singapore plant, while Thermo Fisher Scientific sells custom DNA and RNAi oligos and synthetic guide RNA in China. GenScript Biotech makes DNA and RNA oligos at its Zhenjiang facility, and Sangon Biotech supplies DNA synthesis, reagents and sequencing services for research and diagnostic customers. Merck KGaA serves the region through MilliporeSigma and other life science units, including a new site in South Korea. Companies compete on turnaround time, purity, modification range and GMP scale rather than on price alone. Contract manufacturers such as WuXi AppTec compete for late-stage RNA drug programs, which need validated processes and large reactors.
Companies profiled and their roles in this market
| Company | Type | Role in the market |
|---|---|---|
| Integrated DNA Technologies | Custom supplier | Runs a custom nucleic acid plant in Singapore |
| GenScript Biotech | Custom supplier | Makes DNA and RNA oligos at Zhenjiang, China |
| Thermo Fisher Scientific | Life science supplier | Sells custom DNA, RNAi and guide RNA products in China |
| Sangon Biotech | Regional supplier | Supplies DNA synthesis for research and diagnostic customers |
| Merck KGaA | Life science supplier | Building a production site in Daejeon, South Korea |
Credence Research view on Asia-Pacific nucleic acid supply
Credence Research's view is that Asia-Pacific demand for oligonucleotide synthesis will grow quickly because RNA medicines, genome programs and molecular tests all need more sequences each year. Synthesized oligonucleotides remain the base of the market, while drug intermediates grow fastest as approvals add commercial volumes. China keeps the largest share in the region, and India grows fastest among the major countries. However, price cuts, purity rules and patent limits will keep pressure on suppliers. Companies that combine GMP scale, fast turnaround and greener chemistry should gain share fastest.
How the regional nucleic acid estimate was built
The report uses 2025 as the base year on a calendar basis, and market values come from the Credence Research model. That model combines research spending statistics, genome program data, drug approvals, procurement rules and company information on manufacturing capacity and products. Segment splits and country growth rates are Credence Research estimates, while country shares follow the client-defined split. Sources used are official statistics, government program summaries, company releases, trade press and company websites, and no interviews or surveys were used.
RNA medicines and genomics carry demand to 2035
Regional oligonucleotide synthesis value is expected to reach USD 6.60 billion by 2035, an 18.26% CAGR during 2026–2035, as RNA medicines and genomics keep demand rising. Growth should stay strong through 2028 while new plants in China and Singapore start operations. After that, drug intermediates and enzymatic routes will carry more growth as commercial RNA drugs scale up. Faster drug approvals would raise this outlook, while deeper tender price cuts would lower it. Companies with GMP scale and secure raw material supply are expected to gain the most.
Frequently Asked Questions
How big is the APAC oligonucleotide synthesis market?
Which product type leads regional demand?
Which country leads the regional market?
Why do research workflows hold the largest application share?
How do RNA drug approvals affect regional demand?
How does diagnostic procurement affect suppliers?
Who are the leading companies in the region?
What are the main challenges for suppliers?
Table of Content
Chapter 1 Market Segmentation
- 1.1 Segmentation Framework
- 1.1.1 Product and Service Classification
- 1.1.2 Application and End-Use Classification
- 1.1.3 Technology and Solution Classification
- 1.1.4 Customer and Distribution Channel Classification
- 1.1.5 Geographic Segmentation
- 1.1.6 Market Segment Definitions and Boundaries
- 1.2 By Product Type
- 1.2.1 Oligonucleotide Drug Intermediates
- 1.2.2 Synthesized Oligonucleotides
- 1.2.3 Reagents and Consumables
- 1.2.4 Equipment and Synthesizers
- 1.3 By Application
- 1.3.1 Therapeutic Manufacturing
- 1.3.2 Research Workflows
- 1.3.3 Molecular Diagnostics
- 1.4 By End User
- 1.4.1 Pharmaceutical and Biotechnology Companies
- 1.4.2 Academic and Research Institutes
- 1.4.3 CROs and CDMOs
- 1.4.4 Diagnostic Laboratories
- 1.5 By Technology
- 1.5.1 Column-Based Solid-Phase Synthesis
- 1.5.2 Array-Based Synthesis
- 1.5.3 Liquid-Phase Synthesis
- 1.5.4 Enzymatic and Hybrid Synthesis
- 1.6 By Country
- 1.6.1 China
- 1.6.2 Japan
- 1.6.3 India
- 1.6.4 Remaining Asia-Pacific
Chapter 2 Introduction
- 2.1 Report Objectives and Scope
- 2.2 Product Definition and Industry Terminology
- 2.3 Market Inclusions and Exclusions
- 2.4 Research Process
- 2.4.1 Primary Research and Expert Interviews
- 2.4.2 Secondary Research and Source Review
- 2.4.3 Top-Down and Bottom-Up Estimation
- 2.4.4 Data Triangulation and Verification
- 2.5 Market Size Measurement Basis
- 2.5.1 2025: USD 1.23 billion → 2035: USD 6.60 billion
- 2.6 Historical and Forecast Reference Periods
- 2.6.1 Historical Period: 2018-2025
- 2.6.2 Base Year: 2025
- 2.6.3 Forecast Period: 2025-2035
- 2.7 Research Assumptions and Limitations
Chapter 3 Executive Summary
- 3.1 Market Snapshot and Key Findings
- 3.2 Base-Year Market Size, 2025
- 3.3 Forecast Market Size, 2035
- 3.4 Revenue and Volume Growth Outlook
- 3.5 Key Demand and Supply Indicators
- 3.6 Leading Market Segments
- 3.7 Fastest-Growing Market Opportunities
- 3.8 Regional Performance Highlights
- 3.9 Technology and Industry Transformation
- 3.10 Competitive Landscape Summary
- 3.11 Analyst View and Strategic Implications
Chapter 4 APAC Oligonucleotide Synthesis Market Trends and Developments
- 4.1 Historical Industry Development, 2018-2025
- 4.2 Recent Market Trends and Developments
- 4.3 Demand and Customer Behavior Trends
- 4.4 Technology and Product Innovation
- 4.5 Artificial Intelligence, Automation and Digitalization
- 4.6 Local Manufacturing and Supply Chain Realignment
- 4.7 Industry Partnerships, Mergers and Acquisitions
- 4.8 Sustainability and Circular Economy Developments
- 4.9 Government and Private Sector Investment Trends
- 4.10 Emerging Business Models and Commercialization
- 4.11 Industry Developments and Announcements
Chapter 5 APAC Oligonucleotide Synthesis Market Production, Supply and Demand Analysis
- 5.1 Demand Trend and Consumption Analysis, 2018-2025
- 5.2 Demand Forecast, 2025-2035
- 5.3 Production and Output Trend, 2018-2025
- 5.4 Production and Output Forecast, 2025-2035
- 5.5 Installed Capacity and Capacity Utilization
- 5.6 Company-Wise Production Plants and Statistics
- 5.6.1 Installed Production Capacity
- 5.6.2 Actual Production
- 5.6.3 Planned Capacity and Expansion Targets
- 5.7 Supply Chain Structure and Procurement Trends
- 5.8 Supply-Demand Gap and Bottlenecks
- 5.9 Import Dependence and Sourcing Structure
- 5.10 Contract Manufacturing and Outsourcing
- 5.11 Regional Supply and Demand Concentration
Chapter 6 APAC Oligonucleotide Synthesis Market Pricing Analysis
- 6.1 Pricing Structure and Measurement
- 6.2 Historical Pricing Trends, 2018-2025
- 6.3 Pricing Outlook, 2025-2035
- 6.4 Average Selling Price and Unit Economics
- 6.5 Pricing by Product and Market Segment
- 6.6 Geographic Pricing Differences
- 6.7 Key Input, Energy, Labor and Logistics Costs
- 6.8 Contract Pricing and Purchasing Models
- 6.9 Pricing Sensitivity and Competitive Positioning
- 6.10 Price, Margin and Profitability Implications
Chapter 7 APAC Oligonucleotide Synthesis Market Dynamics
- 7.1 Market Growth Drivers
- 7.1.1 Demand-Side Drivers
- 7.1.2 Technology and Innovation Drivers
- 7.1.3 Infrastructure and Investment Drivers
- 7.1.4 Regulatory and Policy Drivers
- 7.2 Market Restraints
- 7.2.1 Cost and Affordability Constraints
- 7.2.2 Technology and Adoption Barriers
- 7.2.3 Supply Chain and Operational Constraints
- 7.3 Market Challenges
- 7.3.1 Competitive Pressure and Margin Erosion
- 7.3.2 Skills, Infrastructure and Implementation Gaps
- 7.4 Emerging Market Opportunities
- 7.5 Market Dynamics Impact and Time-Horizon Assessment
Chapter 8 APAC Oligonucleotide Synthesis Value Chain Analysis
- 8.1 Industry Value Chain Overview
- 8.2 Upstream Suppliers and Critical Inputs
- 8.3 Technology and Component Providers
- 8.4 Manufacturing or Service Delivery
- 8.5 Distribution, Channel Partners and Integrators
- 8.6 Downstream Applications and End Users
- 8.7 Value Addition and Profit Pools
- 8.8 Vertical Integration and Outsourcing
- 8.9 Supplier Concentration and Risk
- 8.10 Supply Chain Localization and Resilience
Chapter 9 APAC Oligonucleotide Synthesis Market Regulations and Policies
- 9.1 Relevant Laws, Standards and Compliance Frameworks
- 9.2 Product, Service, Safety and Quality Requirements
- 9.3 Government Policies, Incentives and Subsidies
- 9.4 Imports, Exports and Trade Barriers
- 9.5 Public Procurement and Local Content Requirements
- 9.6 Environmental and Sustainability Compliance
- 9.7 Upcoming Policy Changes and Market Implications
Chapter 10 APAC Oligonucleotide Synthesis Market Hotspots and Opportunities
- 10.1 Market Opportunity Mapping and Growth Hotspots
- 10.2 High-Growth Applications and Customer Groups
- 10.3 Underserved Markets and White-Space Opportunities
- 10.4 Emerging Technology and Product Opportunities
- 10.5 New Capacity and Investment Hotspots
- 10.6 Market Entry and Expansion Opportunities
- 10.7 Distribution and Partnership Opportunities
- 10.8 Near-Term and Long-Term Commercial Potential
- 10.9 Opportunity Attractiveness and Execution Risks
Chapter 11 APAC Oligonucleotide Synthesis Market Outlook, 2025-2035
- 11.1 Market Size and Analysis
- 11.1.1 Revenue (Market Measurement: 2025: USD 1.23 billion → 2035: USD 6.60 billion)
- 11.1.2 Market Volume and Quantity Sold
- 11.1.3 Historical Market Size, 2018-2025
- 11.1.4 Base-Year Market Size, 2025
- 11.2 Market Forecast, 2025-2035
- 11.2.1 Revenue Forecast to 2035
- 11.2.2 Volume Forecast to 2035
- 11.2.3 CAGR and Year-on-Year Growth
- 11.2.4 Incremental Revenue Opportunity
- 11.3 Forecast Assumptions and Scenario Analysis
- 11.3.1 Base-Case Forecast
- 11.3.2 Optimistic and Conservative Scenarios
- 11.3.3 Technology, Pricing and Policy Sensitivities
- 11.4 Market Attractiveness and Growth Outlook
Chapter 12 APAC Oligonucleotide Synthesis Market Segmentation and Outlook
- 12.1 Segmentation Summary and Market Shares, 2025
- 12.2 Largest and Fastest-Growing Segments
- 12.3 By Product Type - Market Size and Forecast, 2025-2035
- 12.3.1 Segment Definition and Scope
- 12.3.2 Historical Market Size, 2018-2025
- 12.3.3 Revenue Forecast, 2025-2035
- 12.3.4 Volume Forecast, 2025-2035
- 12.3.5 Base-Year Market Share, 2025
- 12.3.6 Segment CAGR and Growth Drivers
- 12.3.7 Subsegment Market Size and Forecast
- 12.3.7.1 Oligonucleotide Drug Intermediates
- 12.3.7.2 Synthesized Oligonucleotides
- 12.3.7.3 Reagents and Consumables
- 12.3.7.4 Equipment and Synthesizers
- 12.3.8 Subsegment Pricing and Adoption Trends
- 12.3.9 Leading Suppliers and Competition
- 12.3.10 Regional Demand and Opportunities
- 12.4 By Application - Market Size and Forecast, 2025-2035
- 12.4.1 Segment Definition and Scope
- 12.4.2 Historical Market Size, 2018-2025
- 12.4.3 Revenue Forecast, 2025-2035
- 12.4.4 Volume Forecast, 2025-2035
- 12.4.5 Base-Year Market Share, 2025
- 12.4.6 Segment CAGR and Growth Drivers
- 12.4.7 Subsegment Market Size and Forecast
- 12.4.7.1 Therapeutic Manufacturing
- 12.4.7.2 Research Workflows
- 12.4.7.3 Molecular Diagnostics
- 12.4.8 Subsegment Pricing and Adoption Trends
- 12.4.9 Leading Suppliers and Competition
- 12.4.10 Regional Demand and Opportunities
- 12.5 By End User - Market Size and Forecast, 2025-2035
- 12.5.1 Segment Definition and Scope
- 12.5.2 Historical Market Size, 2018-2025
- 12.5.3 Revenue Forecast, 2025-2035
- 12.5.4 Volume Forecast, 2025-2035
- 12.5.5 Base-Year Market Share, 2025
- 12.5.6 Segment CAGR and Growth Drivers
- 12.5.7 Subsegment Market Size and Forecast
- 12.5.7.1 Pharmaceutical and Biotechnology Companies
- 12.5.7.2 Academic and Research Institutes
- 12.5.7.3 CROs and CDMOs
- 12.5.7.4 Diagnostic Laboratories
- 12.5.8 Subsegment Pricing and Adoption Trends
- 12.5.9 Leading Suppliers and Competition
- 12.5.10 Regional Demand and Opportunities
- 12.6 By Technology - Market Size and Forecast, 2025-2035
- 12.6.1 Segment Definition and Scope
- 12.6.2 Historical Market Size, 2018-2025
- 12.6.3 Revenue Forecast, 2025-2035
- 12.6.4 Volume Forecast, 2025-2035
- 12.6.5 Base-Year Market Share, 2025
- 12.6.6 Segment CAGR and Growth Drivers
- 12.6.7 Subsegment Market Size and Forecast
- 12.6.7.1 Column-Based Solid-Phase Synthesis
- 12.6.7.2 Array-Based Synthesis
- 12.6.7.3 Liquid-Phase Synthesis
- 12.6.7.4 Enzymatic and Hybrid Synthesis
- 12.6.8 Subsegment Pricing and Adoption Trends
- 12.6.9 Leading Suppliers and Competition
- 12.6.10 Regional Demand and Opportunities
- 12.7 By Country - Market Size and Forecast, 2025-2035
- 12.7.1 Segment Definition and Scope
- 12.7.2 Historical Market Size, 2018-2025
- 12.7.3 Revenue Forecast, 2025-2035
- 12.7.4 Volume Forecast, 2025-2035
- 12.7.5 Base-Year Market Share, 2025
- 12.7.6 Segment CAGR and Growth Drivers
- 12.7.7 Subsegment Market Size and Forecast
- 12.7.7.1 China
- 12.7.7.2 Japan
- 12.7.7.3 India
- 12.7.7.4 Remaining Asia-Pacific
- 12.7.8 Subsegment Pricing and Adoption Trends
- 12.7.9 Leading Suppliers and Competition
- 12.7.10 Regional Demand and Opportunities
- 12.8 Segment Growth Comparison
- 12.9 Segment Attractiveness and Priority Matrix
Chapter 13 APAC Oligonucleotide Synthesis End-Use and Application Market Outlook
- 13.1 End-Use Industry and Customer Demand Structure
- 13.2 Leading Applications and Customer Groups
- 13.3 End-Use Market Size, Share and Forecast
- 13.4 Major End-Use Industry Deep Dives
- 13.4.1 Customer Requirements and Use Cases
- 13.4.2 Demand and Replacement Cycles
- 13.4.3 Technical and Regulatory Considerations
- 13.4.4 Purchasing and Procurement Models
- 13.4.5 Leading Vendors and Distribution Channels
- 13.4.6 Forecast and Commercial Opportunities
- 13.5 Emerging Applications and Cross-Segment Demand
- 13.6 End-Use Industry Investment Priorities
Chapter 14 APAC Oligonucleotide Synthesis Geographic Market Outlook, 2025-2035
- 14.1 Regional Market Size and Country-Level Shares, 2025
- 14.2 Country Market Size Comparison, 2025
- 14.3 Country Market Forecasts, 2025-2035
- 14.4 Subregional Industrial and Demand Clusters
- 14.5 Intra-Regional Pricing and Cost Differences
- 14.6 Cross-Border Trade and Supply Networks
- 14.7 Regional Supply and Demand Balances
- 14.8 Country Opportunity Comparison and Prioritization
Note: Every listed country is covered on the structure shown under the first country.
Chapter 15 APAC Oligonucleotide Synthesis Technology, Innovation and Sustainability Outlook
- 15.1 Technology Landscape and Maturity
- 15.2 Product, Process and Service Innovation
- 15.3 AI, Automation and Digital Tools in the Industry
- 15.4 Technology Adoption and Performance Benchmarking
- 15.5 Innovation Pipeline and R&D Investment
- 15.6 Patent and Intellectual Property Trends
- 15.7 Energy Efficiency and Resource Management
- 15.8 Sustainability, Recycling and Circularity
- 15.9 Technology Roadmap, 2025-2035
- 15.10 Risks of Obsolescence and Technology Substitution
Chapter 16 APAC Oligonucleotide Synthesis Market Key Strategic Imperatives
- 16.1 Growth and Market Entry Priorities
- 16.2 High-Return Products and Segments
- 16.3 Pricing, Profitability and Cost Optimization
- 16.4 Technology Investment and Product Differentiation
- 16.5 Supply Chain Localization and Resilience
- 16.6 Distribution and Customer Acquisition
- 16.7 Partnership, Acquisition and Capacity Strategy
- 16.8 Regional Expansion Priorities
- 16.9 Short-, Medium- and Long-Term Actions
Chapter 17 Competition Outlook
- 17.1 Industry Competition Characteristics
- 17.2 Market Structure and Concentration
- 17.3 Market Share and Competitive Positioning, 2025
- 17.4 Company-Wise Revenue and Product Benchmarking
- 17.5 Production and Service Capacity Benchmarking
- 17.6 Technology, Pricing and Differentiation
- 17.7 Regional Footprint and Distribution Strength
- 17.8 Mergers, Acquisitions and Strategic Alliances
- 17.9 New Entrants and Competitive Threats
- 17.10 Porter's Five Forces and Industry Attractiveness
- 17.11 Competitive Outlook, 2025-2035
Chapter 18 Company Profiles
- 18.1 Company Coverage and Selection Criteria
- 18.2 Integrated DNA Technologies
- 18.2.1 Business Description
- 18.2.2 Company Ownership and Geographic Presence
- 18.2.3 Product and Service Portfolio
- 18.2.4 Manufacturing and Operating Footprint
- 18.2.5 Production Capacity and Expansion Plans
- 18.2.6 Financial Performance and Investment
- 18.2.7 Market Share and Competitive Position
- 18.2.8 Technology and Innovation Capabilities
- 18.2.9 Strategic Alliances or Partnerships
- 18.2.10 Recent Developments
- 18.2.11 Growth Strategy and Outlook
- 18.3 GenScript Biotech
- 18.4 Thermo Fisher Scientific
- 18.5 Sangon Biotech
- 18.6 Merck KGaA
- 18.7 Other Relevant Market Participants
Note: Every listed company is profiled on the structure shown under the first company. The company list is preliminary and may change based on research findings, market developments, data availability and client requirements.
Chapter 19 Disclaimer
- 19.1 Research and Forecast Disclaimer
- 19.2 Data Source and Estimation Limitations
Note: The depth of individual sections depends on data availability for this market. Volume, capacity, trade and other unit-based metrics are included where applicable.

