
Glycosaminoglycans Market Overview:
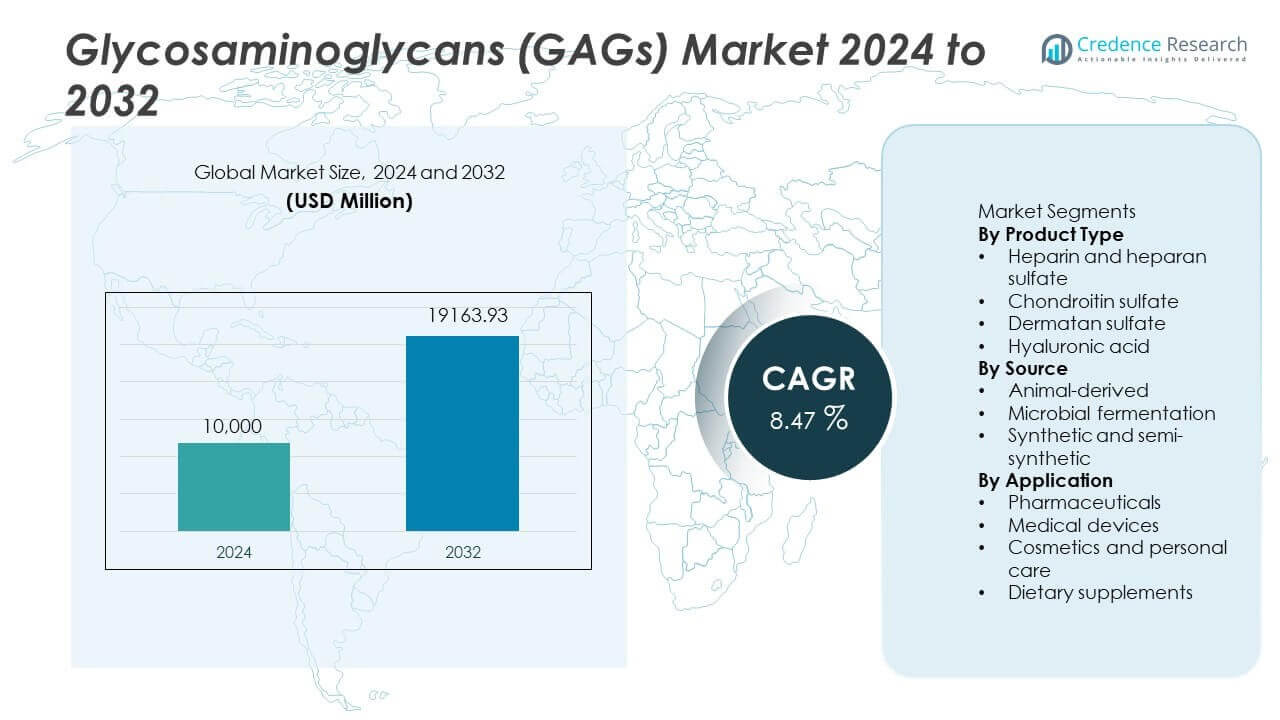
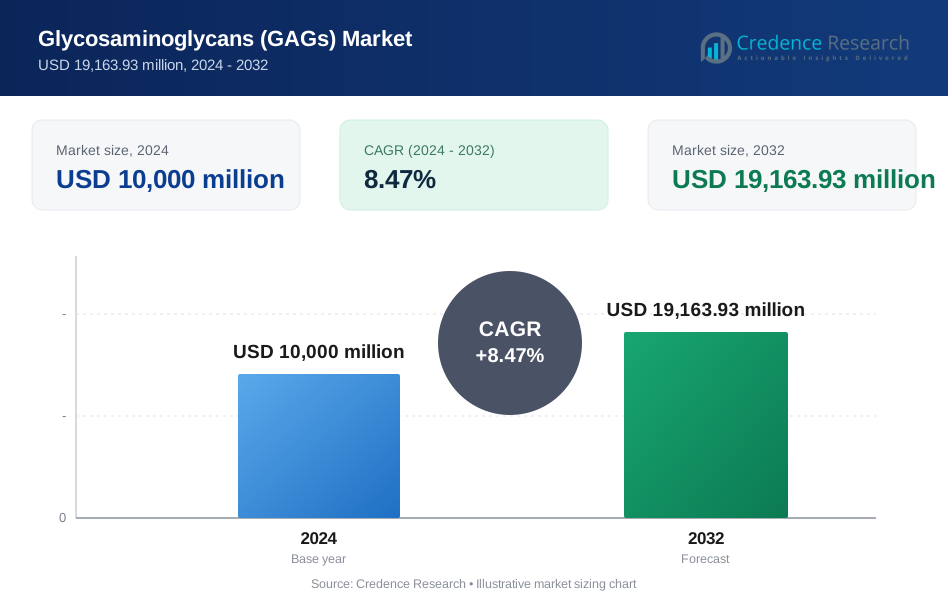
The glycosaminoglycans (GAGs) market was valued at USD 10,000 million in 2024 and is anticipated to reach USD 19,163.93 million by 2032, registering a CAGR of 8.47% during the forecast period.
| REPORT ATTRIBUTE | DETAILS |
|---|---|
| Historical Period | 2020-2023 |
| Base Year | 2024 |
| Forecast Period | 2025-2032 |
| Glycosaminoglycans (GAGs) Market Size 2024 | USD 10,000 million |
| Glycosaminoglycans (GAGs) Market, CAGR | 8.47% |
| Glycosaminoglycans (GAGs) Market Size 2032 | USD 19,163.93 million |
The glycosaminoglycans (GAGs) market is led by key players such as Sanofi, Pfizer Inc., F. Hoffmann-La Roche Ltd., Seikagaku Corporation, Galderma S.A., Lifecore Biomedical, Smith & Nephew plc, Ashland Global Holdings Inc., Bloomage Biotechnology Corporation, and Shandong Dongcheng Biochemicals. These companies maintain strong positions through pharmaceutical-grade production, biologics integration, and medical device applications. North America leads the market with a 35% share, supported by advanced healthcare infrastructure and high biologics usage. Europe follows with a 30% share, driven by aging populations and strong pharmaceutical manufacturing. Asia Pacific holds a 25% share, reflecting expanding healthcare access, growing cosmetic demand, and increasing pharmaceutical production capacity across major economies.
Glycosaminoglycans Market Insights
- Strong demand from pharmaceuticals drives growth, with hyaluronic acid leading product types at a 41% share due to use in injectables, orthopedics, and aesthetics.
- Market trends show rising adoption in medical devices and cosmetics, while pharmaceuticals dominate applications with a 48% share supported by anticoagulant and biologic therapies.
- Competition remains moderate, with leading players focusing on quality compliance, fermentation-based sourcing, and capacity expansion to secure long-term supply.
- North America leads with a 35% share, followed by Europe at 30% and Asia Pacific at 25%, driven by advanced healthcare systems, aging populations, and expanding pharmaceutical manufacturing.
Glycosaminoglycans Market Segmentation Analysis:
By Product Type
Hyaluronic acid dominates the glycosaminoglycans market by product type with a 41% market share. This leadership is driven by extensive use across pharmaceuticals, medical devices, and cosmetics. Hyaluronic acid supports joint lubrication, wound healing, and skin hydration applications. Rising demand for dermal fillers and osteoarthritis treatments strengthens adoption. Strong biocompatibility and safety profiles favor its widespread clinical use. Chondroitin sulfate holds a 27% share due to joint health supplements. Heparin and heparan sulfate account for a significant portion through anticoagulant therapies, while dermatan sulfate serves niche pharmaceutical applications.
- For instance, Bloomage Biotechnology operates advanced hyaluronic acid fermentation lines, supplying pharmaceutical-grade material to dozens of countries and regions across the globe.
By Source
Animal-derived glycosaminoglycans lead the source segment with a 54% market share. Established extraction processes and clinical acceptance support dominance. Heparin and chondroitin sulfate rely heavily on animal sources for large-scale production. Pharmaceutical manufacturers prefer animal-derived GAGs for proven efficacy and regulatory familiarity. Microbial fermentation holds a 32% share, driven by rising concerns over supply security and contamination risks. Synthetic and semi-synthetic sources account for the remaining share, supported by research applications and controlled purity requirements in specialized formulations.
- For instance, Sanofi operates multi-step heparin purification processes achieving impurity thresholds below 0.1 IU per mL in final injectable batches.
By Application
Pharmaceuticals represent the dominant application segment with a 48% market share. Strong demand for anticoagulants, osteoarthritis therapies, and injectable formulations drives growth. Hospitals and healthcare providers rely on GAG-based drugs for chronic and acute treatments. Medical devices hold a 23% share, supported by use in wound care and implant coatings. Cosmetics and personal care account for a 19% share due to anti-aging and skin hydration products. Dietary supplements contribute steady demand through joint health and wellness formulations.
Key Growth Drivers
Rising Demand for Biologics and Advanced Pharmaceuticals
Growing use of biologics strongly drives the glycosaminoglycans market. GAGs play a critical role in anticoagulants, injectable therapies, and controlled drug delivery. Hospitals rely on heparin-based treatments for surgical and cardiovascular care. Expanding treatment of chronic diseases increases pharmaceutical consumption. Aging populations raise demand for joint and vascular therapies. Strong clinical efficacy supports continued adoption. Regulatory approvals for biologic drugs further expand usage. Pharmaceutical manufacturers invest in scalable GAG production. This medical reliance sustains long-term market growth.
- For instance, Pfizer manufactures pharmaceutical-grade heparin APIs across multiple GMP-certified sites with batch sizes exceeding 25 kilograms per validated production run.
Expanding Applications in Medical Devices and Regenerative Medicine
Medical device usage drives steady GAG market growth. GAGs support wound healing, tissue scaffolds, and implant coatings. Hyaluronic acid improves lubrication and biocompatibility in medical devices. Regenerative medicine adoption increases use in tissue engineering. Hospitals and clinics integrate GAG-based biomaterials into surgical care. Rising orthopedic procedures boost demand. Research funding supports biomaterial innovation. Medical device manufacturers expand GAG integration. These applications diversify revenue streams beyond pharmaceuticals.
- For instance, Smith & Nephew incorporates hydrocellular technology and polyurethane materials into advanced dressings designed for extended wear and sustained moisture management under clinical conditions.
Growth in Cosmetics and Personal Care Consumption
Cosmetics and personal care demand accelerates GAG market growth. Hyaluronic acid is widely used for skin hydration and anti-aging. Consumer focus on dermal health supports strong product uptake. Premium skincare brands emphasize biocompatible ingredients. Non-invasive aesthetic procedures gain popularity. Clinics and dermatology centers increase usage. Product innovation improves formulation performance. Rising disposable income boosts cosmetic consumption. This demand adds stability to market expansion.
Key Trends & Opportunities
Shift Toward Fermentation-Based and Sustainable Sources
Manufacturers increasingly adopt microbial fermentation methods. This trend reduces reliance on animal-derived sources. Fermentation improves supply consistency and safety. Regulatory scrutiny encourages traceable sourcing. Sustainability goals drive production innovation. Pharmaceutical companies prefer controlled manufacturing processes. Fermentation supports scalable output. This shift creates opportunities for technology providers. Long-term sustainability strengthens market competitiveness.
- For instance, Seikagaku Corporation uses controlled fermentation and purification workflows achieving endotoxin limits below 0.05 EU per milligram for injectable materials.
Rising Demand in Emerging Healthcare Markets
Emerging economies present strong growth opportunities. Expanding healthcare infrastructure increases pharmaceutical demand. Aging populations drive joint and vascular treatments. Cosmetic procedures grow in urban centers. Improved access to medical devices supports adoption. Local manufacturers expand production capabilities. Government healthcare spending supports demand. These regions offer high-volume growth potential.
- For instance, Galderma expanded injectable aesthetics distribution to more than 60 metropolitan cities across Asia and Latin America, supported by clinician training programs exceeding 1,000 sessions annually.
Key Challenges
Supply Chain and Raw Material Dependency Risks
Dependence on animal-derived raw materials creates supply risks. Disease outbreaks disrupt sourcing. Regulatory restrictions affect availability. Price volatility impacts production costs. Manufacturers face quality consistency challenges. Transitioning sources requires investment. Smaller producers face higher risk exposure. Supply chain resilience remains a key challenge.
Regulatory Complexity and Quality Compliance
GAG products face strict regulatory oversight. Quality standards vary across regions. Compliance increases production costs. Documentation and validation extend timelines. Non-compliance risks product recalls. Regulatory approvals slow market entry. Manufacturers invest in quality systems. Managing regulatory complexity remains critical for sustained growth.
Regional Analysis
North America
North America holds a 35% market share in the glycosaminoglycans market, supported by strong pharmaceutical manufacturing and advanced healthcare systems. The region shows high demand for heparin, hyaluronic acid, and chondroitin sulfate across clinical applications. The United States drives regional growth through large-scale biologics production and high surgical volumes. Medical device usage of GAG-based coatings and wound care products remains strong. Well-established regulatory frameworks support quality and safety compliance. Continuous investment in biologics and regenerative medicine sustains steady market expansion across hospitals and specialty clinics.
Europe
Europe accounts for a 30% market share, driven by robust pharmaceutical production and aging population needs. Countries such as Germany, France, and the United Kingdom lead demand for anticoagulants and joint health therapies. Strong adoption of hyaluronic acid in orthopedic and aesthetic treatments supports growth. Medical research institutions contribute to innovation in GAG-based biomaterials. Strict regulatory standards ensure high product quality. Rising demand for biologics and regenerative medicine strengthens pharmaceutical usage. Public healthcare systems support consistent consumption across therapeutic and medical device applications.
Asia Pacific
Asia Pacific represents a 25% market share, supported by expanding pharmaceutical manufacturing and growing healthcare access. China, Japan, and India contribute significantly to regional demand. Rising incidence of chronic diseases increases usage of heparin and chondroitin sulfate. Cosmetic and aesthetic applications of hyaluronic acid grow rapidly. Local production capacity expansion improves supply availability. Government investment in healthcare infrastructure supports market growth. Increasing clinical awareness and medical tourism further strengthen adoption of GAG-based products across pharmaceuticals and medical devices.
Rest of the World
Rest of the World holds a 10% market share, driven by gradual healthcare development in Latin America, the Middle East, and Africa. Growing demand for anticoagulant therapies supports pharmaceutical usage. Cosmetic applications expand in urban centers. Import dependence remains high due to limited local production. Improving hospital infrastructure supports medical device adoption. Government healthcare initiatives increase access to essential therapies. Market growth remains steady, supported by rising chronic disease prevalence and expanding distribution networks across developing regions.
Glycosaminoglycans Market Segmentations:
By Product Type
- Heparin and heparan sulfate
- Chondroitin sulfate
- Dermatan sulfate
- Hyaluronic acid
By Source
- Animal-derived
- Microbial fermentation
- Synthetic and semi-synthetic
By Application
- Pharmaceuticals
- Medical devices
- Cosmetics and personal care
- Dietary supplements
By Geography
- North America
- U.S.
- Canada
- Mexico
- Europe
- Germany
- France
- U.K.
- Italy
- Spain
- Rest of Europe
- Asia Pacific
- China
- Japan
- India
- South Korea
- South-east Asia
- Rest of Asia Pacific
- Latin America
- Brazil
- Argentina
- Rest of Latin America
- Middle East & Africa
- GCC Countries
- South Africa
- Rest of the Middle East and Africa
Competitive Landscape
Competitive landscape or analysis includes Sanofi, Pfizer Inc., F. Hoffmann-La Roche Ltd., Seikagaku Corporation, Galderma S.A., Lifecore Biomedical, Smith & Nephew plc, Ashland Global Holdings Inc., Bloomage Biotechnology Corporation, and Shandong Dongcheng Biochemicals. These companies compete through product quality, regulatory compliance, and application-specific portfolios. Market leaders focus on hyaluronic acid and heparin production for pharmaceutical and medical device use. Strong capabilities in purification and formulation support consistent clinical performance. Players invest in capacity expansion to secure supply chains and meet rising biologics demand. Strategic partnerships with hospitals and device manufacturers strengthen market reach. Geographic expansion targets Asia Pacific for volume growth and cost efficiency. Competitive intensity remains moderate due to high entry barriers and strict quality standards. Continuous innovation and process optimization sustain long-term positioning.
Key Player Analysis
- Sanofi S.A.
- Seikagaku Corporation
- Merck KGaA
- Bioiberica S.A
- Poliardes S.r.l.
- Shandong Focuschem Biotech Co., Ltd.
- Chengdu Tianfeng Biomedical Science Co., Ltd
- Shanghai Laiye Biotechnology Co., Ltd.
- Sioux Pharm, Inc.
- Pacific Rainbow International, Inc.
- Zentiva NV
- Allergan plc
- Sage Therapeutics, Inc.
- Shandong New Time Pharmaceutical Co., Ltd.
- Sandoz International GmbH
- Shandong Brilliant Bio-engineering Co., Ltd
- JidanBio Co., Ltd
- Takeda Pharmaceutical Company Limited
- JianChi Pharm Group Co., Limited
- JSN Chemicals LTD
Recent Developments
- In October 2025, Smith & Nephew plc shared new ALLEVYN COMPLETE CARE data for pressure-injury prevention.
- In August 2025, Seikagaku Corporation signed a definitive Gel-One collaboration for osteoarthritis in Japan.
- In September 2024, F. Hoffmann-La Roche Ltd. gained FDA approval for Tecentriq Hybreza with hyaluronidase.
Report Coverage
The research report offers an in-depth analysis based on Product Type, Source, Application and Geography. It details leading market players, providing an overview of their business, product offerings, investments, revenue streams, and key applications. Additionally, the report includes insights into the competitive environment, SWOT analysis, current market trends, as well as the primary drivers and constraints. Furthermore, it discusses various factors that have driven market expansion in recent years. The report also explores market dynamics, regulatory scenarios, and technological advancements that are shaping the industry. It assesses the impact of external factors and global economic changes on market growth. Lastly, it provides strategic recommendations for new entrants and established companies to navigate the complexities of the market.
Future Outlook
- Pharmaceutical applications will continue to drive core demand growth.
- Hyaluronic acid usage will expand across aesthetics and orthopedics.
- Medical device integration will increase in wound care and implants.
- Fermentation-based production will gain wider industry adoption.
- Supply chain security will remain a strategic priority for manufacturers.
- Emerging markets will contribute higher volume demand over time.
- Regulatory compliance will shape product development strategies.
- Innovation in purification and formulation will improve product consistency.
- Strategic partnerships will strengthen downstream market access.
- Long-term biologics growth will support sustained market expansion.
Request a Free Sample
Fill in your details and we'll send you a free sample report.
- Sample data tables & charts
- Research methodology
Need a Custom Version of This Report?
Tailor the scope, geography, or segments to your exact requirements.
- Custom geography or segment scope
- Direct access to our analyst team
Frequently Asked Questions
What is the current market size for the Glycosaminoglycans (GAGs) market, and what is its projected size in 2032?
At what Compound Annual Growth Rate is the Glycosaminoglycans (GAGs) market projected to grow between 2024 and 2032?
Which Glycosaminoglycans (GAGs) market segment held the largest share in 2024?
What are the primary factors fueling the growth of the Glycosaminoglycans (GAGs) market?
Who are the leading companies in the Glycosaminoglycans (GAGs) market?
Which region commanded the largest share of the Glycosaminoglycans (GAGs) market in 2024?
Table of Content
Chapter 1. Report Introduction
- 1.1 Report Description & Purpose
- 1.1.1 Report Title & Market Definition
- 1.1.2 Unique Selling Propositions (USP) & Key Differentiators
- 1.1.3 Value Proposition for Stakeholders
- 1.2 Research Objectives
- 1.2.1 Market Sizing Objectives (Volume & Revenue) (Volume Where Applicable)
- 1.2.2 Segmentation Objectives
- 1.2.3 Competitive Intelligence Objectives
- 1.2.4 Forecast & Scenario Objectives
- 1.3 Report Scope
- 1.3.1 Glycosaminoglycans (GAGs) Scope – Segments & Subsegments Covered
- 1.3.2 Geographic Scope – Regions & Countries Covered
- 1.3.3 Historical Period, Base Year & Forecast Period (2024; forecast to 2032)
- 1.3.4 Inclusions & Exclusions
- 1.4 Industry Classification & Applicable Codes
- 1.5 Currency, Measurement Units & Valuation Basis
- 1.6 Target Stakeholders
- 1.7 Limitations & Assumptions
Chapter 2. Executive Summary
- 2.1 Global Glycosaminoglycans (GAGs) Market Snapshot
- 2.1.1 Market Size – Historical (2024) & Forecast (2024-2032) (2024: USD 10,000 million → 2032: USD 19,163.93 million)
- 2.1.2 Volume & Revenue – Global Totals (Volume Where Applicable)
- 2.1.3 Key Market Highlights – Top Five Facts
- 2.2 Glycosaminoglycans (GAGs) Market Segmentation Snapshot
- 2.2.1 Market Split by Region – 2024 vs. 2032
- 2.3 Competitive Snapshot
- 2.3.1 Top 10 Players by Revenue Share – 2024
- 2.3.2 Top 10 Players by Volume Share – 2024 (Volume Where Applicable)
- 2.3.3 Recent Strategic Developments (18-Month Summary)
- 2.4 Key Investment Highlights & Strategic Conclusions
Chapter 3. Glycosaminoglycans (GAGs) Market Dynamics & Industry Analysis
- 3.1 Market Overview & Context
- 3.1.1 Glycosaminoglycans (GAGs) Market Position in the Broader Industry Value Chain
- 3.1.2 Demand Structure & Purchasing Dynamics
- 3.1.3 Market Maturity & Development Stage by Region
- 3.2 Glycosaminoglycans (GAGs) Market Drivers
- 3.3 Glycosaminoglycans (GAGs) Market Restraints & Challenges
- 3.4 Glycosaminoglycans (GAGs) Market Opportunities
- 3.5 Porter's Five Forces Analysis
- 3.5.1 Threat of New Entrants
- 3.5.2 Bargaining Power of Suppliers
- 3.5.3 Bargaining Power of Buyers
- 3.5.4 Threat of Substitutes
- 3.5.5 Competitive Rivalry – Intensity Assessment
- 3.6 Glycosaminoglycans (GAGs) Value Chain Analysis
- 3.6.1 Upstream – Key Inputs, Resources & Suppliers
- 3.6.1.1 Key Input/Resource 1
- 3.6.1.2 Key Input/Resource 2
- 3.6.1.3 Key Input/Resource 3
- 3.6.2 Midstream – Core Operations & Value Creation
- 3.6.2.1 Operating Model & Process Overview
- 3.6.2.2 Key Operating Locations & Capabilities by Company
- 3.6.3 Downstream – Market Channels & End Users
- 3.6.3.1 Direct Sales & Customer Engagement Channels
- 3.6.3.2 Indirect Sales, Intermediaries & Partner Channels
- 3.6.4 Value Chain Profitability Analysis
- 3.6.1 Upstream – Key Inputs, Resources & Suppliers
- 3.7 PESTEL Analysis
- 3.7.1 Political Factors
- 3.7.2 Economic Factors
- 3.7.3 Social Factors
- 3.7.4 Technological Factors
- 3.7.5 Environmental Factors
- 3.7.6 Legal Factors
- 3.8 Glycosaminoglycans (GAGs) Supply Chain Analysis
- 3.8.1 Critical Input & Resource Availability Risk Assessment
- 3.8.2 Supplier & Operational Concentration Risk (Geographic Exposure)
- 3.8.3 Supply & Service Disruption Impact Analysis
- 3.9 Regulatory & Policy Landscape
Note: The regulatory and policy landscape section covers regulations based on their applicability to the market, Glycosaminoglycans (GAGs) category, geography, and scope of the study. Only regulatory frameworks with a material impact on operations, compliance, trade, sustainability, or market access are analyzed in detail.
Chapter 4. Key Investment Pockets & Opportunity Analysis
- 4.1 Glycosaminoglycans (GAGs) Market Attractiveness Analysis
- 4.1.1 By Region – Investment Attractiveness Matrix (Market Size × CAGR)
- 4.2 Absolute Revenue Growth Opportunity
- 4.2.1 By Region – Absolute Revenue Growth Through 2032
- 4.3 Incremental Demand Opportunity
- 4.3.1 By Region – Incremental Demand Through 2032
- 4.3.2 Segment – Incremental Demand
- 4.4 Emerging Submarket Opportunity Deep Dive (Subject to Applicability)
- 4.5 Priority Market Opportunity Scorecards
- 4.5.1 United States
- 4.5.2 Europe
- 4.5.3 Asia
- 4.5.4 Middle East & Africa
Note: Priority market opportunity scorecards reflect the geographic scope and strategic relevance of the study. Listed markets are indicative and may be adapted to the industry.
Chapter 5. Glycosaminoglycans (GAGs) Cross-Border Trade & Market Access Analysis
- 5.1 International Trade & Cross-Border Activity Overview
- 5.1.1 Global Export Value by Country (2024)
- 5.1.2 Global Export Volume by Country (2024) (Volume Where Applicable)
- 5.1.3 Global Import Value by Country (2024)
- 5.1.4 Global Import Volume by Country (2024) (Volume Where Applicable)
- 5.1.5 Net Trade Balance by Country (2024)
- 5.2 Export Analysis – Segment
- 5.2.1 Category 1 (Applicable Classification Code)
- 5.2.2 Category 2 (Applicable Classification Code)
- 5.2.3 Category 3 (Applicable Classification Code)
- 5.2.4 Category 4 (Applicable Classification Code)
- 5.2.5 Category 5 (Applicable Classification Code)
- 5.3 Import Analysis – Segment
- 5.3.1 Category 1 (Applicable Classification Code)
- 5.3.2 Category 2 (Applicable Classification Code)
- 5.3.3 Category 3 (Applicable Classification Code)
- 5.3.4 Category 4 (Applicable Classification Code)
- 5.3.5 Category 5 (Applicable Classification Code)
- 5.4 Cross-Border Pricing & Transaction Benchmarks
- 5.4.1 Export Pricing – Segment & Country
- 5.4.2 Import Pricing – Segment & Source Country
- 5.4.3 Price Trends (2024)
- 5.5 Key Cross-Border Trade & Delivery Routes
- 5.5.1 Cross-Border Trade/Delivery Route 1
- 5.5.2 Cross-Border Trade/Delivery Route 2
- 5.5.3 Cross-Border Trade/Delivery Route 3
- 5.5.4 Cross-Border Trade/Delivery Route 4
- 5.5.5 Cross-Border Trade/Delivery Route 5
- 5.6 Trade Policy & Market Access Impact Assessment
- 5.6.1 Tariff & Non-Tariff Barriers
- 5.6.2 Regional Trade & Economic Integration Frameworks
- 5.6.3 Bilateral & Multilateral Trade Agreements
- 5.6.4 Cross-Border Operating, Licensing & Localization Requirements
Note: This chapter applies where cross-border trade or delivery is relevant to Glycosaminoglycans (GAGs). Goods, services, and digital offerings are assessed using applicable classifications and transaction measures. Import-export volumes, trade balances, and route analyses are included only where meaningful to the market.
Chapter 6. Competitive Landscape & Company Benchmarking
- 6.1 Glycosaminoglycans (GAGs) Market Concentration & Structure
- 6.1.1 Herfindahl-Hirschman Index (HHI) – the historical period vs. 2024
- 6.1.2 Leading, Mid-Sized & Emerging Player Structure
- 6.1.3 Global, Regional & Local Player Dynamics
- 6.2 Glycosaminoglycans (GAGs) Market Share Analysis – 2024
- 6.2.1 Global Revenue Share by Company
- 6.2.2 Global Volume Share by Company (Volume Where Applicable)
- 6.2.3 Regional Revenue Share
- 6.2.4 Market Share Evolution (the historical period vs. 2024)
- 6.2.5 Company Market Share by Key Segment
- 6.2.6 Company Market Share by Customer Group
- 6.3 Operating Scale, Capacity & Infrastructure Analysis
- 6.3.1 Global Operating Scale & Supply Capacity
- 6.3.2 Resource Utilization & Operating Efficiency
- 6.3.3 Output, Service Delivery & Activity Metrics
- 6.3.4 Operating Footprint & Infrastructure Map
- 6.3.5 Planned Operational & Capacity Expansion
- 6.4 Glycosaminoglycans (GAGs) Competitive Benchmarking Matrix
- 6.4.1 Revenue, Growth, Profitability & Operating Metric Comparison
- 6.4.2 Channel Revenue Mix
- 6.4.3 Geographic Revenue Exposure
- 6.4.4 R&D Intensity
- 6.4.5 Sustainability Maturity
- 6.5 Strategic Developments in Glycosaminoglycans (GAGs) (Last 24 Months)
- 6.5.1 Mergers, Acquisitions & Divestments
- 6.5.2 New Products, Services & Solutions in Glycosaminoglycans (GAGs)
- 6.5.3 Operational & Infrastructure Expansions
- 6.5.4 Strategic Alliances, Joint Ventures & Partnerships
- 6.5.5 Distribution Expansion & Market Entry
- 6.5.6 Sustainability & ESG Initiatives
- 6.6 Competitive Strategy Mapping
- 6.6.1 Leader, Challenger, Follower & Niche Classification
- 6.6.2 Pricing Strategy Comparison
- 6.6.3 Channel Strategy Matrix
Note: Strategic developments are included based on their materiality and the availability of reliable information.
Chapter 7. Global Glycosaminoglycans (GAGs) Market – By Sales & Delivery Channel
- 7.1 Segment Overview
- 7.1.1 Volume & Revenue Split by Channel (2024 & 2032) (Volume Where Applicable)
- 7.1.2 Channel Mix Evolution (2024-2032)
Chapter 8. Regional Market Analysis – Global Overview
- 8.1 Global Regional Overview
- 8.1.1 Regional Volume Share (Volume Where Applicable)
- 8.1.2 Regional Revenue Share
- 8.1.3 Regional Volume by Region (Volume Where Applicable)
- 8.1.4 Regional Revenue by Region
- 8.1.5 Regional Forecast Through 2032
- 8.2 Cross-Regional Segment Analysis
- 8.2.1 By Sales & Delivery Channel
- 8.2.2 By Competitive Positioning & Price Tier
Chapter 9. North America Glycosaminoglycans (GAGs) Market
- 9.1 United States
- 9.2 Canada
- 9.3 Mexico
Chapter 10. Europe Glycosaminoglycans (GAGs) Market
- 10.1 Germany
- 10.2 France
- 10.3 Italy
- 10.4 United Kingdom
- 10.5 Spain
- 10.6 Poland
- 10.7 Russia
- 10.8 Netherlands
- 10.9 Belgium
- 10.10 Sweden
- 10.11 Denmark
- 10.12 Norway
- 10.13 Rest of Europe
Chapter 11. Asia Pacific Glycosaminoglycans (GAGs) Market
- 11.1 China
- 11.2 India
- 11.3 Japan
- 11.4 South Korea
- 11.5 Thailand
- 11.6 Indonesia
- 11.7 Vietnam
- 11.8 Malaysia
- 11.9 Australia
- 11.10 Rest of Asia Pacific
Chapter 12. Latin America Glycosaminoglycans (GAGs) Market
- 12.1 Brazil
- 12.2 Argentina
- 12.3 Colombia
- 12.4 Chile
- 12.5 Rest of Latin America
Chapter 13. Middle East Glycosaminoglycans (GAGs) Market
- 13.1 Saudi Arabia
- 13.2 United Arab Emirates
- 13.3 Turkey
- 13.4 Israel
- 13.5 Iran
- 13.6 Rest of the Middle East
Chapter 14. Africa Glycosaminoglycans (GAGs) Market
- 14.1 South Africa
- 14.2 Egypt
- 14.3 Nigeria
- 14.4 Morocco
- 14.5 Rest of Africa
Chapter 15. Glycosaminoglycans (GAGs) Company Profiles
- 15.1 [Company 01]
- 15.1.1 Company Overview
- 15.1.2 Key Management Personnel
- 15.1.3 Products & Services Portfolio
- 15.1.4 Financial Performance
- 15.1.5 Key Market Focus & Geographic Presence
- 15.1.6 Recent Developments & Strategic Initiatives
Note: The company profile list is preliminary and may change based on research findings, market developments, data availability, and client requirements.
Chapter 16. Appendices
- Appendix A – List of Abbreviations & Acronyms
- Appendix B – Industry Classification Code Reference – Full Series
- Appendix C – Supply, Output & Operating Capacity Data Tables
- Appendix D – End-Use & Demand Base Tables
- Appendix E – Demand, Adoption & Usage Assumptions
- Appendix F – Pricing & Revenue Metric Reference Tables
- Appendix G – Company Operations & Infrastructure Database
- Appendix H – Cross-Border Trade & Activity Data Tables (Where Applicable)
- Appendix I – Regulatory Summary Tables
- Appendix J – Primary Research Participant List (Anonymized)
- Appendix K – Primary Research Questionnaire Framework
- Appendix L – Data Sources & Bibliography
- Appendix M – Market Size Divergence & Source Comparison
Chapter 17. Research Methodology
- 17.1 Research Framework & Philosophy
- 17.2 Secondary Research – Sources, Hierarchy & Data Extraction
- 17.3 Data Modeling – Bottom-Up & Top-Down Market Sizing
- 17.4 Primary Research – Stakeholder Framework, LOI & Sample Sizes
- 17.5 Forecast Methodology – Regression, Scenario & Sensitivity Analysis
- 17.6 Quality Control – Four-Layer Validation Framework
- 17.7 Limitations & Standard Assumptions
- 17.8 Disclaimer
