
Housing programs and bathroom upgrades lift fixture demand
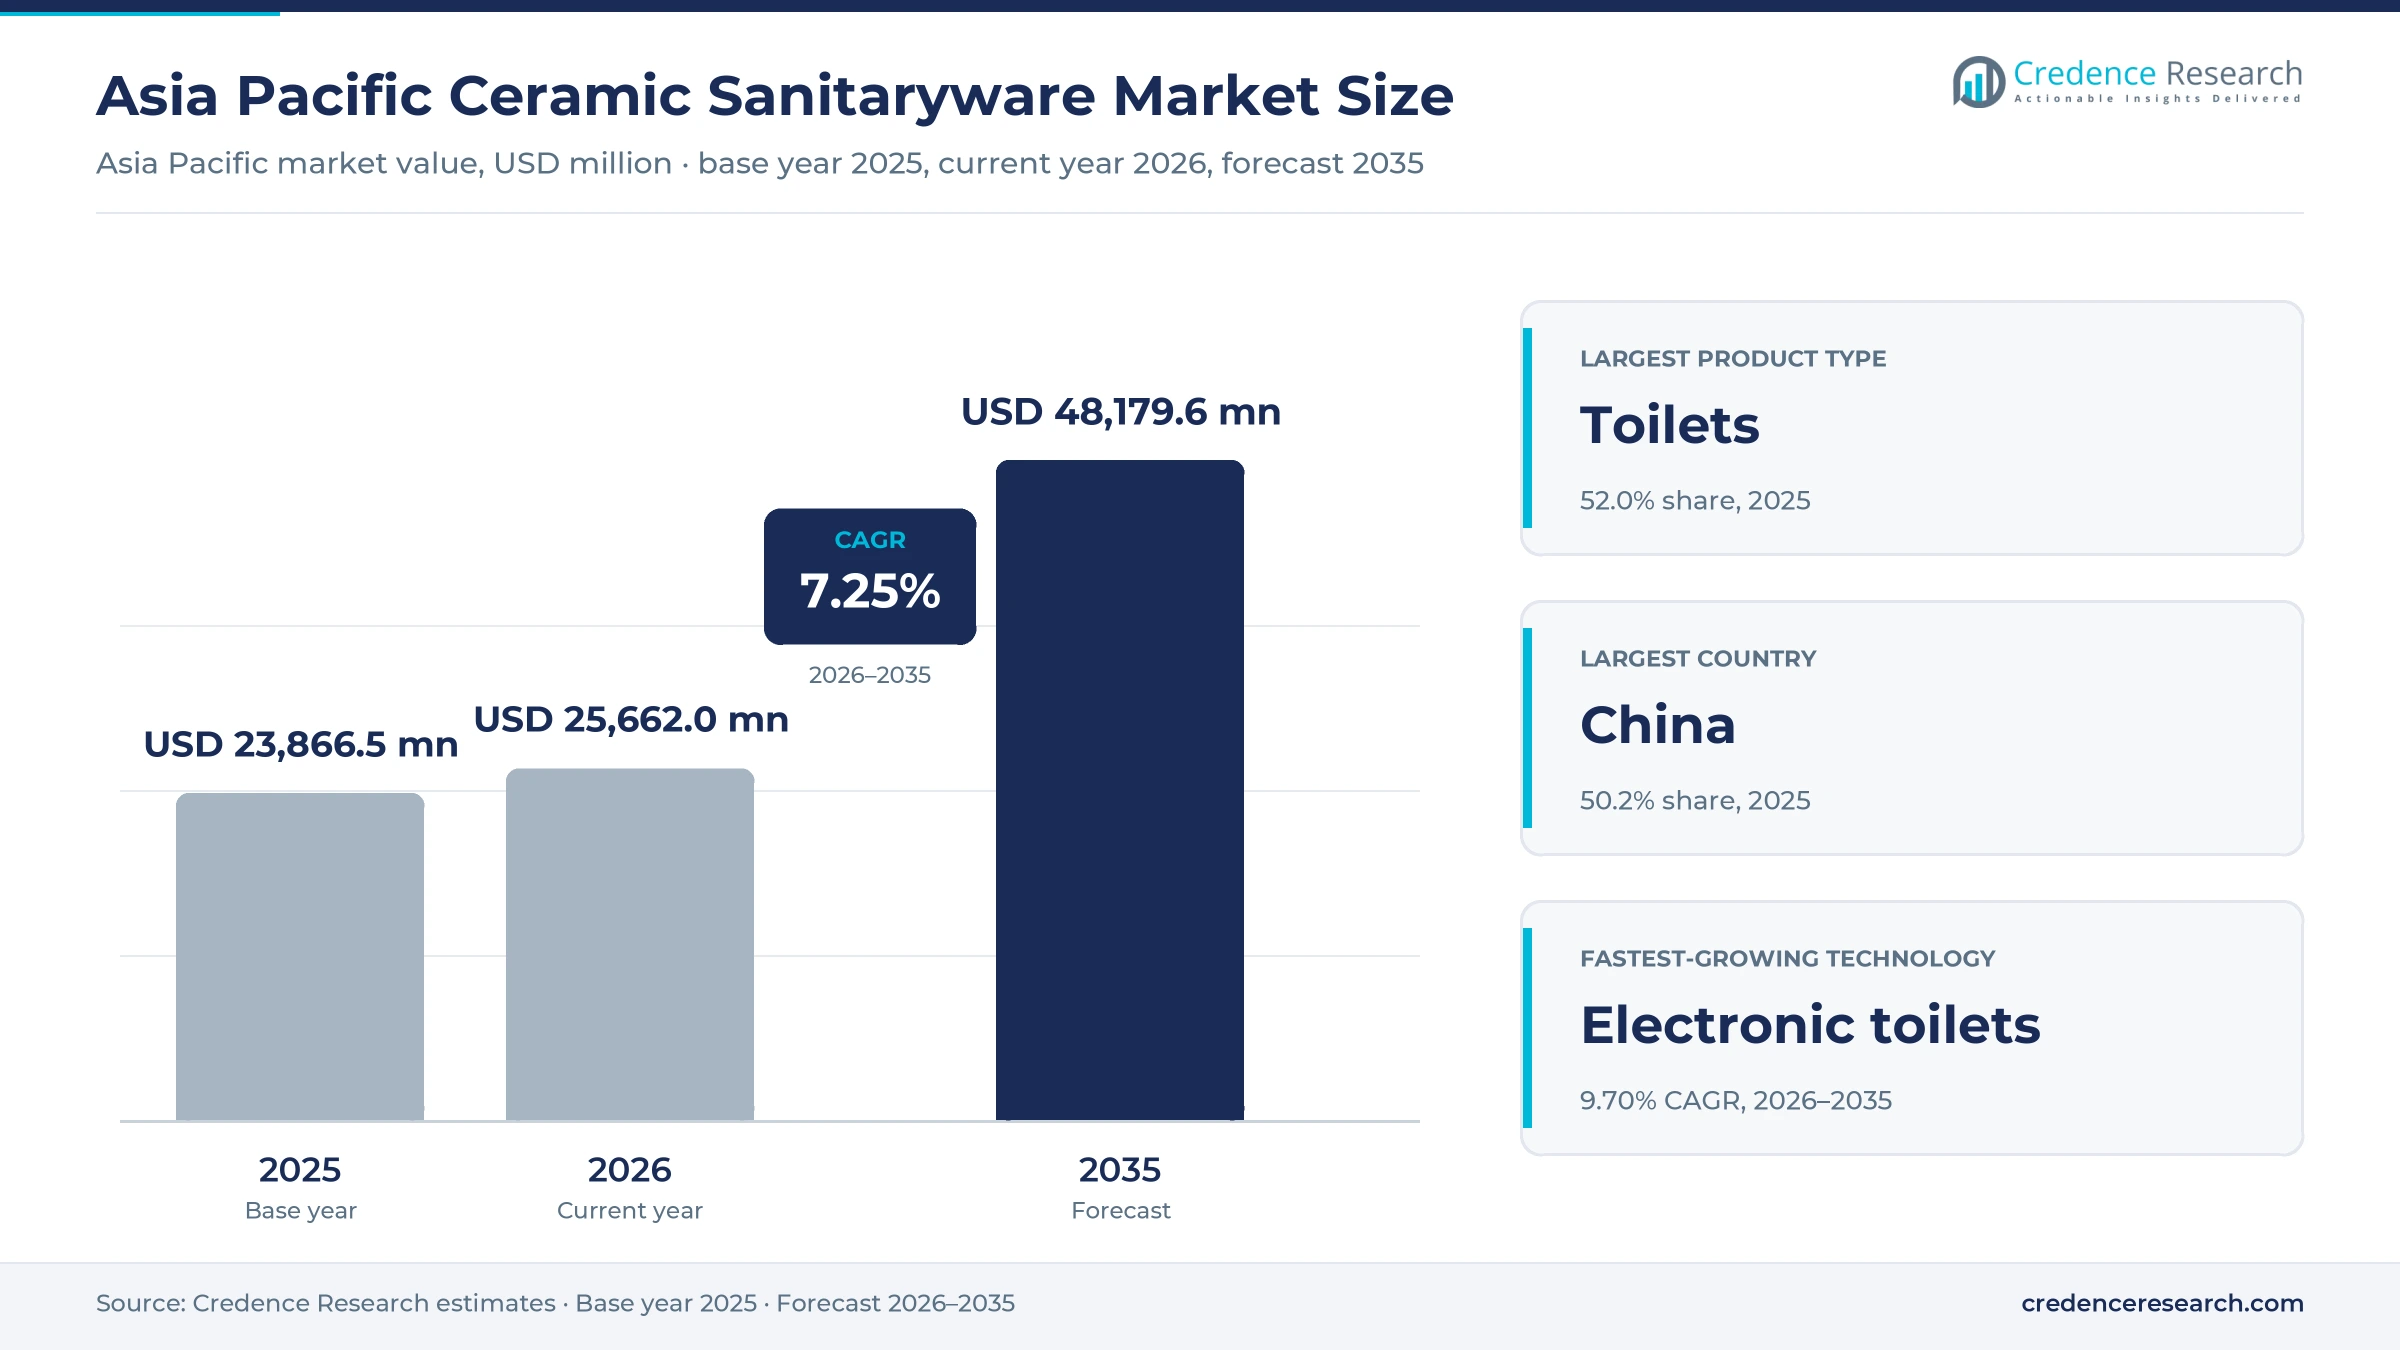
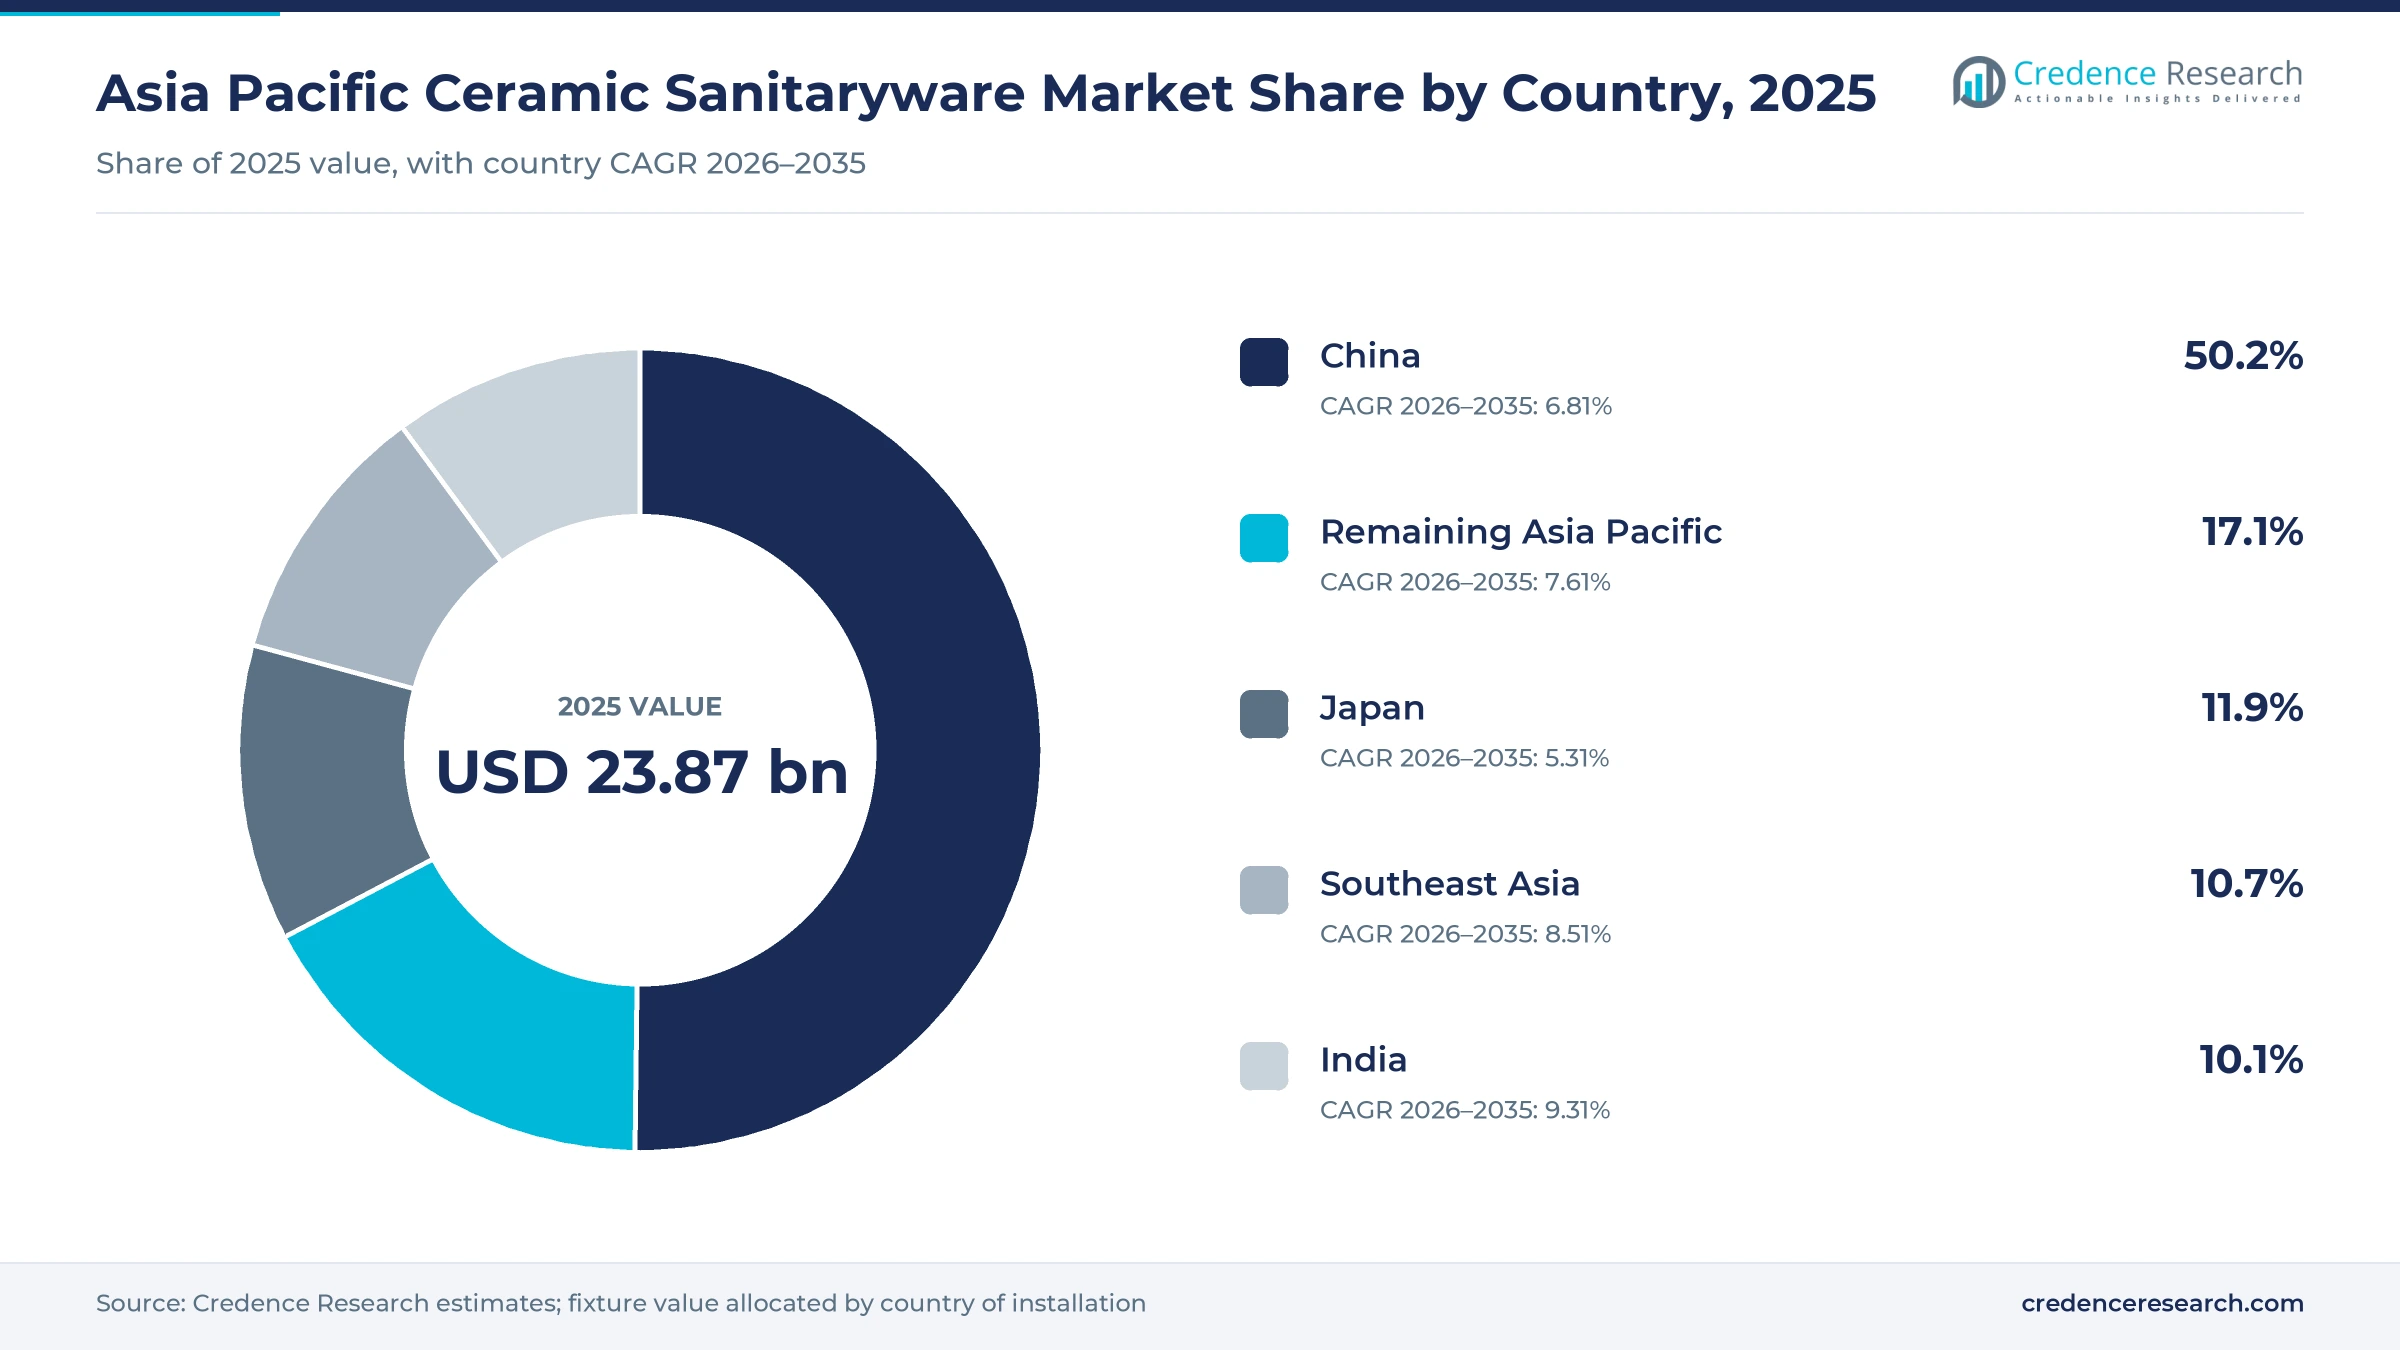
The Asia Pacific ceramic sanitaryware market was valued at USD 23.87 billion in 2025 and is projected to increase from USD 25.66 billion in 2026 to USD 48.18 billion by 2035, registering a CAGR of 7.25% during 2026–2035. Demand comes from new homes built under public housing programs, from owners who replace old high-flush toilets and washbasins, and from hotels, offices and public buildings that need durable fixtures. China held the largest regional share, 50.2% in 2025, because it builds and renovates more housing than any other country in the region. India is the fastest-growing country at 9.31% a year, as urban housing schemes and sanitation programs add bathrooms in cities and towns. In turn, consumer trade-in subsidies in China and minimum water ratings for toilets and urinals in Australia are pushing buyers toward water-saving and electronic models, which raises the average value of each fixture sold across the region.
Which toilets, basins and fixtures does the estimate cover?
The estimate measures the value of vitreous china and fine fireclay water closets and toilets, washbasins, urinals, standalone bidets, squatting pans and ancillary ceramic fixtures sold for installation in Asia Pacific. It covers conventional fixtures, enhanced non-electronic models with water-saving flush and easy-clean glazes, and integrated electronic ceramic toilets with built-in washing functions.
The estimate excludes faucets, showers, cisterns sold on their own, plastic and steel fixtures and installation labor. The value chain runs from clay, feldspar and glaze suppliers through kiln-based manufacturers and importers to dealers, distributors, brand stores, online platforms and project buyers in China, Japan, India, Southeast Asia and the rest of the region.
Asia Pacific Ceramic Sanitaryware Market Insights
- The Asia Pacific ceramic sanitaryware market was valued at USD 23.87 billion in 2025 and is projected to reach USD 48.18 billion by 2035, registering a CAGR of 7.25% during 2026–2035.
- China held a 50.2% share of 2025 value, because over 11 million subsidized and redeveloped housing units were built or raised there during 2021–2025.
- Water closets and toilets led with a 52.0% share of 2025 value, because every new or renovated bathroom needs at least one.
- India approved PMAY-Urban 2.0 on Aug. 9, 2024, to support one crore urban families with housing assistance over five years.
- Integrated electronic ceramic toilets grow fastest by technology at 9.70% a year during 2026–2035, as Japanese and Chinese buyers adopt washing functions.
Toilets lead while electronic models and online sales rise
Why do water closets and toilets lead product demand?
Based on product type, the market is categorized into water closets and toilets, washbasins, urinals, standalone bidets and squatting pans and ancillary fixtures. Water Closets and Toilets led with a 52.0% share of 2025 value, because every new or renovated bathroom needs at least one and toilets carry the highest unit price. Standalone Bidets grow fastest at 8.08% a year, as premium homes and hotels add separate washing fixtures.
How do new homes and renovation split demand?
Based on application, the market is categorized into residential new construction, residential renovation and replacement, commercial and hospitality, and institutional and government. Residential New Construction led with a 44.0% share of 2025 value, because public housing programs in China and India add millions of bathrooms. Residential Renovation and Replacement grows fastest at 7.97% a year, as subsidies reward owners who upgrade old fixtures.
Why are electronic ceramic toilets gaining value?
Based on technology, the market is categorized into conventional ceramic fixtures, enhanced non-electronic ceramic fixtures and integrated electronic ceramic toilets. Conventional Ceramic Fixtures led with a 62.0% share of 2025 value, because most affordable housing projects specify basic models. Integrated Electronic Ceramic Toilets grow fastest at 9.70% a year, as households in Japan, China and South Korea adopt built-in washing and heated seats.
How do dealers and online platforms reach buyers?
Based on distribution channel, the market is categorized into dealer and distributor sales, direct project sales, brand-owned retail sales and e-commerce sales. Dealer and Distributor Sales led with 55.0% of 2025 value, because plumbers and small contractors buy through local showrooms. E-Commerce Sales grow fastest at 9.71% a year, as buyers in China and India compare models online.
| Segment Group | Leading Sub-segment | Share, 2025 | Fastest-growing Sub-segment | CAGR, 2026–2035 |
|---|---|---|---|---|
| By Product Type | Water Closets and Toilets | 52.0% | Standalone Bidets | 8.08% |
| By Application | Residential New Construction | 44.0% | Residential Renovation and Replacement | 7.97% |
| By Technology | Conventional Ceramic Fixtures | 62.0% | Integrated Electronic Ceramic Toilets | 9.70% |
| By Distribution Channel | Dealer and Distributor Sales | 55.0% | E-Commerce Sales | 9.71% |
Request a Free Sample
Fill in your details and we'll send you a free sample report.
- Sample data tables & charts
- Research methodology
Subsidized homes, replacement and water rules lift demand
How does affordable housing procurement lift fixture volumes?
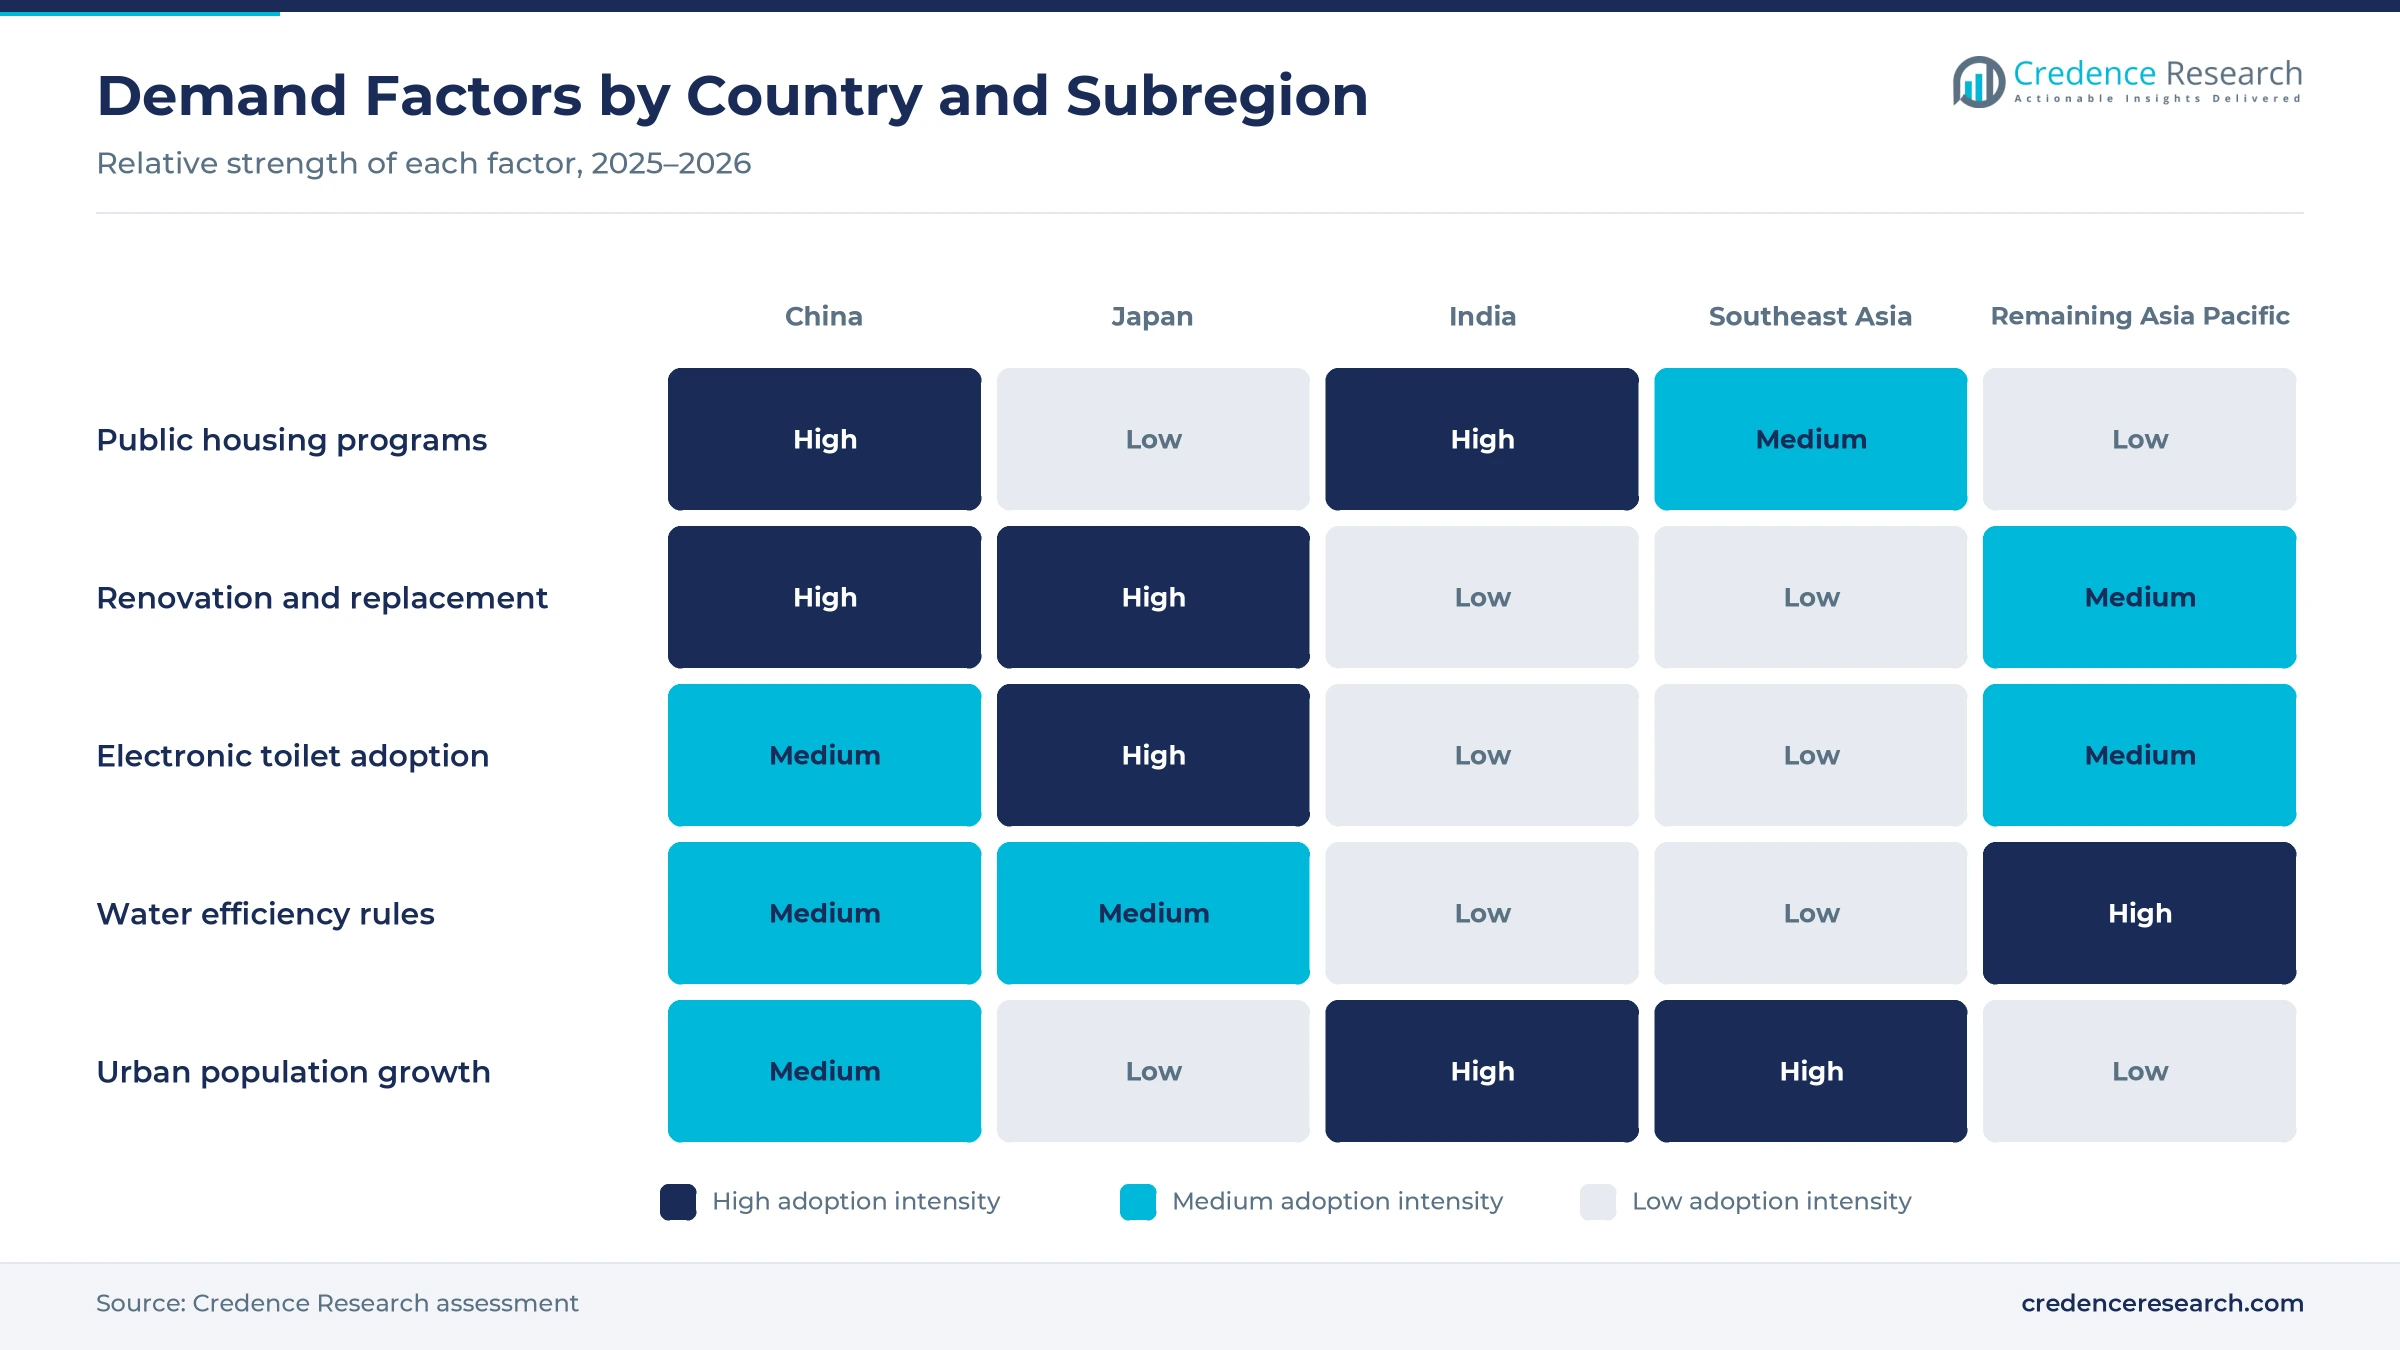
Affordable housing procurement lifts fixture volumes, because every subsidized home needs at least one toilet and washbasin, and developers and agencies buy them in bulk. India's Union Cabinet approved PMAY-Urban 2.0 on Aug. 9, 2024, to support one crore urban poor and middle-class families, with assistance of 2.30 lakh crore rupees over five years, according to All India Radio. India also built 11 crore toilets under the Swachh Bharat Mission, according to a ministerial statement in November 2025. In China, over 11 million units of subsidized housing, urban village redevelopment and dilapidated-house renovation were built or raised during 2021–2025. As a result, residential new construction keeps 44.0% of 2025 value, as project buyers order standard toilets, basins and squatting pans in large lots.
Why does water-efficient bathroom replacement raise value?
Water-efficient bathroom replacement raises value, because owners who swap old high-flush toilets usually buy dual-flush, rimless or electronic models that cost more per unit. China renovated more than 240,000 old residential communities and upgraded 840,000 kilometers of water, gas and heating pipes during 2021–2025, according to the housing ministry. China's commerce ministry also reported that 120 million home decoration, kitchen and bathroom items were bought through the trade-in program in 2025. Henan Province, for example, allowed renovation subsidies of up to 20,000 yuan per house from April 2025. In turn, residential renovation and replacement grows at 7.97% a year, the fastest application rate across the region.
How do WELS-rated toilets and urinals shape Australian demand?
WELS-rated toilets and urinals shape Australian demand, because every toilet and urinal sold must carry a water rating label under the national scheme. Since June 17, 2022, new registrations need at least three stars for dual-flush toilets and two stars for wall-hung urinals, according to the WELS Regulator. Older registrations below those minimums expired on July 21, 2023, and could no longer be sold. The scheme, which marked 20 years on March 18, 2025, now lists nearly 25,000 registered products and has saved over 1,800 gigalitres of water. As a result, Australian buyers of bathroom fittings replace older fixtures with rated models.
Why does urban migration keep adding bathrooms?
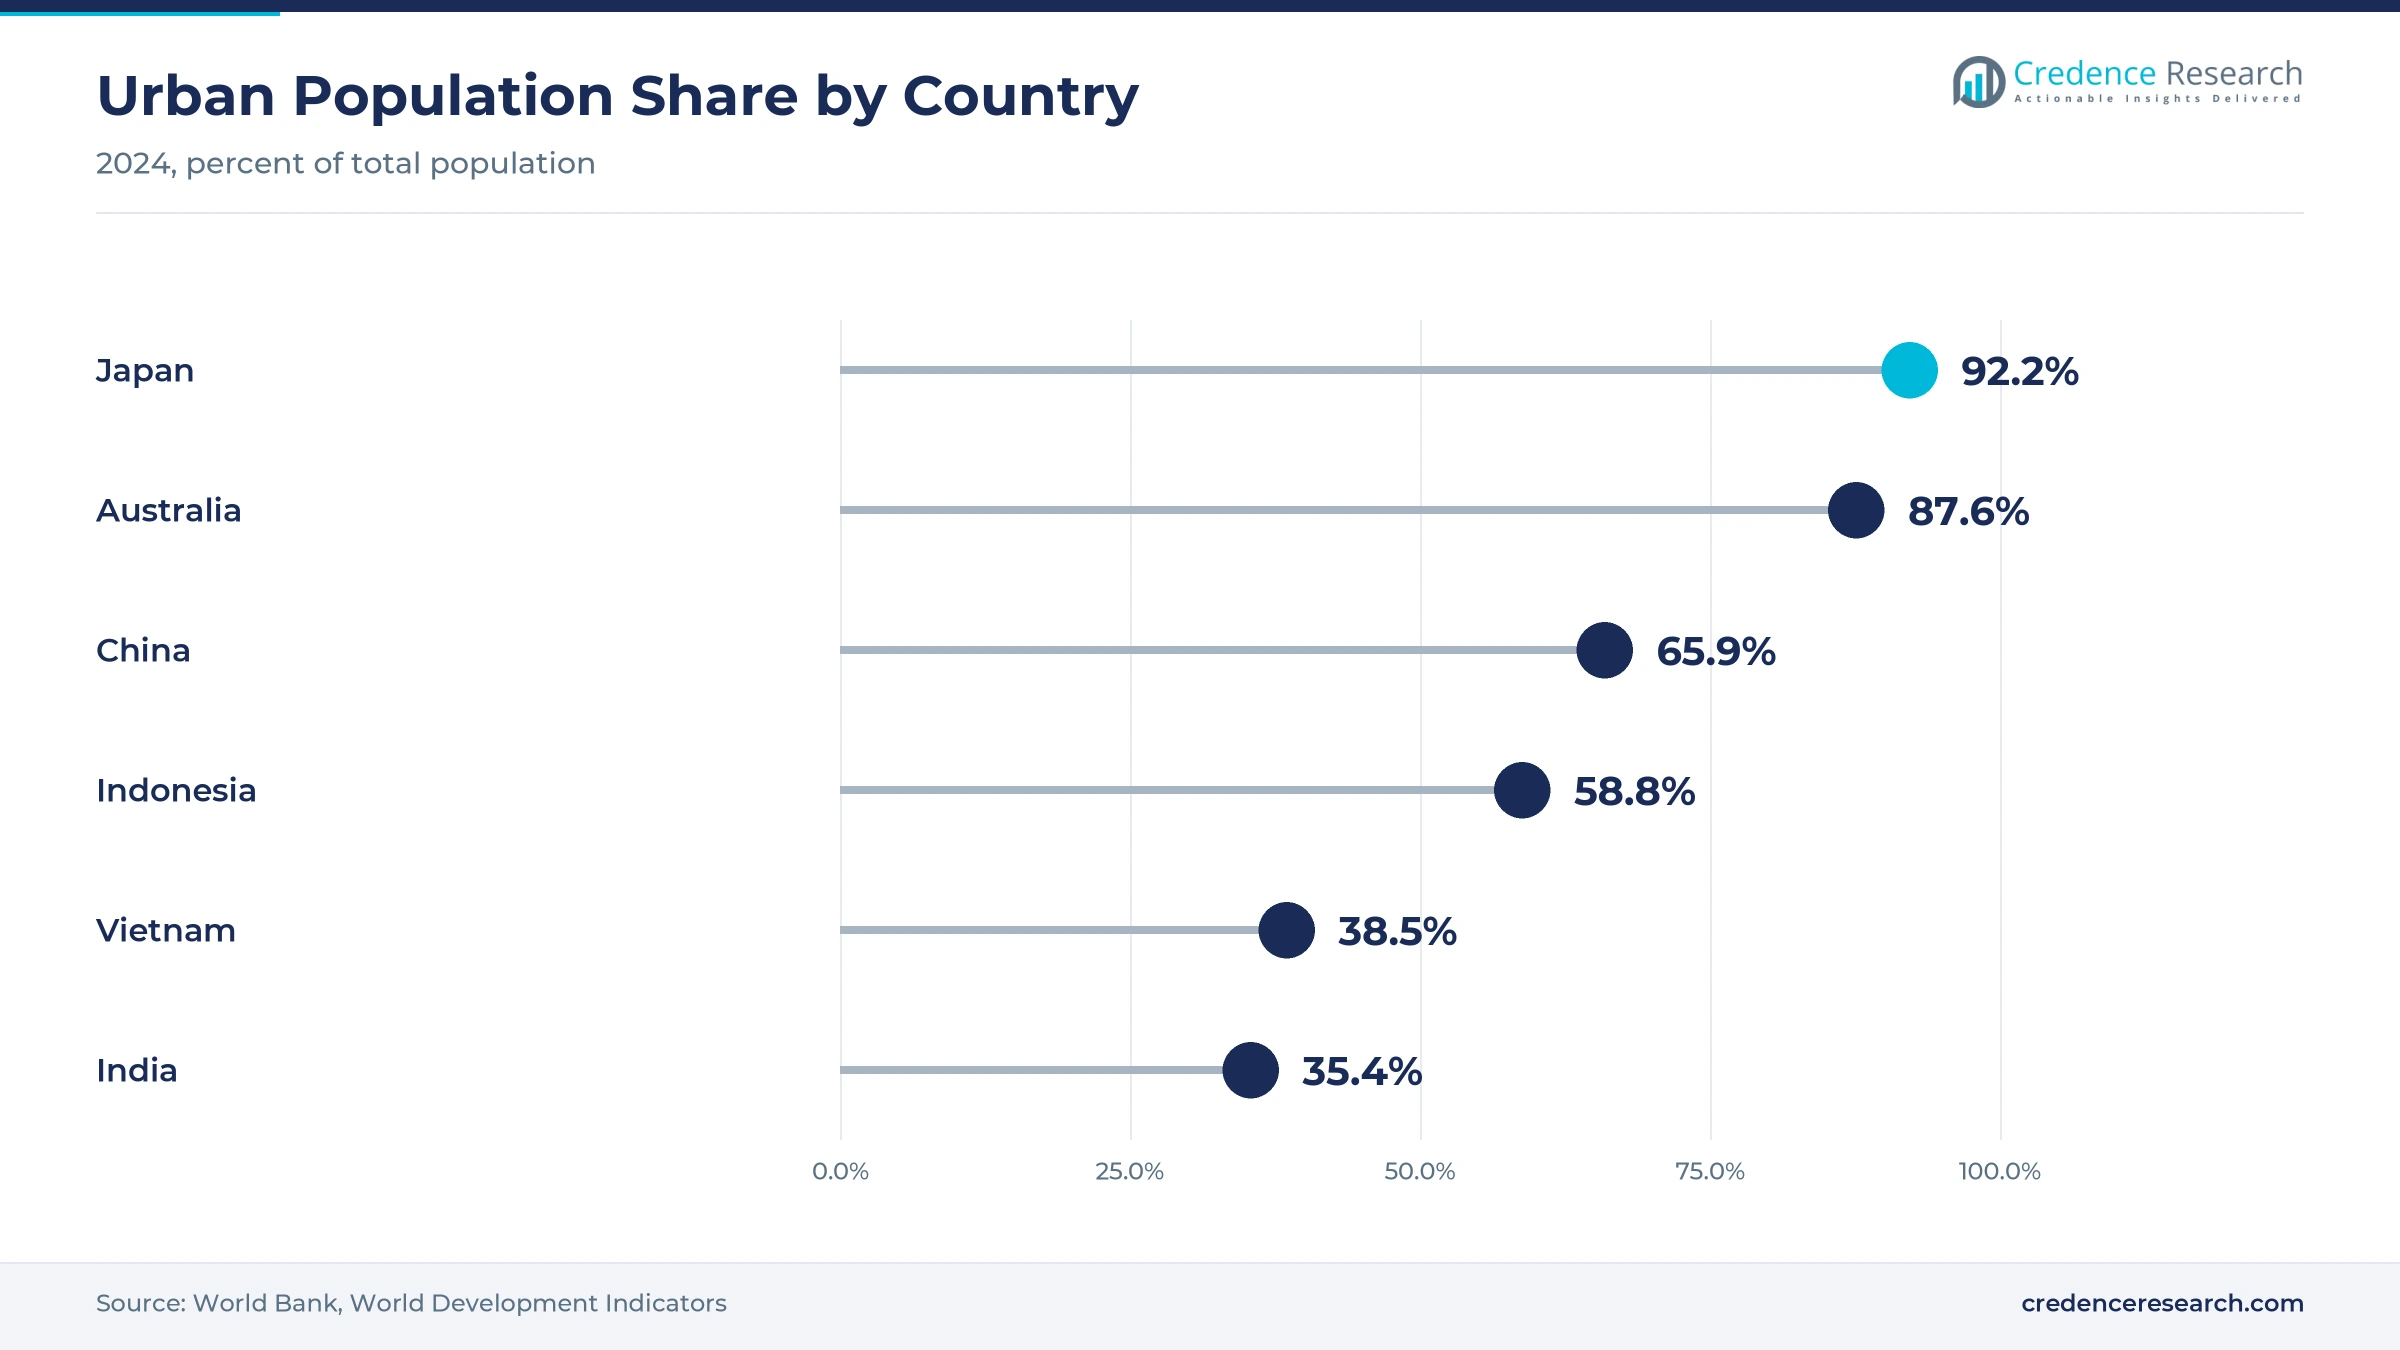
Urban migration keeps adding bathrooms, because people who move to cities need new apartments with modern flush toilets and washbasins. Urban residents made up 65.9% of China's population in 2024, compared with 38.5% in Vietnam and 35.4% in India, according to World Bank data. Japan, by contrast, was already 92.2% urban in 2024, which means most of its demand comes from replacement. Indonesia stood at 58.8% and the Philippines at 55.4% in the same year. In turn, rising urban populations in India, Vietnam and Indonesia need new apartments, which keeps orders for ceramic toilets, washbasins and squatting pans growing each year.
Smart toilets and new plants in Vietnam and India grow
How is the rise of electronic toilets changing product mix?
The rise of electronic toilets is changing product mix, because buyers in Japan and China now expect warm-water washing, heated seats and automatic flushing. A Japan Sanitary Equipment Industry Association survey of 4,700 bidet seat users, reported by Nippon.com on Feb. 20, 2026, found that 53% use the rear spray almost every time. Household penetration of warm-water washing seats in Japan was already above 80% in March 2016, according to the Cabinet Office consumption survey. Henan Province also offered a 15% subsidy, capped at 1,500 yuan, on smart toilets from April 2025. As a result, integrated electronic toilets grow at 9.70% a year, alongside separate electronic bidet seats.
Why is the shift of production to Vietnam and India notable?
The shift of production to Vietnam and India is notable, because leading brands are building plants closer to fast-growing buyers and lower-cost labor. TOTO opened its fourth Vietnamese sanitaryware factory in Hung Yen province in July 2022, raising its capacity there by 1.4 times. The company also completed a USD 100 million faucet factory in Vinh Phuc province on Dec. 12, 2022, its fifth plant in Vietnam. In India, TOTO marked 10 years at its Halol, Gujarat, plant in August 2024, with output up 400% since 2014. LIXIL runs a plant in Andhra Pradesh that makes one million units a year and can scale to two million. In turn, Southeast Asia grows at 8.51% a year, as brands add local capacity near buyers.
Can Japanese replacement demand open a premium path?
Japanese replacement demand opens a premium path, because new home building is shrinking while millions of older bathrooms need upgrades. Japan started only 740,667 new homes in 2025, down 6.5% and the lowest level in 62 years, according to the land ministry. That was the third straight annual decline, as rising prices and a shrinking population cut demand for new houses. Japan still held 11.9% of 2025 regional value, because its buyers pay more for electronic and easy-clean models. As a result, suppliers that sell renovation packages, fast installation and premium washing toilets can grow value even as Japan expands at only 5.31% a year through 2035.
Is there room for online and brand retail in smaller Indian cities?
Online and brand retail have room to grow in smaller Indian cities, because new homeowners there want branded fixtures but have few showrooms nearby. TOTO added 40 new channel partners in 2024 and widened its dealer programs in Tier-2 and Tier-3 cities. Cera Sanitaryware also completed land acquisition for its next phase of sanitaryware capacity, according to a June 2026 interview with its chairman. Meanwhile, PMAY-Urban 2.0 adds subsidized homes in smaller towns where branded fixtures are still uncommon. In turn, e-commerce sales grow at 9.71% a year, the fastest channel rate, as buyers compare toilet and basin models on brand websites and marketplaces.
Property slowdown, kiln costs and low-price rivals weigh
How does the Chinese property slowdown weigh on volumes?
The Chinese property slowdown weighs on volumes, because fewer private apartment projects start each year and developers delay fit-out orders. China accounts for the largest share of regional demand, so a weak building cycle there cuts orders for toilets and basins across the supply chain. As a result, manufacturers face spare kiln capacity and pressure on project prices. Many respond by focusing on renovation, public housing and export markets in Southeast Asia.
Why do kiln energy and raw material costs squeeze margins?
Kiln energy and raw material costs squeeze margins, because ceramic fixtures are fired at high temperatures and use large amounts of clay, feldspar and glaze. Producers that also make floor and wall tiles face the same fuel and mineral costs. In turn, suppliers struggle to pass price rises to dealers and project buyers quickly. Many respond with energy-efficient tunnel kilns, lighter designs and pressure casting that cuts scrap rates.
How do low-price local rivals limit premium sales?
Low-price local rivals limit premium sales, because many small manufacturers in China and India sell basic toilets and basins with little warranty or service. Price-sensitive buyers in affordable housing and rural markets often choose these products over branded models. As a result, leading brands find it harder to win volume in the economy tier. Many respond with value ranges, local plants and dealer financing that narrow the price gap.
Why do installation skill gaps slow upgrades?
Installation skill gaps slow upgrades, because wall-hung toilets, concealed cisterns and electronic models need trained plumbers and electrical connections. Many smaller towns in India and Southeast Asia lack installers who can fit these products correctly. In turn, buyers worry about leaks and repairs and stay with basic floor-mounted models. Suppliers respond with plumber training programs, installation services and warranties tied to certified fitters.
Chinese building scale leads as India grows fastest
| Country | Value, 2025 (USD billion) | Share, 2025 | CAGR, 2026–2035 |
|---|---|---|---|
| China | 11.98 | 50.2% | 6.81% |
| Remaining Asia Pacific | 4.08 | 17.1% | 7.61% |
| Japan | 2.84 | 11.9% | 5.31% |
| Southeast Asia | 2.55 | 10.7% | 8.51% |
| India | 2.41 | 10.1% | 9.31% |
Why does Chinese building scale keep the top share?
China held a 50.2% share of 2025 value and grows at 6.81% a year, because it builds and renovates more homes than any other country in the region. Over 240,000 old residential communities were renovated during 2021–2025, and trade-in subsidies supported bathroom upgrades in 2025. However, growth is slower than in India and Southeast Asia, because private housing starts have weakened and most urban homes already have flush toilets.
How does Japan sustain high-value replacement demand?
Japan held an 11.9% share of 2025 value and grows at 5.31% a year, because nearly all demand now comes from replacing older toilets and basins. Housing starts fell to 740,667 units in 2025, the lowest in 62 years. However, Japanese buyers spend more per fixture, because warm-water washing seats are standard in most homes and many replacements are integrated electronic toilets.
Why is India the fastest-growing country?
India held a 10.1% share of 2025 value and grows fastest at 9.31% a year, because PMAY-Urban 2.0 and sanitation programs add millions of new bathrooms. Only 35.4% of India's population lived in cities in 2024, so urban housing has a long runway. TOTO, LIXIL and Cera Sanitaryware all run plants in the country, which keeps delivered prices low for dealers and builders.
How does Southeast Asia support fixture demand?
Southeast Asia held a 10.7% share of 2025 value and grows at 8.51% a year, because Vietnam, Indonesia and the Philippines are building homes, hotels and offices for growing urban populations. TOTO runs five plants in Vietnam, which supplies both local buyers and export markets. Urban shares of 38.5% in Vietnam and 58.8% in Indonesia leave room for further building.
What drives demand in the remaining Asia Pacific markets?
The remaining Asia Pacific markets held a 17.1% share of 2025 value and grow at 7.61% a year, because South Korea, Taiwan, Australia and New Zealand have mature housing stocks. Australia's WELS minimum ratings push replacement toward three-star toilets, while South Korean buyers favor electronic bidet functions.
Housing, subsidy and plant milestones from 2024 to 2026
| Development | Status and market relevance |
|---|---|
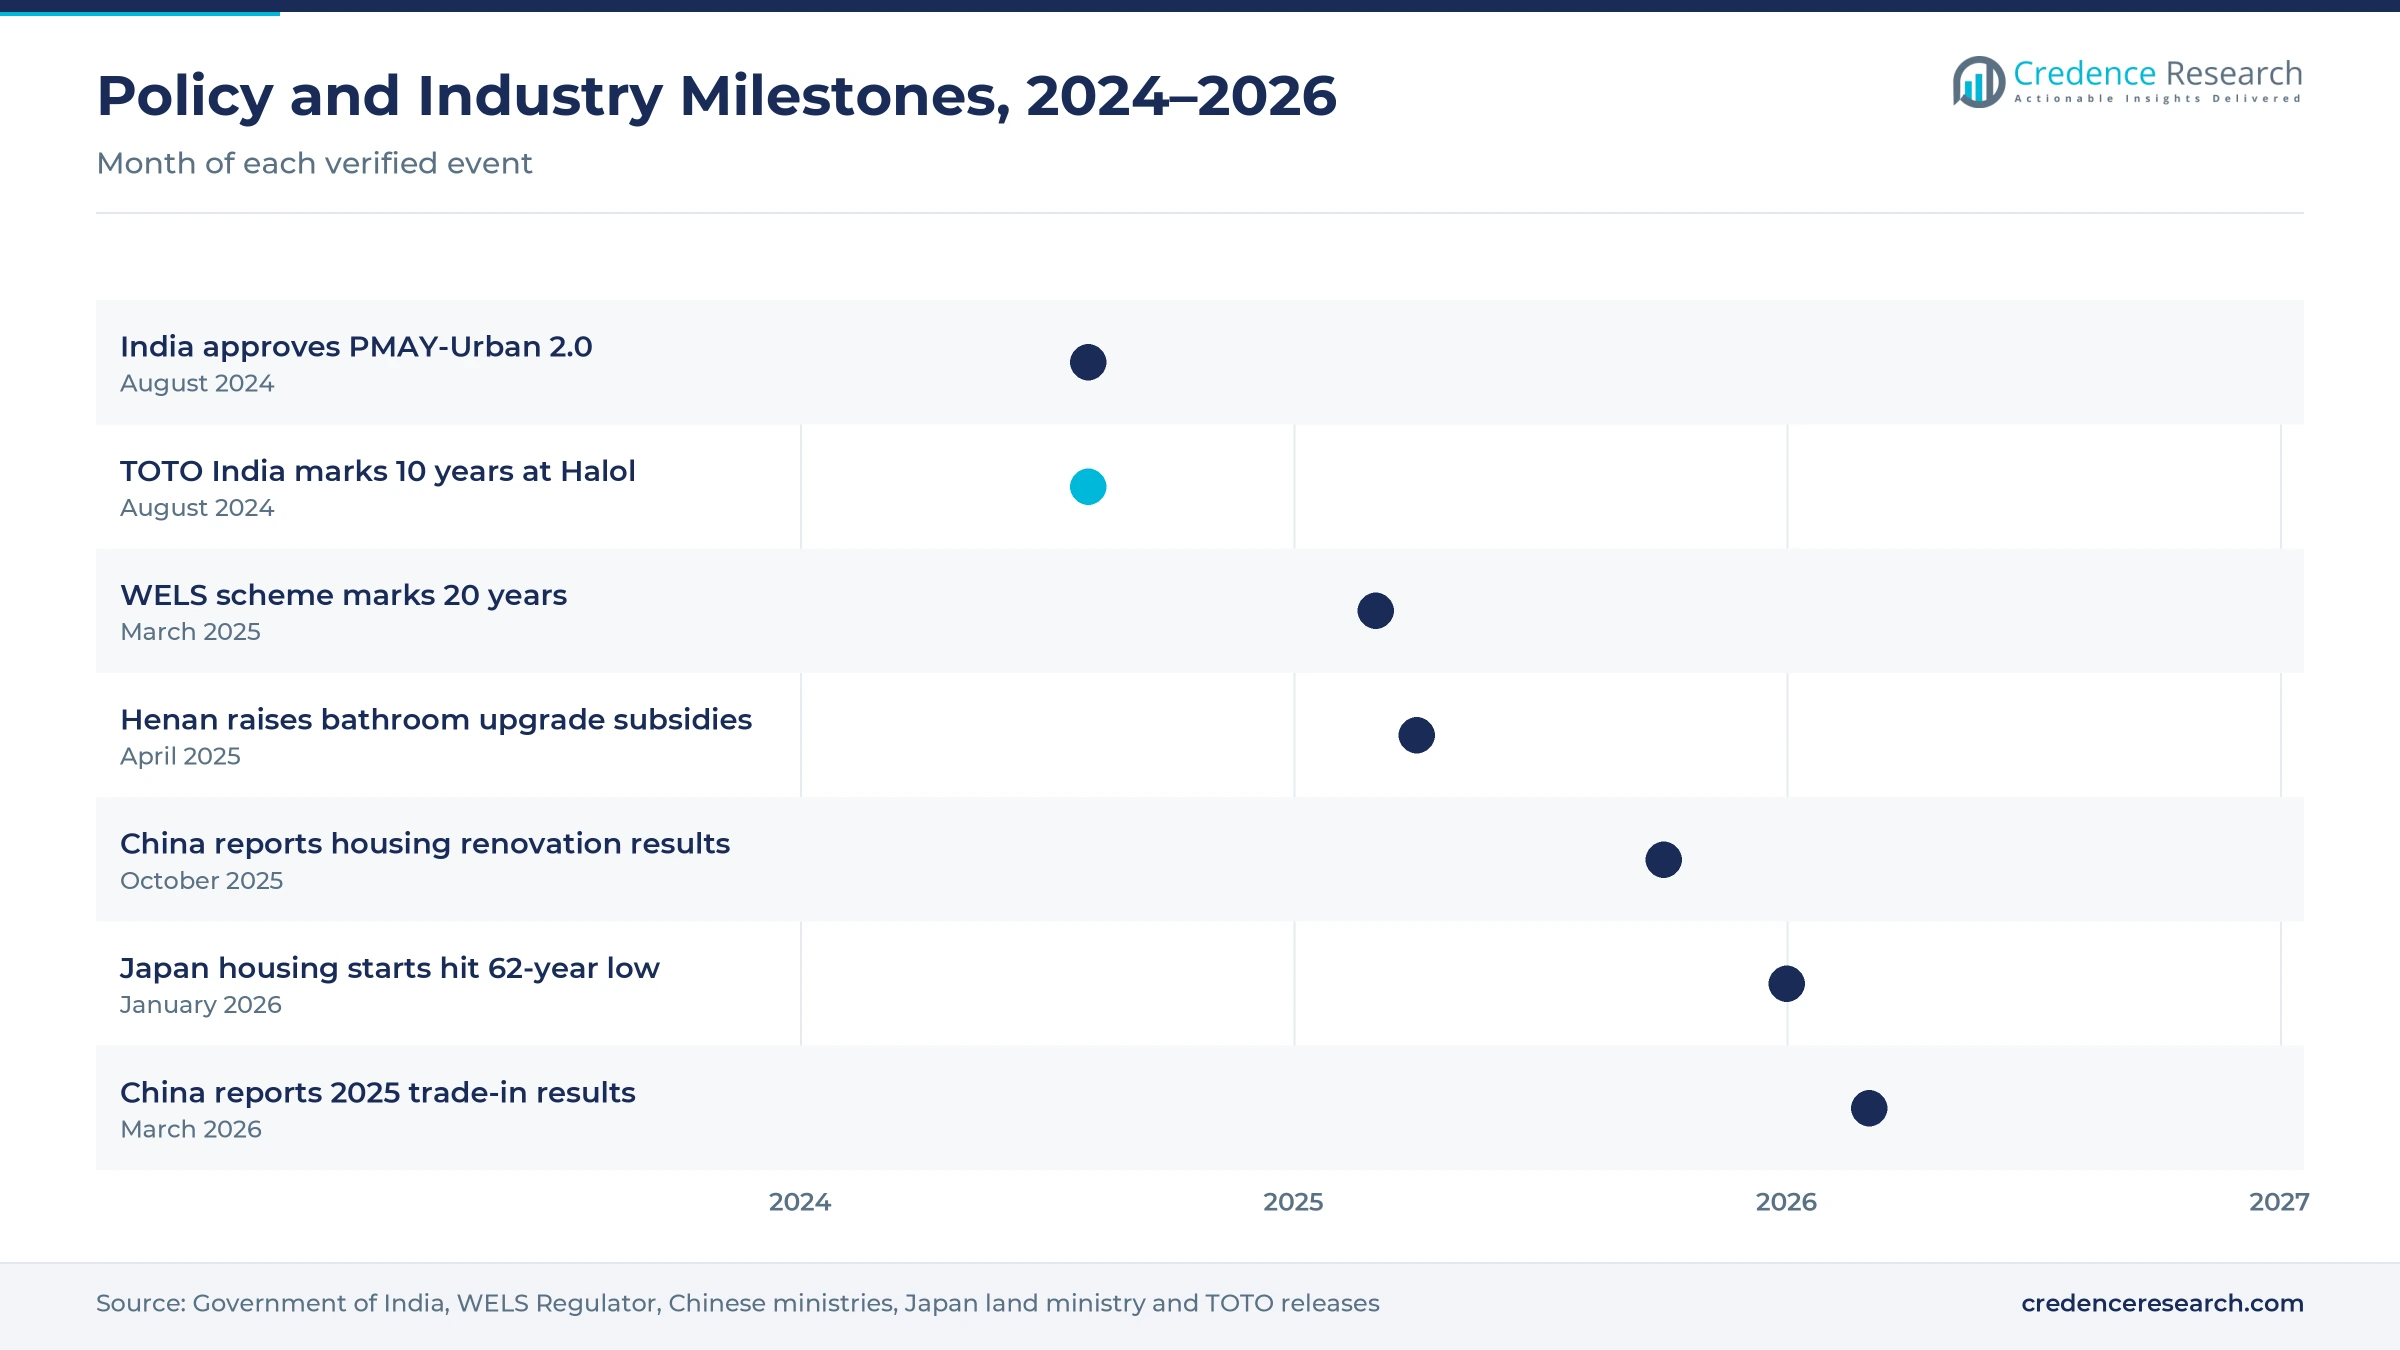
| In August 2024, India's Union Cabinet approved PMAY-Urban 2.0 to support one crore urban families. | Adds demand for toilets and basins in subsidized homes |
| In August 2024, TOTO India marked 10 years of production at its Halol, Gujarat, plant. | Added 40 channel partners and new toilet and basin ranges |
| In April 2025, Henan Province increased subsidies for kitchen and bathroom upgrades and smart toilets. | Up to 20,000 yuan per house for renovation contracts |
| In October 2025, China's housing ministry reported over 240,000 old communities renovated during 2021–2025. | Confirms large public renovation demand for fixtures |
| In March 2026, China's commerce ministry reported 120 million home decoration, kitchen and bathroom items bought through trade-ins in 2025. | Shows subsidy support for bathroom replacement |
Water-saving and electronic designs reshape toilets
- Conventional ceramic fixtures use slip-cast vitreous china with standard flush mechanisms, which suits affordable housing and public projects that buy on price.
- Enhanced non-electronic ceramic fixtures add dual-flush valves, rimless bowls and easy-clean glazes, which help toilets meet WELS ratings and cut cleaning time.
- Integrated electronic ceramic toilets combine the bowl with warm-water washing, heated seats, automatic flushing and deodorizing, which suits premium homes and hotels in Japan, China and South Korea.
Need a Custom Version of This Report?
Tailor the scope, geography, or segments to your exact requirements.
- Custom geography or segment scope
- Direct access to our analyst team
Japanese, European and Indian brands compete for dealers
Competition is split between Japanese and European brands that sell premium and electronic models and local manufacturers that compete on price in China and India. TOTO runs five plants in Vietnam and a plant at Halol in Gujarat, and it sells integrated electronic toilets across the region. LIXIL, which owns American Standard and GROHE, runs a sanitaryware plant in Andhra Pradesh that can scale to two million units a year. Cera Sanitaryware has completed land acquisition for its next phase of capacity in India, while Roca sells under the Parryware brand. Hindware also competes for Indian dealers and project buyers with its own ranges. Rivals compete on design, water efficiency, glaze quality, dealer reach and price. Because housing programs buy in bulk while homeowners buy through showrooms, suppliers with both project sales teams and wide dealer networks win the most business.
Companies profiled and their roles in this market
| Company | Type | Role in the market |
|---|---|---|
| TOTO | Japanese sanitaryware maker | Five plants in Vietnam and a plant at Halol, Gujarat |
| LIXIL (American Standard, GROHE) | Japanese building products group | Sanitaryware plant in Andhra Pradesh, India |
| Cera Sanitaryware | Indian sanitaryware maker | Land acquired for next sanitaryware capacity phase |
| Roca Bathroom Products (Parryware) | European-owned bathroom group | Seven manufacturing facilities in India in 2022 |
Credence Research view on regional bathroom demand
Credence Research's view is that Asia Pacific demand for ceramic sanitaryware will grow steadily because housing programs, urban migration and bathroom renovation all add fixtures. Toilets remain the core of the market, while electronic models and water-saving designs raise the value of each sale. India and Southeast Asia will add most new volume, while China and Japan shift toward replacement and premium products. Suppliers that combine local plants, wide dealer networks and electronic toilet ranges should gain share fastest.
How the regional fixture value estimate was built
The report uses 2025 as the base year on a calendar basis, and market values come from the Credence Research model. That model combines housing program data, urbanization statistics, renovation and trade-in figures, water efficiency rules and company announcements on plants and dealer networks. Segment splits and country growth rates are Credence Research estimates, while country shares follow the client-defined split. Sources used are public reports, official statistics, trade press and company releases, and no interviews or surveys were used.
Renovation and smart toilets carry growth to 2035
Fixture value is expected to reach USD 48.18 billion by 2035, a 7.25% CAGR during 2026–2035, as housing programs, renovation and electronic toilets lift demand across the region. Growth should stay strong through 2030 while India and Southeast Asia expand urban housing. After that, replacement in China and Japan and premium electronic models will carry more growth. Stable energy prices would support margins, while a deeper property slowdown would cut project volumes. Suppliers with local plants and strong dealer reach are expected to gain the most.
Frequently Asked Questions
How big is the Asia Pacific ceramic sanitaryware market?
Which product type leads regional demand?
Which country leads the Asia Pacific ceramic sanitaryware market?
How do WELS rules affect toilets in Australia?
How does PMAY-Urban 2.0 support demand in India?
Which technology is growing fastest?
Who are the leading companies in Asia Pacific sanitaryware?
What are the main challenges for suppliers?
Table of Content
Chapter 1 Market Segmentation
- 1.1 Segmentation Framework
- 1.1.1 Product and Service Classification
- 1.1.2 Application and End-Use Classification
- 1.1.3 Technology and Solution Classification
- 1.1.4 Customer and Distribution Channel Classification
- 1.1.5 Geographic Segmentation
- 1.1.6 Market Segment Definitions and Boundaries
- 1.2 By Product Type
- 1.2.1 Water Closets and Toilets
- 1.2.2 Washbasins
- 1.2.3 Urinals
- 1.2.4 Standalone Bidets
- 1.2.5 Squatting Pans and Ancillary Fixtures
- 1.3 By Application
- 1.3.1 Residential New Construction
- 1.3.2 Residential Renovation and Replacement
- 1.3.3 Commercial and Hospitality
- 1.3.4 Institutional and Government
- 1.4 By Technology
- 1.4.1 Conventional Ceramic Fixtures
- 1.4.2 Enhanced Non-Electronic Ceramic Fixtures
- 1.4.3 Integrated Electronic Ceramic Toilets
- 1.5 By Country
- 1.5.1 China
- 1.5.2 Japan
- 1.5.3 India
- 1.5.4 Southeast Asia
- 1.5.5 Remaining Asia Pacific
Chapter 2 Introduction
- 2.1 Report Objectives and Scope
- 2.2 Product Definition and Industry Terminology
- 2.3 Market Inclusions and Exclusions
- 2.4 Research Process
- 2.4.1 Primary Research and Expert Interviews
- 2.4.2 Secondary Research and Source Review
- 2.4.3 Top-Down and Bottom-Up Estimation
- 2.4.4 Data Triangulation and Verification
- 2.5 Market Size Measurement Basis
- 2.5.1 2025: USD 23.87 billion → 2035: USD 48.18 billion
- 2.6 Historical and Forecast Reference Periods
- 2.6.1 Historical Period: 2018-2025
- 2.6.2 Base Year: 2025
- 2.6.3 Forecast Period: 2025-2035
- 2.7 Research Assumptions and Limitations
Chapter 3 Executive Summary
- 3.1 Market Snapshot and Key Findings
- 3.2 Base-Year Market Size, 2025
- 3.3 Forecast Market Size, 2035
- 3.4 Revenue and Volume Growth Outlook
- 3.5 Key Demand and Supply Indicators
- 3.6 Leading Market Segments
- 3.7 Fastest-Growing Market Opportunities
- 3.8 Regional Performance Highlights
- 3.9 Technology and Industry Transformation
- 3.10 Competitive Landscape Summary
- 3.11 Analyst View and Strategic Implications
Chapter 4 Asia Pacific Ceramic Sanitaryware Market Trends and Developments
- 4.1 Historical Industry Development, 2018-2025
- 4.2 Recent Market Trends and Developments
- 4.3 Demand and Customer Behavior Trends
- 4.4 Technology and Product Innovation
- 4.5 Artificial Intelligence, Automation and Digitalization
- 4.6 Local Manufacturing and Supply Chain Realignment
- 4.7 Industry Partnerships, Mergers and Acquisitions
- 4.8 Sustainability and Circular Economy Developments
- 4.9 Government and Private Sector Investment Trends
- 4.10 Emerging Business Models and Commercialization
- 4.11 Industry Developments and Announcements
Chapter 5 Asia Pacific Ceramic Sanitaryware Market Production, Supply and Demand Analysis
- 5.1 Demand Trend and Consumption Analysis, 2018-2025
- 5.2 Demand Forecast, 2025-2035
- 5.3 Production and Output Trend, 2018-2025
- 5.4 Production and Output Forecast, 2025-2035
- 5.5 Installed Capacity and Capacity Utilization
- 5.6 Company-Wise Production Plants and Statistics
- 5.6.1 Installed Production Capacity
- 5.6.2 Actual Production
- 5.6.3 Planned Capacity and Expansion Targets
- 5.7 Supply Chain Structure and Procurement Trends
- 5.8 Supply-Demand Gap and Bottlenecks
- 5.9 Import Dependence and Sourcing Structure
- 5.10 Contract Manufacturing and Outsourcing
- 5.11 Regional Supply and Demand Concentration
Chapter 6 Asia Pacific Ceramic Sanitaryware Market Pricing Analysis
- 6.1 Pricing Structure and Measurement
- 6.2 Historical Pricing Trends, 2018-2025
- 6.3 Pricing Outlook, 2025-2035
- 6.4 Average Selling Price and Unit Economics
- 6.5 Pricing by Product and Market Segment
- 6.6 Geographic Pricing Differences
- 6.7 Key Input, Energy, Labor and Logistics Costs
- 6.8 Contract Pricing and Purchasing Models
- 6.9 Pricing Sensitivity and Competitive Positioning
- 6.10 Price, Margin and Profitability Implications
Chapter 7 Asia Pacific Ceramic Sanitaryware Market Dynamics
- 7.1 Market Growth Drivers
- 7.1.1 Demand-Side Drivers
- 7.1.2 Technology and Innovation Drivers
- 7.1.3 Infrastructure and Investment Drivers
- 7.1.4 Regulatory and Policy Drivers
- 7.2 Market Restraints
- 7.2.1 Cost and Affordability Constraints
- 7.2.2 Technology and Adoption Barriers
- 7.2.3 Supply Chain and Operational Constraints
- 7.3 Market Challenges
- 7.3.1 Competitive Pressure and Margin Erosion
- 7.3.2 Skills, Infrastructure and Implementation Gaps
- 7.4 Emerging Market Opportunities
- 7.5 Market Dynamics Impact and Time-Horizon Assessment
Chapter 8 Asia Pacific Ceramic Sanitaryware Value Chain Analysis
- 8.1 Industry Value Chain Overview
- 8.2 Upstream Suppliers and Critical Inputs
- 8.3 Technology and Component Providers
- 8.4 Manufacturing or Service Delivery
- 8.5 Distribution, Channel Partners and Integrators
- 8.6 Downstream Applications and End Users
- 8.7 Value Addition and Profit Pools
- 8.8 Vertical Integration and Outsourcing
- 8.9 Supplier Concentration and Risk
- 8.10 Supply Chain Localization and Resilience
Chapter 9 Asia Pacific Ceramic Sanitaryware Market Regulations and Policies
- 9.1 Relevant Laws, Standards and Compliance Frameworks
- 9.2 Product, Service, Safety and Quality Requirements
- 9.3 Government Policies, Incentives and Subsidies
- 9.4 Imports, Exports and Trade Barriers
- 9.5 Public Procurement and Local Content Requirements
- 9.6 Environmental and Sustainability Compliance
- 9.7 Upcoming Policy Changes and Market Implications
Chapter 10 Asia Pacific Ceramic Sanitaryware Market Hotspots and Opportunities
- 10.1 Market Opportunity Mapping and Growth Hotspots
- 10.2 High-Growth Applications and Customer Groups
- 10.3 Underserved Markets and White-Space Opportunities
- 10.4 Emerging Technology and Product Opportunities
- 10.5 New Capacity and Investment Hotspots
- 10.6 Market Entry and Expansion Opportunities
- 10.7 Distribution and Partnership Opportunities
- 10.8 Near-Term and Long-Term Commercial Potential
- 10.9 Opportunity Attractiveness and Execution Risks
Chapter 11 Asia Pacific Ceramic Sanitaryware Market Outlook, 2025-2035
- 11.1 Market Size and Analysis
- 11.1.1 Revenue (Market Measurement: 2025: USD 23.87 billion → 2035: USD 48.18 billion)
- 11.1.2 Market Volume and Quantity Sold
- 11.1.3 Historical Market Size, 2018-2025
- 11.1.4 Base-Year Market Size, 2025
- 11.2 Market Forecast, 2025-2035
- 11.2.1 Revenue Forecast to 2035
- 11.2.2 Volume Forecast to 2035
- 11.2.3 CAGR and Year-on-Year Growth
- 11.2.4 Incremental Revenue Opportunity
- 11.3 Forecast Assumptions and Scenario Analysis
- 11.3.1 Base-Case Forecast
- 11.3.2 Optimistic and Conservative Scenarios
- 11.3.3 Technology, Pricing and Policy Sensitivities
- 11.4 Market Attractiveness and Growth Outlook
Chapter 12 Asia Pacific Ceramic Sanitaryware Market Segmentation and Outlook
- 12.1 Segmentation Summary and Market Shares, 2025
- 12.2 Largest and Fastest-Growing Segments
- 12.3 By Product Type - Market Size and Forecast, 2025-2035
- 12.3.1 Segment Definition and Scope
- 12.3.2 Historical Market Size, 2018-2025
- 12.3.3 Revenue Forecast, 2025-2035
- 12.3.4 Volume Forecast, 2025-2035
- 12.3.5 Base-Year Market Share, 2025
- 12.3.6 Segment CAGR and Growth Drivers
- 12.3.7 Subsegment Market Size and Forecast
- 12.3.7.1 Water Closets and Toilets
- 12.3.7.2 Washbasins
- 12.3.7.3 Urinals
- 12.3.7.4 Standalone Bidets
- 12.3.7.5 Squatting Pans and Ancillary Fixtures
- 12.3.8 Subsegment Pricing and Adoption Trends
- 12.3.9 Leading Suppliers and Competition
- 12.3.10 Regional Demand and Opportunities
- 12.4 By Application - Market Size and Forecast, 2025-2035
- 12.4.1 Segment Definition and Scope
- 12.4.2 Historical Market Size, 2018-2025
- 12.4.3 Revenue Forecast, 2025-2035
- 12.4.4 Volume Forecast, 2025-2035
- 12.4.5 Base-Year Market Share, 2025
- 12.4.6 Segment CAGR and Growth Drivers
- 12.4.7 Subsegment Market Size and Forecast
- 12.4.7.1 Residential New Construction
- 12.4.7.2 Residential Renovation and Replacement
- 12.4.7.3 Commercial and Hospitality
- 12.4.7.4 Institutional and Government
- 12.4.8 Subsegment Pricing and Adoption Trends
- 12.4.9 Leading Suppliers and Competition
- 12.4.10 Regional Demand and Opportunities
- 12.5 By Technology - Market Size and Forecast, 2025-2035
- 12.5.1 Segment Definition and Scope
- 12.5.2 Historical Market Size, 2018-2025
- 12.5.3 Revenue Forecast, 2025-2035
- 12.5.4 Volume Forecast, 2025-2035
- 12.5.5 Base-Year Market Share, 2025
- 12.5.6 Segment CAGR and Growth Drivers
- 12.5.7 Subsegment Market Size and Forecast
- 12.5.7.1 Conventional Ceramic Fixtures
- 12.5.7.2 Enhanced Non-Electronic Ceramic Fixtures
- 12.5.7.3 Integrated Electronic Ceramic Toilets
- 12.5.8 Subsegment Pricing and Adoption Trends
- 12.5.9 Leading Suppliers and Competition
- 12.5.10 Regional Demand and Opportunities
- 12.6 By Country - Market Size and Forecast, 2025-2035
- 12.6.1 Segment Definition and Scope
- 12.6.2 Historical Market Size, 2018-2025
- 12.6.3 Revenue Forecast, 2025-2035
- 12.6.4 Volume Forecast, 2025-2035
- 12.6.5 Base-Year Market Share, 2025
- 12.6.6 Segment CAGR and Growth Drivers
- 12.6.7 Subsegment Market Size and Forecast
- 12.6.7.1 China
- 12.6.7.2 Japan
- 12.6.7.3 India
- 12.6.7.4 Southeast Asia
- 12.6.7.5 Remaining Asia Pacific
- 12.6.8 Subsegment Pricing and Adoption Trends
- 12.6.9 Leading Suppliers and Competition
- 12.6.10 Regional Demand and Opportunities
- 12.7 Segment Growth Comparison
- 12.8 Segment Attractiveness and Priority Matrix
Chapter 13 Asia Pacific Ceramic Sanitaryware End-Use and Application Market Outlook
- 13.1 End-Use Industry and Customer Demand Structure
- 13.2 Leading Applications and Customer Groups
- 13.3 End-Use Market Size, Share and Forecast
- 13.4 Major End-Use Industry Deep Dives
- 13.4.1 Customer Requirements and Use Cases
- 13.4.2 Demand and Replacement Cycles
- 13.4.3 Technical and Regulatory Considerations
- 13.4.4 Purchasing and Procurement Models
- 13.4.5 Leading Vendors and Distribution Channels
- 13.4.6 Forecast and Commercial Opportunities
- 13.5 Emerging Applications and Cross-Segment Demand
- 13.6 End-Use Industry Investment Priorities
Chapter 14 Asia Pacific Ceramic Sanitaryware Geographic Market Outlook, 2025-2035
- 14.1 Regional Market Size and Country-Level Shares, 2025
- 14.2 Country Market Size Comparison, 2025
- 14.3 Country Market Forecasts, 2025-2035
- 14.4 Subregional Industrial and Demand Clusters
- 14.5 Intra-Regional Pricing and Cost Differences
- 14.6 Cross-Border Trade and Supply Networks
- 14.7 Regional Supply and Demand Balances
- 14.8 Country Opportunity Comparison and Prioritization
Note: Every listed country is covered on the structure shown under the first country.
Chapter 15 Asia Pacific Ceramic Sanitaryware Technology, Innovation and Sustainability Outlook
- 15.1 Technology Landscape and Maturity
- 15.2 Product, Process and Service Innovation
- 15.3 AI, Automation and Digital Tools in the Industry
- 15.4 Technology Adoption and Performance Benchmarking
- 15.5 Innovation Pipeline and R&D Investment
- 15.6 Patent and Intellectual Property Trends
- 15.7 Energy Efficiency and Resource Management
- 15.8 Sustainability, Recycling and Circularity
- 15.9 Technology Roadmap, 2025-2035
- 15.10 Risks of Obsolescence and Technology Substitution
Chapter 16 Asia Pacific Ceramic Sanitaryware Market Key Strategic Imperatives
- 16.1 Growth and Market Entry Priorities
- 16.2 High-Return Products and Segments
- 16.3 Pricing, Profitability and Cost Optimization
- 16.4 Technology Investment and Product Differentiation
- 16.5 Supply Chain Localization and Resilience
- 16.6 Distribution and Customer Acquisition
- 16.7 Partnership, Acquisition and Capacity Strategy
- 16.8 Regional Expansion Priorities
- 16.9 Short-, Medium- and Long-Term Actions
Chapter 17 Competition Outlook
- 17.1 Industry Competition Characteristics
- 17.2 Market Structure and Concentration
- 17.3 Market Share and Competitive Positioning, 2025
- 17.4 Company-Wise Revenue and Product Benchmarking
- 17.5 Production and Service Capacity Benchmarking
- 17.6 Technology, Pricing and Differentiation
- 17.7 Regional Footprint and Distribution Strength
- 17.8 Mergers, Acquisitions and Strategic Alliances
- 17.9 New Entrants and Competitive Threats
- 17.10 Porter's Five Forces and Industry Attractiveness
- 17.11 Competitive Outlook, 2025-2035
Chapter 18 Company Profiles
- 18.1 Company Coverage and Selection Criteria
- 18.2 TOTO
- 18.2.1 Business Description
- 18.2.2 Company Ownership and Geographic Presence
- 18.2.3 Product and Service Portfolio
- 18.2.4 Manufacturing and Operating Footprint
- 18.2.5 Production Capacity and Expansion Plans
- 18.2.6 Financial Performance and Investment
- 18.2.7 Market Share and Competitive Position
- 18.2.8 Technology and Innovation Capabilities
- 18.2.9 Strategic Alliances or Partnerships
- 18.2.10 Recent Developments
- 18.2.11 Growth Strategy and Outlook
- 18.3 LIXIL (American Standard, GROHE)
- 18.4 Cera Sanitaryware
- 18.5 Roca Bathroom Products (Parryware)
- 18.6 Hindware
- 18.7 Other Relevant Market Participants
Note: Every listed company is profiled on the structure shown under the first company. The company list is preliminary and may change based on research findings, market developments, data availability and client requirements.
Chapter 19 Disclaimer
- 19.1 Research and Forecast Disclaimer
- 19.2 Data Source and Estimation Limitations
Note: The depth of individual sections depends on data availability for this market. Volume, capacity, trade and other unit-based metrics are included where applicable.

