
A deep housing gap keeps landed homes in demand
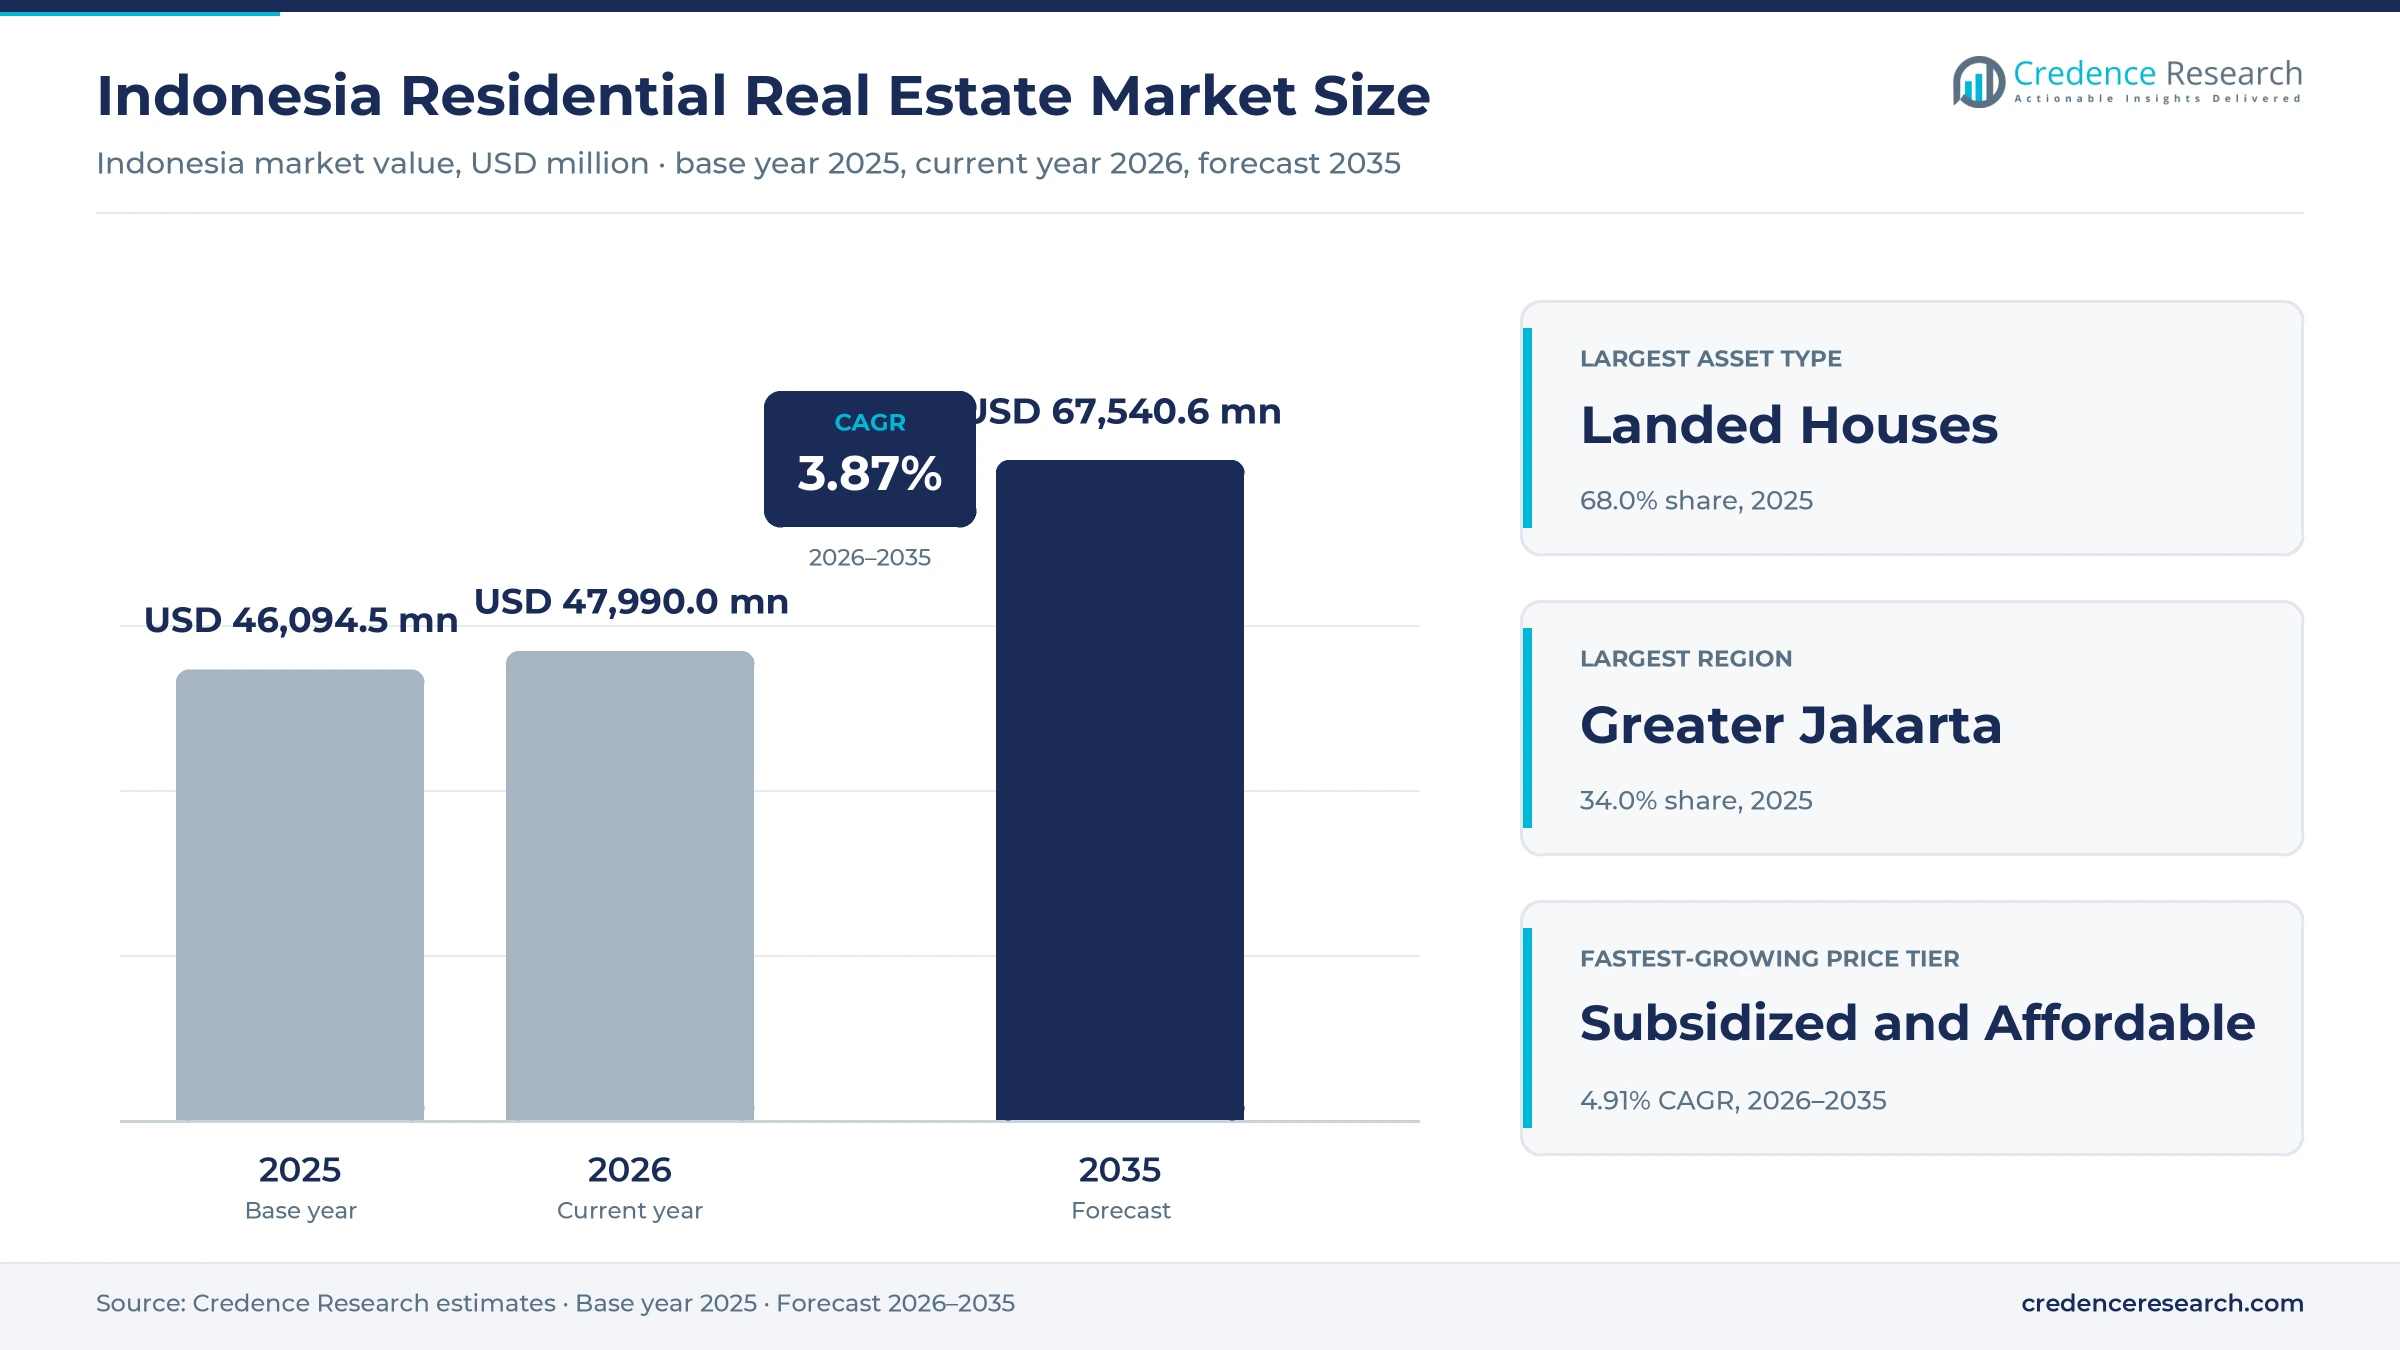
The Indonesia residential real estate market was valued at USD 46.09 billion in 2025 and is projected to increase from USD 47.99 billion in 2026 to USD 67.54 billion by 2035, registering a CAGR of 3.87% during 2026–2035. Demand comes from a population of about 285.7 million, a large shortage of homes and buyers who rely on bank mortgages and state subsidies. Greater Jakarta held the largest regional share, 34.0% in 2025, because the capital area hosts the largest townships, the highest incomes and most new apartment supply. Kalimantan grows fastest at 4.51% a year, as regional cities and the new capital area draw workers and builders. The most important policy change is the extension of full value-added tax relief on the first portion of new home prices through 2027, which keeps developers pricing new clusters for middle-income families.
Which homes and transactions does the estimate count?
The estimate measures the value of residential property transactions and rental income in Indonesia across landed houses, apartments and condominiums, villas and purpose-built rental housing. It covers primary new-build sales, secondary resales, long-term rentals and short-stay serviced leases, whether bought by first-time owners, upgrading families, domestic investors or foreign buyers. Values are stated in USD million at current prices, converted from rupiah at average annual exchange rates.
The estimate excludes office, retail, hotel and industrial property, as well as land sold without homes and the cost of home renovation. It also excludes informal self-built houses that never pass through a developer, agent or registered lease. The value chain runs from landowners and township developers through banks and agents to buyers and tenants.
Indonesia Residential Real Estate Market Insights
- The Indonesia residential real estate market was valued at USD 46.09 billion in 2025 and is projected to reach USD 67.54 billion by 2035, registering a CAGR of 3.87% during 2026–2035.
- Greater Jakarta held 34.0% of 2025 value, because the capital area hosts large townships such as BSD City, the highest incomes and most new apartments.
- Landed houses led with 68.0% of 2025 value, because most Indonesian families prefer a house with land and a clear ownership title.
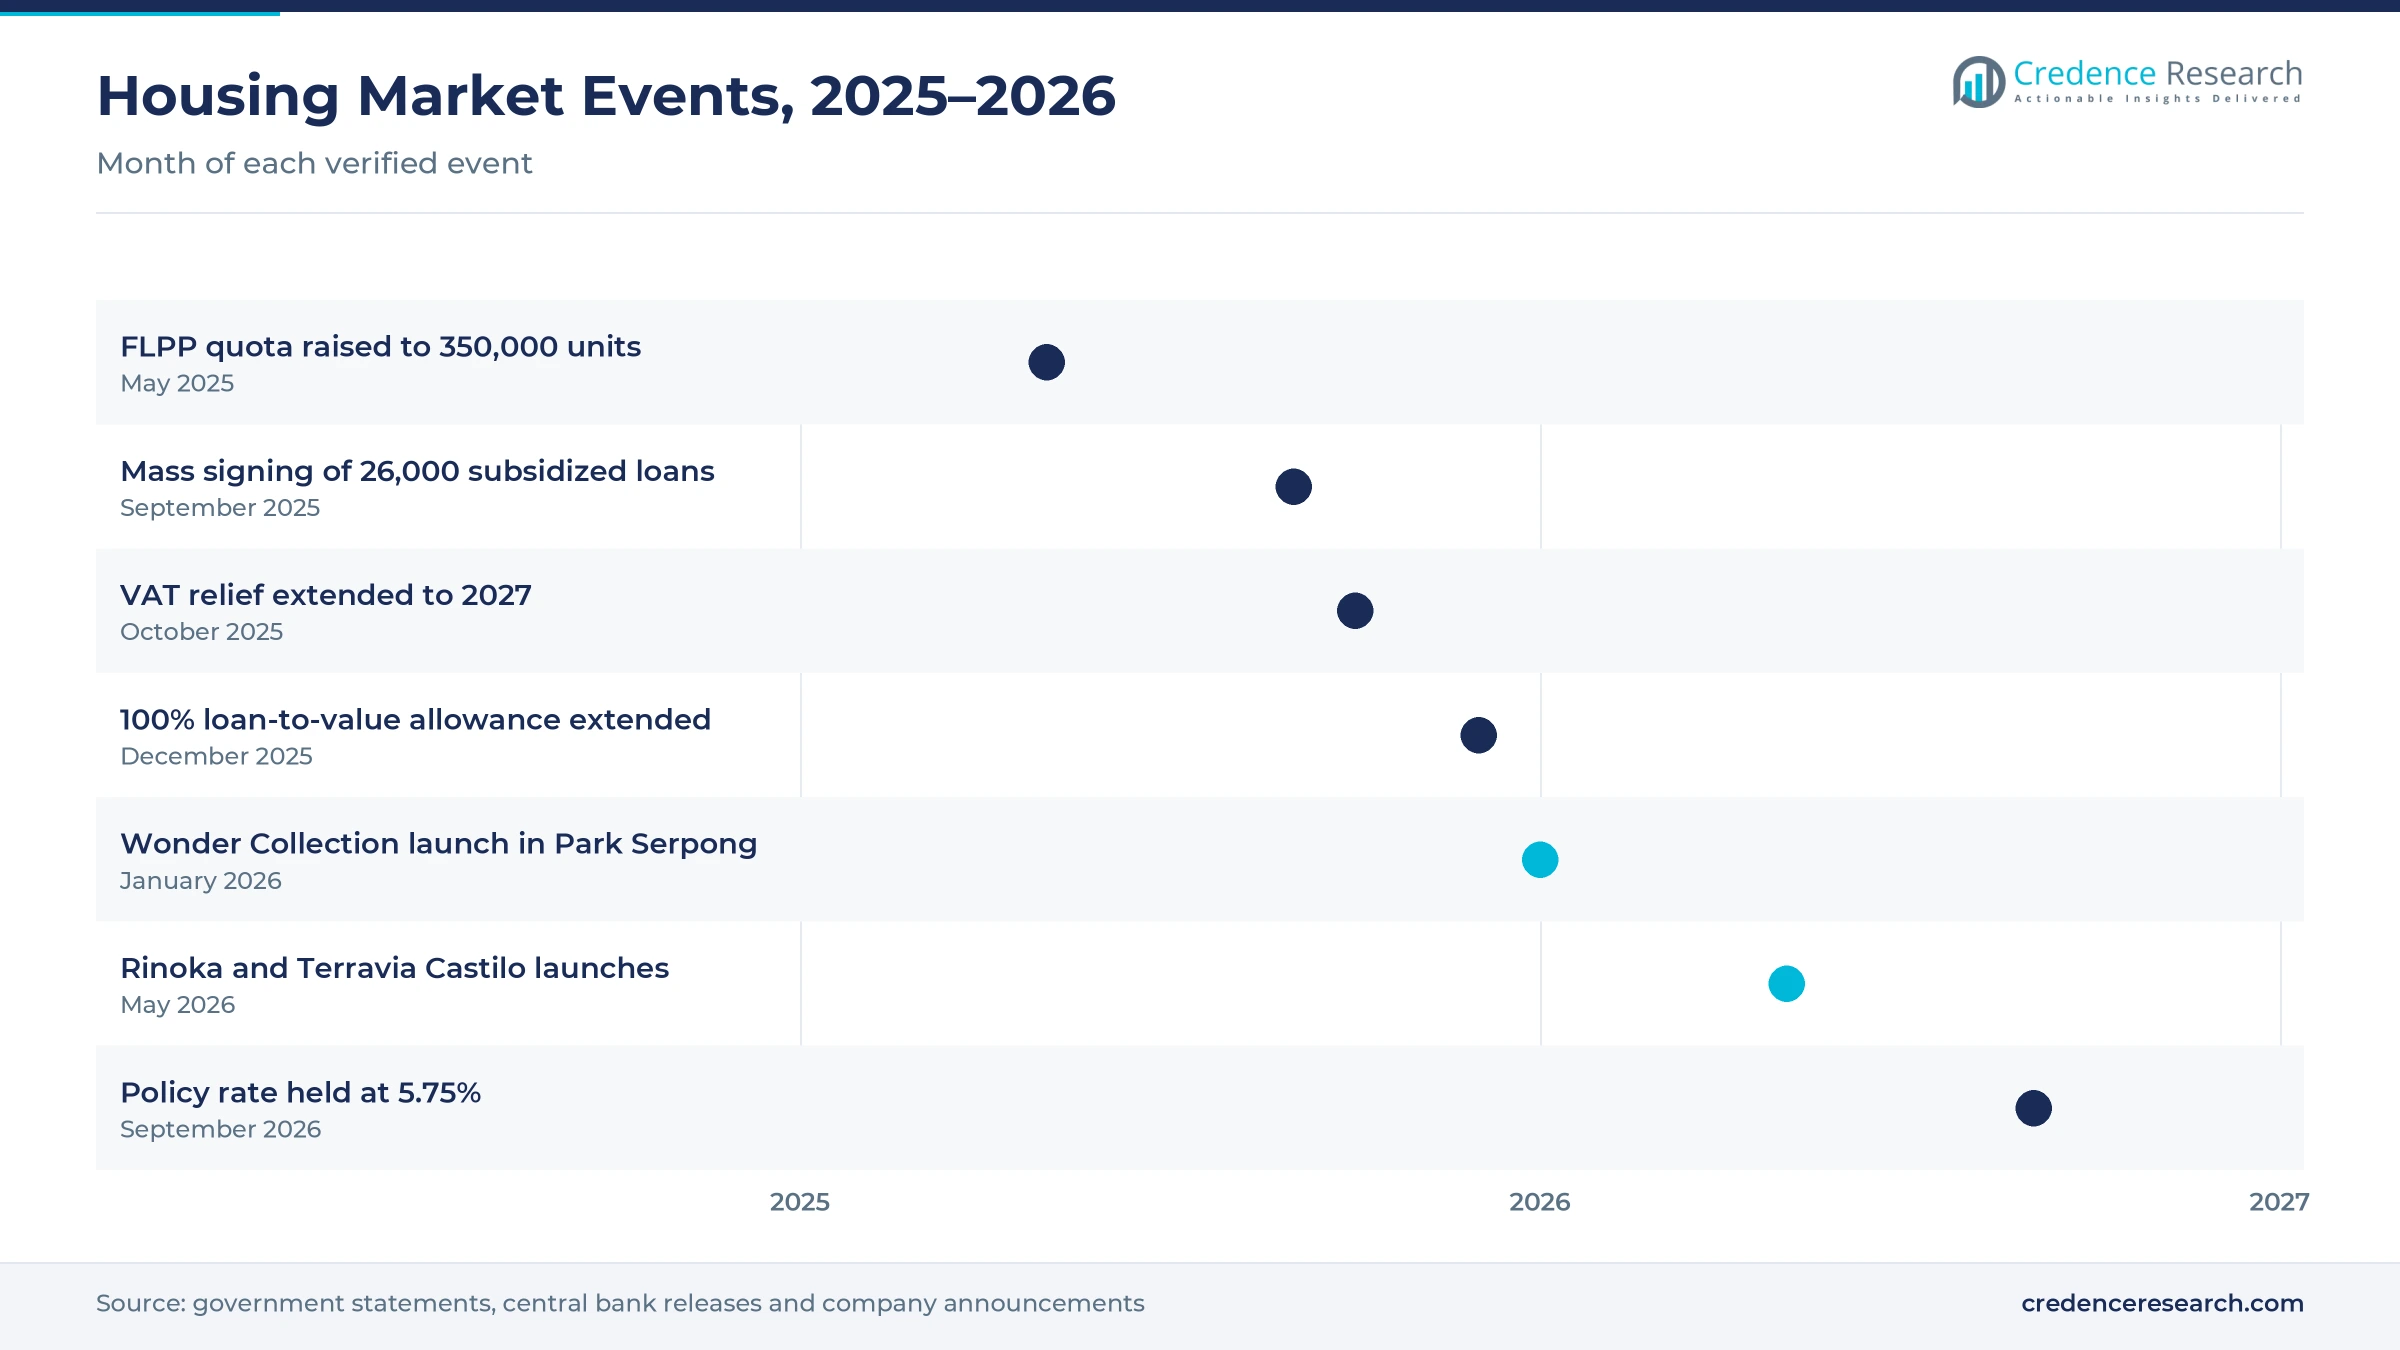
- The government raised the 2025 subsidized mortgage quota to 350,000 units on May 27, 2025, the largest quota in the national program so far.
- Subsidized and affordable homes grow fastest at 4.91% a year during 2026–2035, as state mortgage support widens access for low-income families.
Landed houses, first-time buyers and mid-priced homes lead
Why do landed houses lead the housing market?
Based on asset type, the market is categorized into landed houses, apartments and condominiums, villas and purpose-built rental housing. Landed Houses led with 68.0% of 2025 value, because most families want a house with land and room to expand. Purpose-Built Rental Housing grows fastest at 5.30% a year, as young workers in large cities rent managed units close to jobs and transit.
Which buyers account for most home purchases?
Based on buyer type, the market is categorized into first-time owner-occupiers, upgrading families, domestic investors and foreign and expatriate buyers. First-Time Owner-Occupiers led with 38.0% of 2025 value, because new households enter the market every year. First-Time Owner-Occupiers also grow fastest at 4.41% a year, as subsidized mortgages and tax relief lower the cost of a first home.
How does pricing split demand across income groups?
Based on price tier, the market is categorized into subsidized and affordable, lower-mid market, mid-market and premium and luxury homes. The Mid-Market tier led with 32.0% of 2025 value, because many township clusters are priced for salaried urban families. Subsidized and Affordable homes grow fastest at 4.91% a year, as state mortgage quotas rise. The 350,000-unit subsidized mortgage quota set for 2025 shows how strongly the state supports demand for affordable homes among low-income families.
How do new sales, resales and rentals compare?
Based on transaction type, the market is categorized into primary new-build sales, secondary resales, long-term rentals and short-stay and serviced leases. Primary New-Build Sales led with 52.0% of 2025 value, because developers launch new clusters in townships every year. Short-Stay and Serviced Leases grow fastest at 4.62% a year, as tourism and business travel lift demand for furnished units.
| Segment Group | Leading Sub-segment | Share, 2025 | Fastest-growing Sub-segment | CAGR, 2026–2035 |
|---|---|---|---|---|
| By Asset Type | Landed Houses | 68.0% | Purpose-Built Rental Housing | 5.30% |
| By Buyer Type | First-Time Owner-Occupiers | 38.0% | First-Time Owner-Occupiers | 4.41% |
| By Price Tier | Mid-Market | 32.0% | Subsidized and Affordable | 4.91% |
| By Transaction Type | Primary New-Build Sales | 52.0% | Short-Stay and Serviced Leases | 4.62% |
Request a Free Sample
Fill in your details and we'll send you a free sample report.
- Sample data tables & charts
- Research methodology
Housing gaps, loan subsidies and new roads lift demand
How does a large structural housing deficit sustain demand?
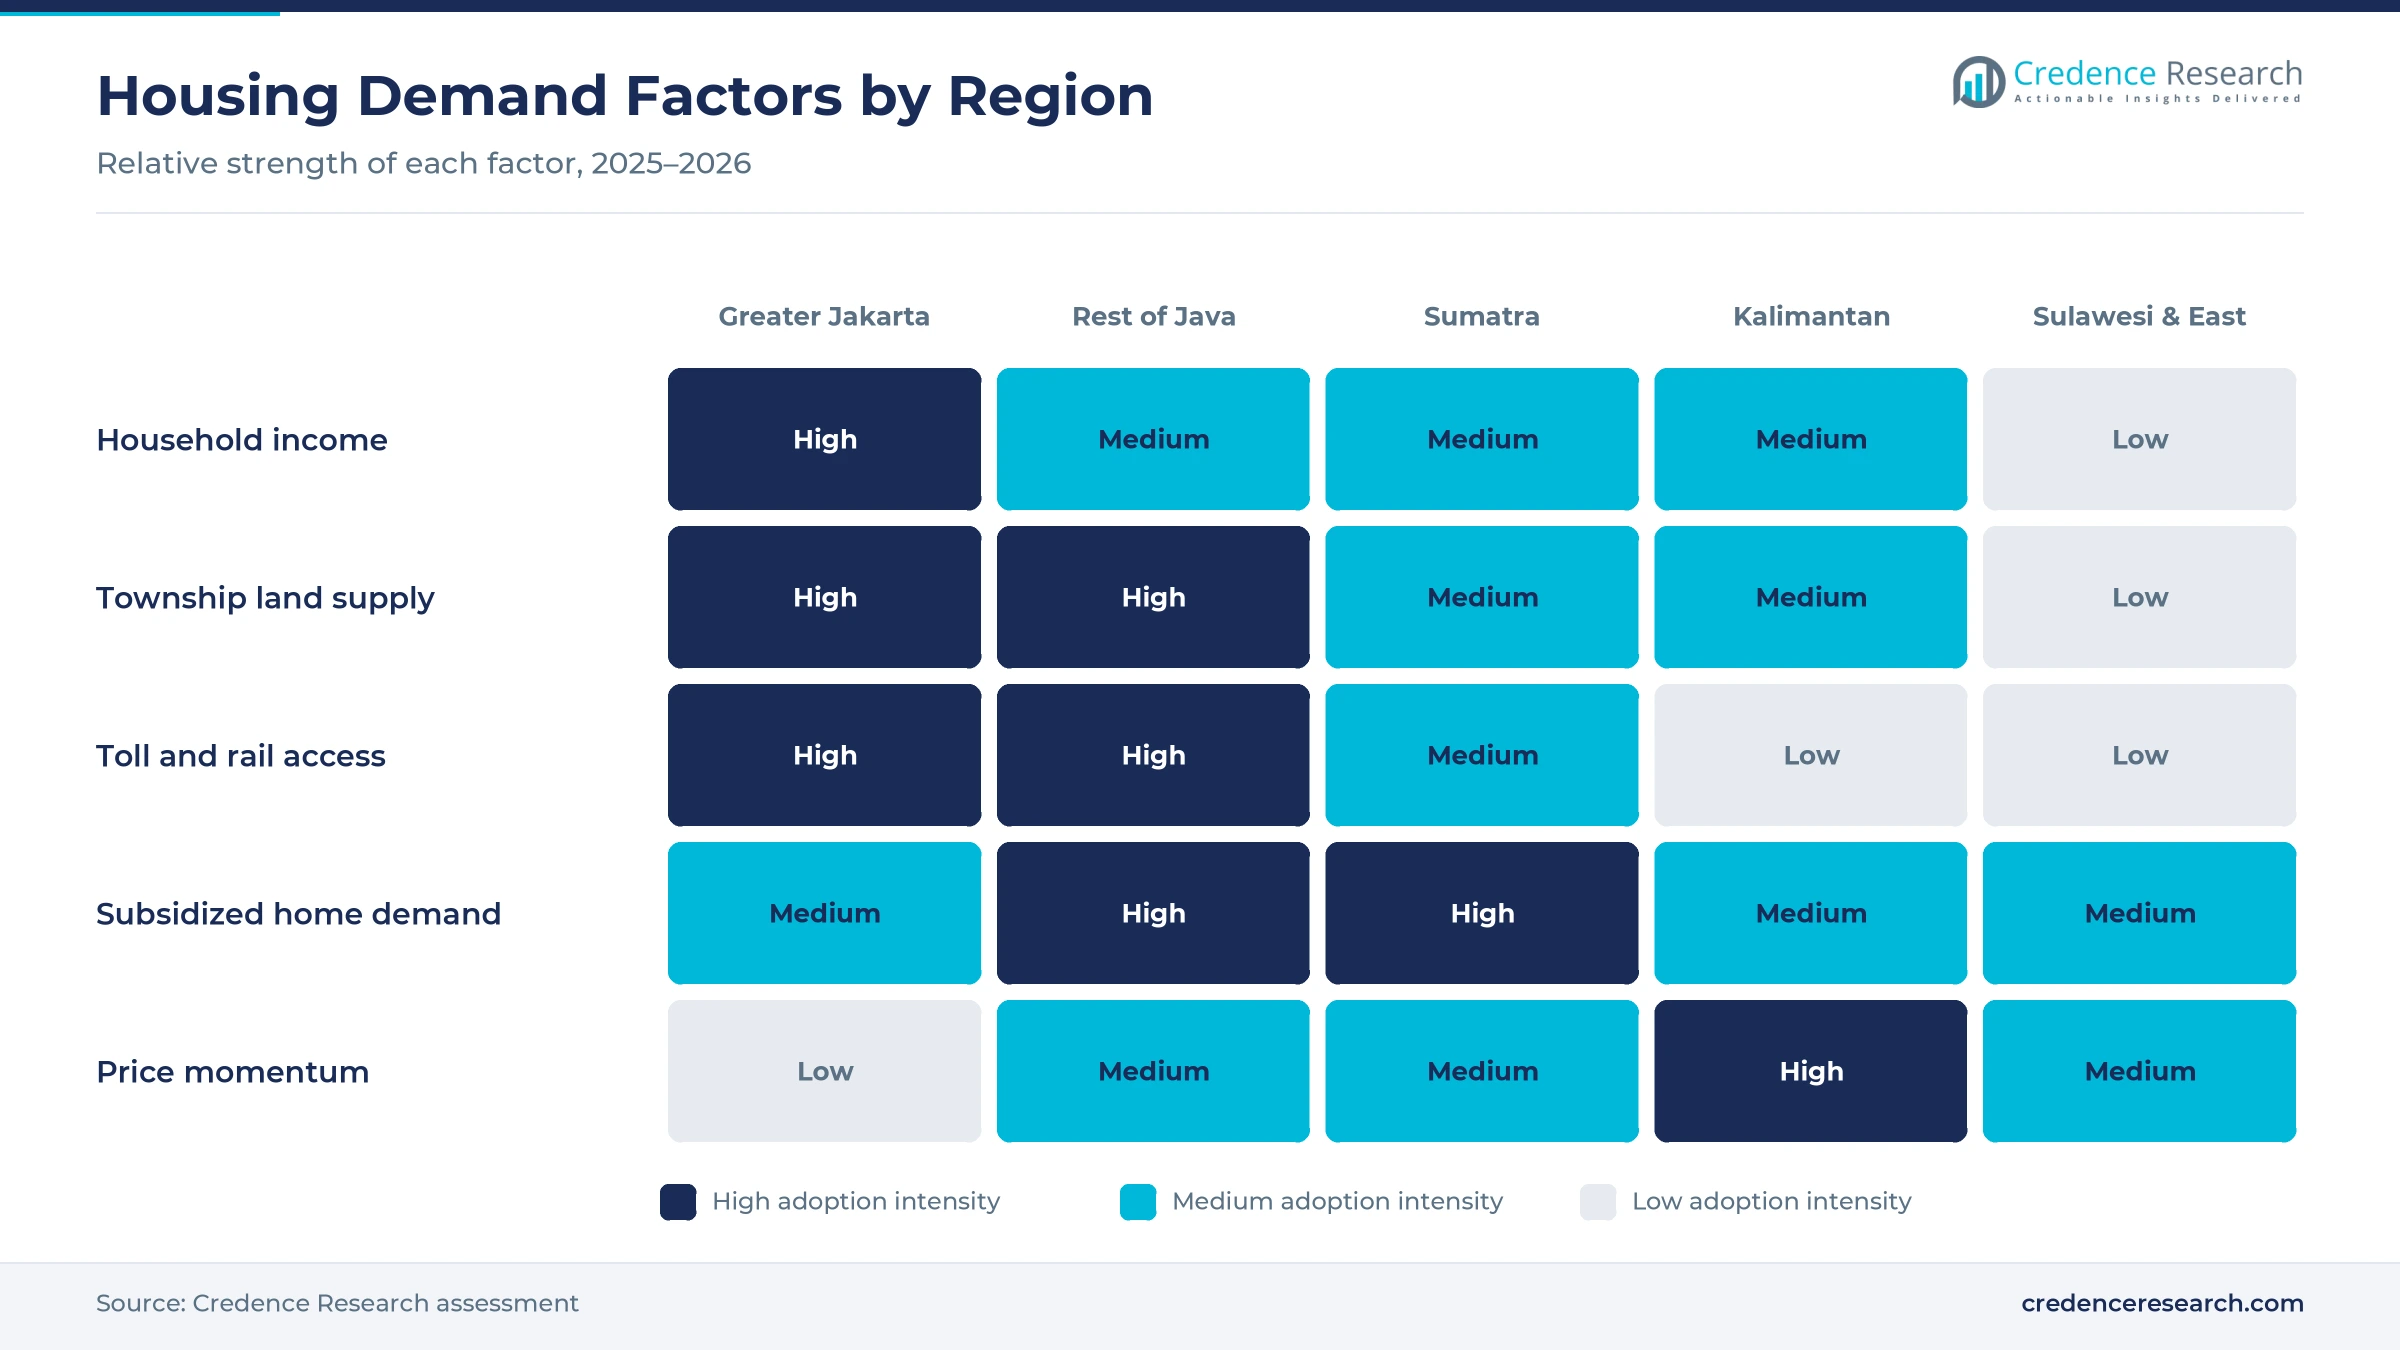
A large structural housing deficit sustains demand for new homes, because household formation in Indonesia runs ahead of new supply. Deputy Housing Minister Fahri Hamzah said in April 2025 that the ownership backlog had risen to about 15 million, up from 9.9 million, according to The Jakarta Post. He also counted about 26 million uninhabitable homes that need repair or replacement. The number of households reached 91.3 million, as average household size fell from five to three people. The population also reached about 285.7 million in 2025, which adds new families each year. As a result, first-time owner-occupiers grow fastest at 4.41% a year, which makes them the most dynamic buyer group in the housing market.
Why do mortgage and subsidy programs widen home buying?
Mortgage and subsidy programs widen home buying, because most Indonesian buyers depend on bank credit rather than cash. Housing loans financed 70.05% of primary home purchases in the second quarter of 2026, while cash installments covered 20.60%, according to the Bank Indonesia residential property survey. The government raised the 2025 subsidized mortgage quota to 350,000 units, backed by Rp 43 trillion, on May 27, 2025, according to Investortrust. President Prabowo Subianto then attended a mass signing of 26,000 subsidized home loans on Sept. 29, 2025, across 100 locations in 33 provinces. Bank Indonesia also extended its 100% loan-to-value allowance for property loans to the end of 2026. Consequently, subsidized and affordable homes grow fastest at 4.91% a year.
How do toll roads drive suburban township growth?
Toll roads drive suburban township growth, because shorter trips let families buy larger houses in outer districts and still reach city jobs. Indonesia opened 196 km of new toll roads in 2024, including 148.9 km on Sumatra, which lifted the operating network to 3,020.5 km. Sinar Mas Land builds around these links, and its BSD City township in Tangerang now covers about 5,950 hectares. Lippo Karawaci launched its Wonder Collection homes on Jan. 11, 2026, inside the 400-hectare Park Serpong township, priced from Rp 300 million to Rp 900 million. Pakuwon Jati runs the Pakuwon City and Grand Pakuwon landed townships on the eastern and western edges of Surabaya. In turn, Java outside Greater Jakarta holds 31.0% of 2025 value.
Why does urban migration lift demand in regional cities?
Urban migration lifts demand in regional cities, because jobs in mining, plantations and trade pull young workers into provincial centers outside Java. Indonesia's urban population reached 59.39% of the total in 2025, up from 58.12% in 2023, according to World Bank data. Bank Indonesia found that home prices in Pekanbaru rose 3.23% from a year earlier in the second quarter of 2026, among 18 surveyed cities. Banjarmasin and Balikpapan, both in Kalimantan, followed with gains of 1.29% and 1.19% in the same quarter. National home prices rose only 0.69% over that period, which shows that price momentum is stronger in several regional cities. As a result, Kalimantan becomes the fastest-growing housing zone in the country through 2035.
Transit apartments and tax-led pricing reshape launches
Why is the shift toward transit-linked apartments gaining pace?
Buyers and renters are shifting toward transit-linked apartments, because rail lines let Greater Jakarta residents avoid heavy road traffic on daily trips. Apartments near the Jakarta MRT corridor reached 71.2% occupancy, against a 65.4% average for Greater Jakarta, according to figures presented on Dec. 17, 2025. Units in these transit-oriented projects had sold 97.2% of their supply in 2025, compared with 94.2% for all apartments in the area. About 11,300 new apartment units were expected to be completed in 2026, mostly in Tangerang, Bekasi and South Jakarta. MRT Phase 2A is expected to begin operating in 2029, which extends the corridor. Consequently, developers give transit-oriented developments a larger place in new launches.
How is tax relief shaping a rise in mid-priced launches?
Tax relief is shaping a rise in mid-priced launches, because developers set prices so that buyers pay no value-added tax on the first Rp 2 billion. Finance Minister Purbaya Yudhi Sadewa said on Oct. 14, 2025, that the 100% relief would run until Dec. 31, 2027, for homes priced up to Rp 5 billion, according to DDTCNews. Sinar Mas Land launched the Terravia Castilo cluster in BSD City on May 26, 2026, with 109 homes priced from Rp 1.9 billion. Summarecon and Sumitomo Forestry Indonesia launched the Rinoka cluster in Makassar on May 12, 2026, priced from Rp 1.9 billion to Rp 3.6 billion. As a result, the mid-market tier keeps 32.0% of 2025 value.
Is there an opening in purpose-built rental housing?
Purpose-built rental housing offers a clear opening, because many young urban workers cannot yet afford a deposit or a monthly mortgage payment. Bank Indonesia reported that primary home sales fell 25.67% from a year earlier in the first quarter of 2026. Sales contracted again by 2.36% in the second quarter, even though prices rose slightly. Property credit grew only 5% a year as of October 2025, down from 7.2% a year earlier, which shows tighter access to loans. These households still need homes near jobs, so many choose to rent instead of buying. Consequently, purpose-built rental housing grows fastest among asset types at 5.30% a year through 2035.
Can foreign and expatriate buyers become a larger opening?
Foreign and expatriate buyers present a second opening, because rules on foreign ownership are clearer than they were a few years ago. Government Regulation 18 of 2021 lets foreigners own landed houses on Hak Pakai land and apartments on right-to-build land, subject to location rules. The right of use can now run for up to 80 years in total after extensions, up from 70 years under earlier rules. Minimum purchase prices for foreign buyers vary by province, which steers demand toward premium homes. Ciputra Development has also announced plans for a housing estate, a hotel and a golf course in Nusantara, the new capital on Borneo. In turn, short-stay and serviced leases grow fastest among transaction types at 4.62% a year.
Higher rates, slow sales and title limits weigh on demand
How do higher interest rates slow home buying?
Higher interest rates slow home buying, because mortgage payments rise when the central bank tightens policy. Bank Indonesia raised its policy rate by 100 basis points from the start of 2026 and held it at 5.75% on Sept. 23, 2026, to support the rupiah. As a result, upgrading families and investors delay purchases or choose smaller homes. Developers respond with fixed-rate promotions for the first years, while subsidized loans keep payments stable for low-income buyers.
Why does weak sales momentum delay launches?
Weak sales momentum delays launches, because developers wait for buyers to return before they release new clusters. Primary home sales contracted in both the first and second quarters of 2026, according to Bank Indonesia surveys. Sinar Mas Land has said it follows a selective product launch strategy based on market demand. Consequently, contractors and building material suppliers face uneven and delayed orders. Phased launches and smaller first releases help developers match new supply to buyer demand.
How do land and building costs squeeze affordable homes?
Land and building costs squeeze affordable homes, because subsidized house prices are capped while land near cities keeps getting more expensive. Developers also pay for cement, steel, roads and drainage before buyers make full payment. As a result, affordable projects move to distant sites with weak transport links. The government has eased the burden by waiving land transfer duties and building approval charges for low-income buyers, which helps keep projects viable.
Why do ownership title limits restrict some demand?
Ownership title limits restrict some demand, because foreigners cannot hold freehold Hak Milik titles and face location rules for apartments. Right-to-build titles run for 30 years and can be extended for another 20 years before renewal. As a result, some foreign and investor buyers worry about long-term tenure and resale value. Clear renewal procedures, strata title registration and legal advice help buyers understand their rights before they commit.
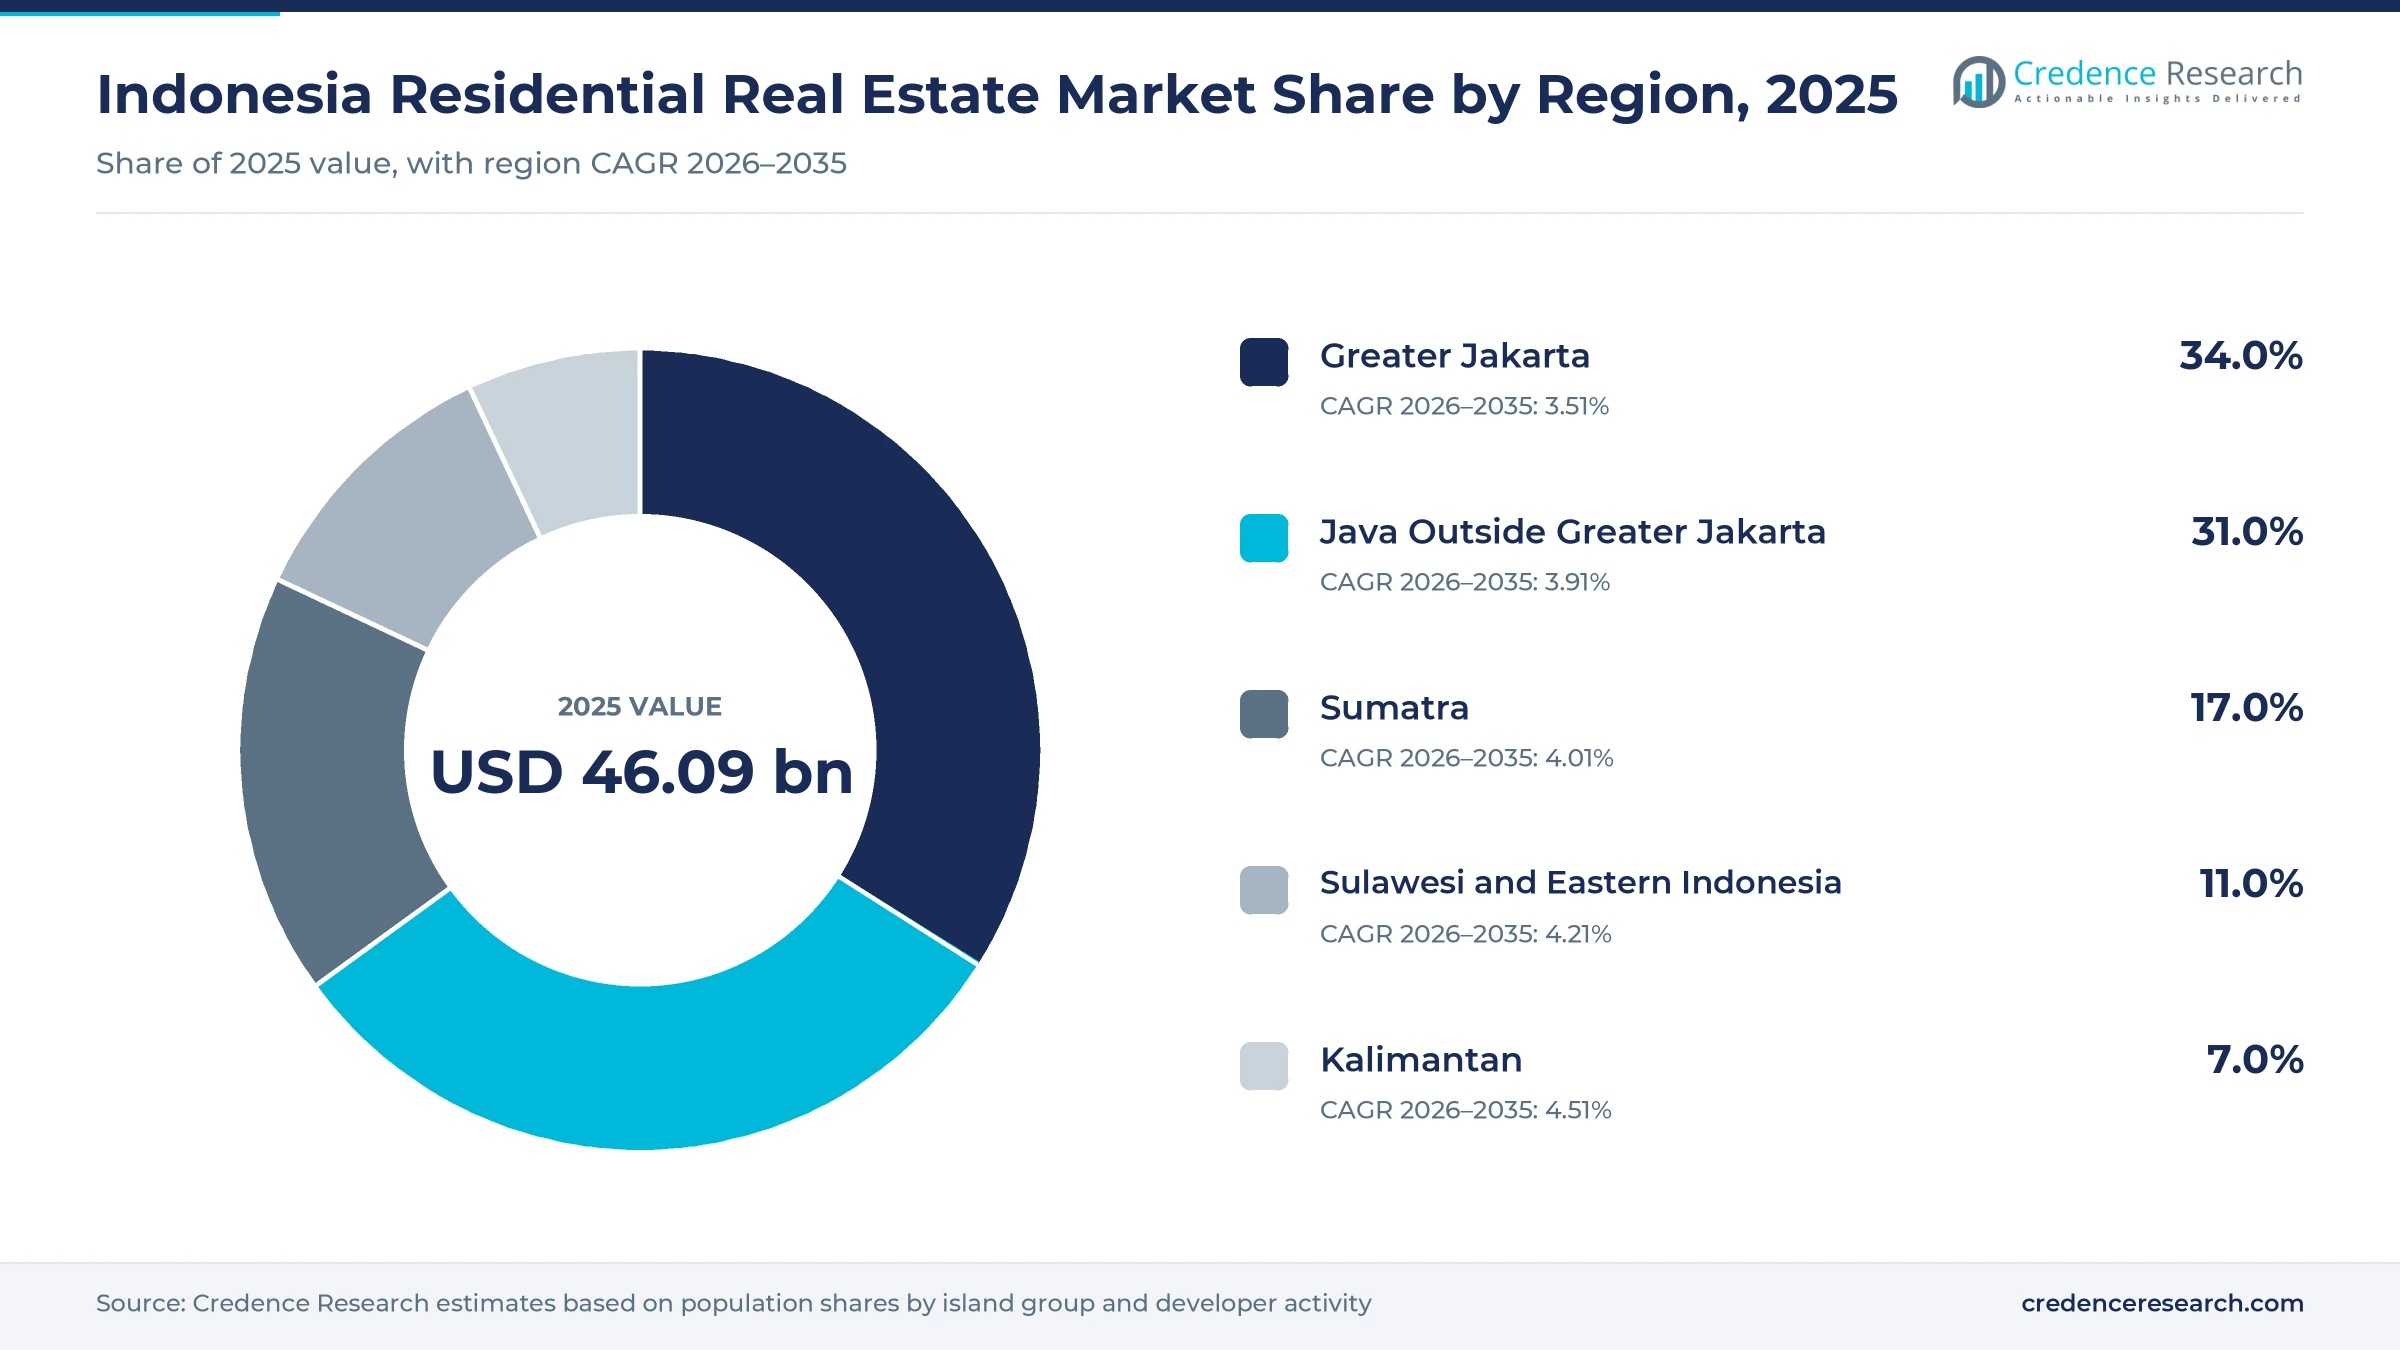
Greater Jakarta leads while Kalimantan grows fastest
| Region | Value, 2025 (USD billion) | Share, 2025 | CAGR, 2026–2035 |
|---|---|---|---|
| Greater Jakarta | 15.67 | 34.0% | 3.51% |
| Java Outside Greater Jakarta | 14.29 | 31.0% | 3.91% |
| Sumatra | 7.84 | 17.0% | 4.01% |
| Sulawesi and Eastern Indonesia | 5.07 | 11.0% | 4.21% |
| Kalimantan | 3.23 | 7.0% | 4.51% |
Why does Greater Jakarta lead housing value?
Greater Jakarta held 34.0% of 2025 value and grows at 3.51% a year, because the capital area has the highest incomes and the largest townships. BSD City, Park Serpong and other Tangerang projects sell landed homes to upgrading families, while new apartments rise along the MRT corridor. The area also hosts the head offices of most national developers and mortgage banks. However, high land prices push new affordable projects toward the outer districts of Bogor, Bekasi and Tangerang.
How does the rest of Java add volume?
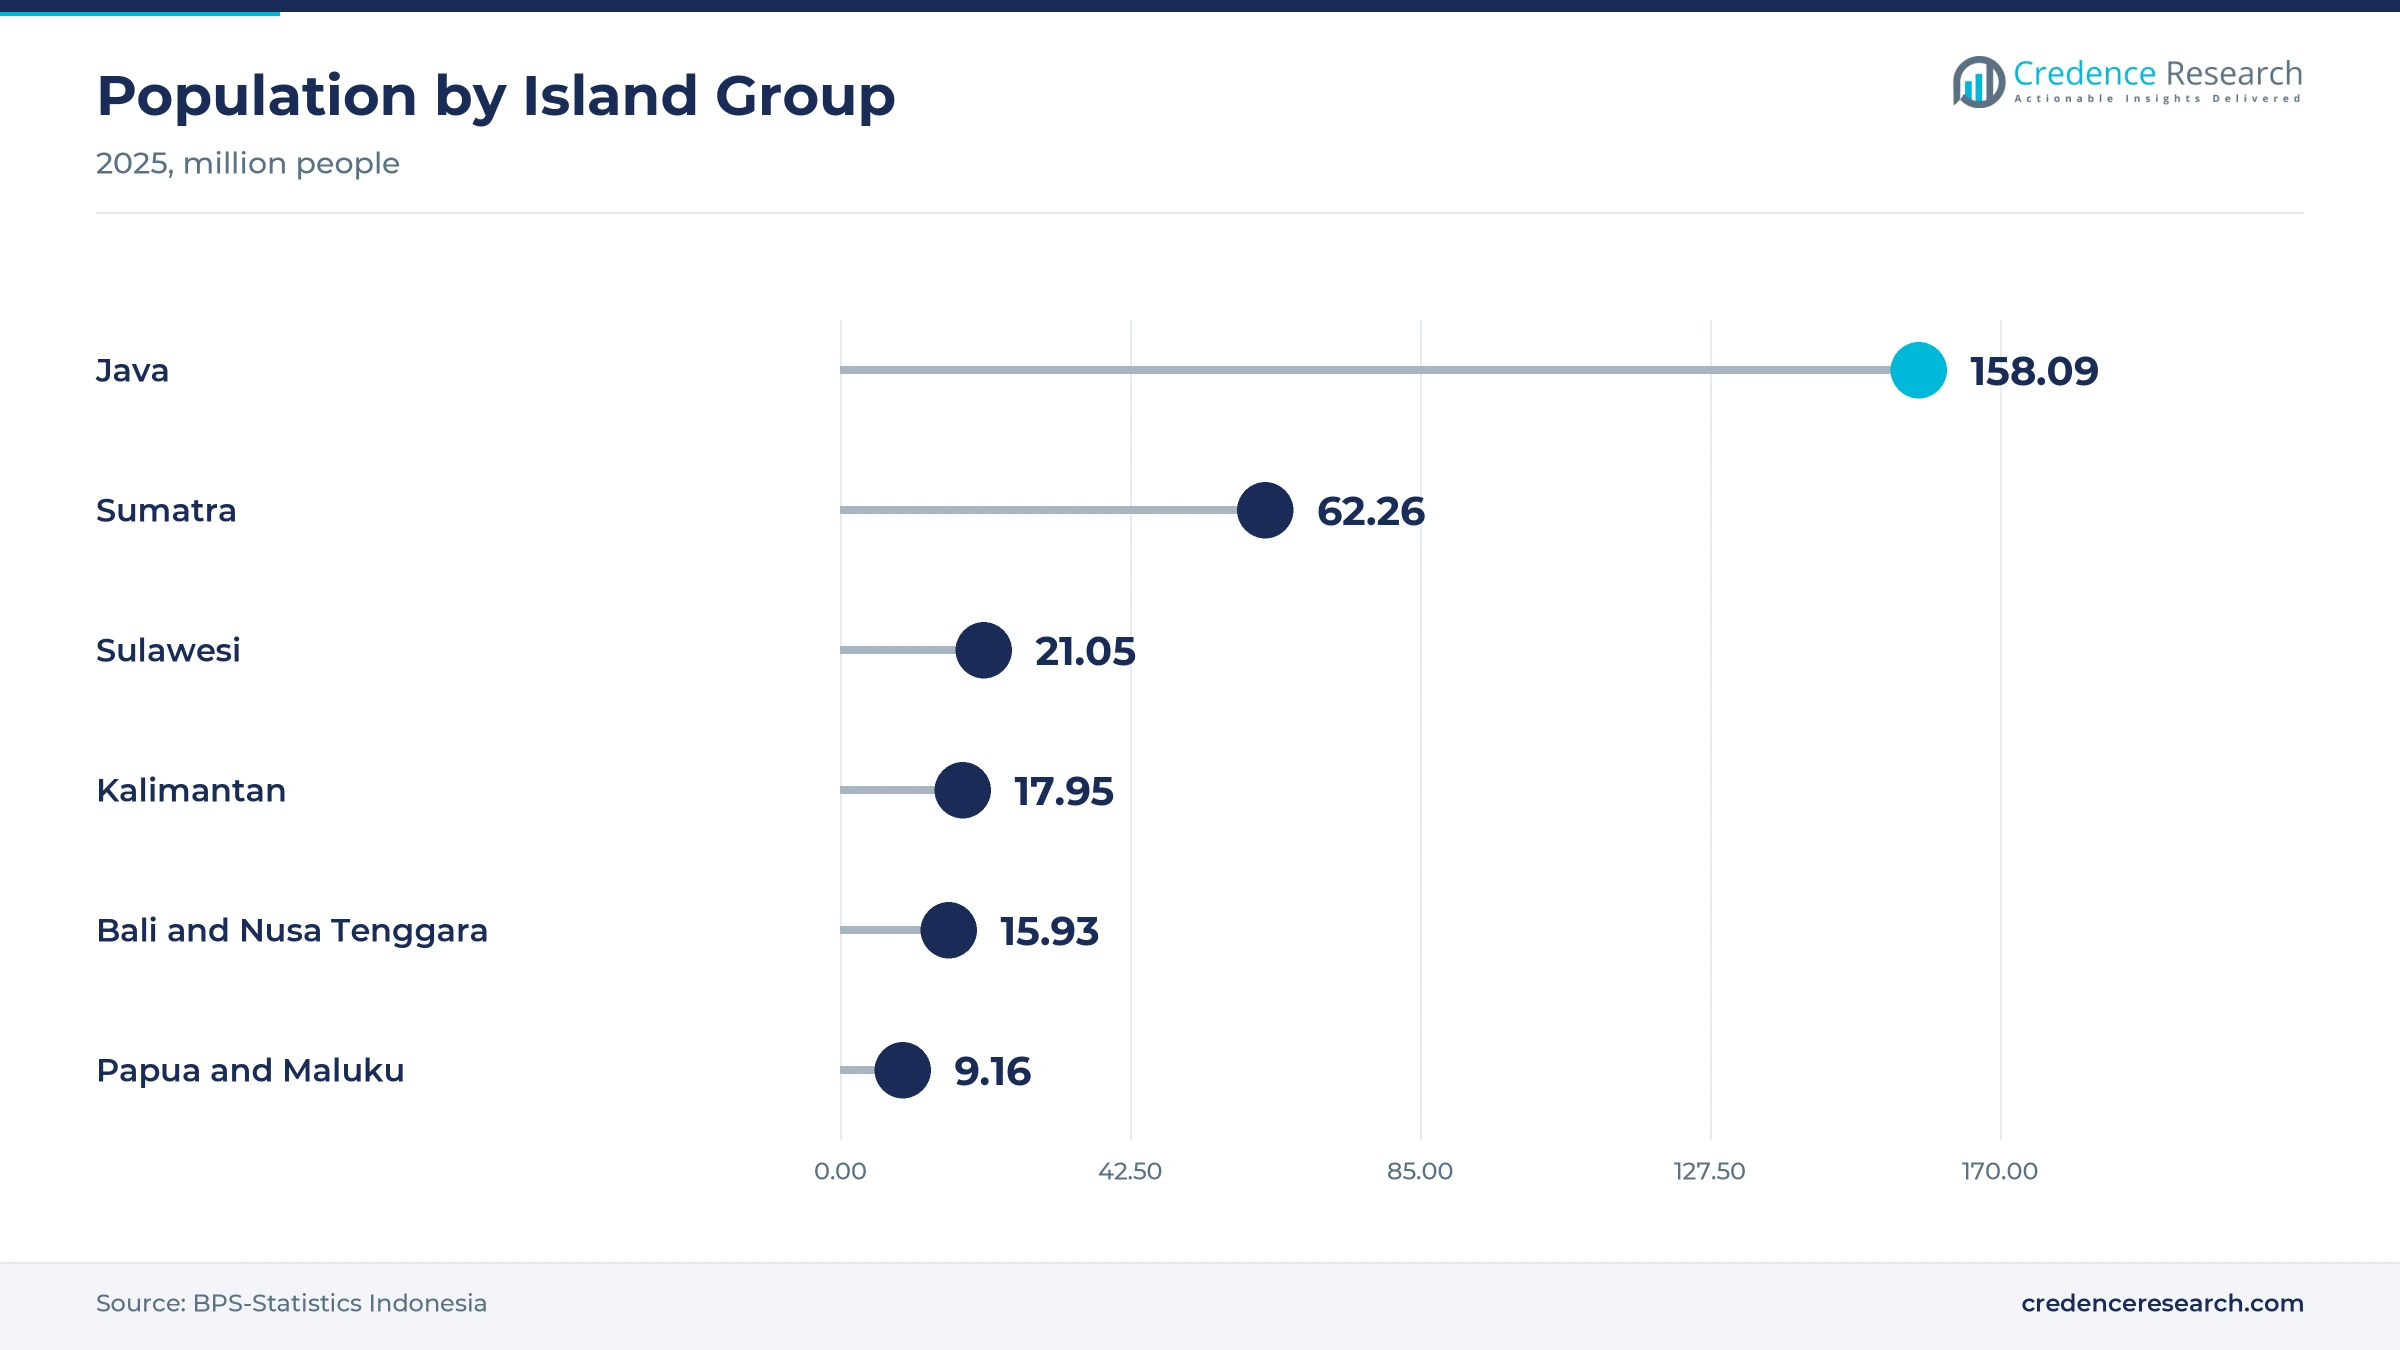
Java outside Greater Jakarta held 31.0% of 2025 value and grows at 3.91% a year, because the island was home to about 158.09 million people in 2025. Surabaya, Bandung, Semarang and Yogyakarta have large salaried workforces and growing universities. Pakuwon Jati builds landed townships and apartments in Surabaya, while new toll links widen commuting belts. Factories along these corridors also support building construction for worker housing.
What shapes housing demand in Sumatra?
Sumatra held 17.0% of 2025 value and grows at 4.01% a year, because the island had about 62.26 million residents in 2025 and large plantation and trade economies. Medan, Palembang and Pekanbaru support steady demand for landed homes. Pekanbaru posted a 3.23% annual home price gain in the second quarter of 2026, according to Bank Indonesia. New toll sections across Sumatra also open land for townships near the main cities.
Why does Kalimantan grow fastest?
Kalimantan held 7.0% of 2025 value and grows fastest at 4.51% a year, because mining, energy and the new capital area draw workers. Balikpapan and Banjarmasin both recorded home price gains above the national average in the second quarter of 2026. Sinar Mas Land markets its El Como cluster in Grand City Balikpapan. Ciputra Development also plans a housing estate in Nusantara, which adds future supply.
How do Sulawesi and eastern Indonesia add demand?
Sulawesi and Eastern Indonesia held 11.0% of 2025 value and grow at 4.21% a year, because Makassar, Manado and Bali have growing middle classes. Sulawesi alone had about 21.05 million residents in 2025, according to BPS. Summarecon builds premium homes in Summarecon Mutiara Makassar, while Bali draws villa buyers and short-stay investors. Smaller towns in Maluku and Papua rely mostly on subsidized housing.
Subsidy, tax and township moves since 2025
| Development | Status and market relevance |
|---|---|
| In May 2025, the government raised the subsidized mortgage quota for 2025 to 350,000 units, backed by Rp 43 trillion. | Widens loan access for low-income families |
| In October 2025, the finance minister said full VAT relief on the first Rp 2 billion of new home prices would run until Dec. 31, 2027. | Supports mid-priced launches |
| In December 2025, Bank Indonesia extended its 100% loan-to-value allowance for property loans to the end of 2026. | Keeps low-deposit mortgages available |
| In January 2026, Lippo Karawaci launched Wonder Collection homes in Park Serpong, priced from Rp 300 million. | Adds affordable supply in Tangerang |
| In May 2026, Summarecon and Sumitomo Forestry Indonesia launched the Rinoka cluster in Makassar. | Expands premium supply outside Java |
Digital lending and faster building methods change delivery
- Digital mortgage platforms run by banks and BP Tapera let buyers apply for subsidized loans online, which shortens approval times.
- Factory-made components used in prefabricated construction cut site work on large clusters and help developers hand over homes faster.
- Connected home features such as smart home devices and app-based access now appear in mid-market and premium clusters.
- Online property portals let buyers compare launches, prices and payment plans across townships before visiting a site.
Need a Custom Version of This Report?
Tailor the scope, geography, or segments to your exact requirements.
- Custom geography or segment scope
- Direct access to our analyst team
Listed township developers compete on land and access
Competition is led by listed township developers that hold large land banks near main cities. PT Bumi Serpong Damai Tbk, through Sinar Mas Land, runs BSD City and clusters in Bekasi, Cibubur and Balikpapan. PT Lippo Karawaci Tbk sells affordable homes in Park Serpong, while PT Summarecon Agung Tbk builds townships in Serpong, Bekasi, Karawang and Makassar. PT Pakuwon Jati Tbk focuses on Surabaya townships and Jakarta superblocks. PT Ciputra Development Tbk has projects across many provinces and plans housing in Nusantara. Companies compete on land location, toll and rail access, price per square meter, payment terms and brand trust. Smaller regional developers win subsidized housing projects, because they can build low-cost homes on cheaper land outside big cities. Partnerships with Japanese firms add capital and design skills to premium launches.
Companies profiled and their roles in this market
| Company | Type | Role in the market |
|---|---|---|
| PT Bumi Serpong Damai Tbk | Township developer | Runs the 5,950-hectare BSD City; launched Terravia Castilo in May 2026 |
| PT Summarecon Agung Tbk | Township developer | Launched Rinoka in Makassar with Sumitomo Forestry Indonesia in May 2026 |
| PT Lippo Karawaci Tbk | Township developer | Launched Wonder Collection homes in Park Serpong in January 2026 |
| PT Pakuwon Jati Tbk | Township and superblock developer | Runs Pakuwon City and Grand Pakuwon townships in Surabaya |
| PT Ciputra Development Tbk | Township developer | Plans a housing estate, hotel and golf course in Nusantara |
Credence Research view on steady housing growth
Credence Research's view is that Indonesian housing will grow steadily through 2035, because a deep shortage of homes and state mortgage support keep first-time buyers in the market. Landed houses already hold 68.0% of 2025 value, and subsidized homes grow fastest. Tax relief through 2027 should keep developers pricing for middle-income families. However, higher interest rates and weak sales in 2026 could delay some launches. Greater Jakarta keeps the largest share, while Kalimantan and regional cities grow faster as jobs and roads spread.
How the housing market estimate was built
The report uses 2025 as the base year, with values in USD million at current prices. Market values come from the Credence Research model, which combines housing transactions, rental income and price trends. Regional shares are Credence Research estimates based on population shares by island group and developer activity, and segment splits by asset type, buyer, price tier and transaction are also Credence Research estimates. Sources used are central bank surveys, government statements, World Bank data, company announcements and news reports, and no interviews or surveys were used.
Affordable homes and outer-island cities set the path
The market is expected to reach USD 67.54 billion by 2035, a 3.87% CAGR during 2026–2035, as household growth, mortgage subsidies and new roads lift housing demand. Growth should be strongest in subsidized homes, purpose-built rentals and in Kalimantan, while Greater Jakarta keeps the largest share. Developers with land near toll and rail links should win the most buyers. In contrast, a longer period of high interest rates or cuts to subsidy quotas would slow sales for many builders.
Frequently Asked Questions
How big is the Indonesia residential real estate market?
Which region leads housing value in Indonesia?
Which region grows fastest?
Which asset type holds the largest share?
Which price tier grows fastest?
How do most Indonesians pay for new homes?
Who are the leading residential developers in Indonesia?
What are the main risks to growth?
Table of Content
Chapter 1 Market Segmentation
- 1.1 Segmentation Framework
- 1.1.1 Product and Service Classification
- 1.1.2 Application and End-Use Classification
- 1.1.3 Technology and Solution Classification
- 1.1.4 Customer and Distribution Channel Classification
- 1.1.5 Geographic Segmentation
- 1.1.6 Market Segment Definitions and Boundaries
- 1.2 By Asset Type
- 1.2.1 Landed Houses
- 1.2.2 Apartments and Condominiums
- 1.2.3 Villas
- 1.2.4 Purpose-Built Rental Housing
- 1.3 By Buyer Type
- 1.3.1 First-Time Owner-Occupiers
- 1.3.2 Upgrading Families
- 1.3.3 Domestic Investors
- 1.3.4 Foreign and Expatriate Buyers
- 1.4 By Price Tier
- 1.4.1 Subsidized and Affordable
- 1.4.2 Lower-Mid Market
- 1.4.3 Mid-Market
- 1.4.4 Premium and Luxury
- 1.5 By Transaction Type
- 1.5.1 Primary New-Build Sales
- 1.5.2 Secondary Resales
- 1.5.3 Long-Term Rentals
- 1.5.4 Short-Stay and Serviced Leases
Chapter 2 Introduction
- 2.1 Report Objectives and Scope
- 2.2 Product Definition and Industry Terminology
- 2.3 Market Inclusions and Exclusions
- 2.4 Research Process
- 2.4.1 Primary Research and Expert Interviews
- 2.4.2 Secondary Research and Source Review
- 2.4.3 Top-Down and Bottom-Up Estimation
- 2.4.4 Data Triangulation and Verification
- 2.5 Market Size Measurement Basis
- 2.5.1 2025: USD 46.09 billion → 2035: USD 67.54 billion
- 2.6 Historical and Forecast Reference Periods
- 2.6.1 Historical Period: 2018-2025
- 2.6.2 Base Year: 2025
- 2.6.3 Forecast Period: 2025-2035
- 2.7 Research Assumptions and Limitations
Chapter 3 Executive Summary
- 3.1 Market Snapshot and Key Findings
- 3.2 Base-Year Market Size, 2025
- 3.3 Forecast Market Size, 2035
- 3.4 Revenue and Volume Growth Outlook
- 3.5 Key Demand and Supply Indicators
- 3.6 Leading Market Segments
- 3.7 Fastest-Growing Market Opportunities
- 3.8 Regional Performance Highlights
- 3.9 Technology and Industry Transformation
- 3.10 Competitive Landscape Summary
- 3.11 Analyst View and Strategic Implications
Chapter 4 Indonesia Residential Real Estate Market Trends and Developments
- 4.1 Historical Industry Development, 2018-2025
- 4.2 Recent Market Trends and Developments
- 4.3 Demand and Customer Behavior Trends
- 4.4 Technology and Product Innovation
- 4.5 Artificial Intelligence, Automation and Digitalization
- 4.6 Local Manufacturing and Supply Chain Realignment
- 4.7 Industry Partnerships, Mergers and Acquisitions
- 4.8 Sustainability and Circular Economy Developments
- 4.9 Government and Private Sector Investment Trends
- 4.10 Emerging Business Models and Commercialization
- 4.11 Industry Developments and Announcements
Chapter 5 Indonesia Residential Real Estate Market Production, Supply and Demand Analysis
- 5.1 Demand Trend and Consumption Analysis, 2018-2025
- 5.2 Demand Forecast, 2025-2035
- 5.3 Production and Output Trend, 2018-2025
- 5.4 Production and Output Forecast, 2025-2035
- 5.5 Installed Capacity and Capacity Utilization
- 5.6 Company-Wise Production Plants and Statistics
- 5.6.1 Installed Production Capacity
- 5.6.2 Actual Production
- 5.6.3 Planned Capacity and Expansion Targets
- 5.7 Supply Chain Structure and Procurement Trends
- 5.8 Supply-Demand Gap and Bottlenecks
- 5.9 Import Dependence and Sourcing Structure
- 5.10 Contract Manufacturing and Outsourcing
- 5.11 Regional Supply and Demand Concentration
Chapter 6 Indonesia Residential Real Estate Market Pricing Analysis
- 6.1 Pricing Structure and Measurement
- 6.2 Historical Pricing Trends, 2018-2025
- 6.3 Pricing Outlook, 2025-2035
- 6.4 Average Selling Price and Unit Economics
- 6.5 Pricing by Product and Market Segment
- 6.6 Geographic Pricing Differences
- 6.7 Key Input, Energy, Labor and Logistics Costs
- 6.8 Contract Pricing and Purchasing Models
- 6.9 Pricing Sensitivity and Competitive Positioning
- 6.10 Price, Margin and Profitability Implications
Chapter 7 Indonesia Residential Real Estate Market Dynamics
- 7.1 Market Growth Drivers
- 7.1.1 Demand-Side Drivers
- 7.1.2 Technology and Innovation Drivers
- 7.1.3 Infrastructure and Investment Drivers
- 7.1.4 Regulatory and Policy Drivers
- 7.2 Market Restraints
- 7.2.1 Cost and Affordability Constraints
- 7.2.2 Technology and Adoption Barriers
- 7.2.3 Supply Chain and Operational Constraints
- 7.3 Market Challenges
- 7.3.1 Competitive Pressure and Margin Erosion
- 7.3.2 Skills, Infrastructure and Implementation Gaps
- 7.4 Emerging Market Opportunities
- 7.5 Market Dynamics Impact and Time-Horizon Assessment
Chapter 8 Indonesia Residential Real Estate Value Chain Analysis
- 8.1 Industry Value Chain Overview
- 8.2 Upstream Suppliers and Critical Inputs
- 8.3 Technology and Component Providers
- 8.4 Manufacturing or Service Delivery
- 8.5 Distribution, Channel Partners and Integrators
- 8.6 Downstream Applications and End Users
- 8.7 Value Addition and Profit Pools
- 8.8 Vertical Integration and Outsourcing
- 8.9 Supplier Concentration and Risk
- 8.10 Supply Chain Localization and Resilience
Chapter 9 Indonesia Residential Real Estate Market Regulations and Policies
- 9.1 Relevant Laws, Standards and Compliance Frameworks
- 9.2 Product, Service, Safety and Quality Requirements
- 9.3 Government Policies, Incentives and Subsidies
- 9.4 Imports, Exports and Trade Barriers
- 9.5 Public Procurement and Local Content Requirements
- 9.6 Environmental and Sustainability Compliance
- 9.7 Upcoming Policy Changes and Market Implications
Chapter 10 Indonesia Residential Real Estate Market Hotspots and Opportunities
- 10.1 Market Opportunity Mapping and Growth Hotspots
- 10.2 High-Growth Applications and Customer Groups
- 10.3 Underserved Markets and White-Space Opportunities
- 10.4 Emerging Technology and Product Opportunities
- 10.5 New Capacity and Investment Hotspots
- 10.6 Market Entry and Expansion Opportunities
- 10.7 Distribution and Partnership Opportunities
- 10.8 Near-Term and Long-Term Commercial Potential
- 10.9 Opportunity Attractiveness and Execution Risks
Chapter 11 Indonesia Residential Real Estate Market Outlook, 2025-2035
- 11.1 Market Size and Analysis
- 11.1.1 Revenue (Market Measurement: 2025: USD 46.09 billion → 2035: USD 67.54 billion)
- 11.1.2 Market Volume and Quantity Sold
- 11.1.3 Historical Market Size, 2018-2025
- 11.1.4 Base-Year Market Size, 2025
- 11.2 Market Forecast, 2025-2035
- 11.2.1 Revenue Forecast to 2035
- 11.2.2 Volume Forecast to 2035
- 11.2.3 CAGR and Year-on-Year Growth
- 11.2.4 Incremental Revenue Opportunity
- 11.3 Forecast Assumptions and Scenario Analysis
- 11.3.1 Base-Case Forecast
- 11.3.2 Optimistic and Conservative Scenarios
- 11.3.3 Technology, Pricing and Policy Sensitivities
- 11.4 Market Attractiveness and Growth Outlook
Chapter 12 Indonesia Residential Real Estate Market Segmentation and Outlook
- 12.1 Segmentation Summary and Market Shares, 2025
- 12.2 Largest and Fastest-Growing Segments
- 12.3 By Asset Type - Market Size and Forecast, 2025-2035
- 12.3.1 Segment Definition and Scope
- 12.3.2 Historical Market Size, 2018-2025
- 12.3.3 Revenue Forecast, 2025-2035
- 12.3.4 Volume Forecast, 2025-2035
- 12.3.5 Base-Year Market Share, 2025
- 12.3.6 Segment CAGR and Growth Drivers
- 12.3.7 Subsegment Market Size and Forecast
- 12.3.7.1 Landed Houses
- 12.3.7.2 Apartments and Condominiums
- 12.3.7.3 Villas
- 12.3.7.4 Purpose-Built Rental Housing
- 12.3.8 Subsegment Pricing and Adoption Trends
- 12.3.9 Leading Suppliers and Competition
- 12.3.10 Regional Demand and Opportunities
- 12.4 By Buyer Type - Market Size and Forecast, 2025-2035
- 12.4.1 Segment Definition and Scope
- 12.4.2 Historical Market Size, 2018-2025
- 12.4.3 Revenue Forecast, 2025-2035
- 12.4.4 Volume Forecast, 2025-2035
- 12.4.5 Base-Year Market Share, 2025
- 12.4.6 Segment CAGR and Growth Drivers
- 12.4.7 Subsegment Market Size and Forecast
- 12.4.7.1 First-Time Owner-Occupiers
- 12.4.7.2 Upgrading Families
- 12.4.7.3 Domestic Investors
- 12.4.7.4 Foreign and Expatriate Buyers
- 12.4.8 Subsegment Pricing and Adoption Trends
- 12.4.9 Leading Suppliers and Competition
- 12.4.10 Regional Demand and Opportunities
- 12.5 By Price Tier - Market Size and Forecast, 2025-2035
- 12.5.1 Segment Definition and Scope
- 12.5.2 Historical Market Size, 2018-2025
- 12.5.3 Revenue Forecast, 2025-2035
- 12.5.4 Volume Forecast, 2025-2035
- 12.5.5 Base-Year Market Share, 2025
- 12.5.6 Segment CAGR and Growth Drivers
- 12.5.7 Subsegment Market Size and Forecast
- 12.5.7.1 Subsidized and Affordable
- 12.5.7.2 Lower-Mid Market
- 12.5.7.3 Mid-Market
- 12.5.7.4 Premium and Luxury
- 12.5.8 Subsegment Pricing and Adoption Trends
- 12.5.9 Leading Suppliers and Competition
- 12.5.10 Regional Demand and Opportunities
- 12.6 By Transaction Type - Market Size and Forecast, 2025-2035
- 12.6.1 Segment Definition and Scope
- 12.6.2 Historical Market Size, 2018-2025
- 12.6.3 Revenue Forecast, 2025-2035
- 12.6.4 Volume Forecast, 2025-2035
- 12.6.5 Base-Year Market Share, 2025
- 12.6.6 Segment CAGR and Growth Drivers
- 12.6.7 Subsegment Market Size and Forecast
- 12.6.7.1 Primary New-Build Sales
- 12.6.7.2 Secondary Resales
- 12.6.7.3 Long-Term Rentals
- 12.6.7.4 Short-Stay and Serviced Leases
- 12.6.8 Subsegment Pricing and Adoption Trends
- 12.6.9 Leading Suppliers and Competition
- 12.6.10 Regional Demand and Opportunities
- 12.7 Segment Growth Comparison
- 12.8 Segment Attractiveness and Priority Matrix
Chapter 13 Indonesia Residential Real Estate Geographic Market Outlook, 2025-2035
- 13.1 Domestic Market Distribution and Demand Clusters
- 13.2 State- or Province-Wise Market Size and Forecast, 2025-2035
- 13.3 City and Metropolitan Market Outlook
- 13.4 Industrial, Manufacturing and Commercial Clusters
- 13.5 Geographic Concentration of Key End Users
- 13.6 Local Pricing and Purchasing Differences
- 13.7 Domestic Production Facilities and Capacity Map
- 13.8 Local Infrastructure and Project Pipeline
- 13.9 State-Level Policy and Incentive Differences
- 13.10 Subnational Investment Hotspots and Opportunities
- 13.11 Distribution and Logistics Networks
- 13.12 Domestic Competitive Footprint
Chapter 14 Indonesia Residential Real Estate Technology, Innovation and Sustainability Outlook
- 14.1 Technology Landscape and Maturity
- 14.2 Product, Process and Service Innovation
- 14.3 AI, Automation and Digital Tools in the Industry
- 14.4 Technology Adoption and Performance Benchmarking
- 14.5 Innovation Pipeline and R&D Investment
- 14.6 Patent and Intellectual Property Trends
- 14.7 Energy Efficiency and Resource Management
- 14.8 Sustainability, Recycling and Circularity
- 14.9 Technology Roadmap, 2025-2035
- 14.10 Risks of Obsolescence and Technology Substitution
Chapter 15 Indonesia Residential Real Estate Market Key Strategic Imperatives
- 15.1 Growth and Market Entry Priorities
- 15.2 High-Return Products and Segments
- 15.3 Pricing, Profitability and Cost Optimization
- 15.4 Technology Investment and Product Differentiation
- 15.5 Supply Chain Localization and Resilience
- 15.6 Distribution and Customer Acquisition
- 15.7 Partnership, Acquisition and Capacity Strategy
- 15.8 Regional Expansion Priorities
- 15.9 Short-, Medium- and Long-Term Actions
Chapter 16 Competition Outlook
- 16.1 Industry Competition Characteristics
- 16.2 Market Structure and Concentration
- 16.3 Market Share and Competitive Positioning, 2025
- 16.4 Company-Wise Revenue and Product Benchmarking
- 16.5 Production and Service Capacity Benchmarking
- 16.6 Technology, Pricing and Differentiation
- 16.7 Regional Footprint and Distribution Strength
- 16.8 Mergers, Acquisitions and Strategic Alliances
- 16.9 New Entrants and Competitive Threats
- 16.10 Porter's Five Forces and Industry Attractiveness
- 16.11 Competitive Outlook, 2025-2035
Chapter 17 Company Profiles
- 17.1 Company Coverage and Selection Criteria
- 17.2 PT Bumi Serpong Damai Tbk
- 17.2.1 Business Description
- 17.2.2 Company Ownership and Geographic Presence
- 17.2.3 Product and Service Portfolio
- 17.2.4 Manufacturing and Operating Footprint
- 17.2.5 Production Capacity and Expansion Plans
- 17.2.6 Financial Performance and Investment
- 17.2.7 Market Share and Competitive Position
- 17.2.8 Technology and Innovation Capabilities
- 17.2.9 Strategic Alliances or Partnerships
- 17.2.10 Recent Developments
- 17.2.11 Growth Strategy and Outlook
- 17.3 PT Ciputra Development Tbk
- 17.4 PT Summarecon Agung Tbk
- 17.5 PT Pakuwon Jati Tbk
- 17.6 PT Lippo Karawaci Tbk
- 17.7 PT Agung Podomoro Land Tbk
- 17.8 PT Alam Sutera Realty Tbk
- 17.9 PT Intiland Development Tbk
- 17.10 PT Metropolitan Land Tbk
- 17.11 PT Jaya Real Property Tbk
- 17.12 Other Relevant Market Participants
Note: Every listed company is profiled on the structure shown under the first company. The company list is preliminary and may change based on research findings, market developments, data availability and client requirements.
Chapter 18 Disclaimer
- 18.1 Research and Forecast Disclaimer
- 18.2 Data Source and Estimation Limitations
Note: The depth of individual sections depends on data availability for this market. Volume, capacity, trade and other unit-based metrics are included where applicable.

