
Landfill reform turns refuse into a paid service
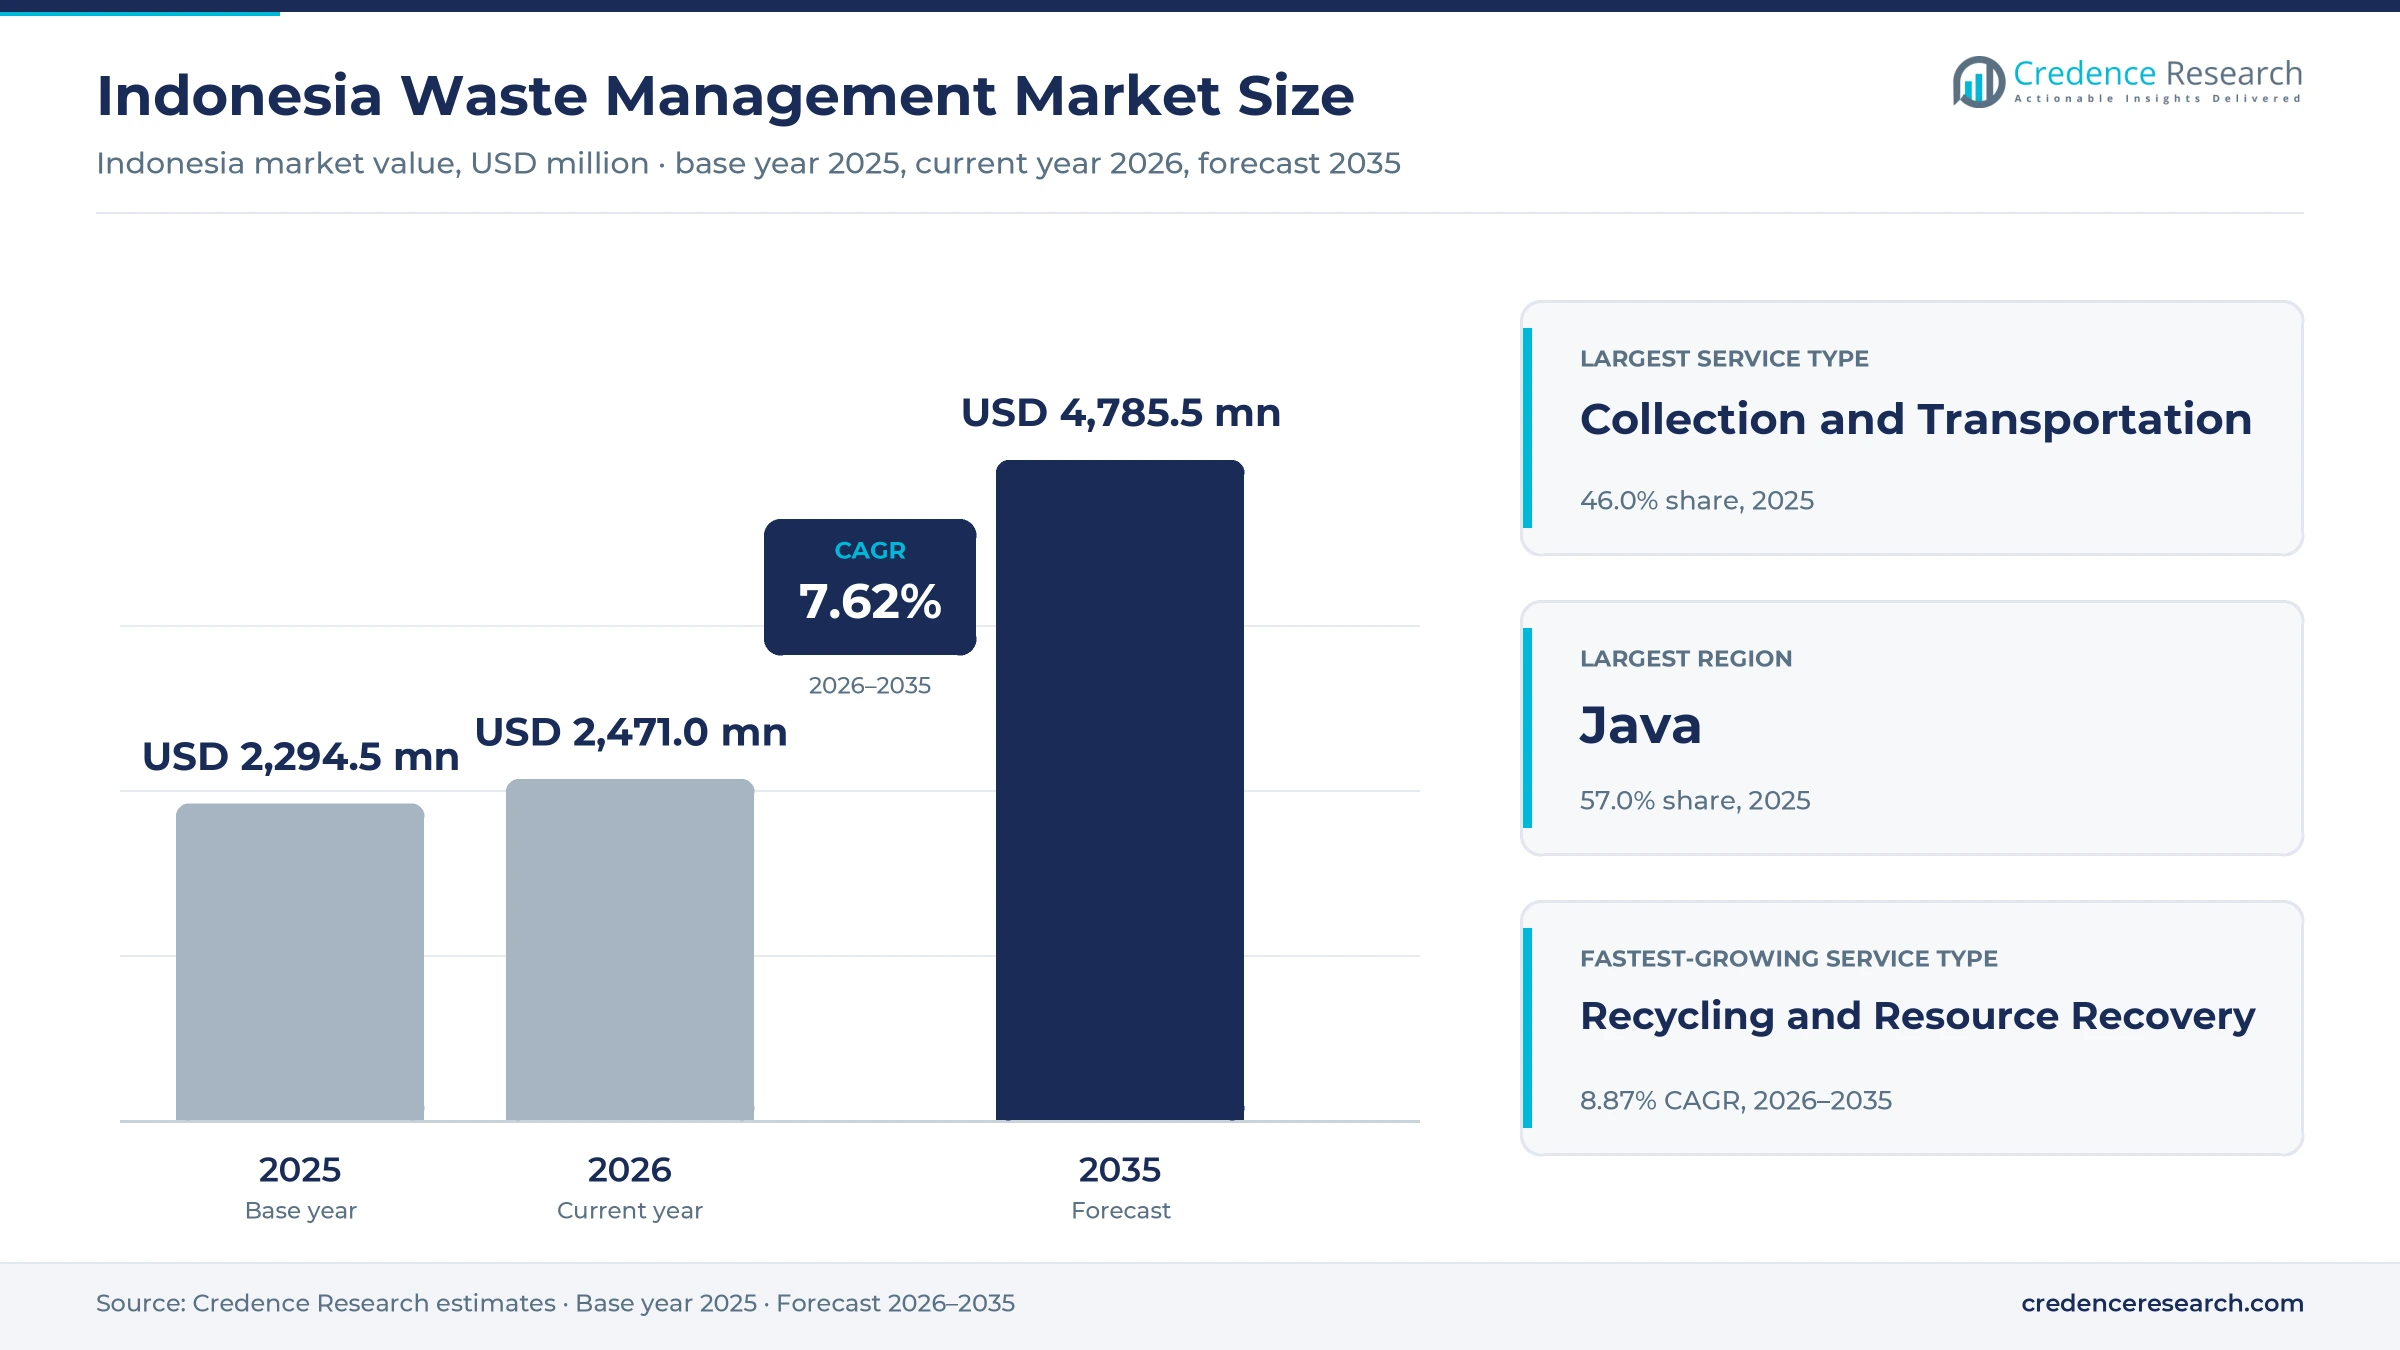
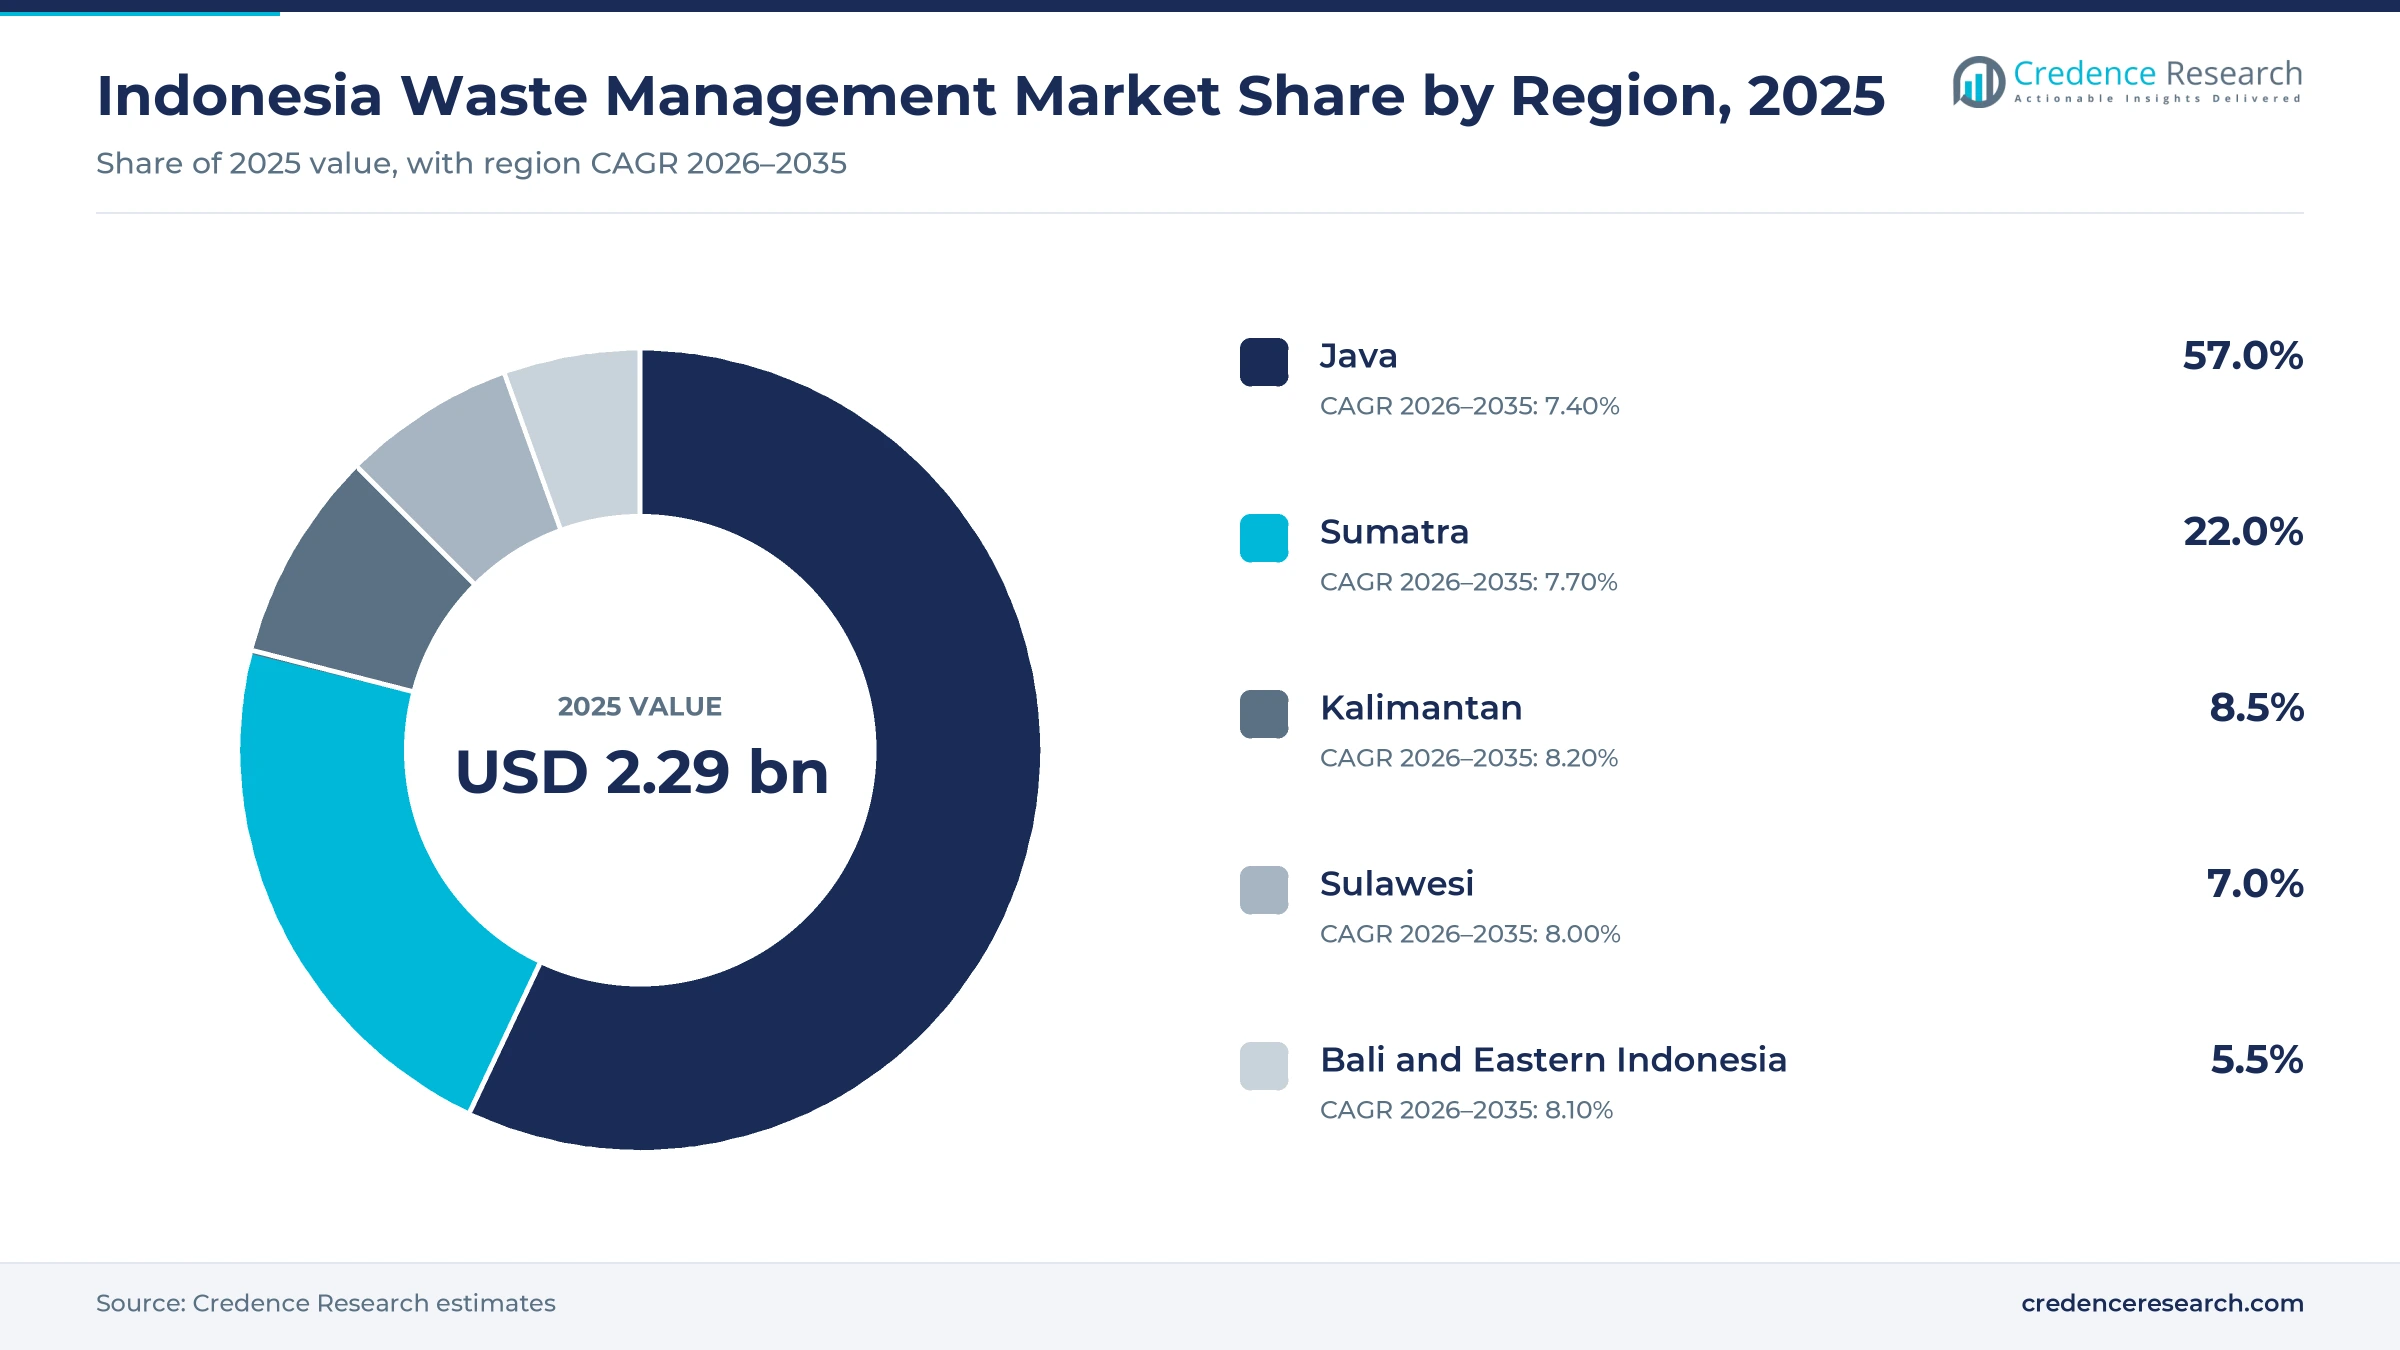
The Indonesia waste management market was valued at USD 2.29 billion in 2025 and is projected to increase from USD 2.47 billion in 2026 to USD 4.79 billion by 2035, registering a CAGR of 7.62% during 2026–2035. Demand comes from fast-growing cities, factories that must use licensed handlers and a national push to close open dumps. Java held the largest regional share, 57.0% in 2025, because the island hosts most of the population, industry and large city contracts. Kalimantan grows fastest at 8.20% a year, as mining, oil and gas and the new capital area create waste that needs licensed treatment. The most important policy change is the national waste-to-energy program under Presidential Regulation 109 of 2025, which offers power income to plants that take city refuse instead of sending it to landfills.
Which waste services and customers does the estimate count?
The estimate measures paid waste management services in Indonesia, including collection and transportation, sorting and transfer, treatment and disposal, recycling and resource recovery, and consulting and compliance work. It covers municipal, industrial, hazardous, healthcare, electronic and construction waste handled for city governments, factories, businesses, hospitals and brand owners. Values are stated in USD million at current prices, converted from rupiah at average annual exchange rates.
The estimate excludes the sale of waste equipment and vehicles, informal scavenging that is not paid as a service and wastewater treatment. It also excludes the value of electricity sold to the grid by power producers. The value chain runs from waste generators through collectors and transfer stations to treatment plants, recyclers, cement kilns and landfills.
Indonesia Waste Management Market Insights
- The Indonesia waste management market was valued at USD 2.29 billion in 2025 and is projected to reach USD 4.79 billion by 2035, registering a CAGR of 7.62% during 2026–2035.
- Java held 57.0% of 2025 value, because the island hosts most of the population, factories and large city waste contracts.
- Collection and transportation led with 46.0% of 2025 value, because city governments spend most of their waste budgets on trucks and crews.
- The Ministry of Environment reported on Oct. 20, 2025, that 246 of 343 open-dumping landfills had been closed or revitalized.
- Recycling and resource recovery grow fastest at 8.87% a year during 2026–2035, as producer duties and fuel recovery create new revenue.
Collection, city refuse and controlled disposal lead value
Why does collection lead waste service spending?
Based on service type, the market is categorized into collection and transportation, sorting and transfer, treatment and disposal, recycling and resource recovery, and consulting and compliance. Collection and Transportation led with 46.0% of 2025 value, because cities pay for daily truck routes and crews. Recycling and Resource Recovery grows fastest at 8.87% a year, as producers fund recovery and cement plants buy waste-based fuel.
Which waste streams generate the most service value?
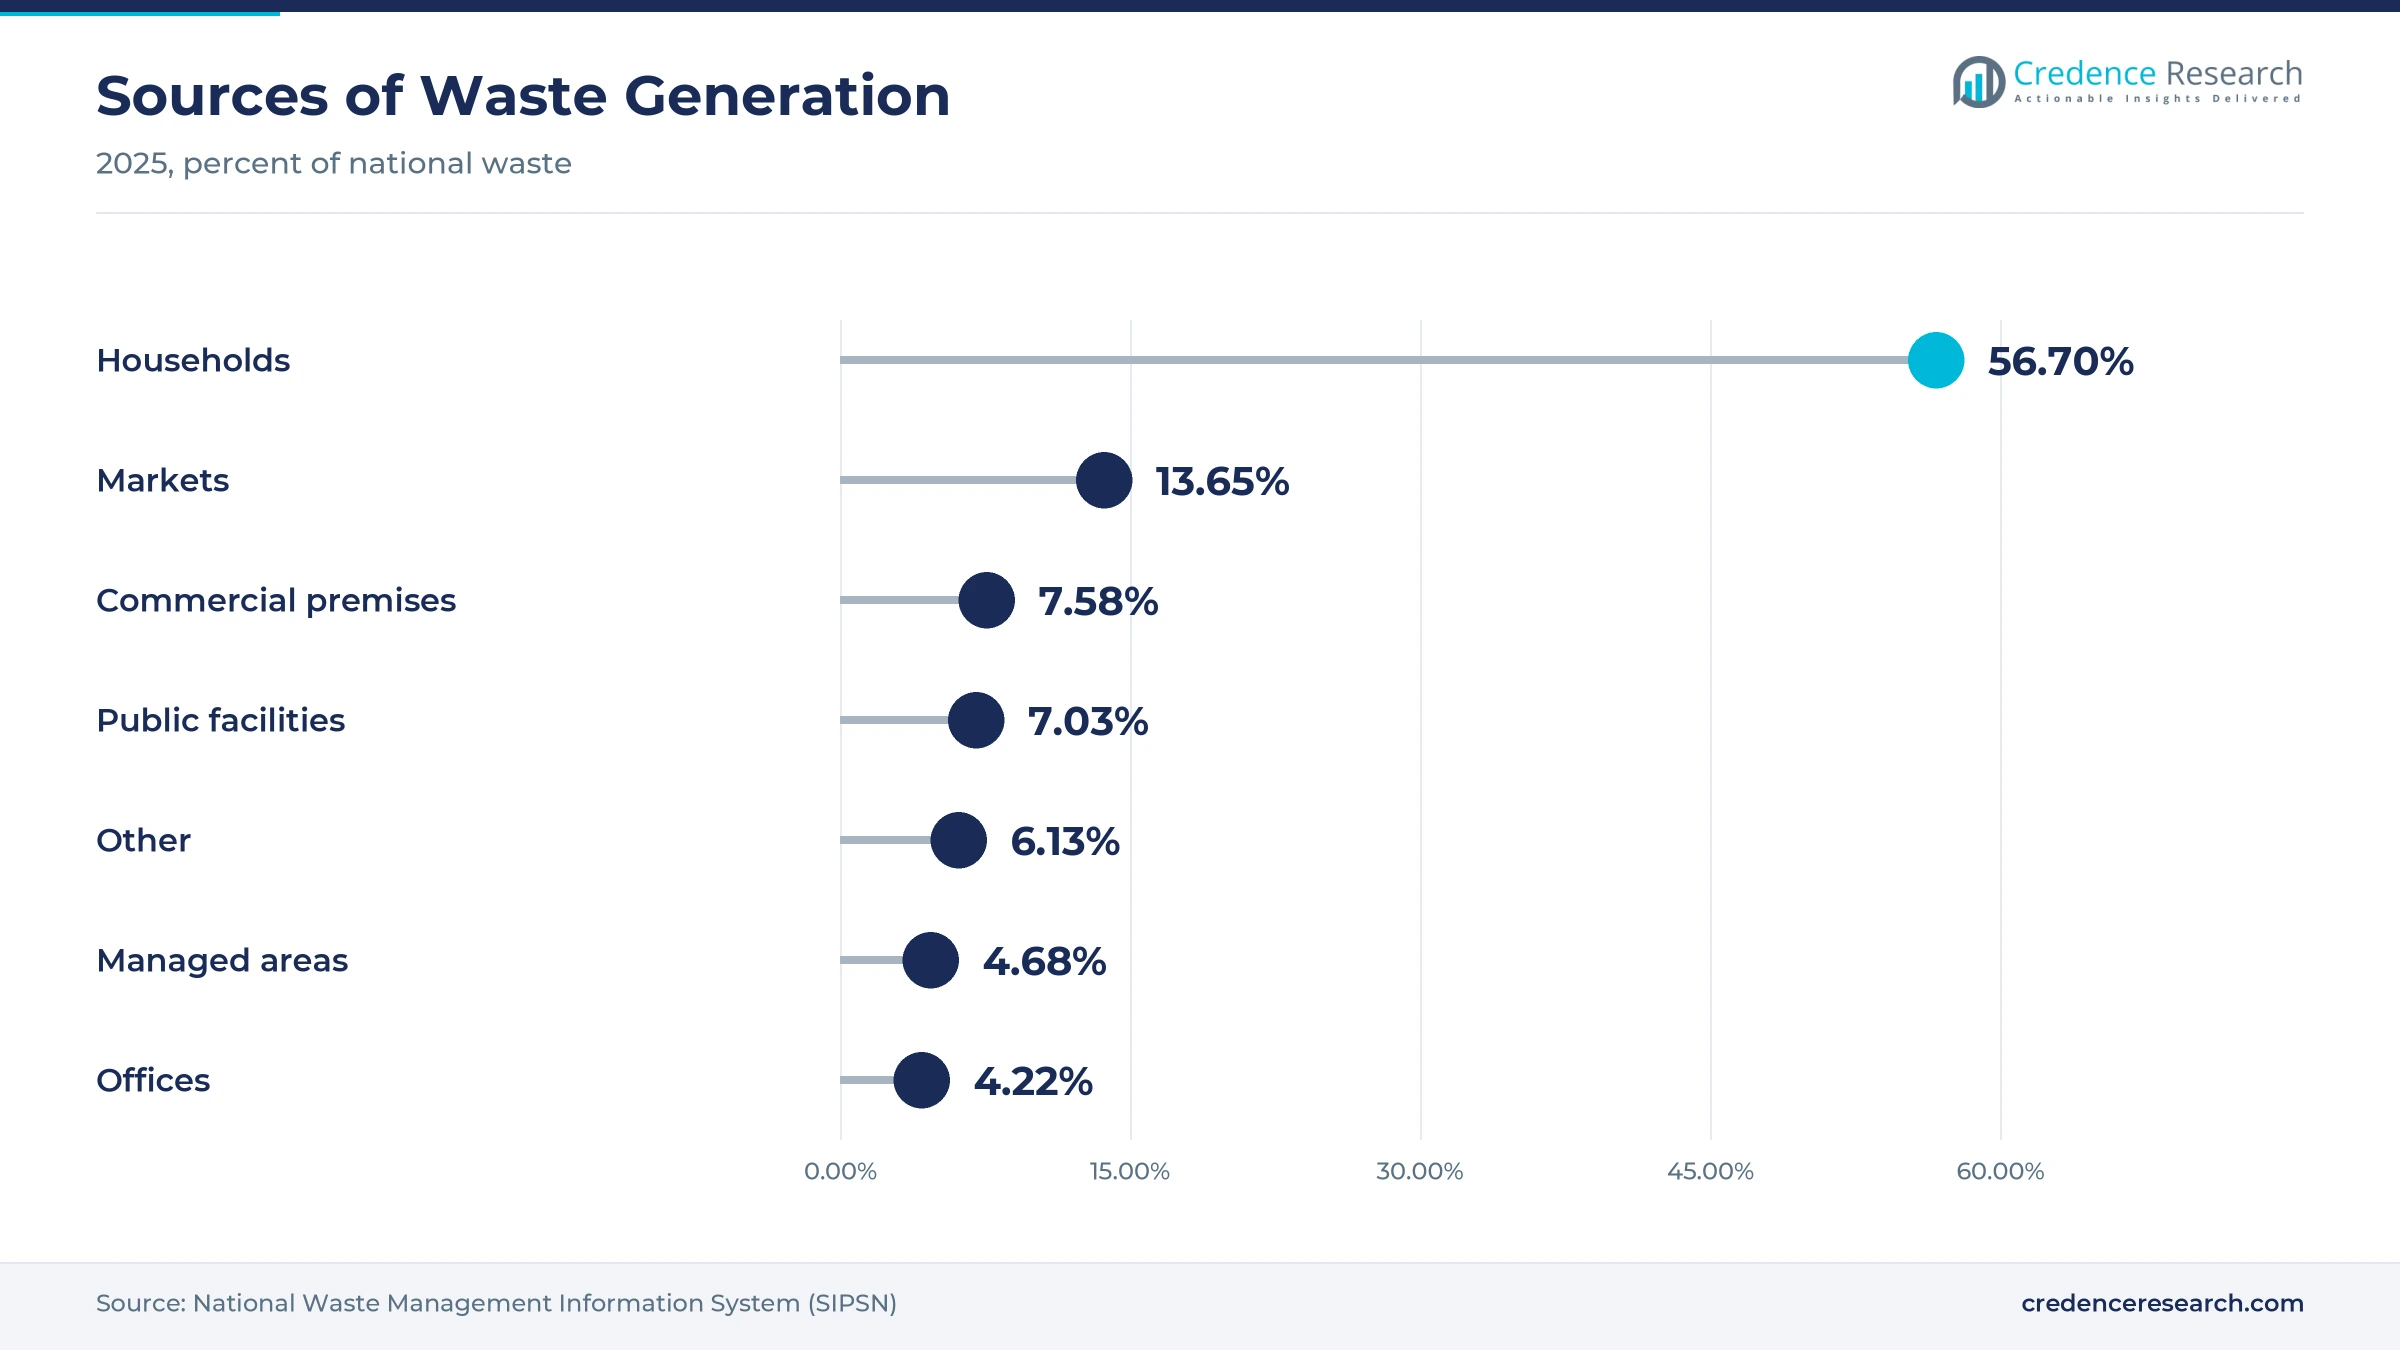
Based on waste type, the market is categorized into municipal solid waste, industrial non-hazardous waste, hazardous waste, healthcare waste and electronic and construction waste. Municipal Solid Waste led with 52.0% of 2025 value, because households produced 56.7% of national waste in 2025. Healthcare Waste grows fastest at 8.24% a year, as hospitals and clinics expand and must use licensed handlers for infectious materials.
Who pays for waste services in Indonesia?
Based on customer type, the market is categorized into municipal governments, industrial generators, commercial establishments, healthcare providers and producers and brand owners. Municipal Governments led with 48.0% of 2025 value, because cities run most collection and landfill contracts for the 24.8 million tons reported in 2025. Producers and Brand Owners grow fastest at 9.36% a year, as packaging rules make brands pay for recovery.
How is treatment shifting away from simple disposal?
Based on treatment technology, the market is categorized into mechanical sorting, biological treatment, thermal treatment, physicochemical treatment and secure disposal. Secure Disposal led with 36.0% of 2025 value, because controlled landfills still take most residual refuse. Thermal Treatment grows fastest at 9.18% a year, as power-generating plants and cement kilns take city waste. The national plan to handle all waste by 2029 adds steady demand for treatment that replaces open dumping.
| Segment Group | Leading Sub-segment | Share, 2025 | Fastest-growing Sub-segment | CAGR, 2026–2035 |
|---|---|---|---|---|
| By Service Type | Collection and Transportation | 46.0% | Recycling and Resource Recovery | 8.87% |
| By Waste Type | Municipal Solid Waste | 52.0% | Healthcare Waste | 8.24% |
| By Customer Type | Municipal Governments | 48.0% | Producers and Brand Owners | 9.36% |
| By Treatment Technology | Secure Disposal | 36.0% | Thermal Treatment | 9.18% |
Request a Free Sample
Fill in your details and we'll send you a free sample report.
- Sample data tables & charts
- Research methodology
Dump closures, city growth and producer duties lift demand
How do national formalization and landfill reform lift spending?
National formalization and landfill reform lift spending, because local governments must replace open dumps with controlled sites and contracted operators. The Ministry of Environment reported on Oct. 20, 2025, that 246 of 343 open-dumping landfills had been closed or revitalized, according to the ministry. Open dumping fell from 99% of landfill operations in 2025 to 69% in early 2026, and the ministry sanctioned 344 landfill sites in 2025, according to Antara. The national plan targets full waste handling by 2029, up from a 51% target for 2025. More than 160 districts and cities were also placed under waste emergency status. As a result, secure disposal keeps 36.0% of 2025 value while controlled landfills replace open dumps.
Why do urbanization, consumption and compliance raise volumes?
Urbanization, consumption and industrial compliance raise the volume of waste that needs paid handling, because cities and factories produce more refuse each year. Indonesia's urban population reached 59.39% of the total in 2025, up from 58.12% in 2023, according to World Bank data. Regencies and cities that reported to the national waste system generated 24.8 million tons in 2025, and households produced 56.7% of it. Only 34.49% of that waste was managed, while 65.51% ended up in the environment, according to national waste system data. This gap shows how much collection and treatment capacity cities still need to buy. Consequently, municipal governments remain the largest customers with 48.0% of 2025 value.
How do producer duties and circular spending add customers?
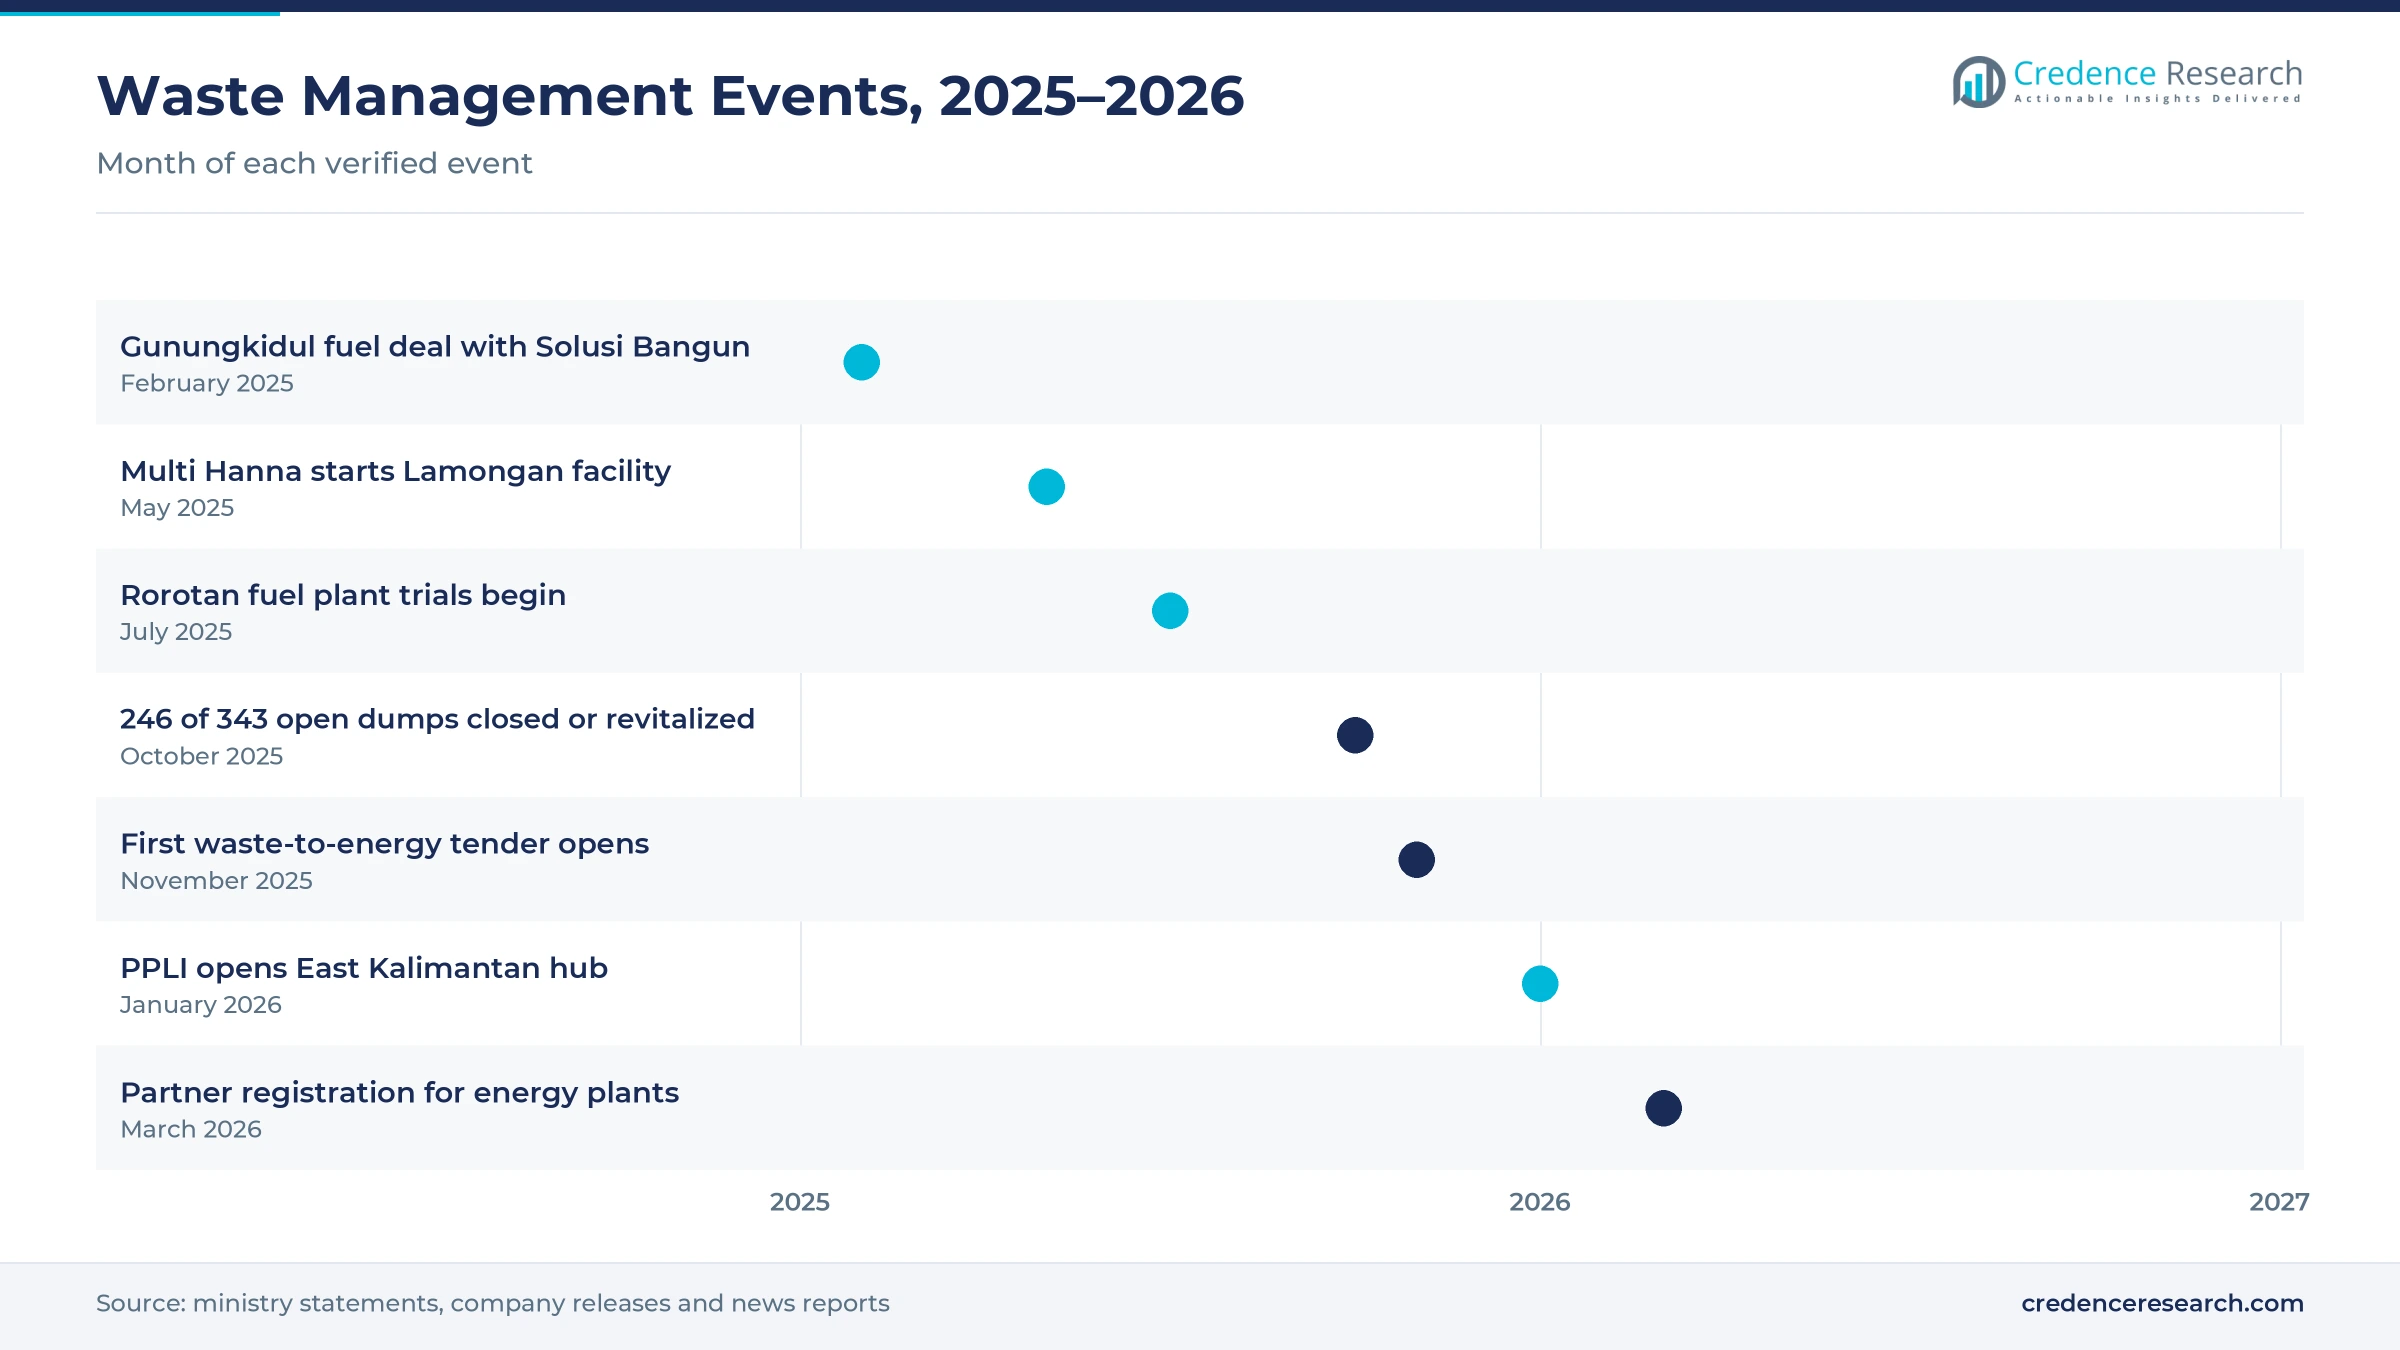
Producer duties and circular-economy spending add new paying customers, because brands must now fund the recovery of their packaging. Ministerial Regulation P.75 of 2019 obliges producers to cut their waste by 30% by 2029, a ministry official said in January 2025. ALBA Tridi Plastics Recycling Indonesia began building a plant in Kendal Industrial Park, with an investment of about US$60 million, designed to make about 36,000 tons of recycled PET a year. Solusi Bangun Indonesia signed a three-year deal on Feb. 3, 2025, to take refuse-derived fuel from Gunungkidul for its Cilacap cement plant. These projects turn waste into a paid input for manufacturers. As a result, producers and brand owners grow fastest among customers at 9.36% a year.
Why does the waste-to-energy program attract investment?
The waste-to-energy program attracts investment, because power sales give treatment plants a second source of income besides gate fees. Presidential Regulation 109 of 2025 sets the rules for turning urban waste into electricity. Danantara opened its first tender on Nov. 6, 2025, for an initial batch of seven cities, within a wider program aimed at 33 to 34 cities, according to Bisnis.com. Bogor, Bekasi, Denpasar and Yogyakarta were judged the most ready after field checks. Danantara Investment Management then opened registration for private partners on March 19, 2026, open to local and foreign firms. Consequently, thermal treatment grows fastest among technologies at 9.18% a year through 2035.
Fuel recovery and industrial treatment hubs reshape services
How is the shift from open dumps to fuel recovery playing out?
Cities are shifting from open dumps to fuel recovery, because refuse-derived fuel cuts landfill volumes and gives cement plants a coal substitute. Jakarta began trials at its Rorotan plant in July 2025, converting 50 tons of dry waste a day. The plant is designed to process 2,500 tons of waste a day once it reaches full capacity. In Yogyakarta province, the Wukisari site in Gunungkidul handles 75 tons a day and is expected to make about 30 tons of fuel daily for a cement plant. The Environment Minister also linked the end of the remaining open dumping to the end of 2026. Consequently, mechanical sorting and fuel preparation take a larger role in city contracts, while landfill volumes fall over time.
Why are industrial treatment hubs rising outside Java?
Industrial treatment hubs are rising outside Java, because mining, oil and gas and smelting sites need licensed hazardous waste handling close to operations. PPLI opened a hazardous waste storage facility in Kutai Kartanegara, East Kalimantan, on Jan. 21, 2026, with a 3,600-square-meter warehouse able to hold 4,000 tons a month. Operators that once hauled waste to Bogor can now store it locally for up to 90 days before treatment. PPLI also plans to add drilling and refinery waste services. Multi Hanna Kreasindo started building a new industrial waste facility in Lamongan, East Java, on May 23, 2025. As a result, industrial generators gain closer licensed options, which lowers transport costs and compliance risk.
Is there an opening in commercial and market waste?
Commercial and market waste offers a clear opening, because shops, markets and offices produce steady volumes that cities often serve poorly. Markets produced 13.65% of national waste in 2025, while commercial premises added 7.58% and offices 4.22%. Together, markets, commercial premises and offices produced about 25.45% of national waste in 2025, which creates steady demand for private collection. Waste4Change is building a 45-ton-a-day facility in Greater Tangerang, as reported in July 2025. Private subscription services can offer sorted collection, recycling reports and fixed monthly fees to these customers. Consequently, commercial establishments become one of the most profitable customer groups for private operators through 2035.
Can compliance and reporting services become a growth opening?
Compliance and reporting services present a second opening, because companies face tighter enforcement and more reporting duties. The ministry sanctioned 23 more landfill operators in January 2026 for continued open dumping. Review times for full environmental impact assessments fell from 271 days to 58 working days, which brings more projects into the permit system faster. Producers covered by P.75 must also submit plans to reduce their packaging waste. More than 160 districts and cities under waste emergency status also create demand for compliance planning and service audits. National carbon exchange trading had passed Rp 30 billion in value by October 2025. In turn, consulting and compliance work grows quickly as firms seek audits, waste tracking and producer reports.
Thin city budgets, slow tenders and site safety weigh
How do thin city budgets limit service quality?
Thin city budgets limit service quality, because many districts collect low waste fees and rely on transfers from the central government. As a result, truck fleets age, routes skip poorer areas and landfill upgrades are delayed. Private operators also face late payment on many municipal service contracts. Clear fee rules, ring-fenced waste budgets and performance-based contracts help cities pay for better service and attract private partners.
Why do slow tenders delay treatment plants?
Slow tenders delay treatment plants, because cities must secure land, waste supply and grid links before investors commit. Only four of the first seven cities in the waste-to-energy tender were judged ready in November 2025. Consequently, projects in other cities wait for permits, land and waste supply guarantees. Standard contracts, guaranteed waste volumes and support from the central government help shorten preparation and keep investors interested.
How do landfill safety risks raise operating costs?
Landfill safety risks raise operating costs, because old dumps hold unstable slopes and methane. A landslide at Bantargebang killed seven workers, which the Environment Minister cited as proof that open dumping endangers lives. As a result, operators must invest in slope control, cover soil and landfill gas capture. These measures raise costs, but they also reduce fire risk and emissions at older sites.
Why does weak separation at source hurt recovery?
Weak separation at source hurts recovery, because mixed refuse lowers the quality and price of recyclables and fuel. Households produce most waste in cities, and few sort it before collection. As a result, sorting plants spend more on labor and machines, and more residue goes to landfills. Community waste banks, clear collection days and education campaigns help raise separation rates over time.
Java leads while Kalimantan grows fastest
| Region | Value, 2025 (USD billion) | Share, 2025 | CAGR, 2026–2035 |
|---|---|---|---|
| Java | 1.31 | 57.0% | 7.40% |
| Sumatra | 0.50 | 22.0% | 7.70% |
| Kalimantan | 0.20 | 8.5% | 8.20% |
| Sulawesi | 0.16 | 7.0% | 8.00% |
| Bali and Eastern Indonesia | 0.13 | 5.5% | 8.10% |
Why does Java lead waste service spending?
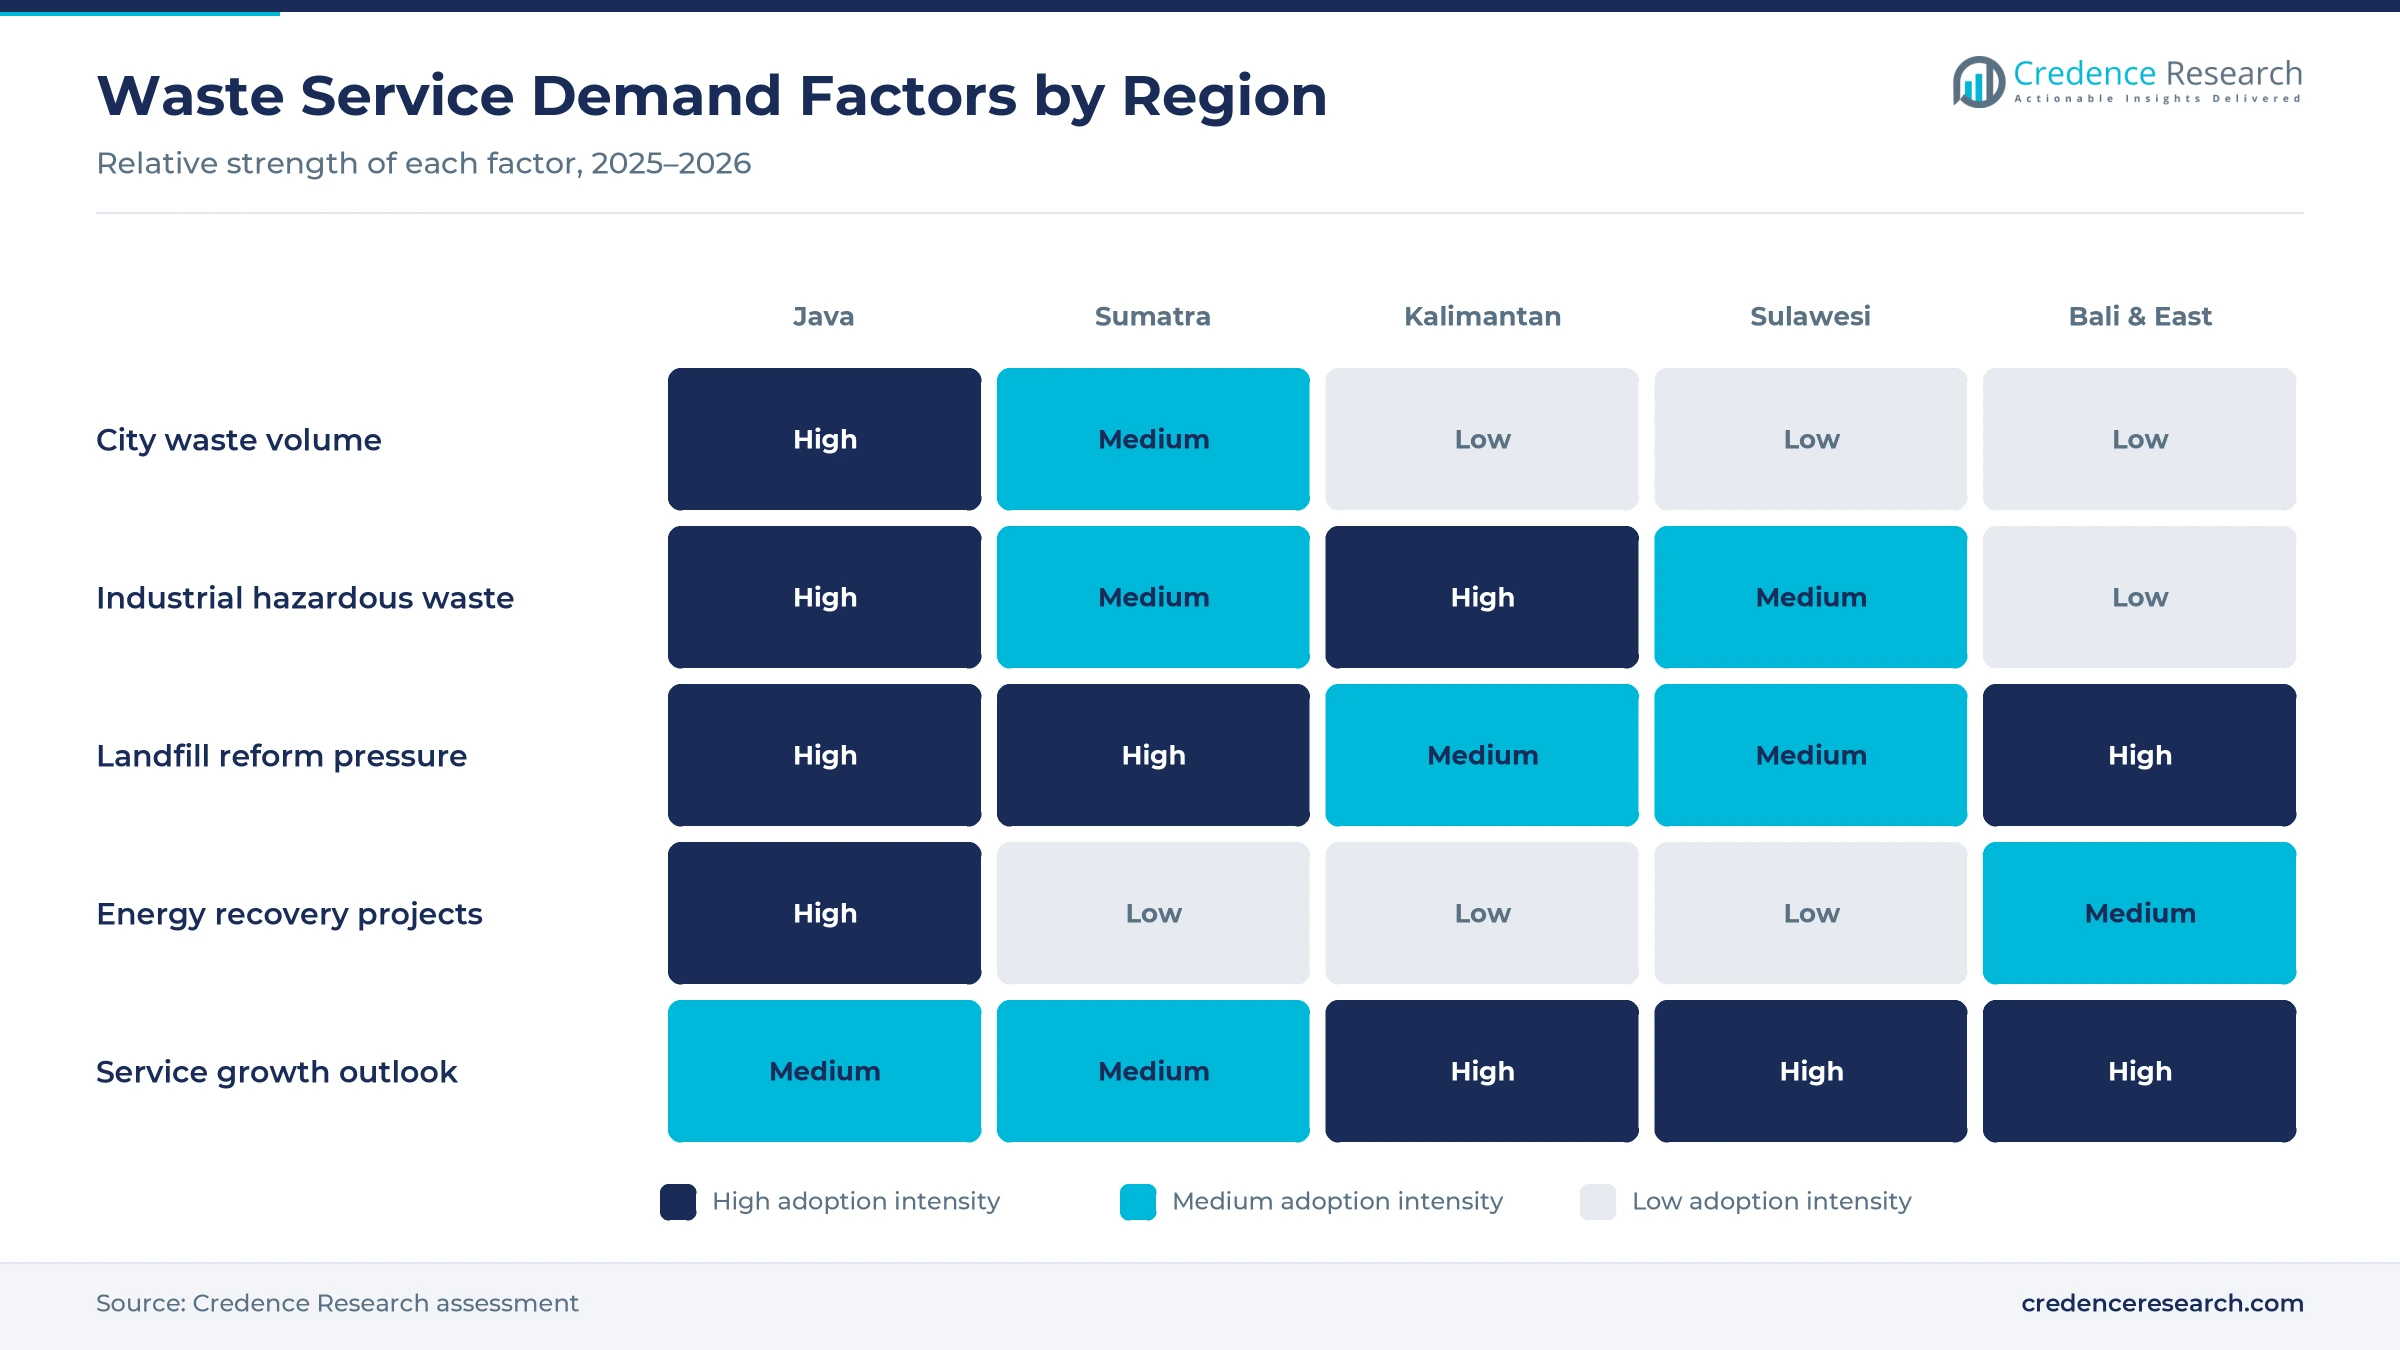
Java held 57.0% of 2025 value and grows at 7.40% a year, because the island hosts most of the population, factories and large city contracts. Jakarta's Rorotan fuel plant is designed to process 2,500 tons a day, which makes Java the center of demand for fuel recovery. Bogor, Bekasi and Yogyakarta were among the cities judged ready for the first waste-to-energy tender. Hazardous waste treatment is also concentrated in West and East Java, near the main industrial estates.
What shapes waste demand in Sumatra?
Sumatra held 22.0% of 2025 value and grows at 7.70% a year, because Medan, Palembang and Pekanbaru are large cities with rising household waste. Palm oil mills, pulp plants and refineries also produce industrial waste that needs licensed handling. Cities in Sumatra are working to replace open dumps with controlled landfills under national rules. Private collectors serve industrial estates, ports and shopping centers in the main cities.
Why does Kalimantan grow fastest?
Kalimantan held 8.5% of 2025 value and grows fastest at 8.20% a year, because mining, oil and gas and the new capital area create waste that needs licensed treatment. PPLI opened a hazardous waste storage hub in Kutai Kartanegara in January 2026 for oil and gas operators along the Mahakam River. The hub can store up to 4,000 tons of hazardous waste a month, which supports regional demand for licensed treatment.
How does Sulawesi add industrial demand?
Sulawesi held 7.0% of 2025 value and grows at 8.00% a year, because nickel smelting parks and growing cities such as Makassar and Manado create new waste. Smelters produce slag, oils and chemicals that must go to licensed handlers. Makassar also needs more city collection and controlled disposal as its population grows.
How do Bali and eastern Indonesia add tourism demand?
Bali and Eastern Indonesia held 5.5% of 2025 value and grow at 8.10% a year, because hotels, restaurants and visitors produce large volumes of refuse on small islands. Denpasar was among the four cities judged ready for the first waste-to-energy tender in November 2025, which supports treatment demand. Remote towns in Maluku and Papua still rely on basic collection and small landfills.
Tenders, fuel plants and new treatment hubs
| Development | Status and market relevance |
|---|---|
| In February 2025, Solusi Bangun Indonesia and Gunungkidul Regency signed a three-year deal to supply refuse-derived fuel to the Cilacap cement plant. | Links city waste with cement fuel demand |
| In July 2025, Jakarta began trials at the Rorotan fuel plant, converting 50 tons of dry waste a day. | Starts large-scale fuel recovery in the capital |
| In November 2025, Danantara opened the first waste-to-energy tender for seven cities under Presidential Regulation 109 of 2025. | Opens power-linked treatment projects to investors |
| In January 2026, PPLI opened a hazardous waste storage facility in Kutai Kartanegara, East Kalimantan. | Adds licensed industrial capacity outside Java |
| In March 2026, Danantara Investment Management opened registration for private waste-to-energy partners. | Widens the pool of qualified bidders |
Fuel recovery, recycling and tracking tools change delivery
- Fuel preparation lines shred, dry and sort mixed refuse so that cement kilns can burn it in place of coal, which cuts landfill volumes.
- Bottle-to-bottle lines used in plastic recycling wash and decontaminate PET flakes so they can return to food-grade packaging.
- Licensed thermal units such as medical incinerators destroy infectious hospital materials under strict emission rules.
- Digital tracking tools record pickups, weights and disposal sites so that producers and factories can prove compliance to regulators and auditors.
Need a Custom Version of This Report?
Tailor the scope, geography, or segments to your exact requirements.
- Custom geography or segment scope
- Direct access to our analyst team
Hazardous specialists, recyclers and city operators compete
Competition is split between hazardous waste specialists, recyclers, cement companies and city service operators. PT Prasadha Pamunah Limbah Industri runs licensed hazardous waste treatment and opened a storage hub in East Kalimantan in 2026. PT Multi Hanna Kreasindo Tbk collects and treats industrial waste and began building a facility in Lamongan in 2025. PT Solusi Bangun Indonesia Tbk uses refuse-derived fuel in its cement kilns, while PT ALBA Tridi Plastics Recycling Indonesia makes recycled PET in Central Java. Waste4Change serves businesses and producers with collection and recovery services. Companies compete on permits, treatment capacity, distance to clients, price per ton and reporting quality. City-owned operators still run most household collection, while large investors prepare bids for waste-to-energy plants.
Companies profiled and their roles in this market
| Company | Type | Role in the market |
|---|---|---|
| PT Prasadha Pamunah Limbah Industri (PPLI) | Hazardous waste specialist | Opened a 4,000-ton-a-month storage hub in East Kalimantan in January 2026 |
| PT Multi Hanna Kreasindo Tbk | Industrial waste handler | Began building a facility in Lamongan, East Java, in May 2025 |
| PT Solusi Bangun Indonesia Tbk | Cement co-processor | Signed a refuse-derived fuel deal with Gunungkidul in February 2025 |
| PT ALBA Tridi Plastics Recycling Indonesia | Plastics recycler | Kendal plant designed for about 36,000 tons of recycled PET a year |
| PT Wasteforchange Alam Indonesia (Waste4Change) | Collection and recovery provider | Building a 45-ton-a-day facility in Greater Tangerang |
Credence Research view on fast service growth
Credence Research's view is that Indonesian waste services will grow quickly through 2035, because open dump closures, city growth and producer duties turn unmanaged refuse into paid work. Collection and transportation already hold 46.0% of 2025 value, while recycling and resource recovery grow fastest. Waste-to-energy tenders and cement fuel deals should add treatment capacity. However, thin city budgets and slow project preparation could delay some plants. Java keeps the largest share, while Kalimantan grows faster as industry expands.
How the waste services estimate was built
The report uses 2025 as the base year, with values in USD million at current prices. Market values come from the Credence Research model, which combines waste volumes, service prices and contract spending. Regional shares follow the client regional split, and segment splits by service, waste type, customer and treatment technology are Credence Research estimates. Sources used are ministry statements, national waste system data, World Bank data, company announcements and news reports, and no interviews or surveys were used.
Energy recovery and producer duties set the path to 2035
The market is expected to reach USD 4.79 billion by 2035, a 7.62% CAGR during 2026–2035, as landfill reform, urban growth and producer duties lift spending on waste services. Growth should be strongest in recycling and resource recovery, thermal treatment and in Kalimantan, while Java keeps the largest share. Operators with permits, treatment capacity and data tools should win the most contracts. In contrast, delays in waste-to-energy tenders or weak city budgets would slow growth for some providers.
Frequently Asked Questions
How big is the Indonesia waste management market?
Which region leads waste service spending in Indonesia?
Which region grows fastest?
Which service type holds the largest share?
Which customer group grows fastest?
How much waste does Indonesia generate?
Who are the leading waste management companies in Indonesia?
What are the main risks to growth?
Table of Content
Chapter 1 Market Segmentation
- 1.1 Segmentation Framework
- 1.1.1 Product and Service Classification
- 1.1.2 Application and End-Use Classification
- 1.1.3 Technology and Solution Classification
- 1.1.4 Customer and Distribution Channel Classification
- 1.1.5 Geographic Segmentation
- 1.1.6 Market Segment Definitions and Boundaries
- 1.2 By Service Type
- 1.2.1 Collection and Transportation
- 1.2.2 Sorting and Transfer
- 1.2.3 Treatment and Disposal
- 1.2.4 Recycling and Resource Recovery
- 1.2.5 Consulting and Compliance
- 1.3 By Waste Type
- 1.3.1 Municipal Solid Waste
- 1.3.2 Industrial Non-Hazardous Waste
- 1.3.3 Hazardous Waste
- 1.3.4 Healthcare Waste
- 1.3.5 Electronic and Construction Waste
- 1.4 By Customer Type
- 1.4.1 Municipal Governments
- 1.4.2 Industrial Generators
- 1.4.3 Commercial Establishments
- 1.4.4 Healthcare Providers
- 1.4.5 Producers and Brand Owners
- 1.5 By Treatment Technology
- 1.5.1 Mechanical Sorting
- 1.5.2 Biological Treatment
- 1.5.3 Thermal Treatment
- 1.5.4 Physicochemical Treatment
- 1.5.5 Secure Disposal
Chapter 2 Introduction
- 2.1 Report Objectives and Scope
- 2.2 Product Definition and Industry Terminology
- 2.3 Market Inclusions and Exclusions
- 2.4 Research Process
- 2.4.1 Primary Research and Expert Interviews
- 2.4.2 Secondary Research and Source Review
- 2.4.3 Top-Down and Bottom-Up Estimation
- 2.4.4 Data Triangulation and Verification
- 2.5 Market Size Measurement Basis
- 2.5.1 2025: USD 2.29 billion → 2035: USD 4.79 billion
- 2.6 Historical and Forecast Reference Periods
- 2.6.1 Historical Period: 2018-2025
- 2.6.2 Base Year: 2025
- 2.6.3 Forecast Period: 2025-2035
- 2.7 Research Assumptions and Limitations
Chapter 3 Executive Summary
- 3.1 Market Snapshot and Key Findings
- 3.2 Base-Year Market Size, 2025
- 3.3 Forecast Market Size, 2035
- 3.4 Revenue and Volume Growth Outlook
- 3.5 Key Demand and Supply Indicators
- 3.6 Leading Market Segments
- 3.7 Fastest-Growing Market Opportunities
- 3.8 Regional Performance Highlights
- 3.9 Technology and Industry Transformation
- 3.10 Competitive Landscape Summary
- 3.11 Analyst View and Strategic Implications
Chapter 4 Indonesia Waste Management Market Trends and Developments
- 4.1 Historical Industry Development, 2018-2025
- 4.2 Recent Market Trends and Developments
- 4.3 Demand and Customer Behavior Trends
- 4.4 Technology and Product Innovation
- 4.5 Artificial Intelligence, Automation and Digitalization
- 4.6 Local Manufacturing and Supply Chain Realignment
- 4.7 Industry Partnerships, Mergers and Acquisitions
- 4.8 Sustainability and Circular Economy Developments
- 4.9 Government and Private Sector Investment Trends
- 4.10 Emerging Business Models and Commercialization
- 4.11 Industry Developments and Announcements
Chapter 5 Indonesia Waste Management Market Production, Supply and Demand Analysis
- 5.1 Demand Trend and Consumption Analysis, 2018-2025
- 5.2 Demand Forecast, 2025-2035
- 5.3 Production and Output Trend, 2018-2025
- 5.4 Production and Output Forecast, 2025-2035
- 5.5 Installed Capacity and Capacity Utilization
- 5.6 Company-Wise Production Plants and Statistics
- 5.6.1 Installed Production Capacity
- 5.6.2 Actual Production
- 5.6.3 Planned Capacity and Expansion Targets
- 5.7 Supply Chain Structure and Procurement Trends
- 5.8 Supply-Demand Gap and Bottlenecks
- 5.9 Import Dependence and Sourcing Structure
- 5.10 Contract Manufacturing and Outsourcing
- 5.11 Regional Supply and Demand Concentration
Chapter 6 Indonesia Waste Management Market Pricing Analysis
- 6.1 Pricing Structure and Measurement
- 6.2 Historical Pricing Trends, 2018-2025
- 6.3 Pricing Outlook, 2025-2035
- 6.4 Average Selling Price and Unit Economics
- 6.5 Pricing by Product and Market Segment
- 6.6 Geographic Pricing Differences
- 6.7 Key Input, Energy, Labor and Logistics Costs
- 6.8 Contract Pricing and Purchasing Models
- 6.9 Pricing Sensitivity and Competitive Positioning
- 6.10 Price, Margin and Profitability Implications
Chapter 7 Indonesia Waste Management Market Dynamics
- 7.1 Market Growth Drivers
- 7.1.1 Demand-Side Drivers
- 7.1.2 Technology and Innovation Drivers
- 7.1.3 Infrastructure and Investment Drivers
- 7.1.4 Regulatory and Policy Drivers
- 7.2 Market Restraints
- 7.2.1 Cost and Affordability Constraints
- 7.2.2 Technology and Adoption Barriers
- 7.2.3 Supply Chain and Operational Constraints
- 7.3 Market Challenges
- 7.3.1 Competitive Pressure and Margin Erosion
- 7.3.2 Skills, Infrastructure and Implementation Gaps
- 7.4 Emerging Market Opportunities
- 7.5 Market Dynamics Impact and Time-Horizon Assessment
Chapter 8 Indonesia Waste Management Value Chain Analysis
- 8.1 Industry Value Chain Overview
- 8.2 Upstream Suppliers and Critical Inputs
- 8.3 Technology and Component Providers
- 8.4 Manufacturing or Service Delivery
- 8.5 Distribution, Channel Partners and Integrators
- 8.6 Downstream Applications and End Users
- 8.7 Value Addition and Profit Pools
- 8.8 Vertical Integration and Outsourcing
- 8.9 Supplier Concentration and Risk
- 8.10 Supply Chain Localization and Resilience
Chapter 9 Indonesia Waste Management Market Regulations and Policies
- 9.1 Relevant Laws, Standards and Compliance Frameworks
- 9.2 Product, Service, Safety and Quality Requirements
- 9.3 Government Policies, Incentives and Subsidies
- 9.4 Imports, Exports and Trade Barriers
- 9.5 Public Procurement and Local Content Requirements
- 9.6 Environmental and Sustainability Compliance
- 9.7 Upcoming Policy Changes and Market Implications
Chapter 10 Indonesia Waste Management Market Hotspots and Opportunities
- 10.1 Market Opportunity Mapping and Growth Hotspots
- 10.2 High-Growth Applications and Customer Groups
- 10.3 Underserved Markets and White-Space Opportunities
- 10.4 Emerging Technology and Product Opportunities
- 10.5 New Capacity and Investment Hotspots
- 10.6 Market Entry and Expansion Opportunities
- 10.7 Distribution and Partnership Opportunities
- 10.8 Near-Term and Long-Term Commercial Potential
- 10.9 Opportunity Attractiveness and Execution Risks
Chapter 11 Indonesia Waste Management Market Outlook, 2025-2035
- 11.1 Market Size and Analysis
- 11.1.1 Revenue (Market Measurement: 2025: USD 2.29 billion → 2035: USD 4.79 billion)
- 11.1.2 Market Volume and Quantity Sold
- 11.1.3 Historical Market Size, 2018-2025
- 11.1.4 Base-Year Market Size, 2025
- 11.2 Market Forecast, 2025-2035
- 11.2.1 Revenue Forecast to 2035
- 11.2.2 Volume Forecast to 2035
- 11.2.3 CAGR and Year-on-Year Growth
- 11.2.4 Incremental Revenue Opportunity
- 11.3 Forecast Assumptions and Scenario Analysis
- 11.3.1 Base-Case Forecast
- 11.3.2 Optimistic and Conservative Scenarios
- 11.3.3 Technology, Pricing and Policy Sensitivities
- 11.4 Market Attractiveness and Growth Outlook
Chapter 12 Indonesia Waste Management Market Segmentation and Outlook
- 12.1 Segmentation Summary and Market Shares, 2025
- 12.2 Largest and Fastest-Growing Segments
- 12.3 By Service Type - Market Size and Forecast, 2025-2035
- 12.3.1 Segment Definition and Scope
- 12.3.2 Historical Market Size, 2018-2025
- 12.3.3 Revenue Forecast, 2025-2035
- 12.3.4 Volume Forecast, 2025-2035
- 12.3.5 Base-Year Market Share, 2025
- 12.3.6 Segment CAGR and Growth Drivers
- 12.3.7 Subsegment Market Size and Forecast
- 12.3.7.1 Collection and Transportation
- 12.3.7.2 Sorting and Transfer
- 12.3.7.3 Treatment and Disposal
- 12.3.7.4 Recycling and Resource Recovery
- 12.3.7.5 Consulting and Compliance
- 12.3.8 Subsegment Pricing and Adoption Trends
- 12.3.9 Leading Suppliers and Competition
- 12.3.10 Regional Demand and Opportunities
- 12.4 By Waste Type - Market Size and Forecast, 2025-2035
- 12.4.1 Segment Definition and Scope
- 12.4.2 Historical Market Size, 2018-2025
- 12.4.3 Revenue Forecast, 2025-2035
- 12.4.4 Volume Forecast, 2025-2035
- 12.4.5 Base-Year Market Share, 2025
- 12.4.6 Segment CAGR and Growth Drivers
- 12.4.7 Subsegment Market Size and Forecast
- 12.4.7.1 Municipal Solid Waste
- 12.4.7.2 Industrial Non-Hazardous Waste
- 12.4.7.3 Hazardous Waste
- 12.4.7.4 Healthcare Waste
- 12.4.7.5 Electronic and Construction Waste
- 12.4.8 Subsegment Pricing and Adoption Trends
- 12.4.9 Leading Suppliers and Competition
- 12.4.10 Regional Demand and Opportunities
- 12.5 By Customer Type - Market Size and Forecast, 2025-2035
- 12.5.1 Segment Definition and Scope
- 12.5.2 Historical Market Size, 2018-2025
- 12.5.3 Revenue Forecast, 2025-2035
- 12.5.4 Volume Forecast, 2025-2035
- 12.5.5 Base-Year Market Share, 2025
- 12.5.6 Segment CAGR and Growth Drivers
- 12.5.7 Subsegment Market Size and Forecast
- 12.5.7.1 Municipal Governments
- 12.5.7.2 Industrial Generators
- 12.5.7.3 Commercial Establishments
- 12.5.7.4 Healthcare Providers
- 12.5.7.5 Producers and Brand Owners
- 12.5.8 Subsegment Pricing and Adoption Trends
- 12.5.9 Leading Suppliers and Competition
- 12.5.10 Regional Demand and Opportunities
- 12.6 By Treatment Technology - Market Size and Forecast, 2025-2035
- 12.6.1 Segment Definition and Scope
- 12.6.2 Historical Market Size, 2018-2025
- 12.6.3 Revenue Forecast, 2025-2035
- 12.6.4 Volume Forecast, 2025-2035
- 12.6.5 Base-Year Market Share, 2025
- 12.6.6 Segment CAGR and Growth Drivers
- 12.6.7 Subsegment Market Size and Forecast
- 12.6.7.1 Mechanical Sorting
- 12.6.7.2 Biological Treatment
- 12.6.7.3 Thermal Treatment
- 12.6.7.4 Physicochemical Treatment
- 12.6.7.5 Secure Disposal
- 12.6.8 Subsegment Pricing and Adoption Trends
- 12.6.9 Leading Suppliers and Competition
- 12.6.10 Regional Demand and Opportunities
- 12.7 Segment Growth Comparison
- 12.8 Segment Attractiveness and Priority Matrix
Chapter 13 Indonesia Waste Management End-Use and Application Market Outlook
- 13.1 End-Use Industry and Customer Demand Structure
- 13.2 Leading Applications and Customer Groups
- 13.3 End-Use Market Size, Share and Forecast
- 13.4 Major End-Use Industry Deep Dives
- 13.4.1 Customer Requirements and Use Cases
- 13.4.2 Demand and Replacement Cycles
- 13.4.3 Technical and Regulatory Considerations
- 13.4.4 Purchasing and Procurement Models
- 13.4.5 Leading Vendors and Distribution Channels
- 13.4.6 Forecast and Commercial Opportunities
- 13.5 Emerging Applications and Cross-Segment Demand
- 13.6 End-Use Industry Investment Priorities
Chapter 14 Indonesia Waste Management Geographic Market Outlook, 2025-2035
- 14.1 Domestic Market Distribution and Demand Clusters
- 14.2 State- or Province-Wise Market Size and Forecast, 2025-2035
- 14.3 City and Metropolitan Market Outlook
- 14.4 Industrial, Manufacturing and Commercial Clusters
- 14.5 Geographic Concentration of Key End Users
- 14.6 Local Pricing and Purchasing Differences
- 14.7 Domestic Production Facilities and Capacity Map
- 14.8 Local Infrastructure and Project Pipeline
- 14.9 State-Level Policy and Incentive Differences
- 14.10 Subnational Investment Hotspots and Opportunities
- 14.11 Distribution and Logistics Networks
- 14.12 Domestic Competitive Footprint
Chapter 15 Indonesia Waste Management Technology, Innovation and Sustainability Outlook
- 15.1 Technology Landscape and Maturity
- 15.2 Product, Process and Service Innovation
- 15.3 AI, Automation and Digital Tools in the Industry
- 15.4 Technology Adoption and Performance Benchmarking
- 15.5 Innovation Pipeline and R&D Investment
- 15.6 Patent and Intellectual Property Trends
- 15.7 Energy Efficiency and Resource Management
- 15.8 Sustainability, Recycling and Circularity
- 15.9 Technology Roadmap, 2025-2035
- 15.10 Risks of Obsolescence and Technology Substitution
Chapter 16 Indonesia Waste Management Market Key Strategic Imperatives
- 16.1 Growth and Market Entry Priorities
- 16.2 High-Return Products and Segments
- 16.3 Pricing, Profitability and Cost Optimization
- 16.4 Technology Investment and Product Differentiation
- 16.5 Supply Chain Localization and Resilience
- 16.6 Distribution and Customer Acquisition
- 16.7 Partnership, Acquisition and Capacity Strategy
- 16.8 Regional Expansion Priorities
- 16.9 Short-, Medium- and Long-Term Actions
Chapter 17 Competition Outlook
- 17.1 Industry Competition Characteristics
- 17.2 Market Structure and Concentration
- 17.3 Market Share and Competitive Positioning, 2025
- 17.4 Company-Wise Revenue and Product Benchmarking
- 17.5 Production and Service Capacity Benchmarking
- 17.6 Technology, Pricing and Differentiation
- 17.7 Regional Footprint and Distribution Strength
- 17.8 Mergers, Acquisitions and Strategic Alliances
- 17.9 New Entrants and Competitive Threats
- 17.10 Porter's Five Forces and Industry Attractiveness
- 17.11 Competitive Outlook, 2025-2035
Chapter 18 Company Profiles
- 18.1 Company Coverage and Selection Criteria
- 18.2 PT Prasadha Pamunah Limbah Industri (PPLI)
- 18.2.1 Business Description
- 18.2.2 Company Ownership and Geographic Presence
- 18.2.3 Product and Service Portfolio
- 18.2.4 Manufacturing and Operating Footprint
- 18.2.5 Production Capacity and Expansion Plans
- 18.2.6 Financial Performance and Investment
- 18.2.7 Market Share and Competitive Position
- 18.2.8 Technology and Innovation Capabilities
- 18.2.9 Strategic Alliances or Partnerships
- 18.2.10 Recent Developments
- 18.2.11 Growth Strategy and Outlook
- 18.3 PT Wasteforchange Alam Indonesia (Waste4Change)
- 18.4 PT Multi Hanna Kreasindo Tbk
- 18.5 PT Reciki Solusi Indonesia
- 18.6 PT Arah Environmental Indonesia
- 18.7 PT Universal Eco Pasific
- 18.8 PT Mukti Mandiri Lestari
- 18.9 PT ALBA Tridi Plastics Recycling Indonesia
- 18.10 PT Veolia Services Indonesia
- 18.11 Nathabumi
- 18.12 PT Solusi Bangun Indonesia Tbk
- 18.13 Other Relevant Market Participants
Note: Every listed company is profiled on the structure shown under the first company. The company list is preliminary and may change based on research findings, market developments, data availability and client requirements.
Chapter 19 Disclaimer
- 19.1 Research and Forecast Disclaimer
- 19.2 Data Source and Estimation Limitations
Note: The depth of individual sections depends on data availability for this market. Volume, capacity, trade and other unit-based metrics are included where applicable.

