
Fire codes and apartment work shape Australian demand
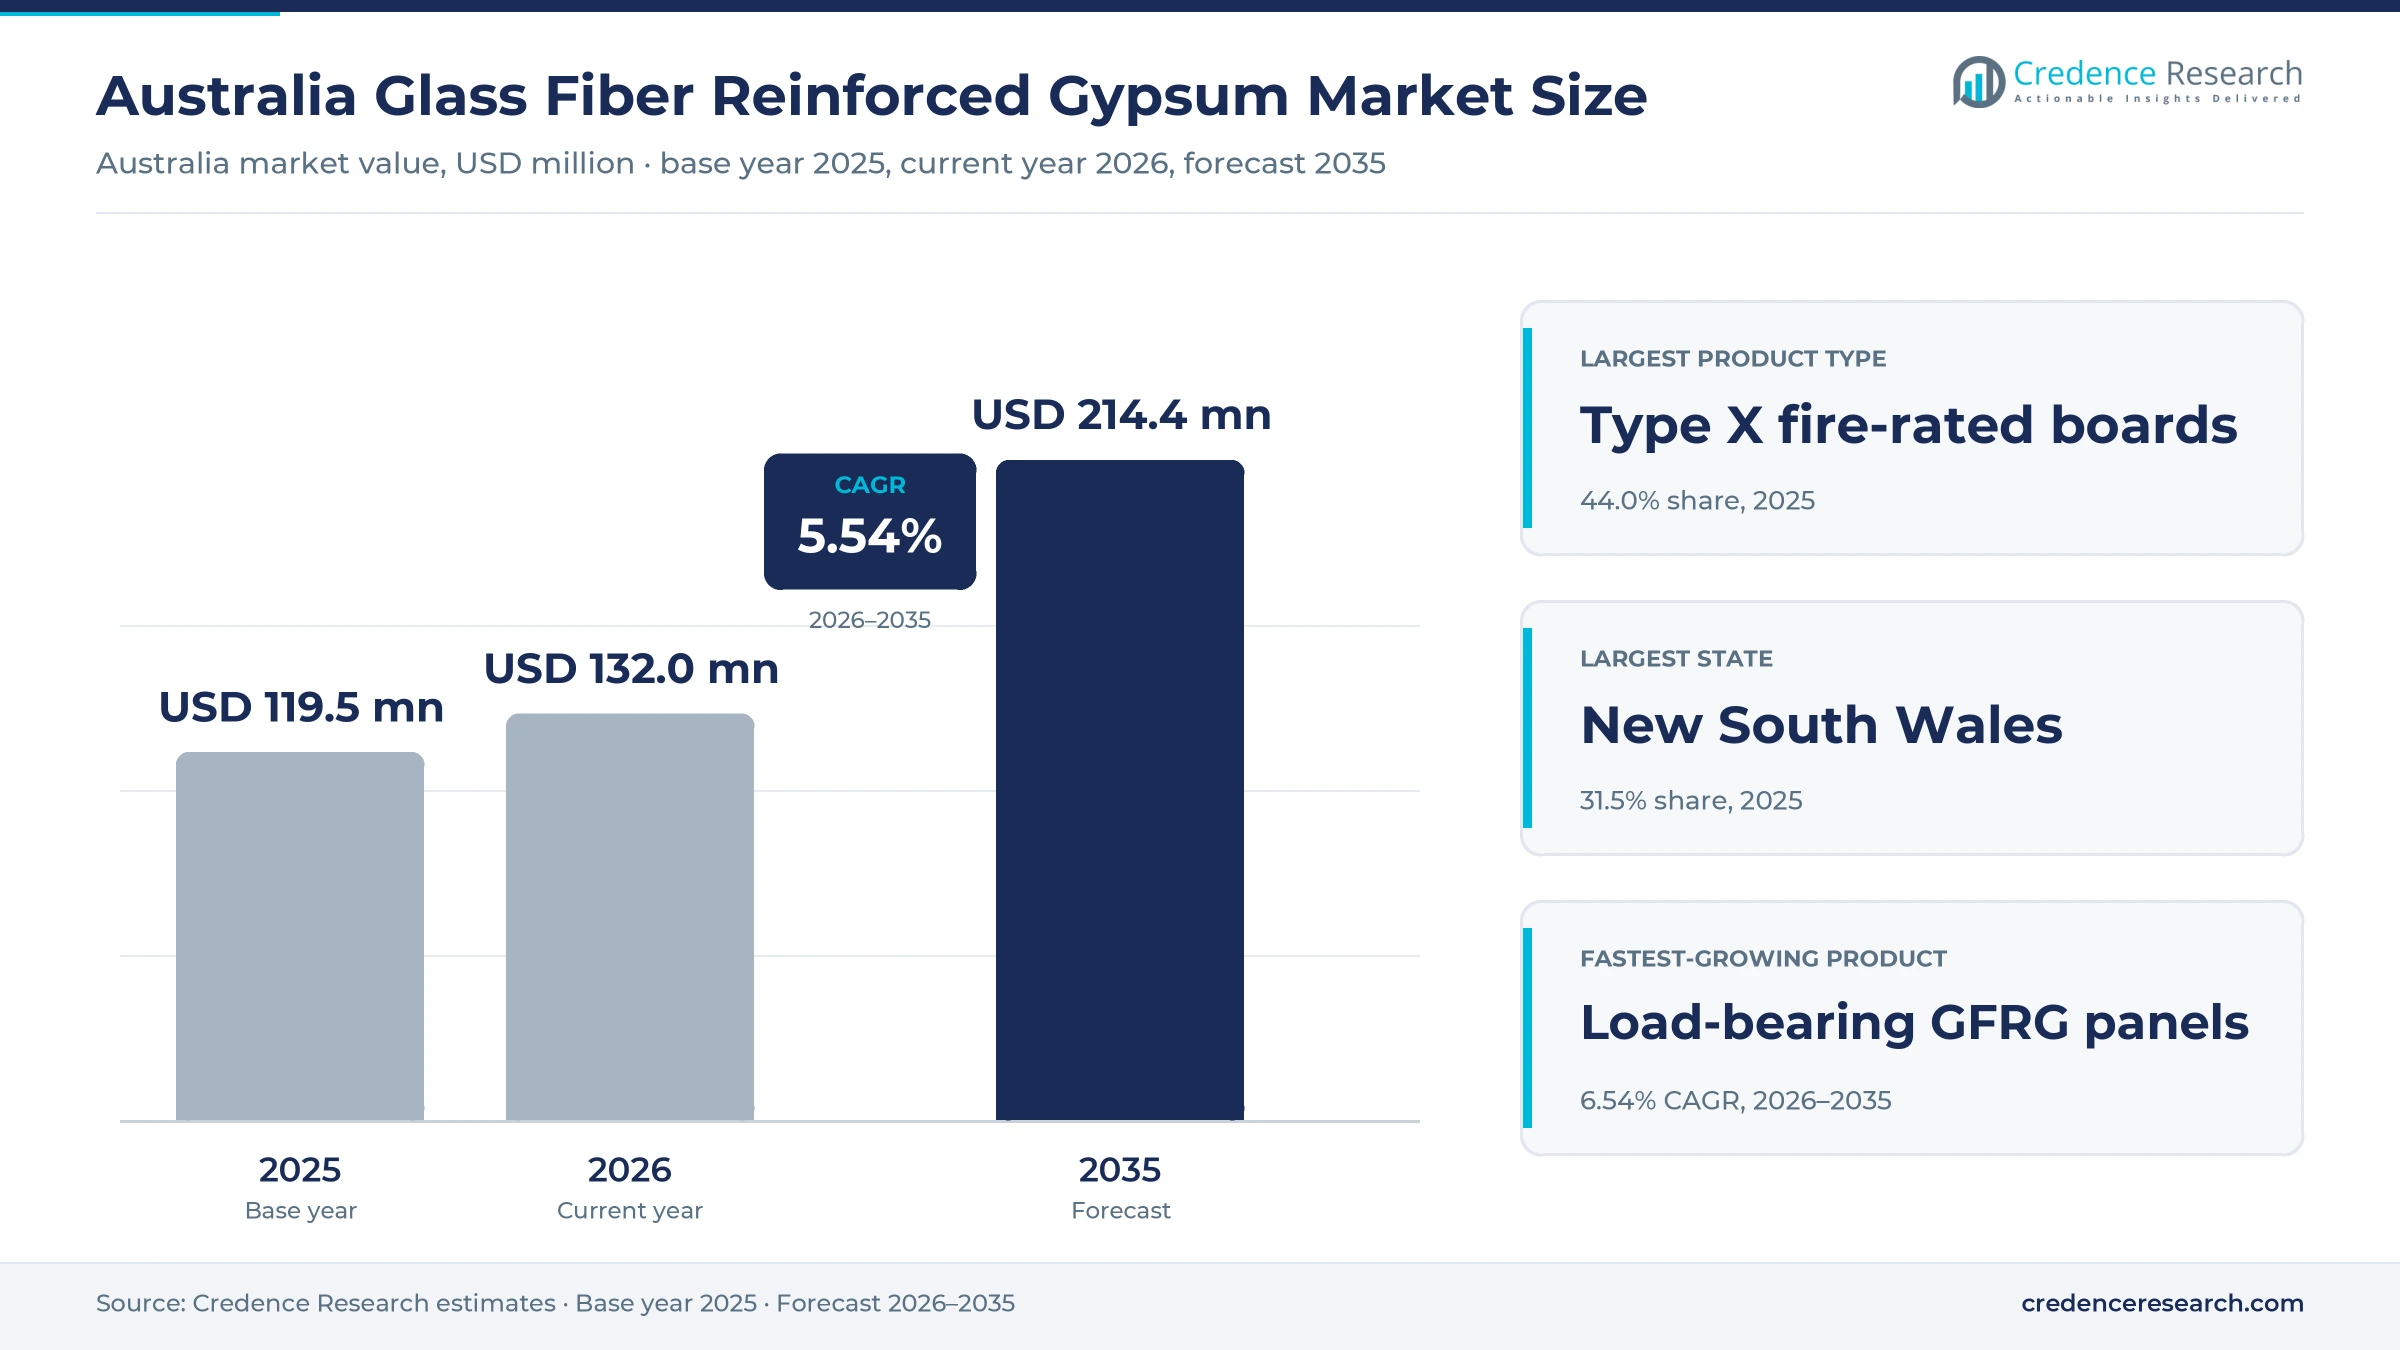
The Australia glass fiber reinforced gypsum market was valued at USD 119.5 million in 2025 and is projected to increase from USD 132.0 million in 2026 to USD 214.4 million by 2035, registering a CAGR of 5.54% during 2026–2035. Demand comes from builders, fit-out contractors and architects that need fire-rated linings for apartments, offices, hospitals and schools, plus shaped ceilings and wall features for hotels, theaters and retail centers. New South Wales held the largest state share, 31.5% in 2025, because Sydney concentrates apartment, office and public building work. Queensland is the fastest-growing state at 6.02% a year, as Brisbane adds housing and cultural venues. CSR Gyprock, Knauf and Siniat make fire-rated board at Australian plants, while specialist workshops cast bespoke architectural shapes for individual projects. In July 2026, Etex also announced A$44 million in upgrades at four Siniat plasterboard plants, which adds calcination and warehouse capacity for expected housing and commercial demand.
Which fiber-reinforced gypsum products does the estimate cover?
The estimate measures the value of gypsum boards and castings that use glass fiber in the core for strength and fire resistance, sold for installation in Australia. It covers type X and enhanced fire boards, architectural castings such as domes, column covers and acoustic reflectors, and hollow-core load-bearing wall panels. Values are stated at manufacturer and distributor selling prices, including imported products sold for local projects.
The estimate excludes standard plasterboard without glass fiber, fiber cement sheet, glass fiber reinforced concrete and installation labor. The value chain runs from gypsum supply and board plants or casting workshops through distributors and project suppliers to plastering contractors, builders and fit-out firms working in residential, commercial, healthcare, education and hospitality buildings.
Australia Glass Fiber Reinforced Gypsum Market Insights
- The Australia glass fiber reinforced gypsum market was valued at USD 119.5 million in 2025 and is projected to reach USD 214.4 million by 2035, registering a CAGR of 5.54% during 2026–2035.
- New South Wales held a 31.5% share of 2025 value, because Sydney concentrates apartment towers, offices and public buildings that need fire-rated linings.
- Type X fire-rated boards led with a 44.0% share of 2025 value, because separating walls, ceilings and shafts in multi-unit buildings must meet tested fire-resistance levels.
- Australia approved 205,249 dwellings in 2025-26, up 9.2% on the previous year, which lifts demand for fire-rated linings in apartments and townhouses.
- Etex announced A$44 million in upgrades at four Siniat plasterboard plants in July 2026, with delivery scheduled between the second quarter of 2027 and early 2028.
Type X boards lead while structural panels grow fastest
Why do type X fire-rated boards lead product demand?
Based on product type, the market is categorized into type X fire-rated boards, type C and enhanced fire boards, architectural GRG castings and load-bearing GFRG panels. Type X Fire-Rated Boards led with a 44.0% share of 2025 value, because separating walls and ceilings in apartments and offices use them in large volumes. Load-Bearing GFRG Panels grow fastest at 6.54% a year, as builders test hollow-core wall systems that shorten construction time.
How do fire-rated linings dominate application demand?
Based on application, the market is categorized into interior architecture, fire-rated linings, structural wall systems, qualified exterior applications and access panels and specialty castings. Fire-Rated Linings led with a 41.0% share of 2025 value, because every multi-unit building needs tested walls, ceilings and shaft linings. Structural Wall Systems grow fastest at 6.49% a year, as hollow-core panels gain trial use in low-rise housing.
Why are residential buildings the largest end use?
Based on end-use industry, the market is categorized into commercial offices and retail, hospitality and entertainment, residential buildings, healthcare and education, and industrial facilities. Residential Buildings led with a 33.0% share of 2025 value, because apartments and townhouses need fire-rated walls between dwellings. Hospitality and Entertainment grow fastest at 6.16% a year, as theaters, hotels and venues commission shaped ceilings and acoustic features.
How do direct project supply and distributors reach builders?
Based on sales channel, the market is categorized into direct project supply, specialist distribution and import project supply. Direct Project Supply led with a 48.0% share of 2025 value, because large builders buy board in bulk from local plants for each project. Import Project Supply grows fastest at 6.15% a year, as architects source bespoke castings and specialty panels from overseas workshops.
| Segment Group | Leading Sub-segment | Share, 2025 | Fastest-growing Sub-segment | CAGR, 2026–2035 |
|---|---|---|---|---|
| By Product Type | Type X Fire-Rated Boards | 44.0% | Load-Bearing GFRG Panels | 6.54% |
| By Application | Fire-Rated Linings | 41.0% | Structural Wall Systems | 6.49% |
| By End-Use Industry | Residential Buildings | 33.0% | Hospitality and Entertainment | 6.16% |
| By Sales Channel | Direct Project Supply | 48.0% | Import Project Supply | 6.15% |
Request a Free Sample
Fill in your details and we'll send you a free sample report.
- Sample data tables & charts
- Research methodology
Housing approvals and tested fire systems lift demand
How does housing pipeline conversion lift board demand?
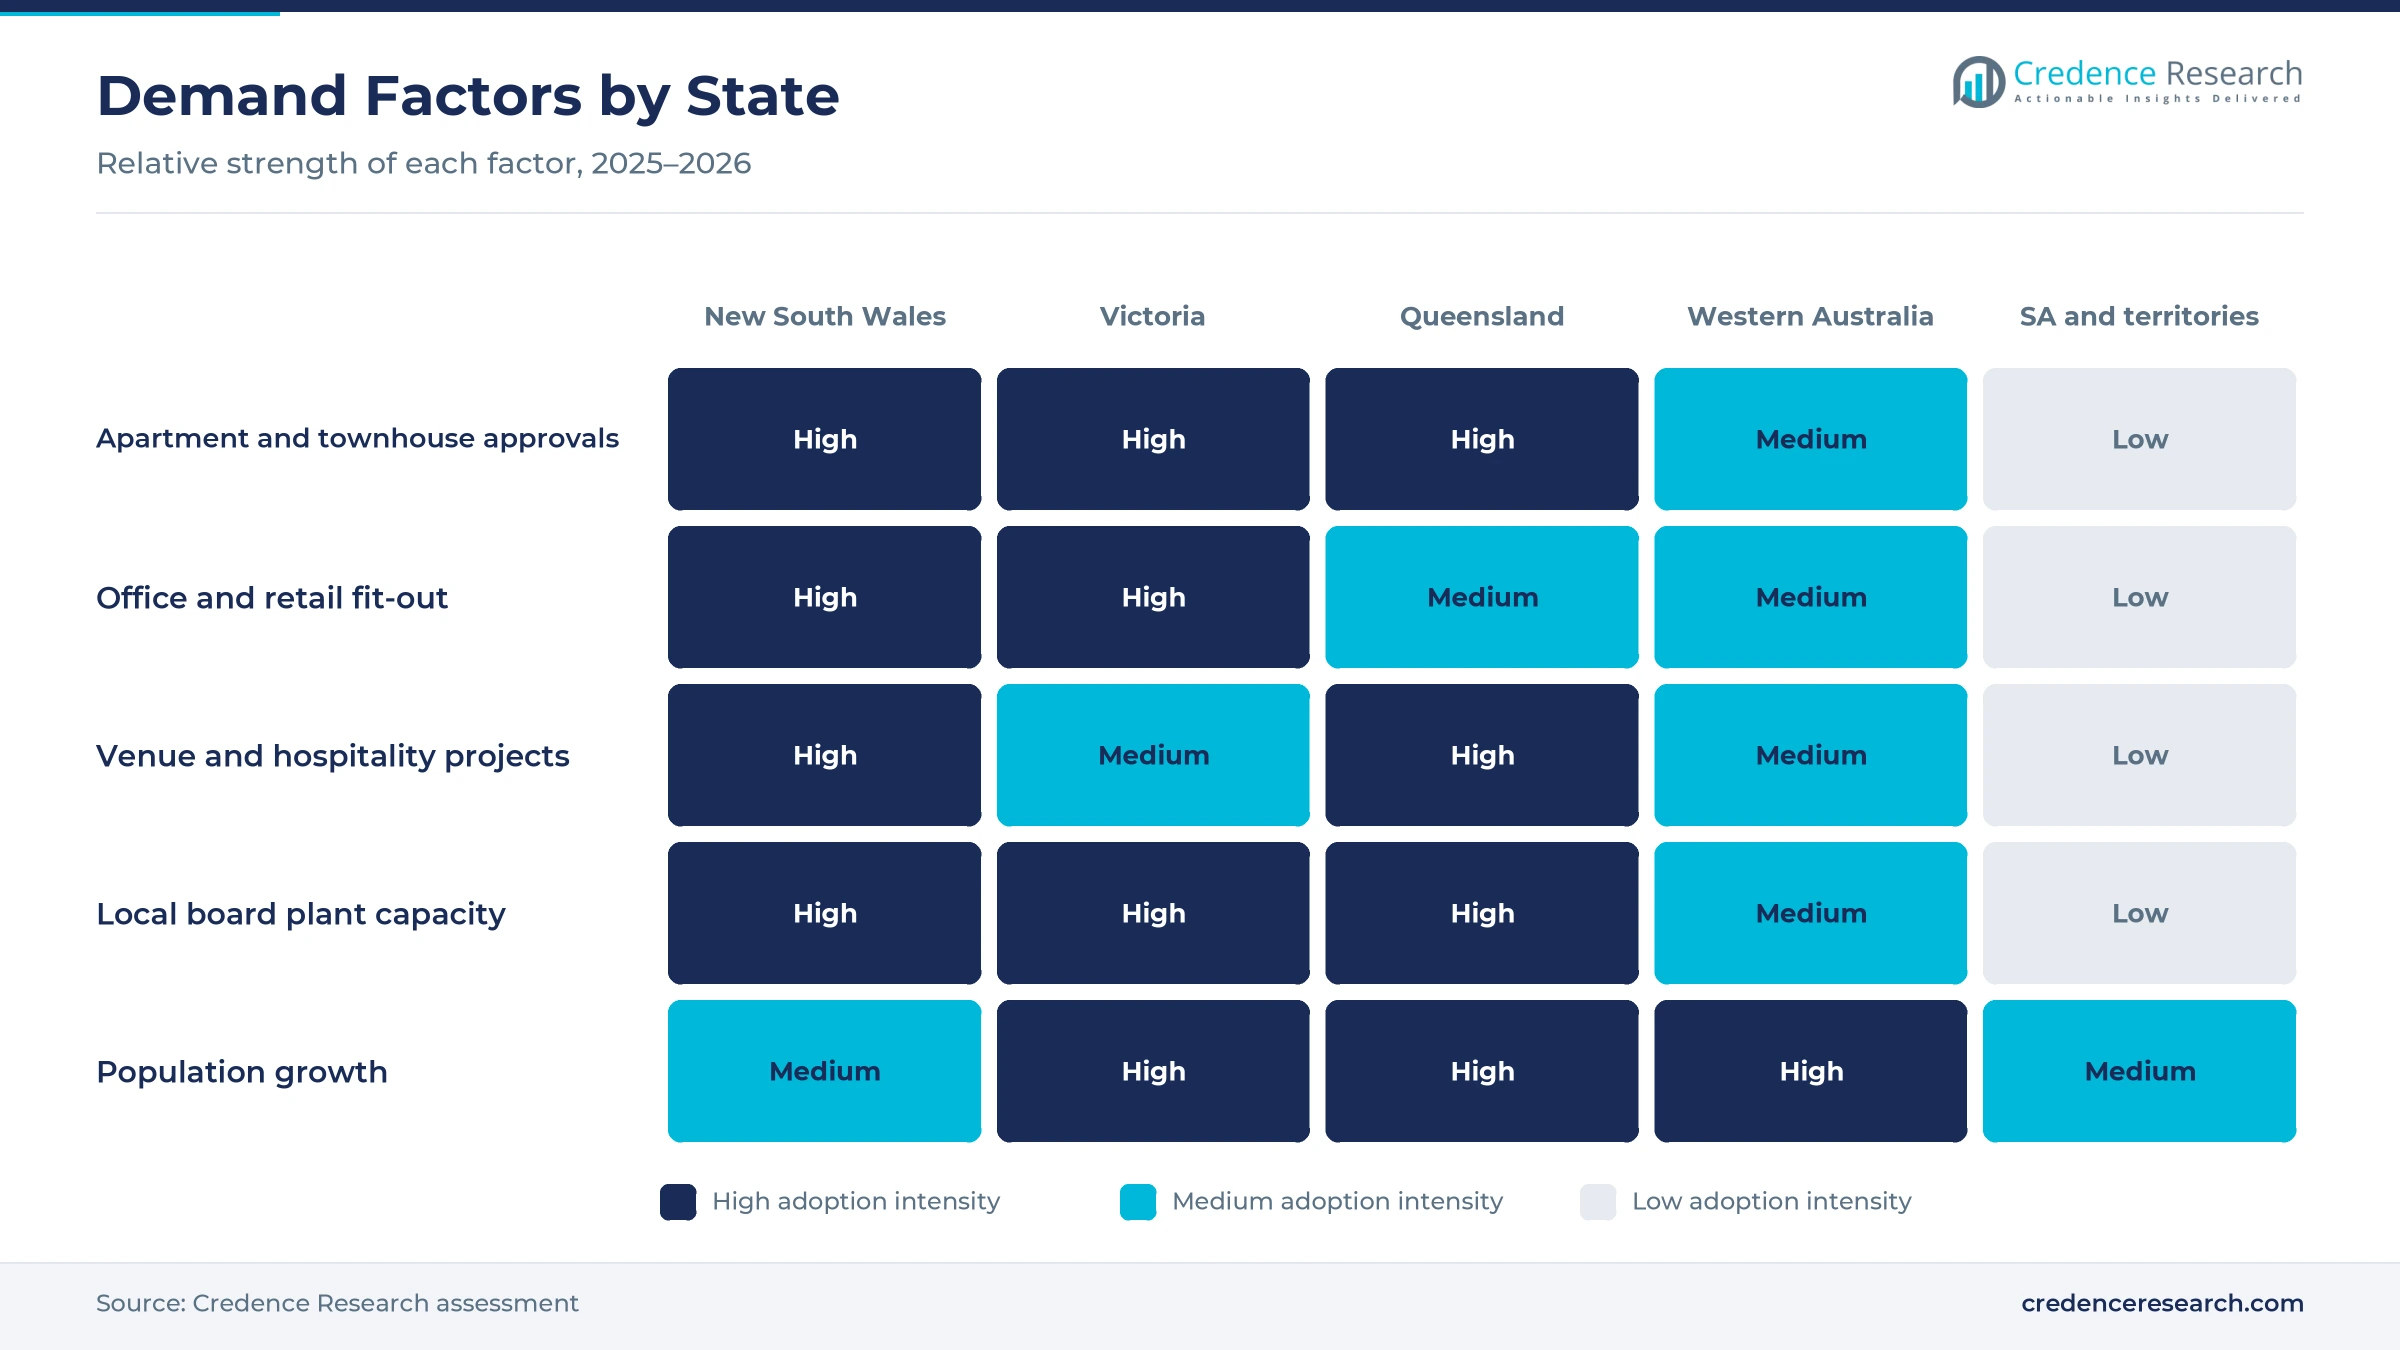
Housing pipeline conversion lifts demand, because every approved apartment and townhouse needs fire-rated linings in separating walls, ceilings and lift shafts. Australia approved 205,249 dwellings in 2025-26, up 9.2% from the previous year, according to the Australian Bureau of Statistics. Apartment approvals rose 13.2% to 48,778 over the same period, which matters because multi-unit buildings need tested fire separation between units. The National Housing Accord also targets 1.2 million new well-located homes over five years from July 1, 2024, according to the Treasury. That program includes a $3 billion New Home Bonus for states that exceed their share of the target. As a result, residential buildings hold a 33.0% share of 2025 value, the largest end use.
Why do tested fire-resistant assemblies drive specification?
Tested fire-resistant assemblies drive specification, because builders must prove that walls, ceilings and shafts reach the fire-resistance level that the building code sets for each element. Siniat states that its Fireshield board reaches fire-resistance levels of up to 240 minutes in its systems, with ratings assessed under AS 1530.4. CSR describes Gyprock Fyrchek as a fire and acoustic grade board with a glass fiber-reinforced core, used in fire walls, party walls, lift wells and plant rooms. The National Construction Code 2025 also reduces the scenarios in which concessions to fire-resistance levels apply, and states may adopt it from May 1, 2026. As a result, type X fire-rated boards hold a 44.0% share of 2025 value, the largest product share.
How does architectural design complexity favor cast shapes?
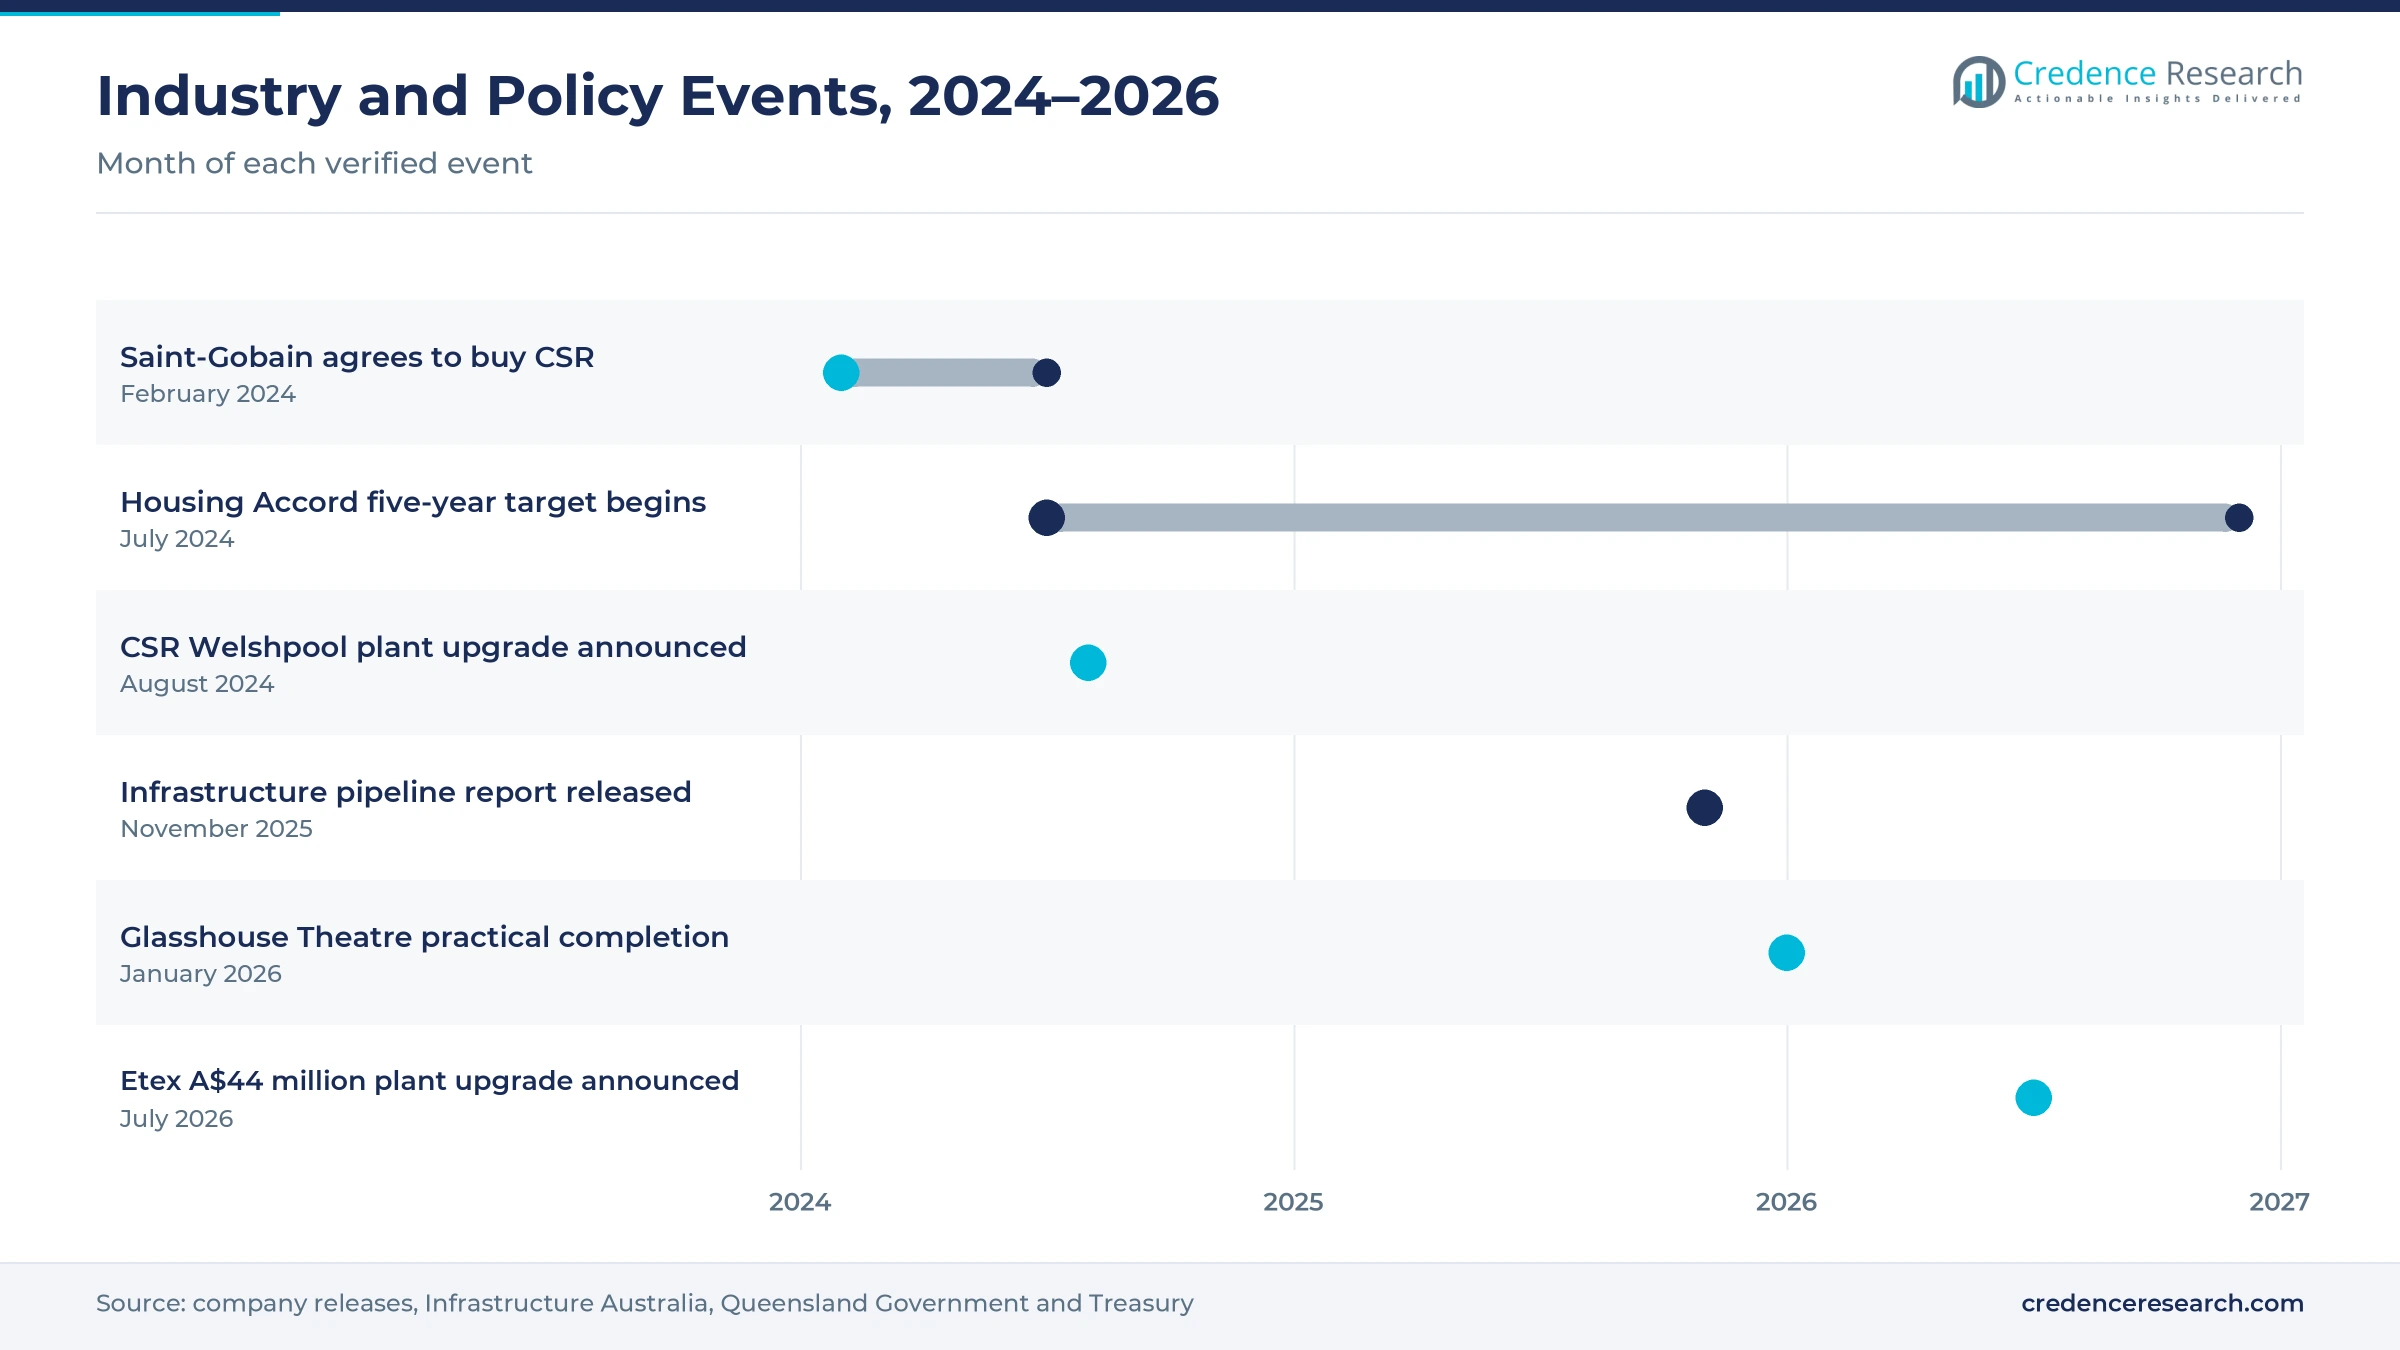
Architectural design complexity favors cast shapes, because curved ceilings, domes, column covers and acoustic reflectors are hard to form from flat board on site. The Glasshouse Theatre in Brisbane reached practical completion on Jan. 23, 2026, with 1,500 seats across two levels and curved walls and ceiling designed for good acoustics. Its $184 million budget shows how cultural venues invest in shaped interior surfaces that need precise and repeatable finishes. Formglas also serves Australian architects and contractors through an independent product representative who supplies samples, value engineering and budget quotations. In turn, hospitality and entertainment grow at 6.16% a year, the fastest end-use rate, as venues pair castings with acoustic ceiling tiles.
Why does public building investment support fire-rated linings?
Public building investment supports fire-rated linings, because hospitals, schools, social housing and transport stations all need tested wall and ceiling systems. Infrastructure Australia reported in November 2025 that the five-year major public infrastructure pipeline grew $29 billion to $242 billion. Building projects including social housing rose $6 billion to $77 billion within that pipeline, which adds interior lining work in every state. Gross fixed capital formation also reached about 24.3% of gross domestic product in 2025, according to World Bank data, up from about 24.1% a year earlier. In turn, fire-rated linings hold a 41.0% share of 2025 value, as public projects specify tested systems for wards, classrooms and stations.
Plant upgrades and new owners reshape board supply
How is the rise of plant upgrades changing local supply?
The rise of plant upgrades is changing local supply, because board makers expect demand to outgrow existing calcination and warehouse capacity. Etex announced in July 2026 an investment of A$44 million across four Siniat sites at Altona, Hazelmere, Bundaberg and Matraville. Delivery is scheduled between the second quarter of 2027 and early 2028, adding 14 jobs at Bundaberg and Hazelmere. Etex also expects Australian plasterboard volumes to grow more than 20% by 2032, driven by housing shortages and non-residential building. CSR announced an upgrade of its Welshpool board plant in Western Australia in August 2024 to increase capacity. As a result, direct project supply holds a 48.0% share of 2025 value, as builders buy from nearby plants.
Why is the shift to global ownership reshaping competition?
The shift to global ownership is reshaping competition, because all three Australian board makers now belong to international building materials groups. Saint-Gobain agreed in February 2024 to acquire CSR Limited, owner of the Gyprock brand, and completed the purchase in July 2024, after which CSR was delisted. Etex acquired Knauf's former Australian plasterboard business in 2021 and BGC's plasterboard and fiber cement businesses in 2024. USG Boral Building Products also became Knauf Gypsum after its acquisition by the Knauf Group, with plants at Port Melbourne, Camellia and Pinkenba. In turn, owners share global fire testing and product designs with local plants, which supports soundproof drywall materials and fire boards alike.
Can load-bearing hollow-core panels open a housing niche?
Load-bearing hollow-core panels open a housing niche, because large factory-made wall panels can cut on-site labor for low-rise homes. The glass fiber reinforced gypsum wall system was developed in Australia and adopted for large-scale construction from 1990, according to India's building materials promotion council. Standard panels measure 12 meters long, 3 meters high and 124 millimeters thick, with cavities that can be filled with reinforced concrete. The same source lists a fire rating of 140 minutes for structural adequacy, integrity and insulation, attributed to CSIRO testing. As a result, load-bearing GFRG panels grow at 6.54% a year, the fastest product rate, as builders seek faster building construction methods.
Is there room for premium acoustic and specialty systems?
Premium acoustic and specialty systems create room for suppliers, because offices, schools and venues want linings that combine fire ratings with sound control and design freedom. Knauf offers Stratopanel with Cleaneo technology, a perforated acoustic plasterboard for commercial spaces. CSR markets Fyrchek as both a fire and an acoustic grade board for party walls and multi-residential ceilings. The building code review also proposed in 2024 that fire tests for building materials be run by laboratories accredited to ISO/IEC 17025, which favors suppliers with tested systems. In turn, import project supply grows at 6.15% a year, the fastest channel rate, as architects source bespoke panels alongside fire-resistant glazing.
Labor gaps, moisture limits and imports test suppliers
How do skilled labor shortages slow lining work?
Skilled labor shortages slow lining work, because plasterers and fixers are needed across housing, commercial and public projects at the same time. Infrastructure Australia estimates the public pipeline is 141,000 workers short of its needs. As a result, builders face delays and higher installation costs that can defer fit-out stages. Suppliers respond with larger sheets, prefinished castings and system training that reduce the hours each installer spends on site.
Why does moisture sensitivity limit exterior use?
Moisture sensitivity limits exterior use, because gypsum loses strength when exposed to sustained water or humidity. Exterior castings therefore need qualified coatings, sheltered positions or alternative materials such as fiber cement. In turn, designers often choose other products for facades and wet zones. Casting suppliers respond with sealed finishes, tested exterior details and clear guidance on where gypsum products can and cannot be installed.
How do bespoke lead times and handling risks affect projects?
Bespoke lead times and handling risks affect projects, because architectural castings are made to order from molds and can crack during transport or installation. Late design changes force new molds and push back fit-out programs. As a result, some builders switch to flat board and framing to protect schedules. Casting workshops respond with digital mold making, protective crating and early involvement in design so that shapes are fixed before production.
Why does imported board create price pressure?
Imported board creates price pressure, because overseas plants can offer lower prices on standard fire-rated sheets during periods of weak demand at home. Local makers carry high energy, freight and calcination costs that importers may avoid. In turn, margins on commodity type X boards can narrow when builders tender on price alone. Local plants respond with tested system warranties, fast delivery from regional warehouses and technical support that importers find harder to match.
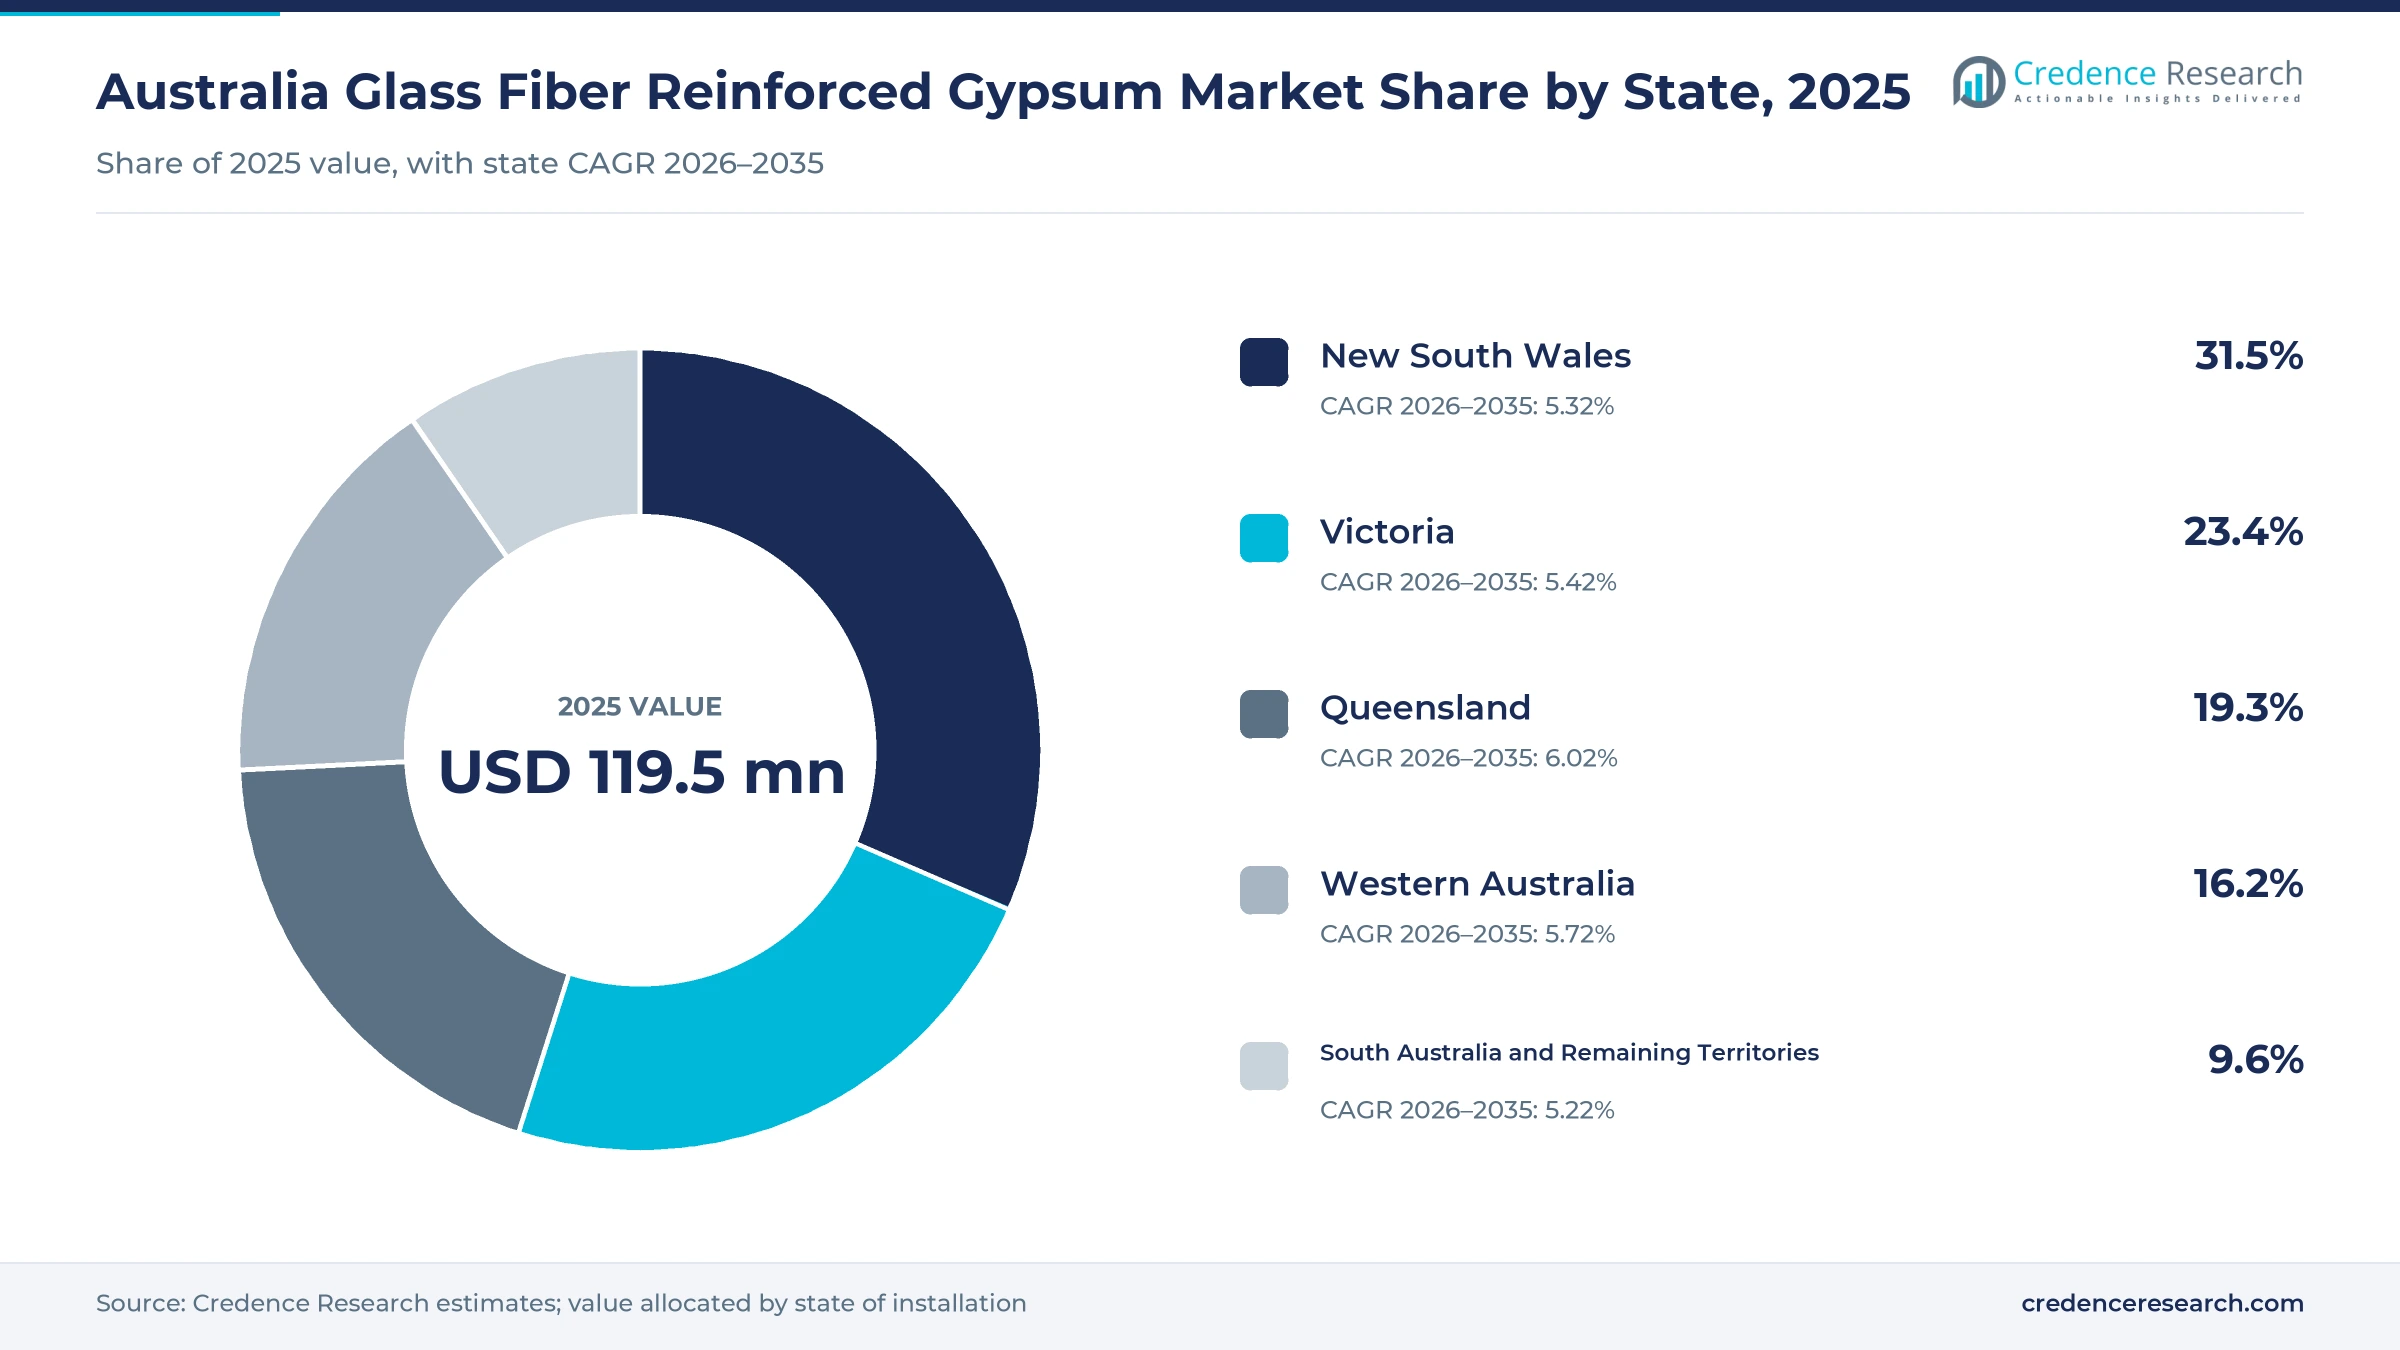
Sydney towers lead while Brisbane venues lift Queensland
| State | Value, 2025 (USD million) | Share, 2025 | CAGR, 2026–2035 |
|---|---|---|---|
| New South Wales | 37.6 | 31.5% | 5.32% |
| Victoria | 28.0 | 23.4% | 5.42% |
| Queensland | 23.1 | 19.3% | 6.02% |
| Western Australia | 19.4 | 16.2% | 5.72% |
| South Australia and Remaining Territories | 11.5 | 9.6% | 5.22% |
Why do Sydney apartment towers keep New South Wales ahead?
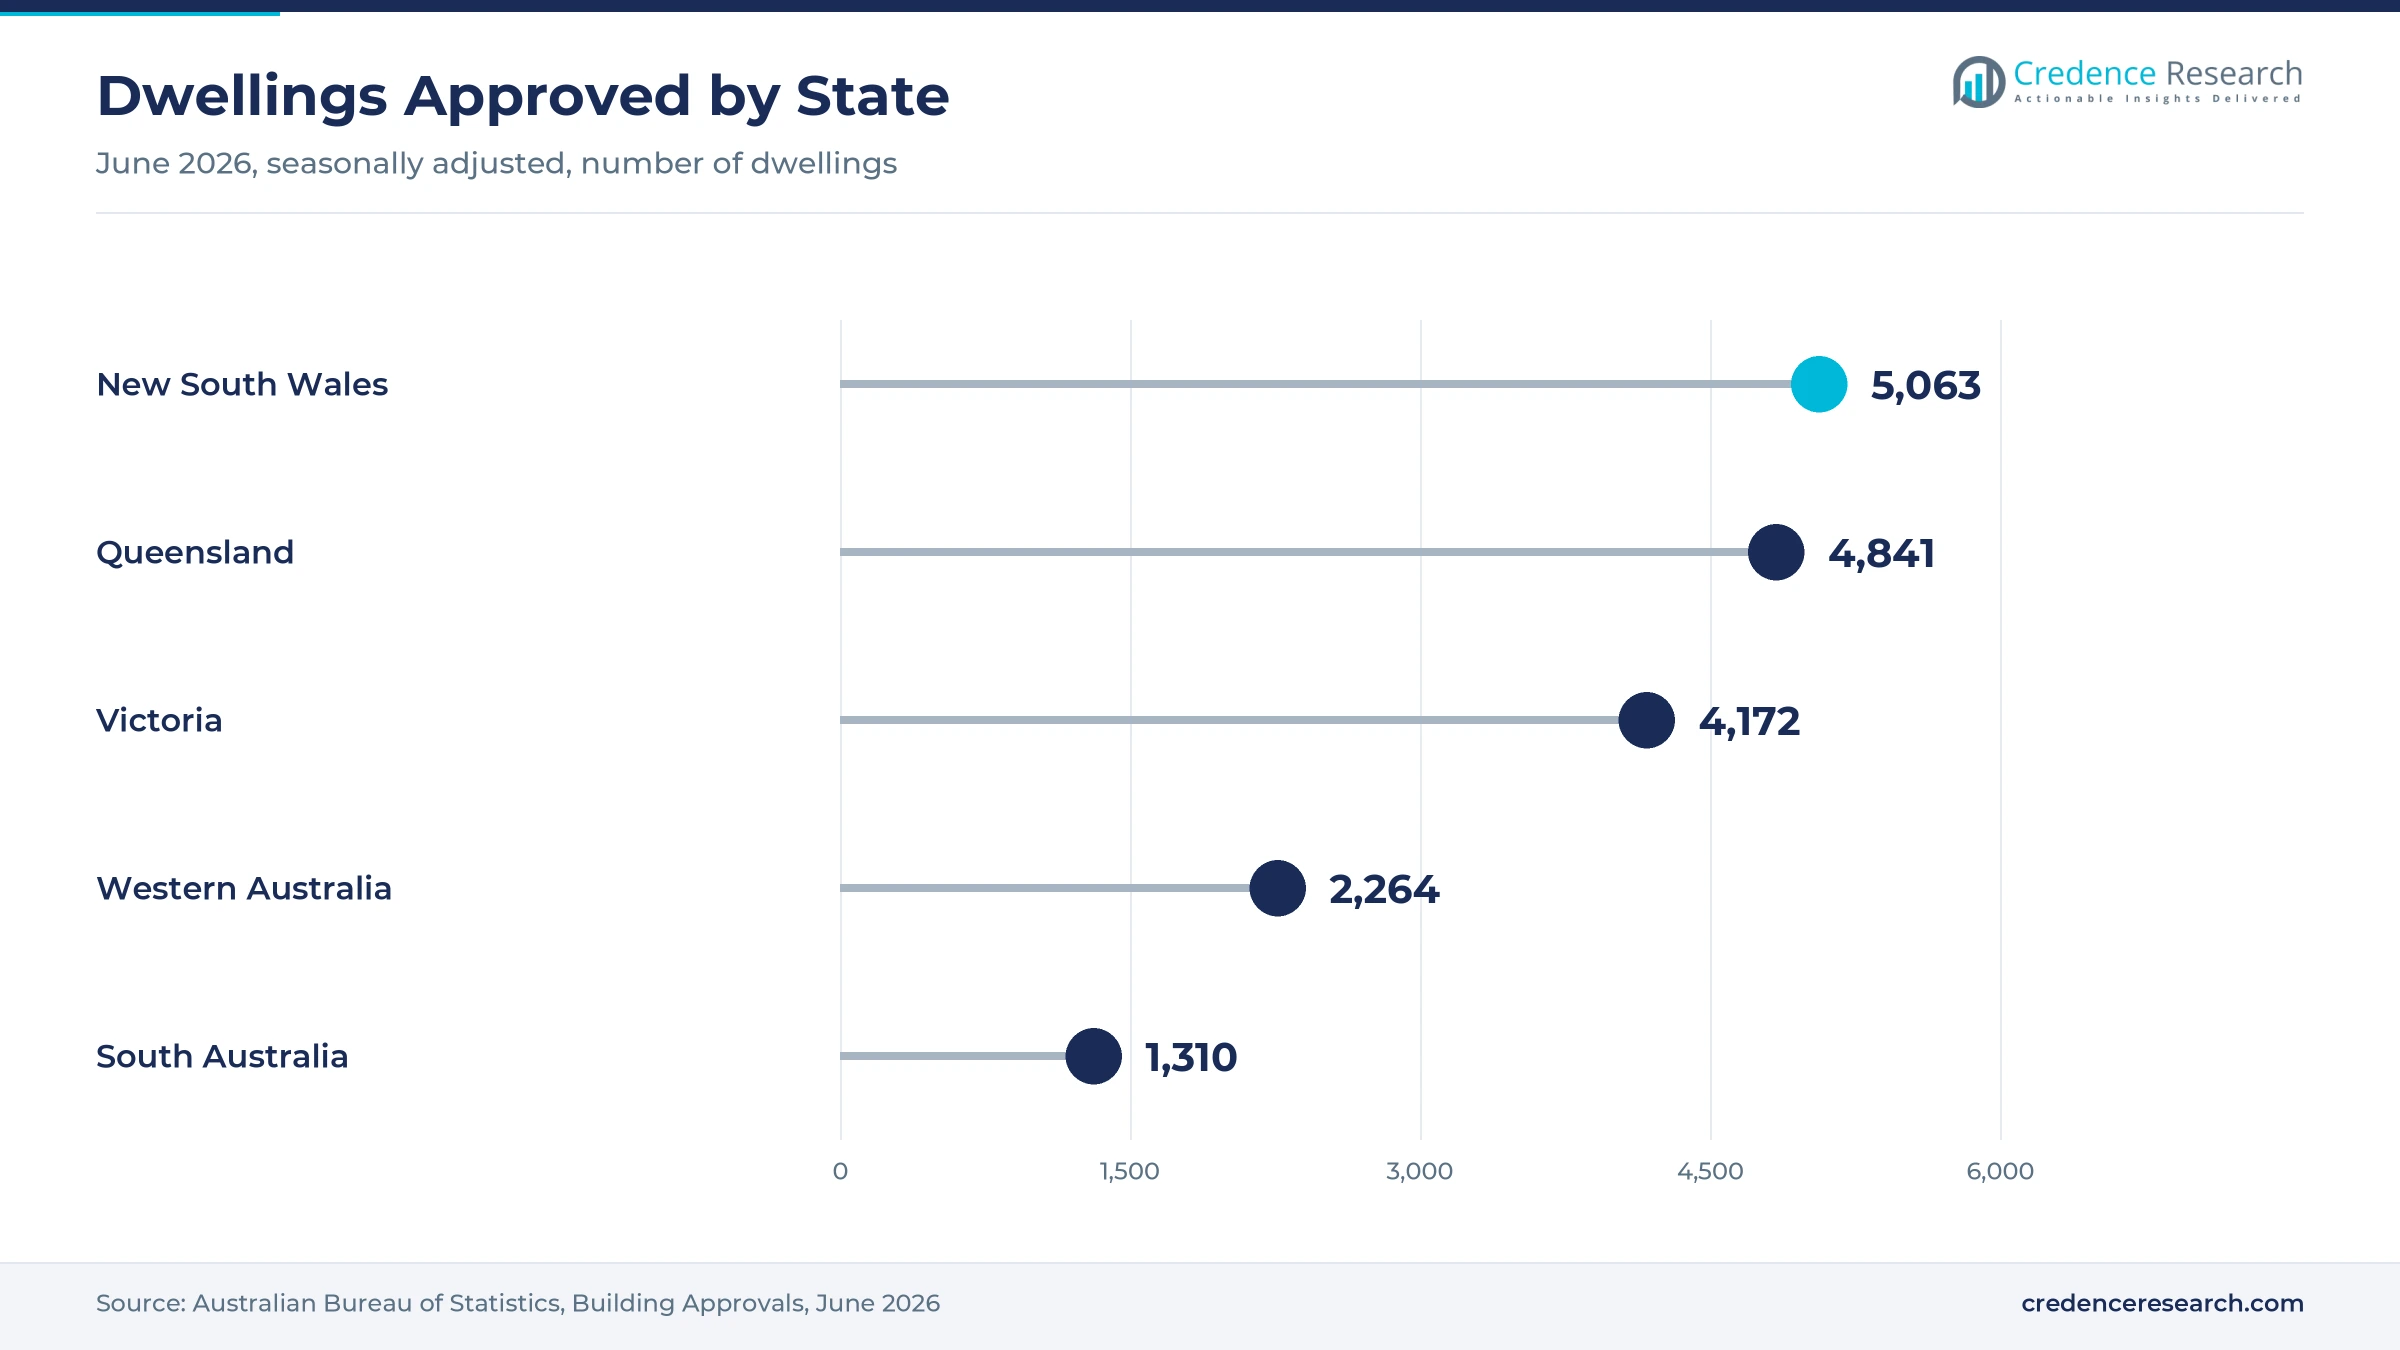
New South Wales held a 31.5% share of 2025 value and grows at 5.32% a year, because Sydney concentrates apartment towers, offices and hospitals that need fire-rated linings. The state approved 5,063 dwellings in June 2026, the highest monthly total among the states. Siniat makes board at Matraville and Knauf at Camellia, which keeps supply close to builders. However, population growth of 1.1% a year is slower than in Queensland and Western Australia.
How does Victoria support fire-rated lining demand?
Victoria held a 23.4% share of 2025 value and grows at 5.42% a year, because Melbourne builds many townhouses, apartments and commercial fit-outs. The state approved 4,172 dwellings in June 2026 and added about 109,500 residents in the year to March 2026. Siniat runs a plant at Altona that is receiving calcination and warehouse upgrades, while Knauf makes board at Port Melbourne for local builders.
Why is Queensland the fastest-growing state?
Queensland held a 19.3% share of 2025 value and grows fastest at 6.02% a year, because Brisbane and the coastal cities are adding housing, venues and public buildings. The state approved 4,841 dwellings in June 2026, close to the New South Wales total despite a smaller population. The Glasshouse Theatre adds a large cultural venue, while Knauf makes board at Pinkenba and Siniat at Bundaberg.
What drives demand in Western Australia?
Western Australia held a 16.2% share of 2025 value and grows at 5.72% a year, because Perth has the fastest state population growth at 2.1% a year. The state approved 2,264 dwellings in June 2026, which supports lining demand in new homes and apartments. CSR is upgrading its Welshpool board plant, and Siniat is adding calcination capacity at Hazelmere to serve the region.
How do South Australia and the territories contribute?
South Australia and the remaining territories held a 9.6% share of 2025 value and grow at 5.22% a year, because Adelaide, Canberra, Hobart and Darwin have smaller building programs. South Australia approved 1,310 dwellings in June 2026, and its population grew 1.0% over the year. Knauf serves the state from an office and distribution center at Woodville North.
Acquisitions, plant upgrades and venues marked 2024 to 2026
| Development | Status and market relevance |
|---|---|
| In February 2024, Saint-Gobain agreed to acquire CSR Limited, owner of the Gyprock board brand. | Completed in July 2024, after which CSR was delisted |
| In August 2024, CSR announced an upgrade of its Welshpool board plant in Western Australia. | Increases capacity and warehousing for Perth builders |
| In November 2025, Infrastructure Australia reported a five-year public pipeline of $242 billion. | Building projects including social housing reached $77 billion |
| In January 2026, the Glasshouse Theatre in Brisbane reached practical completion with 1,500 seats. | Shows demand for shaped walls and ceilings in cultural venues |
| In July 2026, Etex announced A$44 million in upgrades at four Siniat plasterboard plants. | Adds calcination and warehouse capacity from 2027 |
Board lines, mould casting and hollow panels shape supply
- Continuous board production lines mix calcined gypsum with glass fiber and additives and form it between paper liners, which yields type X and enhanced fire boards at scale.
- Mould-cast architectural fabrication sprays or lays gypsum and glass fiber into custom molds, which produces domes, column covers and acoustic reflectors for individual projects.
- Hollow-core structural panel casting forms large wall panels with internal cavities, which can be filled with reinforced concrete for load-bearing walls in low-rise buildings.
- Fire resistance testing to AS 1530.4 measures how long wall and ceiling systems keep structural adequacy, integrity and insulation, which lets suppliers publish tested fire-resistance levels.
Need a Custom Version of This Report?
Tailor the scope, geography, or segments to your exact requirements.
- Custom geography or segment scope
- Direct access to our analyst team
Three board makers and casting specialists compete
Competition is led by three board makers that own Australian plants and sell complete fire-rated wall and ceiling systems. CSR Gyprock, owned by Saint-Gobain since July 2024, sells Fyrchek fire and acoustic boards and is upgrading its Welshpool plant. Knauf Gypsum, formerly USG Boral, makes board at Port Melbourne, Camellia and Pinkenba. Siniat, part of Etex, runs plants at Altona, Hazelmere, Bundaberg and Matraville and sells Fireshield boards rated up to 240 minutes in its systems. Formglas serves Australian architects through an independent product representative for bespoke castings. Specialist casting workshops compete on design support, mold making and finish quality, while board makers compete on tested systems, delivery reach and technical service. ShapeShift Technologies is listed among suppliers, but its local activity could not be confirmed for this edition.
Companies profiled and their roles in this market
| Company | Type | Role in the market |
|---|---|---|
| CSR Gyprock | Board manufacturer | Sells Fyrchek fire and acoustic boards; owned by Saint-Gobain |
| Knauf Gypsum | Board manufacturer | Makes board at Port Melbourne, Camellia and Pinkenba |
| Siniat | Board manufacturer | Runs four plants and sells Fireshield boards |
| Formglas | Architectural casting supplier | Serves Australia through an independent product representative |
Credence Research view on Australian fire-rated linings
Credence Research's view is that Australian demand for glass fiber reinforced gypsum will grow steadily because apartments, public buildings and venues need tested fire-rated linings and shaped interiors. Type X boards remain the core of the market, while hollow-core panels and bespoke castings add faster growth from a smaller base. Rising dwelling approvals, a $242 billion public pipeline and new plant investment give demand a broad base. However, labor shortages, moisture limits and import price pressure will keep margins under strain. Suppliers with tested systems and nearby plants should gain share fastest.
How the Australian fire-rated lining estimate was built
The report uses 2025 as the base year on a calendar basis, and market values come from the Credence Research model. That model combines dwelling approval statistics, housing policy targets, population data, World Bank investment data, the public infrastructure pipeline and company information on plants, products and investments. Segment splits and state growth rates are Credence Research estimates, while state shares follow the client-defined split. Sources used are official statistics, government releases, trade press, product data sheets and company websites, and no interviews or surveys were used.
Apartments and public buildings carry demand to 2035
Sales of glass fiber reinforced gypsum products are expected to reach USD 214.4 million by 2035, a 5.54% CAGR during 2026–2035, as apartment building, public projects and venue fit-outs keep demand rising. Growth should stay steady through 2029 while the Housing Accord and public pipeline run at high levels. After that, hollow-core panels and bespoke castings will carry more growth as standard fire boards mature. Higher interest rates would lower this outlook, while faster apartment approvals would raise it. Suppliers with tested systems and upgraded plants are expected to gain the most.
Frequently Asked Questions
How big is the Australia glass fiber reinforced gypsum market?
Which product type leads the Australian market?
Which state leads the Australia glass fiber reinforced gypsum market?
Why do fire-rated linings lead application demand?
What drives demand for fiber-reinforced gypsum in Australia?
Which end use is growing fastest?
Who are the leading suppliers in Australia?
What are the main challenges for suppliers?
Table of Content
Chapter 1 Market Segmentation
- 1.1 Segmentation Framework
- 1.1.1 Product and Service Classification
- 1.1.2 Application and End-Use Classification
- 1.1.3 Technology and Solution Classification
- 1.1.4 Customer and Distribution Channel Classification
- 1.1.5 Geographic Segmentation
- 1.1.6 Market Segment Definitions and Boundaries
- 1.2 By Product Type
- 1.2.1 Type X Fire-Rated Boards
- 1.2.2 Type C and Enhanced Fire Boards
- 1.2.3 Architectural GRG Castings
- 1.2.4 Load-Bearing GFRG Panels
- 1.3 By Application
- 1.3.1 Interior Architecture
- 1.3.2 Fire-Rated Linings
- 1.3.3 Structural Wall Systems
- 1.3.4 Qualified Exterior Applications
- 1.3.5 Access Panels and Specialty Castings
- 1.4 By End-Use Industry
- 1.4.1 Commercial Offices and Retail
- 1.4.2 Hospitality and Entertainment
- 1.4.3 Residential Buildings
- 1.4.4 Healthcare and Education
- 1.4.5 Industrial Facilities
- 1.5 By Sales Channel
- 1.5.1 Direct Project Supply
- 1.5.2 Specialist Distribution
- 1.5.3 Import Project Supply
- 1.6 By State
- 1.6.1 New South Wales
- 1.6.2 Victoria
- 1.6.3 Queensland
- 1.6.4 Western Australia
- 1.6.5 South Australia and Remaining Territories
Chapter 2 Introduction
- 2.1 Report Objectives and Scope
- 2.2 Product Definition and Industry Terminology
- 2.3 Market Inclusions and Exclusions
- 2.4 Research Process
- 2.4.1 Primary Research and Expert Interviews
- 2.4.2 Secondary Research and Source Review
- 2.4.3 Top-Down and Bottom-Up Estimation
- 2.4.4 Data Triangulation and Verification
- 2.5 Market Size Measurement Basis
- 2.5.1 2025: USD 119.5 million → 2035: USD 214.4 million
- 2.6 Historical and Forecast Reference Periods
- 2.6.1 Historical Period: 2018-2025
- 2.6.2 Base Year: 2025
- 2.6.3 Forecast Period: 2025-2035
- 2.7 Research Assumptions and Limitations
Chapter 3 Executive Summary
- 3.1 Market Snapshot and Key Findings
- 3.2 Base-Year Market Size, 2025
- 3.3 Forecast Market Size, 2035
- 3.4 Revenue and Volume Growth Outlook
- 3.5 Key Demand and Supply Indicators
- 3.6 Leading Market Segments
- 3.7 Fastest-Growing Market Opportunities
- 3.8 Regional Performance Highlights
- 3.9 Technology and Industry Transformation
- 3.10 Competitive Landscape Summary
- 3.11 Analyst View and Strategic Implications
Chapter 4 Australia Glass Fiber Reinforced Gypsum Market Trends and Developments
- 4.1 Historical Industry Development, 2018-2025
- 4.2 Recent Market Trends and Developments
- 4.3 Demand and Customer Behavior Trends
- 4.4 Technology and Product Innovation
- 4.5 Artificial Intelligence, Automation and Digitalization
- 4.6 Local Manufacturing and Supply Chain Realignment
- 4.7 Industry Partnerships, Mergers and Acquisitions
- 4.8 Sustainability and Circular Economy Developments
- 4.9 Government and Private Sector Investment Trends
- 4.10 Emerging Business Models and Commercialization
- 4.11 Industry Developments and Announcements
Chapter 5 Australia Glass Fiber Reinforced Gypsum Market Production, Supply and Demand Analysis
- 5.1 Demand Trend and Consumption Analysis, 2018-2025
- 5.2 Demand Forecast, 2025-2035
- 5.3 Production and Output Trend, 2018-2025
- 5.4 Production and Output Forecast, 2025-2035
- 5.5 Installed Capacity and Capacity Utilization
- 5.6 Company-Wise Production Plants and Statistics
- 5.6.1 Installed Production Capacity
- 5.6.2 Actual Production
- 5.6.3 Planned Capacity and Expansion Targets
- 5.7 Supply Chain Structure and Procurement Trends
- 5.8 Supply-Demand Gap and Bottlenecks
- 5.9 Import Dependence and Sourcing Structure
- 5.10 Contract Manufacturing and Outsourcing
- 5.11 Regional Supply and Demand Concentration
Chapter 6 Australia Glass Fiber Reinforced Gypsum Market Pricing Analysis
- 6.1 Pricing Structure and Measurement
- 6.2 Historical Pricing Trends, 2018-2025
- 6.3 Pricing Outlook, 2025-2035
- 6.4 Average Selling Price and Unit Economics
- 6.5 Pricing by Product and Market Segment
- 6.6 Geographic Pricing Differences
- 6.7 Key Input, Energy, Labor and Logistics Costs
- 6.8 Contract Pricing and Purchasing Models
- 6.9 Pricing Sensitivity and Competitive Positioning
- 6.10 Price, Margin and Profitability Implications
Chapter 7 Australia Glass Fiber Reinforced Gypsum Market Dynamics
- 7.1 Market Growth Drivers
- 7.1.1 Demand-Side Drivers
- 7.1.2 Technology and Innovation Drivers
- 7.1.3 Infrastructure and Investment Drivers
- 7.1.4 Regulatory and Policy Drivers
- 7.2 Market Restraints
- 7.2.1 Cost and Affordability Constraints
- 7.2.2 Technology and Adoption Barriers
- 7.2.3 Supply Chain and Operational Constraints
- 7.3 Market Challenges
- 7.3.1 Competitive Pressure and Margin Erosion
- 7.3.2 Skills, Infrastructure and Implementation Gaps
- 7.4 Emerging Market Opportunities
- 7.5 Market Dynamics Impact and Time-Horizon Assessment
Chapter 8 Australia Glass Fiber Reinforced Gypsum Value Chain Analysis
- 8.1 Industry Value Chain Overview
- 8.2 Upstream Suppliers and Critical Inputs
- 8.3 Technology and Component Providers
- 8.4 Manufacturing or Service Delivery
- 8.5 Distribution, Channel Partners and Integrators
- 8.6 Downstream Applications and End Users
- 8.7 Value Addition and Profit Pools
- 8.8 Vertical Integration and Outsourcing
- 8.9 Supplier Concentration and Risk
- 8.10 Supply Chain Localization and Resilience
Chapter 9 Australia Glass Fiber Reinforced Gypsum Market Regulations and Policies
- 9.1 Relevant Laws, Standards and Compliance Frameworks
- 9.2 Product, Service, Safety and Quality Requirements
- 9.3 Government Policies, Incentives and Subsidies
- 9.4 Imports, Exports and Trade Barriers
- 9.5 Public Procurement and Local Content Requirements
- 9.6 Environmental and Sustainability Compliance
- 9.7 Upcoming Policy Changes and Market Implications
Chapter 10 Australia Glass Fiber Reinforced Gypsum Market Hotspots and Opportunities
- 10.1 Market Opportunity Mapping and Growth Hotspots
- 10.2 High-Growth Applications and Customer Groups
- 10.3 Underserved Markets and White-Space Opportunities
- 10.4 Emerging Technology and Product Opportunities
- 10.5 New Capacity and Investment Hotspots
- 10.6 Market Entry and Expansion Opportunities
- 10.7 Distribution and Partnership Opportunities
- 10.8 Near-Term and Long-Term Commercial Potential
- 10.9 Opportunity Attractiveness and Execution Risks
Chapter 11 Australia Glass Fiber Reinforced Gypsum Market Outlook, 2025-2035
- 11.1 Market Size and Analysis
- 11.1.1 Revenue (Market Measurement: 2025: USD 119.5 million → 2035: USD 214.4 million)
- 11.1.2 Market Volume and Quantity Sold
- 11.1.3 Historical Market Size, 2018-2025
- 11.1.4 Base-Year Market Size, 2025
- 11.2 Market Forecast, 2025-2035
- 11.2.1 Revenue Forecast to 2035
- 11.2.2 Volume Forecast to 2035
- 11.2.3 CAGR and Year-on-Year Growth
- 11.2.4 Incremental Revenue Opportunity
- 11.3 Forecast Assumptions and Scenario Analysis
- 11.3.1 Base-Case Forecast
- 11.3.2 Optimistic and Conservative Scenarios
- 11.3.3 Technology, Pricing and Policy Sensitivities
- 11.4 Market Attractiveness and Growth Outlook
Chapter 12 Australia Glass Fiber Reinforced Gypsum Market Segmentation and Outlook
- 12.1 Segmentation Summary and Market Shares, 2025
- 12.2 Largest and Fastest-Growing Segments
- 12.3 By Product Type - Market Size and Forecast, 2025-2035
- 12.3.1 Segment Definition and Scope
- 12.3.2 Historical Market Size, 2018-2025
- 12.3.3 Revenue Forecast, 2025-2035
- 12.3.4 Volume Forecast, 2025-2035
- 12.3.5 Base-Year Market Share, 2025
- 12.3.6 Segment CAGR and Growth Drivers
- 12.3.7 Subsegment Market Size and Forecast
- 12.3.7.1 Type X Fire-Rated Boards
- 12.3.7.2 Type C and Enhanced Fire Boards
- 12.3.7.3 Architectural GRG Castings
- 12.3.7.4 Load-Bearing GFRG Panels
- 12.3.8 Subsegment Pricing and Adoption Trends
- 12.3.9 Leading Suppliers and Competition
- 12.3.10 Regional Demand and Opportunities
- 12.4 By Application - Market Size and Forecast, 2025-2035
- 12.4.1 Segment Definition and Scope
- 12.4.2 Historical Market Size, 2018-2025
- 12.4.3 Revenue Forecast, 2025-2035
- 12.4.4 Volume Forecast, 2025-2035
- 12.4.5 Base-Year Market Share, 2025
- 12.4.6 Segment CAGR and Growth Drivers
- 12.4.7 Subsegment Market Size and Forecast
- 12.4.7.1 Interior Architecture
- 12.4.7.2 Fire-Rated Linings
- 12.4.7.3 Structural Wall Systems
- 12.4.7.4 Qualified Exterior Applications
- 12.4.7.5 Access Panels and Specialty Castings
- 12.4.8 Subsegment Pricing and Adoption Trends
- 12.4.9 Leading Suppliers and Competition
- 12.4.10 Regional Demand and Opportunities
- 12.5 By End-Use Industry - Market Size and Forecast, 2025-2035
- 12.5.1 Segment Definition and Scope
- 12.5.2 Historical Market Size, 2018-2025
- 12.5.3 Revenue Forecast, 2025-2035
- 12.5.4 Volume Forecast, 2025-2035
- 12.5.5 Base-Year Market Share, 2025
- 12.5.6 Segment CAGR and Growth Drivers
- 12.5.7 Subsegment Market Size and Forecast
- 12.5.7.1 Commercial Offices and Retail
- 12.5.7.2 Hospitality and Entertainment
- 12.5.7.3 Residential Buildings
- 12.5.7.4 Healthcare and Education
- 12.5.7.5 Industrial Facilities
- 12.5.8 Subsegment Pricing and Adoption Trends
- 12.5.9 Leading Suppliers and Competition
- 12.5.10 Regional Demand and Opportunities
- 12.6 By Sales Channel - Market Size and Forecast, 2025-2035
- 12.6.1 Segment Definition and Scope
- 12.6.2 Historical Market Size, 2018-2025
- 12.6.3 Revenue Forecast, 2025-2035
- 12.6.4 Volume Forecast, 2025-2035
- 12.6.5 Base-Year Market Share, 2025
- 12.6.6 Segment CAGR and Growth Drivers
- 12.6.7 Subsegment Market Size and Forecast
- 12.6.7.1 Direct Project Supply
- 12.6.7.2 Specialist Distribution
- 12.6.7.3 Import Project Supply
- 12.6.8 Subsegment Pricing and Adoption Trends
- 12.6.9 Leading Suppliers and Competition
- 12.6.10 Regional Demand and Opportunities
- 12.7 By State - Market Size and Forecast, 2025-2035
- 12.7.1 Segment Definition and Scope
- 12.7.2 Historical Market Size, 2018-2025
- 12.7.3 Revenue Forecast, 2025-2035
- 12.7.4 Volume Forecast, 2025-2035
- 12.7.5 Base-Year Market Share, 2025
- 12.7.6 Segment CAGR and Growth Drivers
- 12.7.7 Subsegment Market Size and Forecast
- 12.7.7.1 New South Wales
- 12.7.7.2 Victoria
- 12.7.7.3 Queensland
- 12.7.7.4 Western Australia
- 12.7.7.5 South Australia and Remaining Territories
- 12.7.8 Subsegment Pricing and Adoption Trends
- 12.7.9 Leading Suppliers and Competition
- 12.7.10 Regional Demand and Opportunities
- 12.8 Segment Growth Comparison
- 12.9 Segment Attractiveness and Priority Matrix
Chapter 13 Australia Glass Fiber Reinforced Gypsum End-Use and Application Market Outlook
- 13.1 End-Use Industry and Customer Demand Structure
- 13.2 Leading Applications and Customer Groups
- 13.3 End-Use Market Size, Share and Forecast
- 13.4 Major End-Use Industry Deep Dives
- 13.4.1 Customer Requirements and Use Cases
- 13.4.2 Demand and Replacement Cycles
- 13.4.3 Technical and Regulatory Considerations
- 13.4.4 Purchasing and Procurement Models
- 13.4.5 Leading Vendors and Distribution Channels
- 13.4.6 Forecast and Commercial Opportunities
- 13.5 Emerging Applications and Cross-Segment Demand
- 13.6 End-Use Industry Investment Priorities
Chapter 14 Australia Glass Fiber Reinforced Gypsum Geographic Market Outlook, 2025-2035
- 14.1 Domestic Market Distribution and Demand Clusters
- 14.2 State- or Province-Wise Market Size and Forecast, 2025-2035
- 14.3 City and Metropolitan Market Outlook
- 14.4 Industrial, Manufacturing and Commercial Clusters
- 14.5 Geographic Concentration of Key End Users
- 14.6 Local Pricing and Purchasing Differences
- 14.7 Domestic Production Facilities and Capacity Map
- 14.8 Local Infrastructure and Project Pipeline
- 14.9 State-Level Policy and Incentive Differences
- 14.10 Subnational Investment Hotspots and Opportunities
- 14.11 Distribution and Logistics Networks
- 14.12 Domestic Competitive Footprint
Chapter 15 Australia Glass Fiber Reinforced Gypsum Technology, Innovation and Sustainability Outlook
- 15.1 Technology Landscape and Maturity
- 15.2 Product, Process and Service Innovation
- 15.3 AI, Automation and Digital Tools in the Industry
- 15.4 Technology Adoption and Performance Benchmarking
- 15.5 Innovation Pipeline and R&D Investment
- 15.6 Patent and Intellectual Property Trends
- 15.7 Energy Efficiency and Resource Management
- 15.8 Sustainability, Recycling and Circularity
- 15.9 Technology Roadmap, 2025-2035
- 15.10 Risks of Obsolescence and Technology Substitution
Chapter 16 Australia Glass Fiber Reinforced Gypsum Market Key Strategic Imperatives
- 16.1 Growth and Market Entry Priorities
- 16.2 High-Return Products and Segments
- 16.3 Pricing, Profitability and Cost Optimization
- 16.4 Technology Investment and Product Differentiation
- 16.5 Supply Chain Localization and Resilience
- 16.6 Distribution and Customer Acquisition
- 16.7 Partnership, Acquisition and Capacity Strategy
- 16.8 Regional Expansion Priorities
- 16.9 Short-, Medium- and Long-Term Actions
Chapter 17 Competition Outlook
- 17.1 Industry Competition Characteristics
- 17.2 Market Structure and Concentration
- 17.3 Market Share and Competitive Positioning, 2025
- 17.4 Company-Wise Revenue and Product Benchmarking
- 17.5 Production and Service Capacity Benchmarking
- 17.6 Technology, Pricing and Differentiation
- 17.7 Regional Footprint and Distribution Strength
- 17.8 Mergers, Acquisitions and Strategic Alliances
- 17.9 New Entrants and Competitive Threats
- 17.10 Porter's Five Forces and Industry Attractiveness
- 17.11 Competitive Outlook, 2025-2035
Chapter 18 Company Profiles
- 18.1 Company Coverage and Selection Criteria
- 18.2 CSR Gyprock
- 18.2.1 Business Description
- 18.2.2 Company Ownership and Geographic Presence
- 18.2.3 Product and Service Portfolio
- 18.2.4 Manufacturing and Operating Footprint
- 18.2.5 Production Capacity and Expansion Plans
- 18.2.6 Financial Performance and Investment
- 18.2.7 Market Share and Competitive Position
- 18.2.8 Technology and Innovation Capabilities
- 18.2.9 Strategic Alliances or Partnerships
- 18.2.10 Recent Developments
- 18.2.11 Growth Strategy and Outlook
- 18.3 Knauf Gypsum
- 18.4 Siniat
- 18.5 Formglas
- 18.6 ShapeShift Technologies
- 18.7 Other Relevant Market Participants
Note: Every listed company is profiled on the structure shown under the first company. The company list is preliminary and may change based on research findings, market developments, data availability and client requirements.
Chapter 19 Disclaimer
- 19.1 Research and Forecast Disclaimer
- 19.2 Data Source and Estimation Limitations
Note: The depth of individual sections depends on data availability for this market. Volume, capacity, trade and other unit-based metrics are included where applicable.

