
National machines and rented GPUs shape regional demand
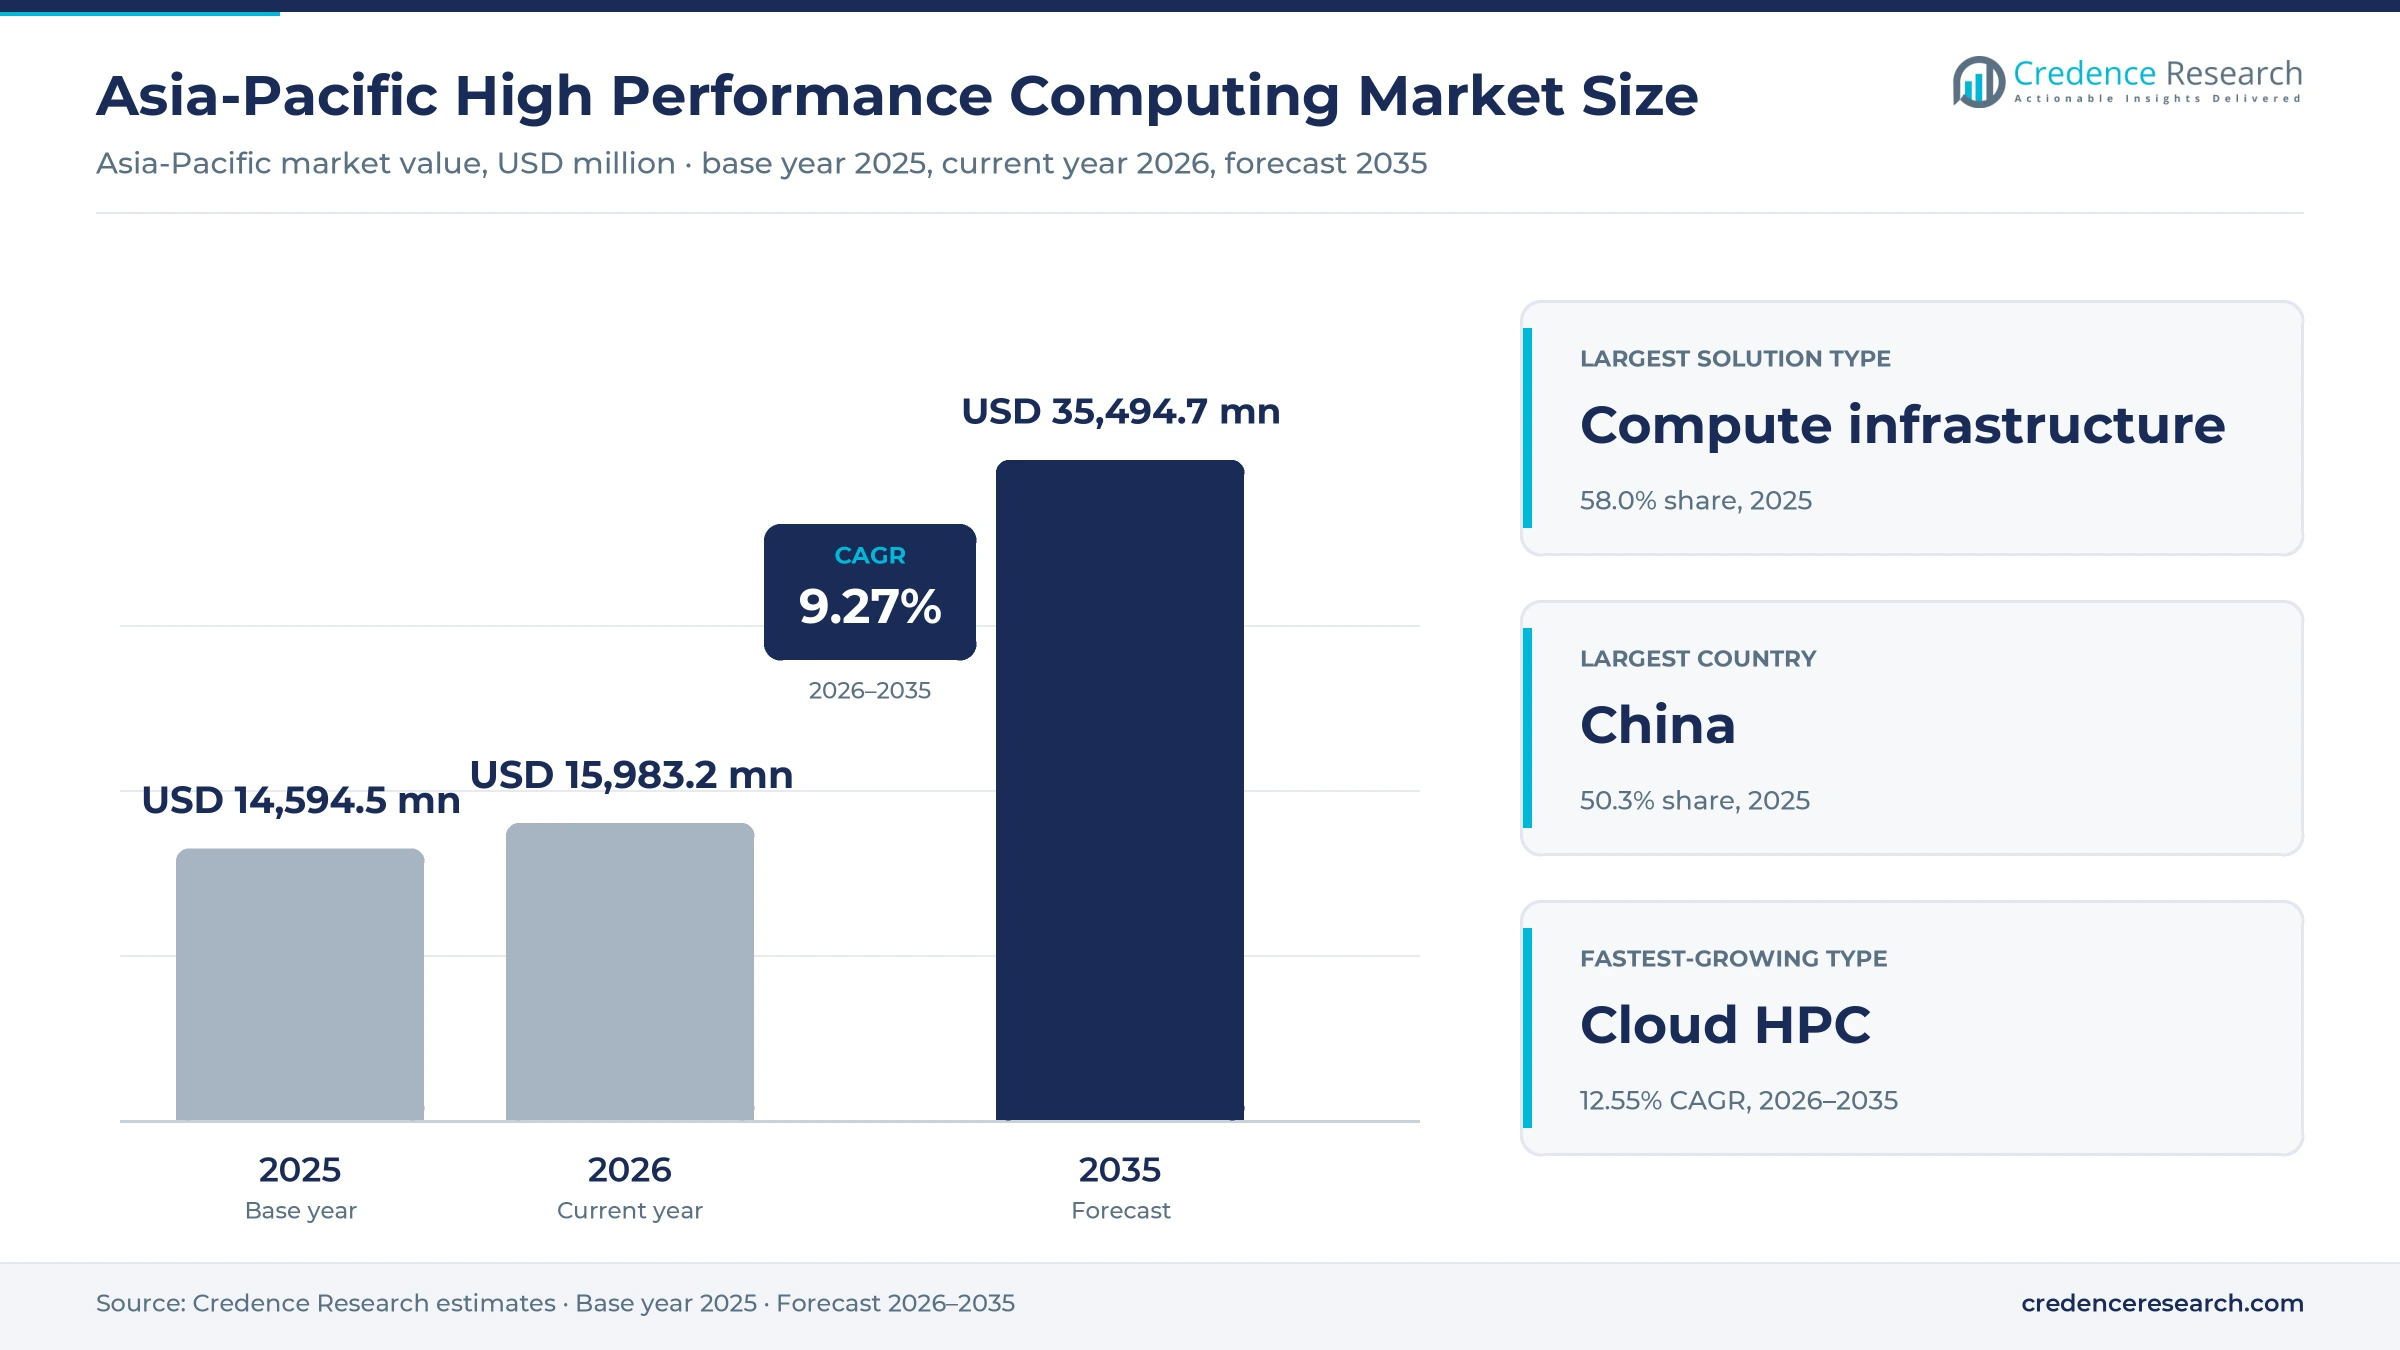
The Asia-Pacific high performance computing market was valued at USD 14.59 billion in 2025 and is projected to increase from USD 15.98 billion in 2026 to USD 35.49 billion by 2035, registering a CAGR of 9.27% during 2026–2035. Demand comes from national research programs, AI model training, semiconductor design and cloud operators that rent specialist capacity. China held the largest share, 50.3% in 2025, supported by state computing networks and domestic processors. India is the fastest-growing country group at 11.95% a year as public GPU pools open to startups and universities. The balance of supply also changed in June 2026, when a China-based system took first place on the TOP500 ranking for the first time since 2017. Japan, South Korea, Singapore and Taiwan are funding successor machines, so public tenders remain a large part of hardware spending. Rented access is growing faster, because smaller buyers can now reach accelerators without building their own facilities.
What does this regional computing market actually count?
The high performance computing market counts spending on tightly networked compute clusters, the software that schedules and runs workloads, integration and support services, and rented specialist capacity. Buyers include national laboratories, universities, manufacturers, drug developers and digital service companies, and they purchase through public tenders, multi-year managed contracts or metered cloud access.
The scope excludes ordinary enterprise servers, general office cloud subscriptions and consumer devices. The value chain runs from processor and memory suppliers through system integrators and cooling specialists to the data center operators and national centers that deliver usable computing time to research and commercial users.
Asia-Pacific High Performance Computing Market Insights
- The market grows from USD 14.59 billion in 2025 to USD 35.49 billion by 2035, a 9.27% CAGR across 2026–2035, as public programs and AI workloads expand together.
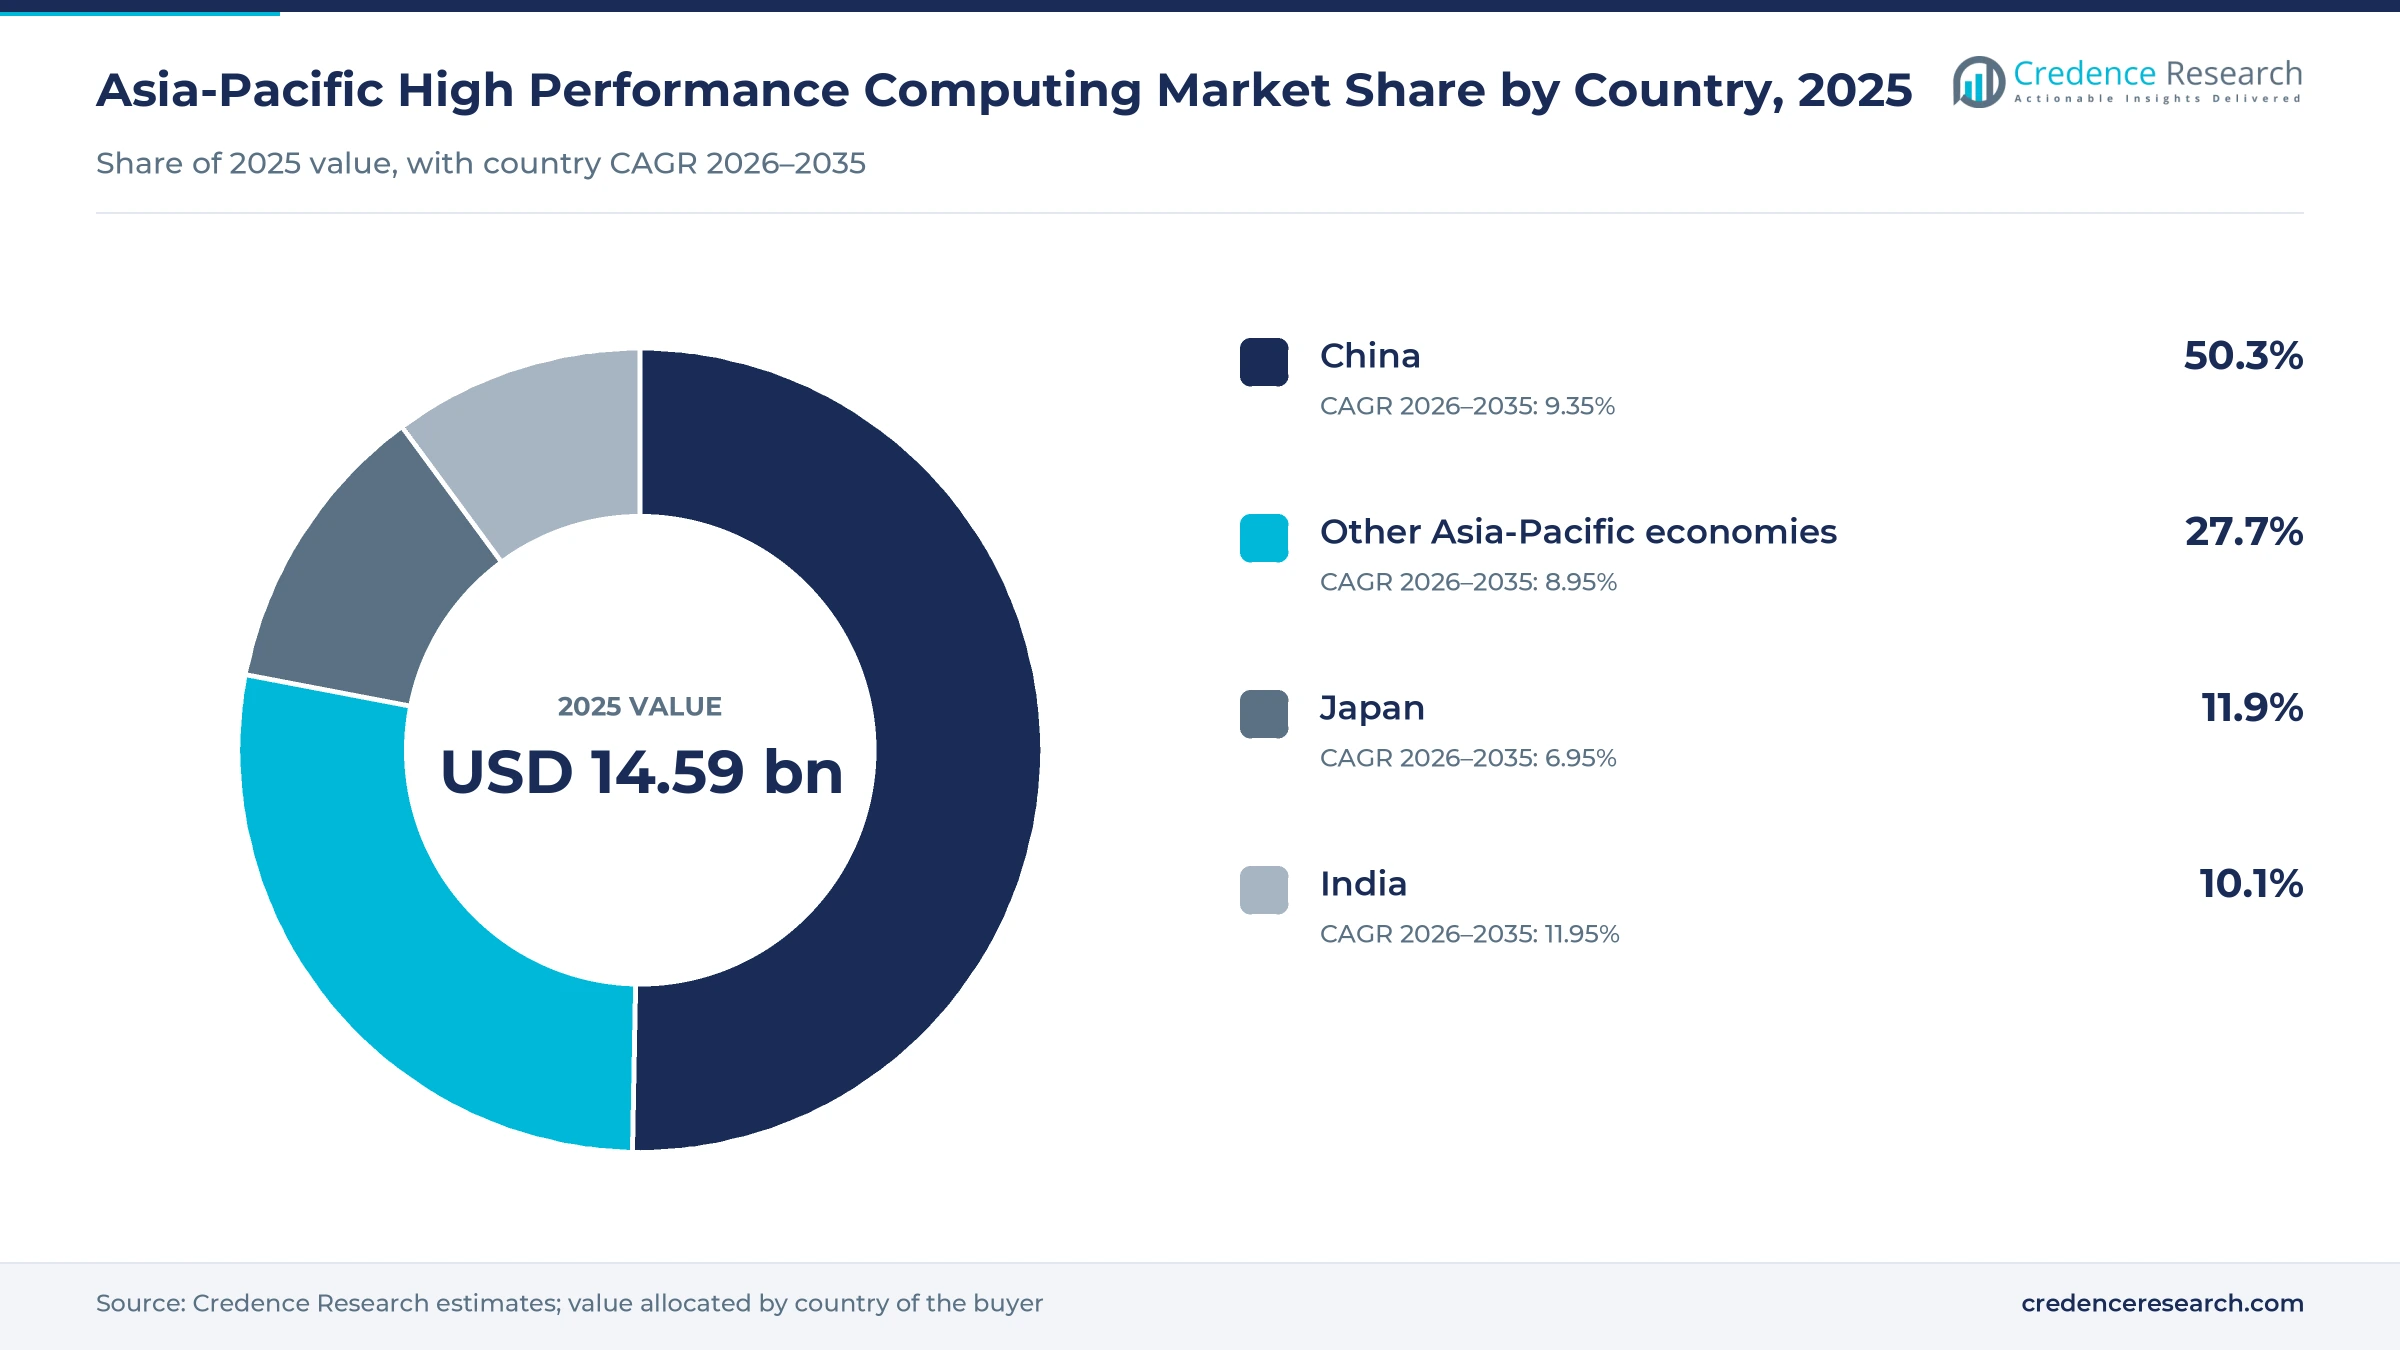
- China held 50.3% of regional value in 2025, ahead of Other Asia-Pacific economies, Japan and India, in Credence Research estimates built on the regional model.
- Compute infrastructure led solution types with 58.0% of 2025 value, while Cloud HPC is the fastest-growing type at 12.55% a year.
- LineShine in Shenzhen reached 2.198 exaflops on the June 2026 TOP500 list without GPUs, showing that domestic Arm processors can now lead a global performance ranking.
- Japan committed more than 110 billion yen to FugakuNEXT, and Fujitsu and Nvidia share the design, which is targeted to come online around 2030 at RIKEN in Kobe.
Compute hardware leads while Cloud HPC gains ground fastest
Why whole systems still outweigh rented capacity
Based on solution type, the market is categorized into compute infrastructure, software, services and Cloud HPC. Compute infrastructure led with 58.0% of 2025 value because national programs still buy complete machines, as South Korea did when KISTI selected Hewlett Packard Enterprise in May 2025 for a system with an expected 600-petaflop peak. Cloud HPC grows fastest at 12.55% a year as rented capacity widens access. India's national portal had onboarded 38,231 GPUs by March 2026 at about Rs 65 per GPU per hour for startups and academia, according to Minister of State Jitin Prasada.
Flagship machines stay on dedicated national sites
Based on deployment model, the market is categorized into on-premises, managed hosting, hybrid and cloud-only. On-premises led with 52.0% of 2025 value because flagship systems occupy dedicated national sites, and the June 2026 TOP500 list places its No. 1 machine, LineShine, at the National Supercomputing Centre in Shenzhen. Cloud-only grows fastest at 12.30% a year as smaller users rent remote capacity. South Korea's Ministry of SMEs and Startups said in April 2026 that 264 GPUs would reach manufacturers and startups through cloud services linked to NHN Cloud, according to The Asia Business Daily.
Public laboratories lead as digital operators scale up
Based on end-use industry, the market is categorized into public research, industrial engineering, life sciences and commercial digital services. Public research led with 38.0% of 2025 value because governments fund the largest machines, and India's national mission had installed 40 systems with 68 petaflops by September 2026, according to International Business Times. Commercial digital services grows fastest at 11.27% a year as operators add capacity at scale. Alibaba committed at least 380 billion yuan to cloud and AI infrastructure over three years in February 2025, according to the South China Morning Post.
Simulation remains the base as AI training accelerates
Based on application, the market is categorized into simulation, AI training, scientific analytics and rendering. Simulation led with 40.0% of 2025 value because engineering users run it continuously, and RIKEN lists an automotive CAE consortium of 14 companies and 11 academic institutions. AI training grows fastest at 11.40% a year as China alone reported 1,053 exaflops of intelligent capacity by September 2025, according to its industry ministry. Rendering stays a smaller niche, although People's Daily reported that the Gui'an Supercomputing Center served more than 100 film and television productions, including Ne Zha 2.
| Segment Group | Leading Sub-segment | Share, 2025 | Fastest-growing Sub-segment | CAGR, 2026–2035 |
|---|---|---|---|---|
| By Solution Type | Compute infrastructure | 58.0% | Cloud HPC | 12.55% |
| By Deployment Model | On-premises | 52.0% | Cloud-only | 12.30% |
| By End-Use Industry | Public research | 38.0% | Commercial digital services | 11.27% |
| By Application | Simulation | 40.0% | AI training | 11.40% |
Request a Free Sample
Fill in your details and we'll send you a free sample report.
- Sample data tables & charts
- Research methodology
Sovereign budgets and AI workloads lift regional spending
Sovereign research capacity expansion
Governments treat domestic computing as strategic infrastructure, so successor machines are funded well before older systems retire. Japan set a development budget above 110 billion yen for FugakuNEXT, with Fujitsu and Nvidia sharing the design, according to Tom's Hardware in August 2025. South Korea followed a similar path in May 2025, when KISTI chose Hewlett Packard Enterprise for its sixth national system at an expected 600 petaflops. Singapore's National Research Foundation also announced a S$270 million grant on Oct. 25, 2024, covering the country's next supercomputer and talent development. These commitments support Public research, which held 38.0% of 2025 value. As a result, public tenders give integrators a long and fairly visible order pipeline across the region.
AI and semiconductor workload convergence
AI training and chip design now run on the same accelerated clusters, which lets one facility serve several paying workloads. Nvidia reported that AIST's ABCI 3.0 in Japan, integrated by Hewlett Packard Enterprise, was designed for 6 AI exaflops and 410 double-precision petaflops. SDxCentral reported that computational lithography at TSMC could shrink from 40,000 CPU systems to 350 H100 systems, which cut cycle times by nearly 50%. FugakuNEXT carries the same logic into national science, with RIKEN targeting more than 600 exaflops in FP8 sparse precision, according to DatacenterDynamics. Procurement teams therefore specify memory bandwidth and data center accelerator capacity first. In turn, AI training is the fastest application at 11.40% a year.
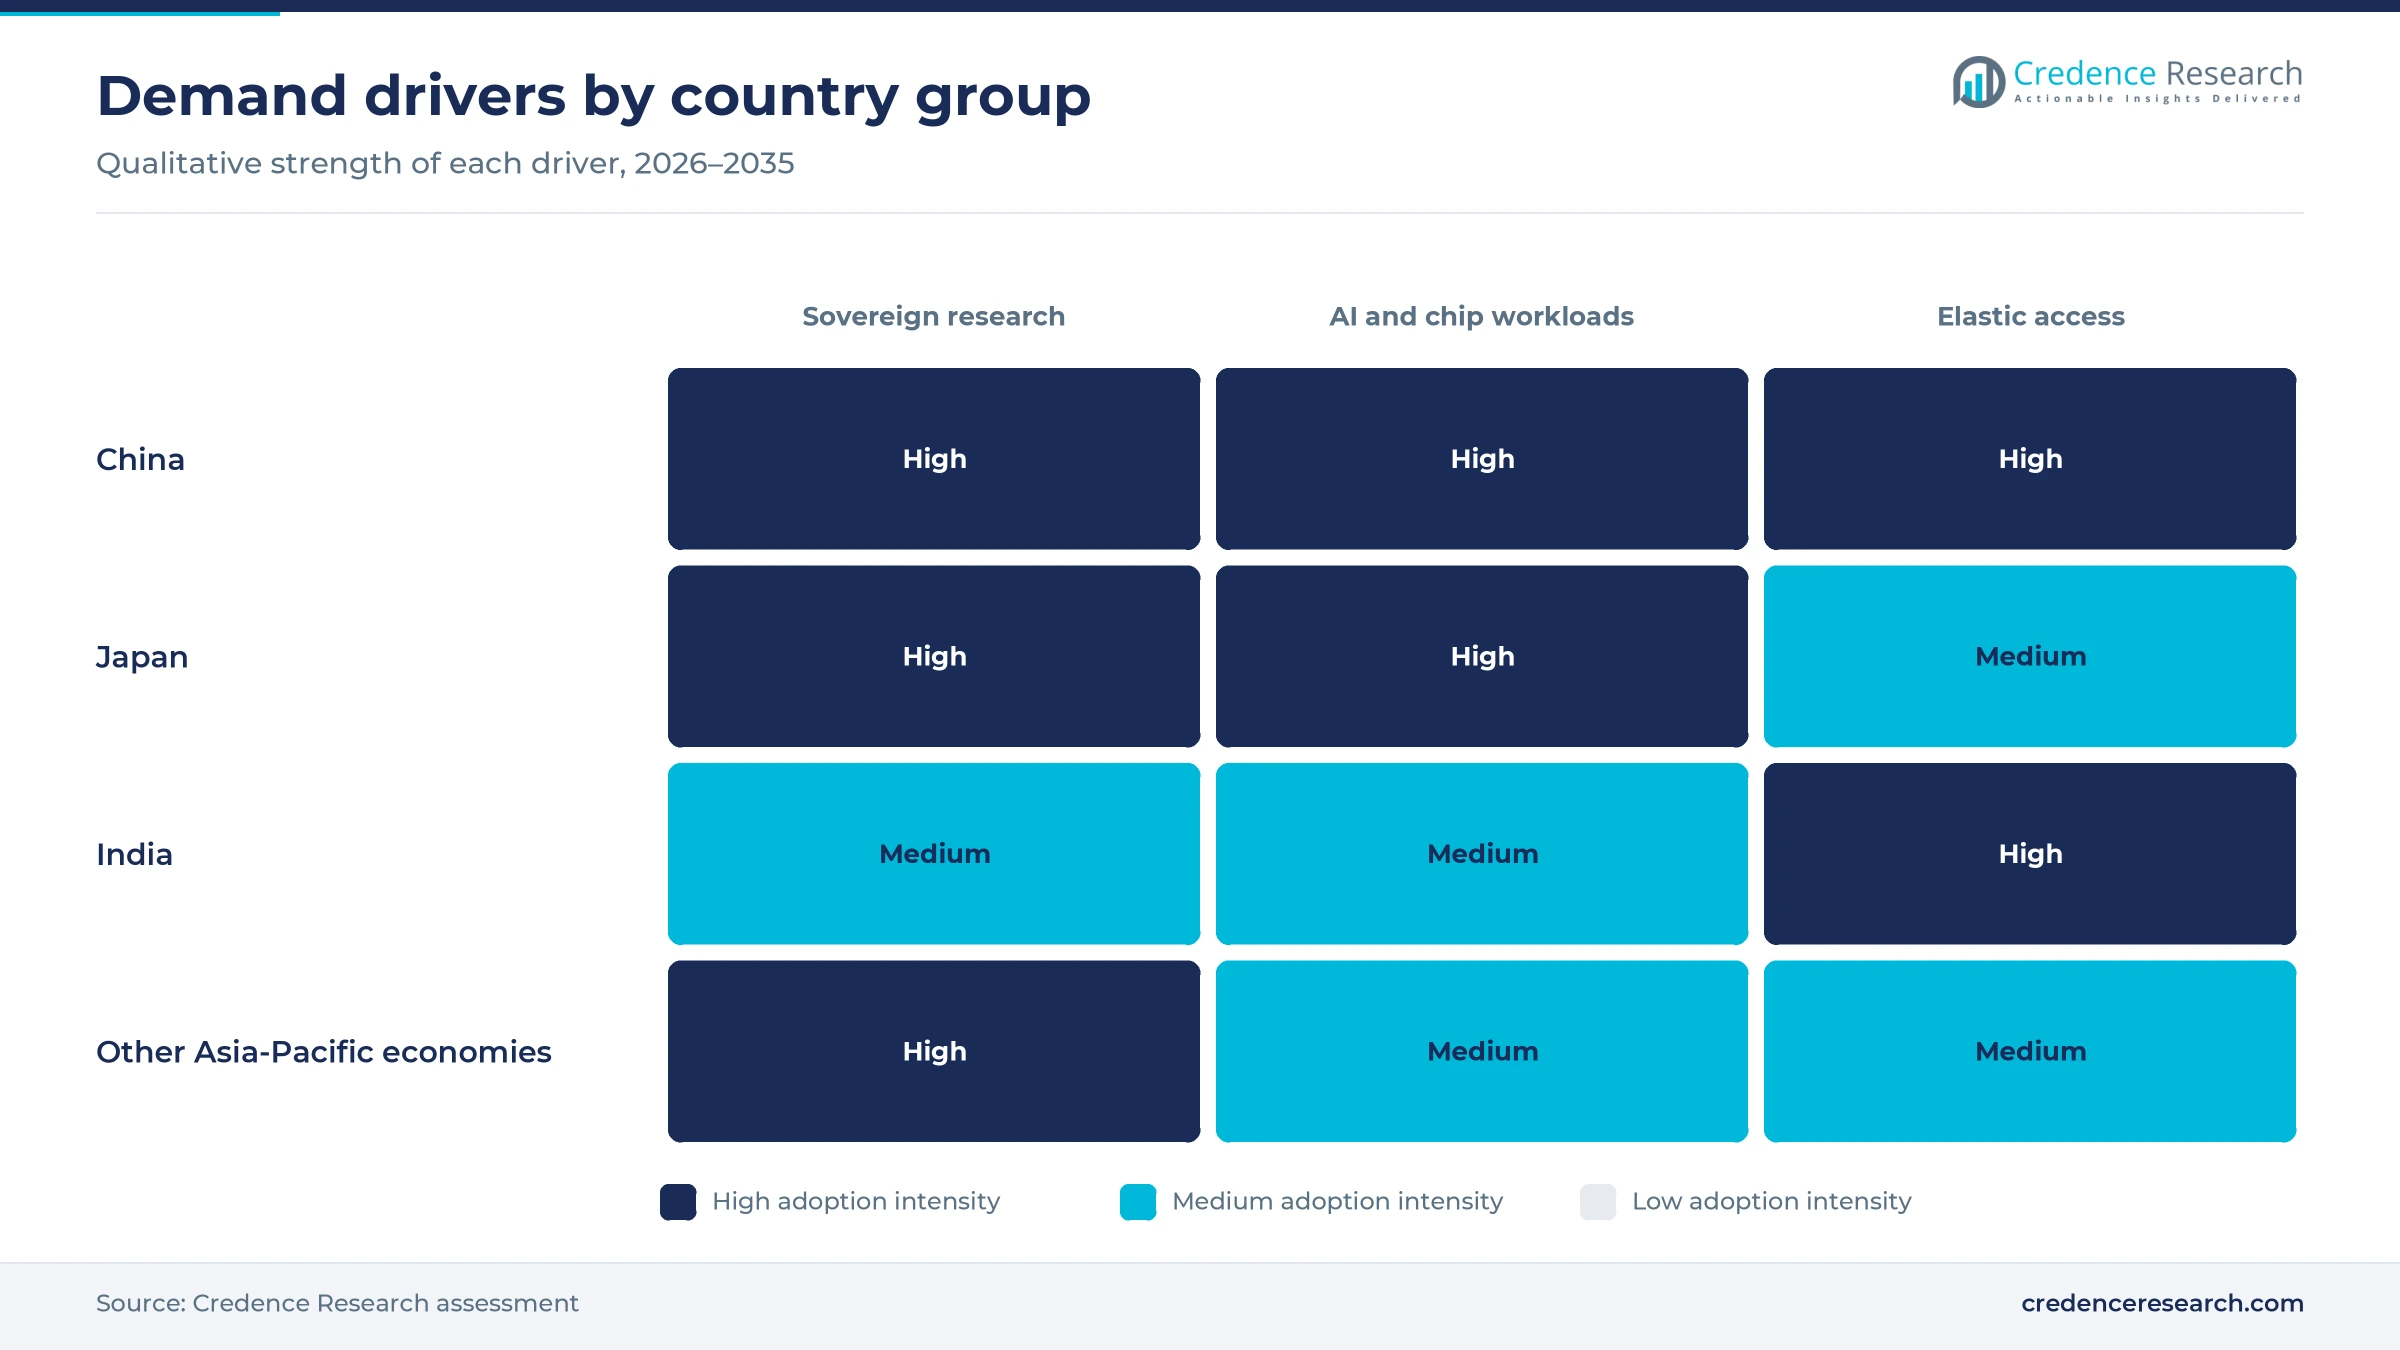
Elastic access to specialist computing
Shared platforms let buyers pay for hours of specialist capacity instead of funding a whole cluster. India's common compute facility had 38,231 GPUs and 190 approved projects by March 25, 2026, according to a statement in the Lok Sabha. Minister Ashwini Vaishnaw said in February 2026 that about 20,000 more GPUs would follow within a week, according to Business Today. China Daily reported in April 2026 that the Chinese national platform aggregated 163 exaflops from 149 providers, which gives regional users a single route to scattered capacity. Lower entry costs bring in first-time users that never ran a tender before. Because of this shift, Cloud-only grows at 12.30% a year, the fastest rate among deployment models.
Domestic processors replace restricted supply in China
Export limits have turned Chinese buyers toward domestic stacks, and that substitution creates fresh hardware demand. The U.S. added six Inspur Group units to its Entity List in March 2025 and cited work on military supercomputers, according to Dawn. Nvidia chief executive Jensen Huang then said in a May 2026 report by Tom's Hardware that his company's China accelerator share had dropped to zero. The same report said Huawei aims to produce about 750,000 950PR processors in 2026, a volume still expected to fall short of demand. LineShine shows the wider result, since its 13,789,440 Arm cores run without any GPUs. Artificial intelligence programs in China now rely increasingly on this supply, which supports continued hardware orders from national centers.
Cooling, chip choice and shared access are reshaping buying
A shift to liquid cooling in dense clusters
Rising rack density is moving new clusters from air to liquid, because cooling now decides how much computing a site can host. Lenovo said on Nov. 27, 2025 that its Neptune systems run on about 40% less power than air-cooled servers, and it named meteorological agencies in Korea and Malaysia as users. Huawei's CloudMatrix 384 shows the pressure on sites, since DatacenterDynamics put its draw at roughly 559 kilowatts across 16 racks. China also set a goal of cutting large-site power usage effectiveness to 1.25 by 2025, from an average of 1.48, according to Eco-Business. Operators are therefore treating data center cooling as a first-stage design choice rather than a later fit-out decision.
A rising split between CPU-led and GPU-led designs
System architects no longer follow one design, and the region now holds the clearest examples of each approach. LineShine reached 2.198 exaflops with 304-core Arm processors and no accelerators, according to ITPro's June 2026 report on the ranking. KISTI-6 takes a mixed route instead, pairing Nvidia GH200 superchips in one partition with AMD EPYC processors in another, according to Hewlett Packard Enterprise. FugakuNEXT then joins Fujitsu processors to Nvidia GPUs through NVLink Fusion, with Fujitsu leading the compute node design, according to DatacenterDynamics. This variety changes software spending, because code must run across several processor families. As a result, Compute infrastructure remains central at 58.0% of 2025 value while tooling and porting work gain importance.
Subsidized GPU pools open a large small-buyer opportunity
Public GPU pools create an opening for service providers, because thousands of small buyers are meeting specialist computing for the first time. South Korea's ministry assigned 200 of its 264 GPUs to startups in April 2026, and it set aside 30 for founders who struggle to obtain capacity, according to The Asia Business Daily. India's Rs 65 hourly rate gives another clear entry point for universities and startups. Singapore has also said that part of its new supercomputing resources will serve small firms and startups, according to the National Supercomputing Centre. Providers that add onboarding, workflow porting and support can therefore convert subsidized users into paying customers, and Cloud HPC already grows fastest among solution types at 12.55% a year.
Replacement cycles offer an opening for integrators
Aging national machines give integrators a visible opportunity, particularly outside the largest three markets. Pawsey told an Australian parliamentary committee that Setonix has a supported lifecycle to 2028 and that research demand runs at about three times available capacity, according to Information Age in October 2026. The same report said Australia's NCI has 120 next-generation GPUs, against 1,500 in Singapore and 8,500 in South Korea's public research sector. Taiwan is also adding capacity, since Focus Taiwan reported in March 2026 that its national center expected Chingchuang 26 online in the third quarter of 2026. These economies together held 27.7% of the 2025 regional value. Vendors that offer phased migration and financing are therefore well placed in the next tender round.
Export rules, memory prices and power limit deployment
Export controls split supply and raise risk
Export controls force vendors and buyers to plan around two separate supply chains. The U.S. listing of six Inspur units in March 2025 limited their access to U.S. technology, according to Dawn. Domestic alternatives carry their own limits, since Tom's Hardware cited a JP Morgan estimate of about eight months from wafer to packaged chip at SMIC, against three months at TSMC. Chinese buyers therefore face longer delivery and reported price rises near 20% on Huawei's 950PR, so many stage their purchases.
Memory shortages inflate cluster budgets
Memory has become one of the fastest-rising costs in a cluster, and fixed public budgets absorb it poorly. Tom's Hardware reported in December 2025 that Dell, Lenovo, HP and HPE planned server price rises of about 15%. That rise reaches vendors with large regional shares, since the June 2026 TOP500 statistics credit Lenovo with 130 systems and Hewlett Packard Enterprise with 124. Tender teams now face a choice between fewer nodes and later delivery. Buyers tracking semiconductor memory supply increasingly seek shorter quote windows and phased orders.
Power and grid access constrain new sites
Electricity access often decides whether a planned cluster can be built on schedule. The International Energy Agency said data center electricity demand rose 17% in 2025, and it warned that slow grid connections and tight transformer supply are holding up projects. Pressure is acute in China, since Eco-Business reported that coal supplies about 70% of power in the eastern provinces hosting most sites. Developers must therefore pay for efficient cooling, relocate to western hubs or accept delays, which raises costs for smaller operators.
Funding gaps and thin skills slow smaller programs
Smaller national programs struggle to fund replacements and to staff them once installed. Information Age reported in October 2026 that replacing Australia's Setonix could cost four to five times its original build, and that current funding would not cover it. Skills pipelines are also uneven, since India's mission reports more than 2,200 participants trained in 2025, down from more than 4,000 in 2024. Buyers without local specialists therefore depend on vendor services, which adds recurring cost and slows the migration of existing code.
China holds half of demand while India grows fastest
| Country | Value, 2025 (USD billion) | Share, 2025 | CAGR, 2026–2035 |
|---|---|---|---|
| China | 7.34 | 50.3% | 9.35% |
| Other Asia-Pacific economies | 4.04 | 27.7% | 8.95% |
| Japan | 1.74 | 11.9% | 6.95% |
| India | 1.47 | 10.1% | 11.95% |
China leads on state networks and domestic chips
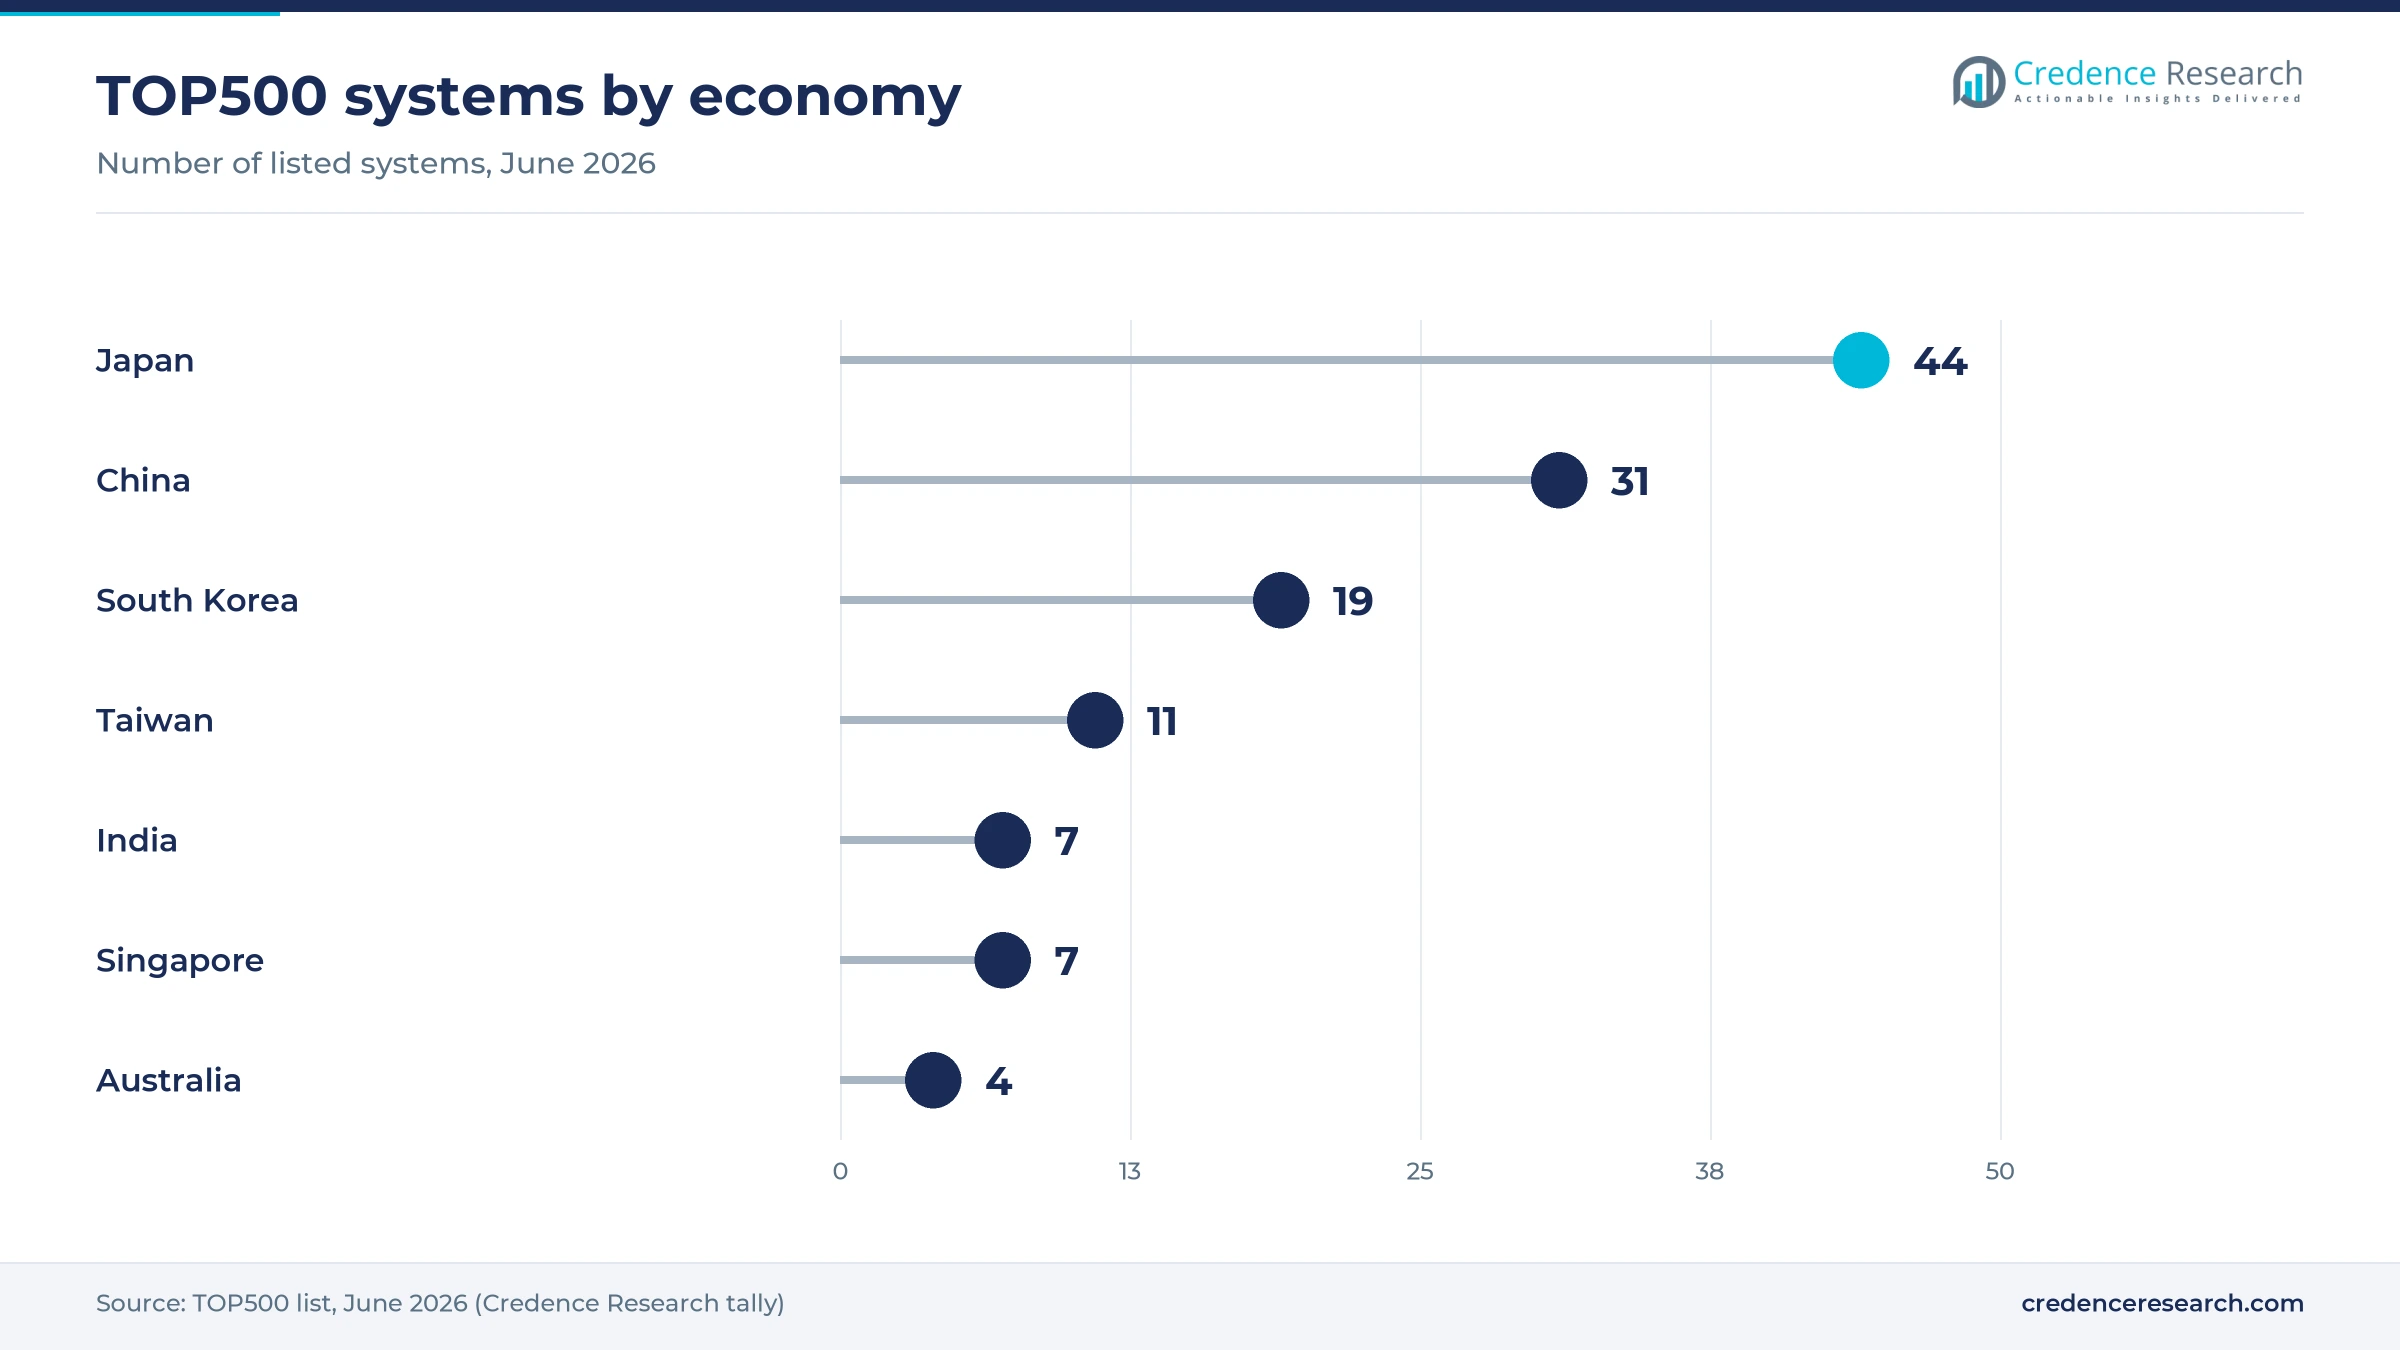
China held 50.3% of 2025 value and grows at 9.35% a year, supported by state computing networks and a domestic processor supply. The June 2026 TOP500 list shows 31 China-based systems, including first-placed LineShine. CGTN reported that Guizhou province alone passed 150 exaflops in 2025, with intelligent computing above 90% of that total. Chinese centers also run commercial work, as the Gui'an rendering contracts show, so public sites and cloud operators both add to hardware demand.
Japan funds a long national successor program
Japan held 11.9% of 2025 value and grows at 6.95% a year, a slower rate because its base of installed systems is already large. The June 2026 TOP500 list shows 44 Japanese systems, the highest count in the region. FugakuNEXT is scheduled for around 2030, and ABCI 3.0 received backing from the Ministry of Economy, Trade and Industry. Mitsui's Tokyo-1, announced in March 2023 for Astellas, Daiichi Sankyo and Ono, also extends demand to drug discovery.
India grows fastest through shared public capacity
India held 10.1% of 2025 value and grows at 11.95% a year, the fastest pace among the four country groups. The June 2026 TOP500 list shows seven Indian systems, so the installed base remains small against national demand. The National Supercomputing Mission reached 40 systems with 68 petaflops by September 2026, according to International Business Times. Subsidized GPU hours add a second route to growth, because universities and startups can start without buying any hardware at all.
Other economies buy national flagship systems
Other Asia-Pacific economies held 27.7% of 2025 value and grow at 8.95% a year. The June 2026 TOP500 list shows 19 systems in South Korea, 11 in Taiwan, seven in Singapore and four in Australia. KISTI-6 and Singapore's funded successor machine anchor public demand in the group. Australia is the main uncertainty, because Setonix has no confirmed funding beyond 2028, according to Information Age, and a decision there would influence vendor pipelines.
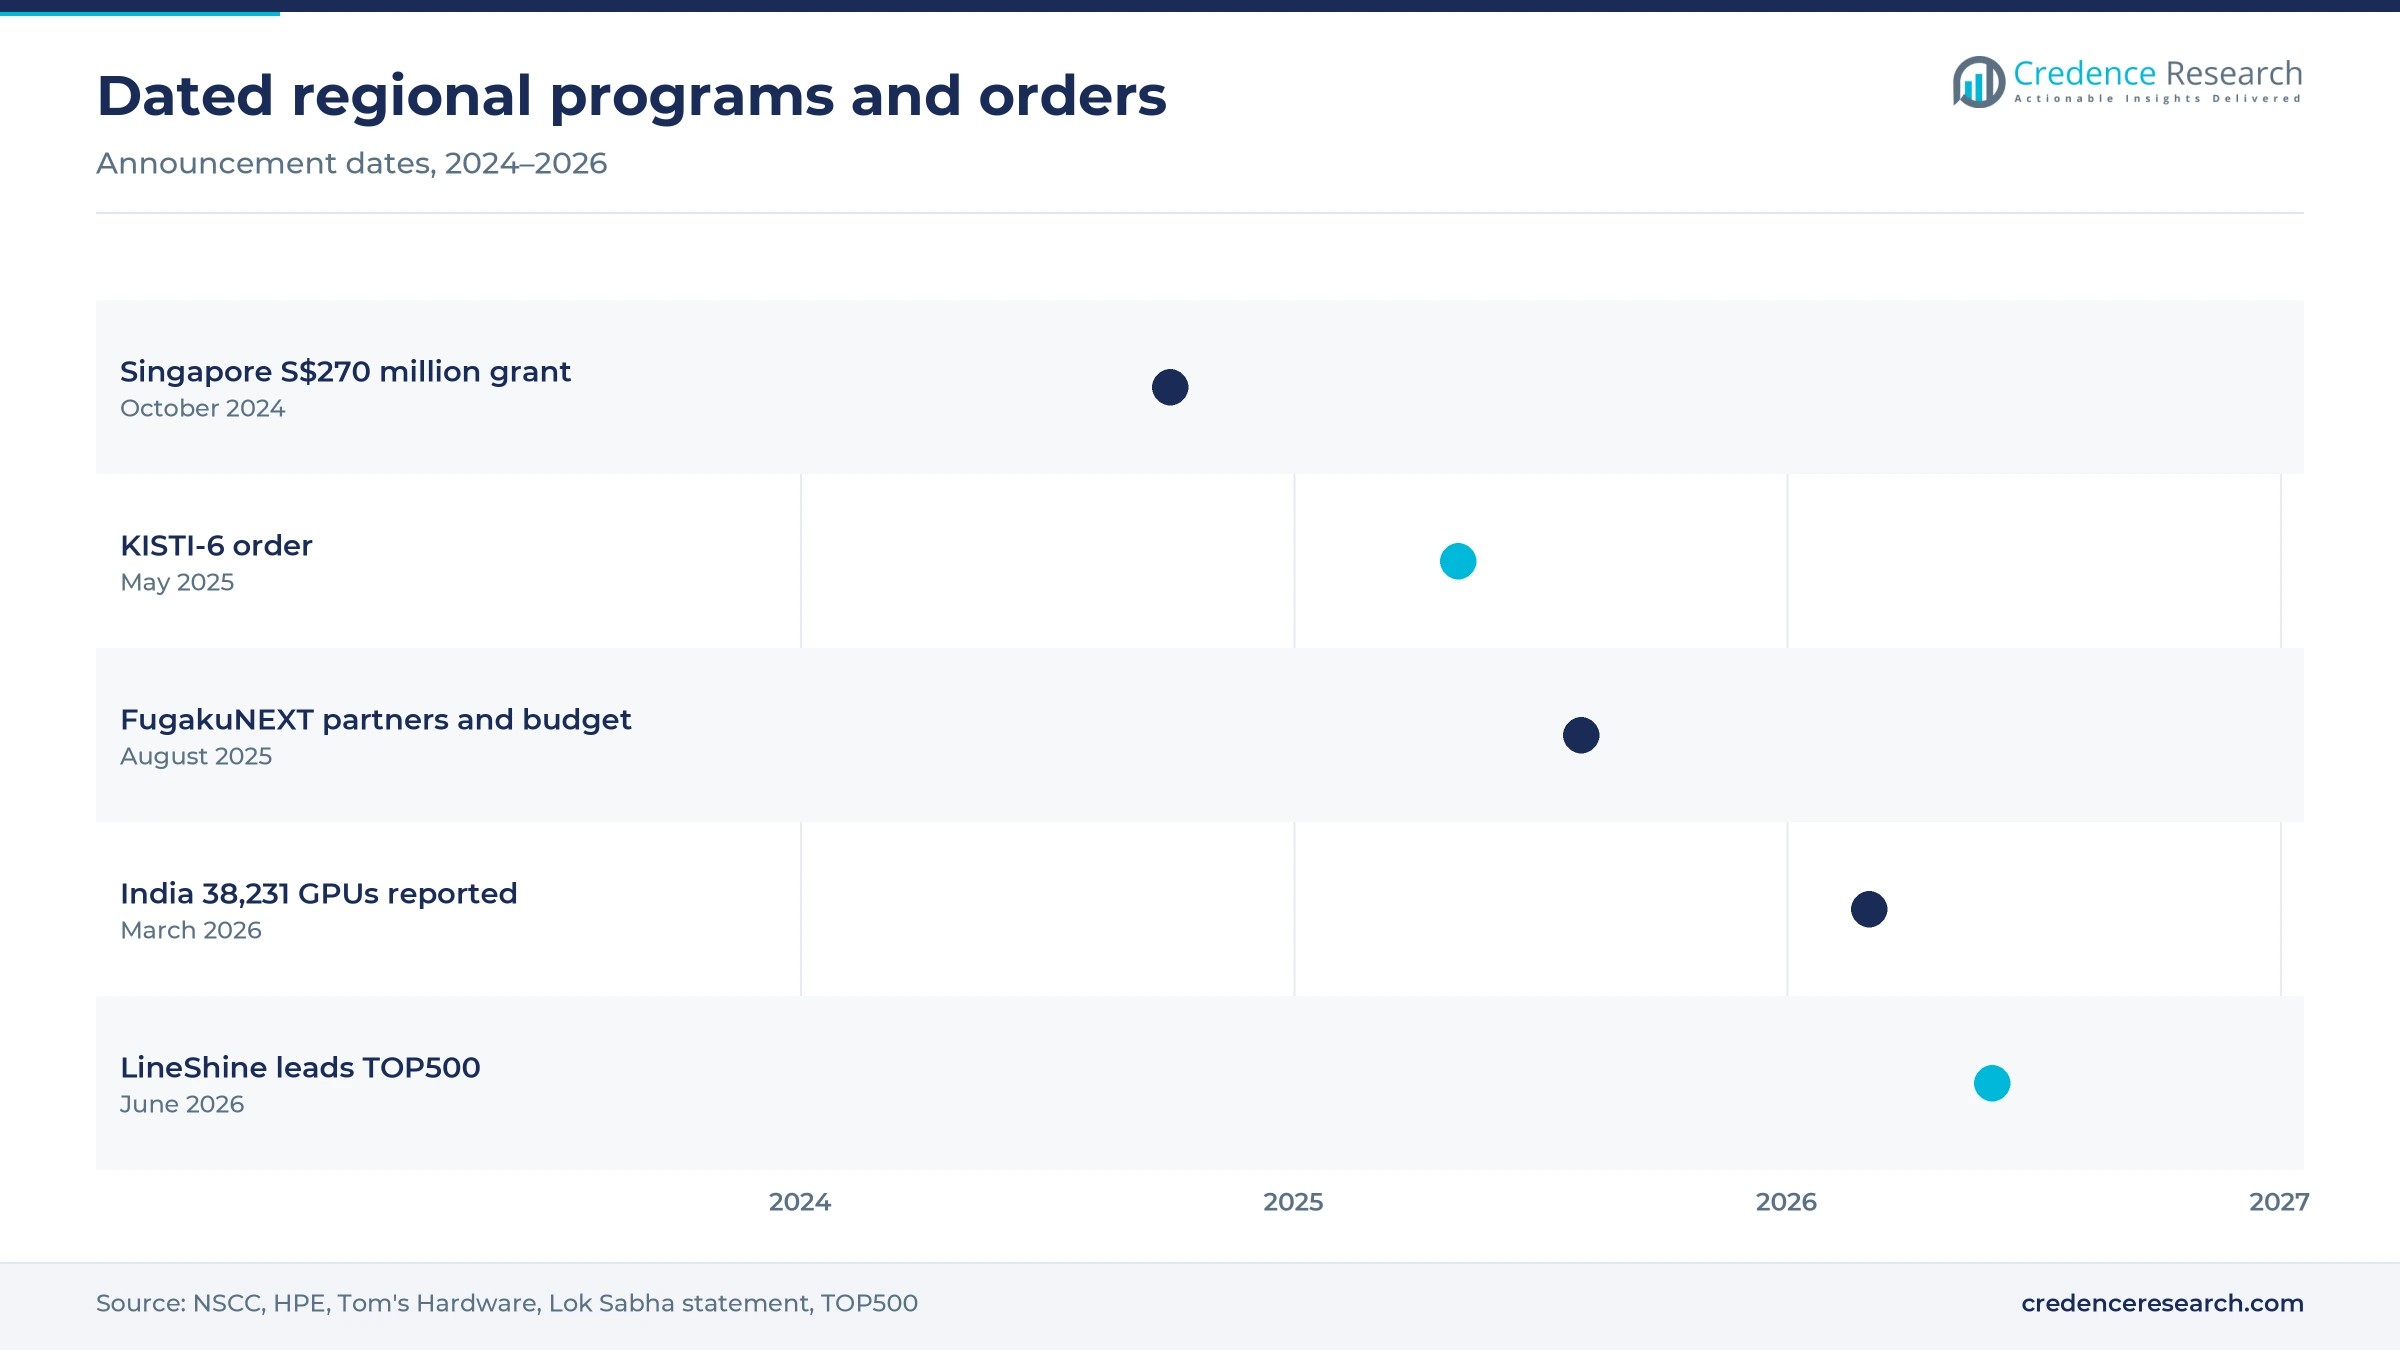
Dated orders and launches that moved the region since 2025
| Development | Status and market relevance |
|---|---|
| In May 2025, KISTI selected Hewlett Packard Enterprise to build KISTI-6, expected to become South Korea's most powerful supercomputer at 600 petaflops peak. | Ordered; it anchors public demand among other regional economies. |
| In August 2025, RIKEN named Fujitsu and Nvidia as partners on FugakuNEXT, with a development budget above 110 billion yen and a target around 2030. | In design; it sets the long-term Japanese purchase cycle. |
| In March 2026, India told parliament that its common compute facility had onboarded 38,231 GPUs and approved 190 projects at about Rs 65 an hour. | Operating; it supports metered access for startups and academia. |
| In April 2026, South Korea's Ministry of SMEs and Startups announced 264 GPUs for small manufacturers and startups through NHN Cloud. | Allocating; support began in June and is free through year-end. |
| In June 2026, LineShine debuted at No. 1 on the TOP500 at 2.198 exaflops, the first China-based leader since 2017. | Operating; it shows that domestic Arm processors can lead the ranking. |
Liquid cooling and local processors define new system design
- Direct liquid cooling lets dense clusters fit existing power limits, and Lenovo says Neptune servers use about 40% less power than air-cooled systems.
- Arm-based processors now span the top of the ranking, from Fugaku's A64FX to the 304-core LX2 chips in LineShine.
- Memory-coupled accelerators matter more than raw core counts for AI, which explains the GH200 partition chosen for KISTI-6.
- Chip-level interconnects such as NVLink Fusion will join Fujitsu processors with Nvidia GPUs in FugakuNEXT, while LineShine uses its own LingQi fabric.
- Domestic software stacks remain a gap, since Tom's Hardware reports about four million developers on Huawei's CANN, far fewer than on Nvidia's CUDA.
Need a Custom Version of This Report?
Tailor the scope, geography, or segments to your exact requirements.
- Custom geography or segment scope
- Direct access to our analyst team
Global integrators and Chinese vendors serve split markets
Competition in high performance computing now divides along trade lines. In China, Huawei supplies Ascend processors and CloudMatrix systems, while server makers such as IEIT Systems, also known as Inspur Electronic Information, operate alongside U.S. restrictions that reached other Inspur units in March 2025, and national centers also commission their own designs such as LineShine. Elsewhere, global integrators bid on national tenders, and the TOP500 statistics for June 2026 credit Lenovo with 130 systems and Hewlett Packard Enterprise with 124, against 13 for Fujitsu and two for Inspur. Hewlett Packard Enterprise won KISTI-6 and integrated ABCI 3.0, so it holds two of the largest recent regional references. Fujitsu competes mainly through Japanese national design work, and it announced cloud access to its PRIMEHPC machines under a Computing as a Service plan in April 2022. Lenovo promotes liquid cooling to meteorological agencies in Korea and Malaysia. Buyers increasingly compare cooling, delivery dates and long-term software support, rather than peak speed alone.
Companies profiled and their roles in this market
| Company | Type | Role in the market |
|---|---|---|
| IEIT Systems | Server maker | Chinese server maker, also known as Inspur Electronic Information; the TOP500 credits two June 2026 systems to Inspur |
| Fujitsu | System designer | Leads FugakuNEXT system, node and CPU design at RIKEN in Japan |
| Lenovo | Integrator | Credited with 130 June 2026 TOP500 systems; Neptune users include agencies in Korea and Malaysia |
| Huawei | Processor and system vendor | Supplies Ascend processors and the CloudMatrix 384 system in China |
| Hewlett Packard Enterprise | Integrator | Selected for KISTI-6 in South Korea and integrator of ABCI 3.0 in Japan |
Access to compute now matters as much as peak speed
Credence Research's view is that regional high performance computing demand is moving from a contest over peak speed toward a contest over access. LineShine and FugakuNEXT will attract the headlines, yet India's Rs 65 hourly rate and South Korea's 264 GPU allocation show where new users are appearing. Buyers should treat processor portability as a procurement requirement, since export rules and memory prices can change a bill of materials within one quarter. Vendors gain most by pairing hardware with migration support and financing. Countries with thin budgets, such as Australia, face the hardest choice, because a delayed decision can leave research users without capacity.
How Credence Research built these regional estimates
The report uses 2025 as the base year and 2035 as the forecast year. Market values come from the Credence Research model, and segment and country splits are Credence Research estimates informed by public program data. Sources used include national ministry statements, public research center releases, company press releases, the TOP500 list and trade or general press reports opened during research. No interviews or surveys were conducted for this edition of the report. System counts were tallied directly from the June 2026 TOP500 list. Because many commercial AI clusters are not submitted to that list, these counts indicate public capacity rather than total installed capacity.
FugakuNEXT and shared GPU pools set the path to 2035
The market is forecast to reach USD 35.49 billion by 2035 from USD 15.98 billion in 2026, a 9.27% CAGR across 2026–2035. China should keep its lead, although domestic processor output and memory costs will influence the pace of its purchases. Japan's spending should concentrate around FugakuNEXT near 2030, while India is likely to widen access first and expand owned systems later. South Korea, Singapore and Taiwan will continue national replacement rounds. Rented high performance computing capacity should take a larger share each year as subsidized users mature into paying customers. Power access and funding decisions remain the clearest factors that could slow this trajectory.
Frequently Asked Questions
How big is the Asia-Pacific high performance computing market?
Which country leads regional demand?
Which country group is growing fastest?
Which solution type is the largest?
What is the largest deployment model?
What are the main growth drivers?
What challenges does the market face?
Which companies are active in this market?
Table of Content
Chapter 1 Market Segmentation
- 1.1 Segmentation Framework
- 1.1.1 Product and Service Classification
- 1.1.2 Application and End-Use Classification
- 1.1.3 Technology and Solution Classification
- 1.1.4 Customer and Distribution Channel Classification
- 1.1.5 Geographic Segmentation
- 1.1.6 Market Segment Definitions and Boundaries
- 1.2 By Solution Type
- 1.2.1 Compute infrastructure
- 1.2.2 Software
- 1.2.3 Services
- 1.2.4 Cloud HPC
- 1.3 By Deployment Model
- 1.3.1 On-premises
- 1.3.2 Managed hosting
- 1.3.3 Hybrid
- 1.3.4 Cloud-only
- 1.4 By End-Use Industry
- 1.4.1 Public research
- 1.4.2 Industrial engineering
- 1.4.3 Life sciences
- 1.4.4 Commercial digital services
- 1.5 By Application
- 1.5.1 Simulation
- 1.5.2 AI training
- 1.5.3 Scientific analytics
- 1.5.4 Rendering
- 1.6 By Country
- 1.6.1 China
- 1.6.2 Japan
- 1.6.3 India
- 1.6.4 Other Asia-Pacific economies
Chapter 2 Introduction
- 2.1 Report Objectives and Scope
- 2.2 Product Definition and Industry Terminology
- 2.3 Market Inclusions and Exclusions
- 2.4 Research Process
- 2.4.1 Primary Research and Expert Interviews
- 2.4.2 Secondary Research and Source Review
- 2.4.3 Top-Down and Bottom-Up Estimation
- 2.4.4 Data Triangulation and Verification
- 2.5 Market Size Measurement Basis
- 2.5.1 2025: USD 14.59 billion → 2035: USD 35.49 billion
- 2.6 Historical and Forecast Reference Periods
- 2.6.1 Historical Period: 2018-2025
- 2.6.2 Base Year: 2025
- 2.6.3 Forecast Period: 2025-2035
- 2.7 Research Assumptions and Limitations
Chapter 3 Executive Summary
- 3.1 Market Snapshot and Key Findings
- 3.2 Base-Year Market Size, 2025
- 3.3 Forecast Market Size, 2035
- 3.4 Revenue and Volume Growth Outlook
- 3.5 Key Demand and Supply Indicators
- 3.6 Leading Market Segments
- 3.7 Fastest-Growing Market Opportunities
- 3.8 Regional Performance Highlights
- 3.9 Technology and Industry Transformation
- 3.10 Competitive Landscape Summary
- 3.11 Analyst View and Strategic Implications
Chapter 4 Asia-Pacific High Performance Computing Market Trends and Developments
- 4.1 Historical Industry Development, 2018-2025
- 4.2 Recent Market Trends and Developments
- 4.3 Demand and Customer Behavior Trends
- 4.4 Technology and Product Innovation
- 4.5 Artificial Intelligence, Automation and Digitalization
- 4.6 Local Manufacturing and Supply Chain Realignment
- 4.7 Industry Partnerships, Mergers and Acquisitions
- 4.8 Sustainability and Circular Economy Developments
- 4.9 Government and Private Sector Investment Trends
- 4.10 Emerging Business Models and Commercialization
- 4.11 Industry Developments and Announcements
Chapter 5 Asia-Pacific High Performance Computing Market Production, Supply and Demand Analysis
- 5.1 Demand Trend and Consumption Analysis, 2018-2025
- 5.2 Demand Forecast, 2025-2035
- 5.3 Production and Output Trend, 2018-2025
- 5.4 Production and Output Forecast, 2025-2035
- 5.5 Installed Capacity and Capacity Utilization
- 5.6 Company-Wise Production Plants and Statistics
- 5.6.1 Installed Production Capacity
- 5.6.2 Actual Production
- 5.6.3 Planned Capacity and Expansion Targets
- 5.7 Supply Chain Structure and Procurement Trends
- 5.8 Supply-Demand Gap and Bottlenecks
- 5.9 Import Dependence and Sourcing Structure
- 5.10 Contract Manufacturing and Outsourcing
- 5.11 Regional Supply and Demand Concentration
Chapter 6 Asia-Pacific High Performance Computing Market Pricing Analysis
- 6.1 Pricing Structure and Measurement
- 6.2 Historical Pricing Trends, 2018-2025
- 6.3 Pricing Outlook, 2025-2035
- 6.4 Average Selling Price and Unit Economics
- 6.5 Pricing by Product and Market Segment
- 6.6 Geographic Pricing Differences
- 6.7 Key Input, Energy, Labor and Logistics Costs
- 6.8 Contract Pricing and Purchasing Models
- 6.9 Pricing Sensitivity and Competitive Positioning
- 6.10 Price, Margin and Profitability Implications
Chapter 7 Asia-Pacific High Performance Computing Market Dynamics
- 7.1 Market Growth Drivers
- 7.1.1 Demand-Side Drivers
- 7.1.2 Technology and Innovation Drivers
- 7.1.3 Infrastructure and Investment Drivers
- 7.1.4 Regulatory and Policy Drivers
- 7.2 Market Restraints
- 7.2.1 Cost and Affordability Constraints
- 7.2.2 Technology and Adoption Barriers
- 7.2.3 Supply Chain and Operational Constraints
- 7.3 Market Challenges
- 7.3.1 Competitive Pressure and Margin Erosion
- 7.3.2 Skills, Infrastructure and Implementation Gaps
- 7.4 Emerging Market Opportunities
- 7.5 Market Dynamics Impact and Time-Horizon Assessment
Chapter 8 Asia-Pacific High Performance Computing Value Chain Analysis
- 8.1 Industry Value Chain Overview
- 8.2 Upstream Suppliers and Critical Inputs
- 8.3 Technology and Component Providers
- 8.4 Manufacturing or Service Delivery
- 8.5 Distribution, Channel Partners and Integrators
- 8.6 Downstream Applications and End Users
- 8.7 Value Addition and Profit Pools
- 8.8 Vertical Integration and Outsourcing
- 8.9 Supplier Concentration and Risk
- 8.10 Supply Chain Localization and Resilience
Chapter 9 Asia-Pacific High Performance Computing Market Regulations and Policies
- 9.1 Relevant Laws, Standards and Compliance Frameworks
- 9.2 Product, Service, Safety and Quality Requirements
- 9.3 Government Policies, Incentives and Subsidies
- 9.4 Imports, Exports and Trade Barriers
- 9.5 Public Procurement and Local Content Requirements
- 9.6 Environmental and Sustainability Compliance
- 9.7 Data Protection, AI and Cybersecurity Compliance
- 9.8 Upcoming Policy Changes and Market Implications
Chapter 10 Asia-Pacific High Performance Computing Market Hotspots and Opportunities
- 10.1 Market Opportunity Mapping and Growth Hotspots
- 10.2 High-Growth Applications and Customer Groups
- 10.3 Underserved Markets and White-Space Opportunities
- 10.4 Emerging Technology and Product Opportunities
- 10.5 New Capacity and Investment Hotspots
- 10.6 Market Entry and Expansion Opportunities
- 10.7 Distribution and Partnership Opportunities
- 10.8 Near-Term and Long-Term Commercial Potential
- 10.9 Opportunity Attractiveness and Execution Risks
Chapter 11 Asia-Pacific High Performance Computing Market Outlook, 2025-2035
- 11.1 Market Size and Analysis
- 11.1.1 Revenue (Market Measurement: 2025: USD 14.59 billion → 2035: USD 35.49 billion)
- 11.1.2 Market Volume and Quantity Sold
- 11.1.3 Historical Market Size, 2018-2025
- 11.1.4 Base-Year Market Size, 2025
- 11.2 Market Forecast, 2025-2035
- 11.2.1 Revenue Forecast to 2035
- 11.2.2 Volume Forecast to 2035
- 11.2.3 CAGR and Year-on-Year Growth
- 11.2.4 Incremental Revenue Opportunity
- 11.3 Forecast Assumptions and Scenario Analysis
- 11.3.1 Base-Case Forecast
- 11.3.2 Optimistic and Conservative Scenarios
- 11.3.3 Technology, Pricing and Policy Sensitivities
- 11.4 Market Attractiveness and Growth Outlook
Chapter 12 Asia-Pacific High Performance Computing Market Segmentation and Outlook
- 12.1 Segmentation Summary and Market Shares, 2025
- 12.2 Largest and Fastest-Growing Segments
- 12.3 By Solution Type - Market Size and Forecast, 2025-2035
- 12.3.1 Segment Definition and Scope
- 12.3.2 Historical Market Size, 2018-2025
- 12.3.3 Revenue Forecast, 2025-2035
- 12.3.4 Volume Forecast, 2025-2035
- 12.3.5 Base-Year Market Share, 2025
- 12.3.6 Segment CAGR and Growth Drivers
- 12.3.7 Subsegment Market Size and Forecast
- 12.3.7.1 Compute infrastructure
- 12.3.7.2 Software
- 12.3.7.3 Services
- 12.3.7.4 Cloud HPC
- 12.3.8 Subsegment Pricing and Adoption Trends
- 12.3.9 Leading Suppliers and Competition
- 12.3.10 Regional Demand and Opportunities
- 12.4 By Deployment Model - Market Size and Forecast, 2025-2035
- 12.4.1 Segment Definition and Scope
- 12.4.2 Historical Market Size, 2018-2025
- 12.4.3 Revenue Forecast, 2025-2035
- 12.4.4 Volume Forecast, 2025-2035
- 12.4.5 Base-Year Market Share, 2025
- 12.4.6 Segment CAGR and Growth Drivers
- 12.4.7 Subsegment Market Size and Forecast
- 12.4.7.1 On-premises
- 12.4.7.2 Managed hosting
- 12.4.7.3 Hybrid
- 12.4.7.4 Cloud-only
- 12.4.8 Subsegment Pricing and Adoption Trends
- 12.4.9 Leading Suppliers and Competition
- 12.4.10 Regional Demand and Opportunities
- 12.5 By End-Use Industry - Market Size and Forecast, 2025-2035
- 12.5.1 Segment Definition and Scope
- 12.5.2 Historical Market Size, 2018-2025
- 12.5.3 Revenue Forecast, 2025-2035
- 12.5.4 Volume Forecast, 2025-2035
- 12.5.5 Base-Year Market Share, 2025
- 12.5.6 Segment CAGR and Growth Drivers
- 12.5.7 Subsegment Market Size and Forecast
- 12.5.7.1 Public research
- 12.5.7.2 Industrial engineering
- 12.5.7.3 Life sciences
- 12.5.7.4 Commercial digital services
- 12.5.8 Subsegment Pricing and Adoption Trends
- 12.5.9 Leading Suppliers and Competition
- 12.5.10 Regional Demand and Opportunities
- 12.6 By Application - Market Size and Forecast, 2025-2035
- 12.6.1 Segment Definition and Scope
- 12.6.2 Historical Market Size, 2018-2025
- 12.6.3 Revenue Forecast, 2025-2035
- 12.6.4 Volume Forecast, 2025-2035
- 12.6.5 Base-Year Market Share, 2025
- 12.6.6 Segment CAGR and Growth Drivers
- 12.6.7 Subsegment Market Size and Forecast
- 12.6.7.1 Simulation
- 12.6.7.2 AI training
- 12.6.7.3 Scientific analytics
- 12.6.7.4 Rendering
- 12.6.8 Subsegment Pricing and Adoption Trends
- 12.6.9 Leading Suppliers and Competition
- 12.6.10 Regional Demand and Opportunities
- 12.7 By Country - Market Size and Forecast, 2025-2035
- 12.7.1 Segment Definition and Scope
- 12.7.2 Historical Market Size, 2018-2025
- 12.7.3 Revenue Forecast, 2025-2035
- 12.7.4 Volume Forecast, 2025-2035
- 12.7.5 Base-Year Market Share, 2025
- 12.7.6 Segment CAGR and Growth Drivers
- 12.7.7 Subsegment Market Size and Forecast
- 12.7.7.1 China
- 12.7.7.2 Japan
- 12.7.7.3 India
- 12.7.7.4 Other Asia-Pacific economies
- 12.7.8 Subsegment Pricing and Adoption Trends
- 12.7.9 Leading Suppliers and Competition
- 12.7.10 Regional Demand and Opportunities
- 12.8 Segment Growth Comparison
- 12.9 Segment Attractiveness and Priority Matrix
Chapter 13 Asia-Pacific High Performance Computing End-Use and Application Market Outlook
- 13.1 End-Use Industry and Customer Demand Structure
- 13.2 Leading Applications and Customer Groups
- 13.3 End-Use Market Size, Share and Forecast
- 13.4 Major End-Use Industry Deep Dives
- 13.4.1 Customer Requirements and Use Cases
- 13.4.2 Demand and Replacement Cycles
- 13.4.3 Technical and Regulatory Considerations
- 13.4.4 Purchasing and Procurement Models
- 13.4.5 Leading Vendors and Distribution Channels
- 13.4.6 Forecast and Commercial Opportunities
- 13.5 Emerging Applications and Cross-Segment Demand
- 13.6 End-Use Industry Investment Priorities
Chapter 14 Asia-Pacific High Performance Computing Geographic Market Outlook, 2025-2035
- 14.1 Regional Market Size and Country-Level Shares, 2025
- 14.2 Country Market Size Comparison, 2025
- 14.3 Country Market Forecasts, 2025-2035
- 14.4 Subregional Industrial and Demand Clusters
- 14.5 Intra-Regional Pricing and Cost Differences
- 14.6 Cross-Border Trade and Supply Networks
- 14.7 Regional Supply and Demand Balances
- 14.8 Country Opportunity Comparison and Prioritization
Note: Every listed country is covered on the structure shown under the first country.
Chapter 15 Asia-Pacific High Performance Computing Technology, Innovation and Sustainability Outlook
- 15.1 Technology Landscape and Maturity
- 15.2 Product, Process and Service Innovation
- 15.3 AI, Automation and Digital Tools in the Industry
- 15.4 Technology Adoption and Performance Benchmarking
- 15.5 Innovation Pipeline and R&D Investment
- 15.6 Patent and Intellectual Property Trends
- 15.7 Energy Efficiency and Resource Management
- 15.8 Sustainability, Recycling and Circularity
- 15.9 Technology Roadmap, 2025-2035
- 15.10 Risks of Obsolescence and Technology Substitution
Chapter 16 Asia-Pacific High Performance Computing Market Key Strategic Imperatives
- 16.1 Growth and Market Entry Priorities
- 16.2 High-Return Products and Segments
- 16.3 Pricing, Profitability and Cost Optimization
- 16.4 Technology Investment and Product Differentiation
- 16.5 Supply Chain Localization and Resilience
- 16.6 Distribution and Customer Acquisition
- 16.7 Partnership, Acquisition and Capacity Strategy
- 16.8 Regional Expansion Priorities
- 16.9 Short-, Medium- and Long-Term Actions
Chapter 17 Competition Outlook
- 17.1 Industry Competition Characteristics
- 17.2 Market Structure and Concentration
- 17.3 Market Share and Competitive Positioning, 2025
- 17.4 Company-Wise Revenue and Product Benchmarking
- 17.5 Production and Service Capacity Benchmarking
- 17.6 Technology, Pricing and Differentiation
- 17.7 Regional Footprint and Distribution Strength
- 17.8 Mergers, Acquisitions and Strategic Alliances
- 17.9 New Entrants and Competitive Threats
- 17.10 Porter's Five Forces and Industry Attractiveness
- 17.11 Competitive Outlook, 2025-2035
Chapter 18 Company Profiles
- 18.1 Company Coverage and Selection Criteria
- 18.2 IEIT Systems
- 18.2.1 Business Description
- 18.2.2 Company Ownership and Geographic Presence
- 18.2.3 Product and Service Portfolio
- 18.2.4 Manufacturing and Operating Footprint
- 18.2.5 Production Capacity and Expansion Plans
- 18.2.6 Financial Performance and Investment
- 18.2.7 Market Share and Competitive Position
- 18.2.8 Technology and Innovation Capabilities
- 18.2.9 Strategic Alliances or Partnerships
- 18.2.10 Recent Developments
- 18.2.11 Growth Strategy and Outlook
- 18.3 Fujitsu
- 18.4 Lenovo
- 18.5 Huawei
- 18.6 Hewlett Packard Enterprise
- 18.7 Other Relevant Market Participants
Note: Every listed company is profiled on the structure shown under the first company. The company list is preliminary and may change based on research findings, market developments, data availability and client requirements.
Chapter 19 Disclaimer
- 19.1 Research and Forecast Disclaimer
- 19.2 Data Source and Estimation Limitations
Note: The depth of individual sections depends on data availability for this market. Volume, capacity, trade and other unit-based metrics are included where applicable.

