
Asia-Pacific laser marking machine demand and scope
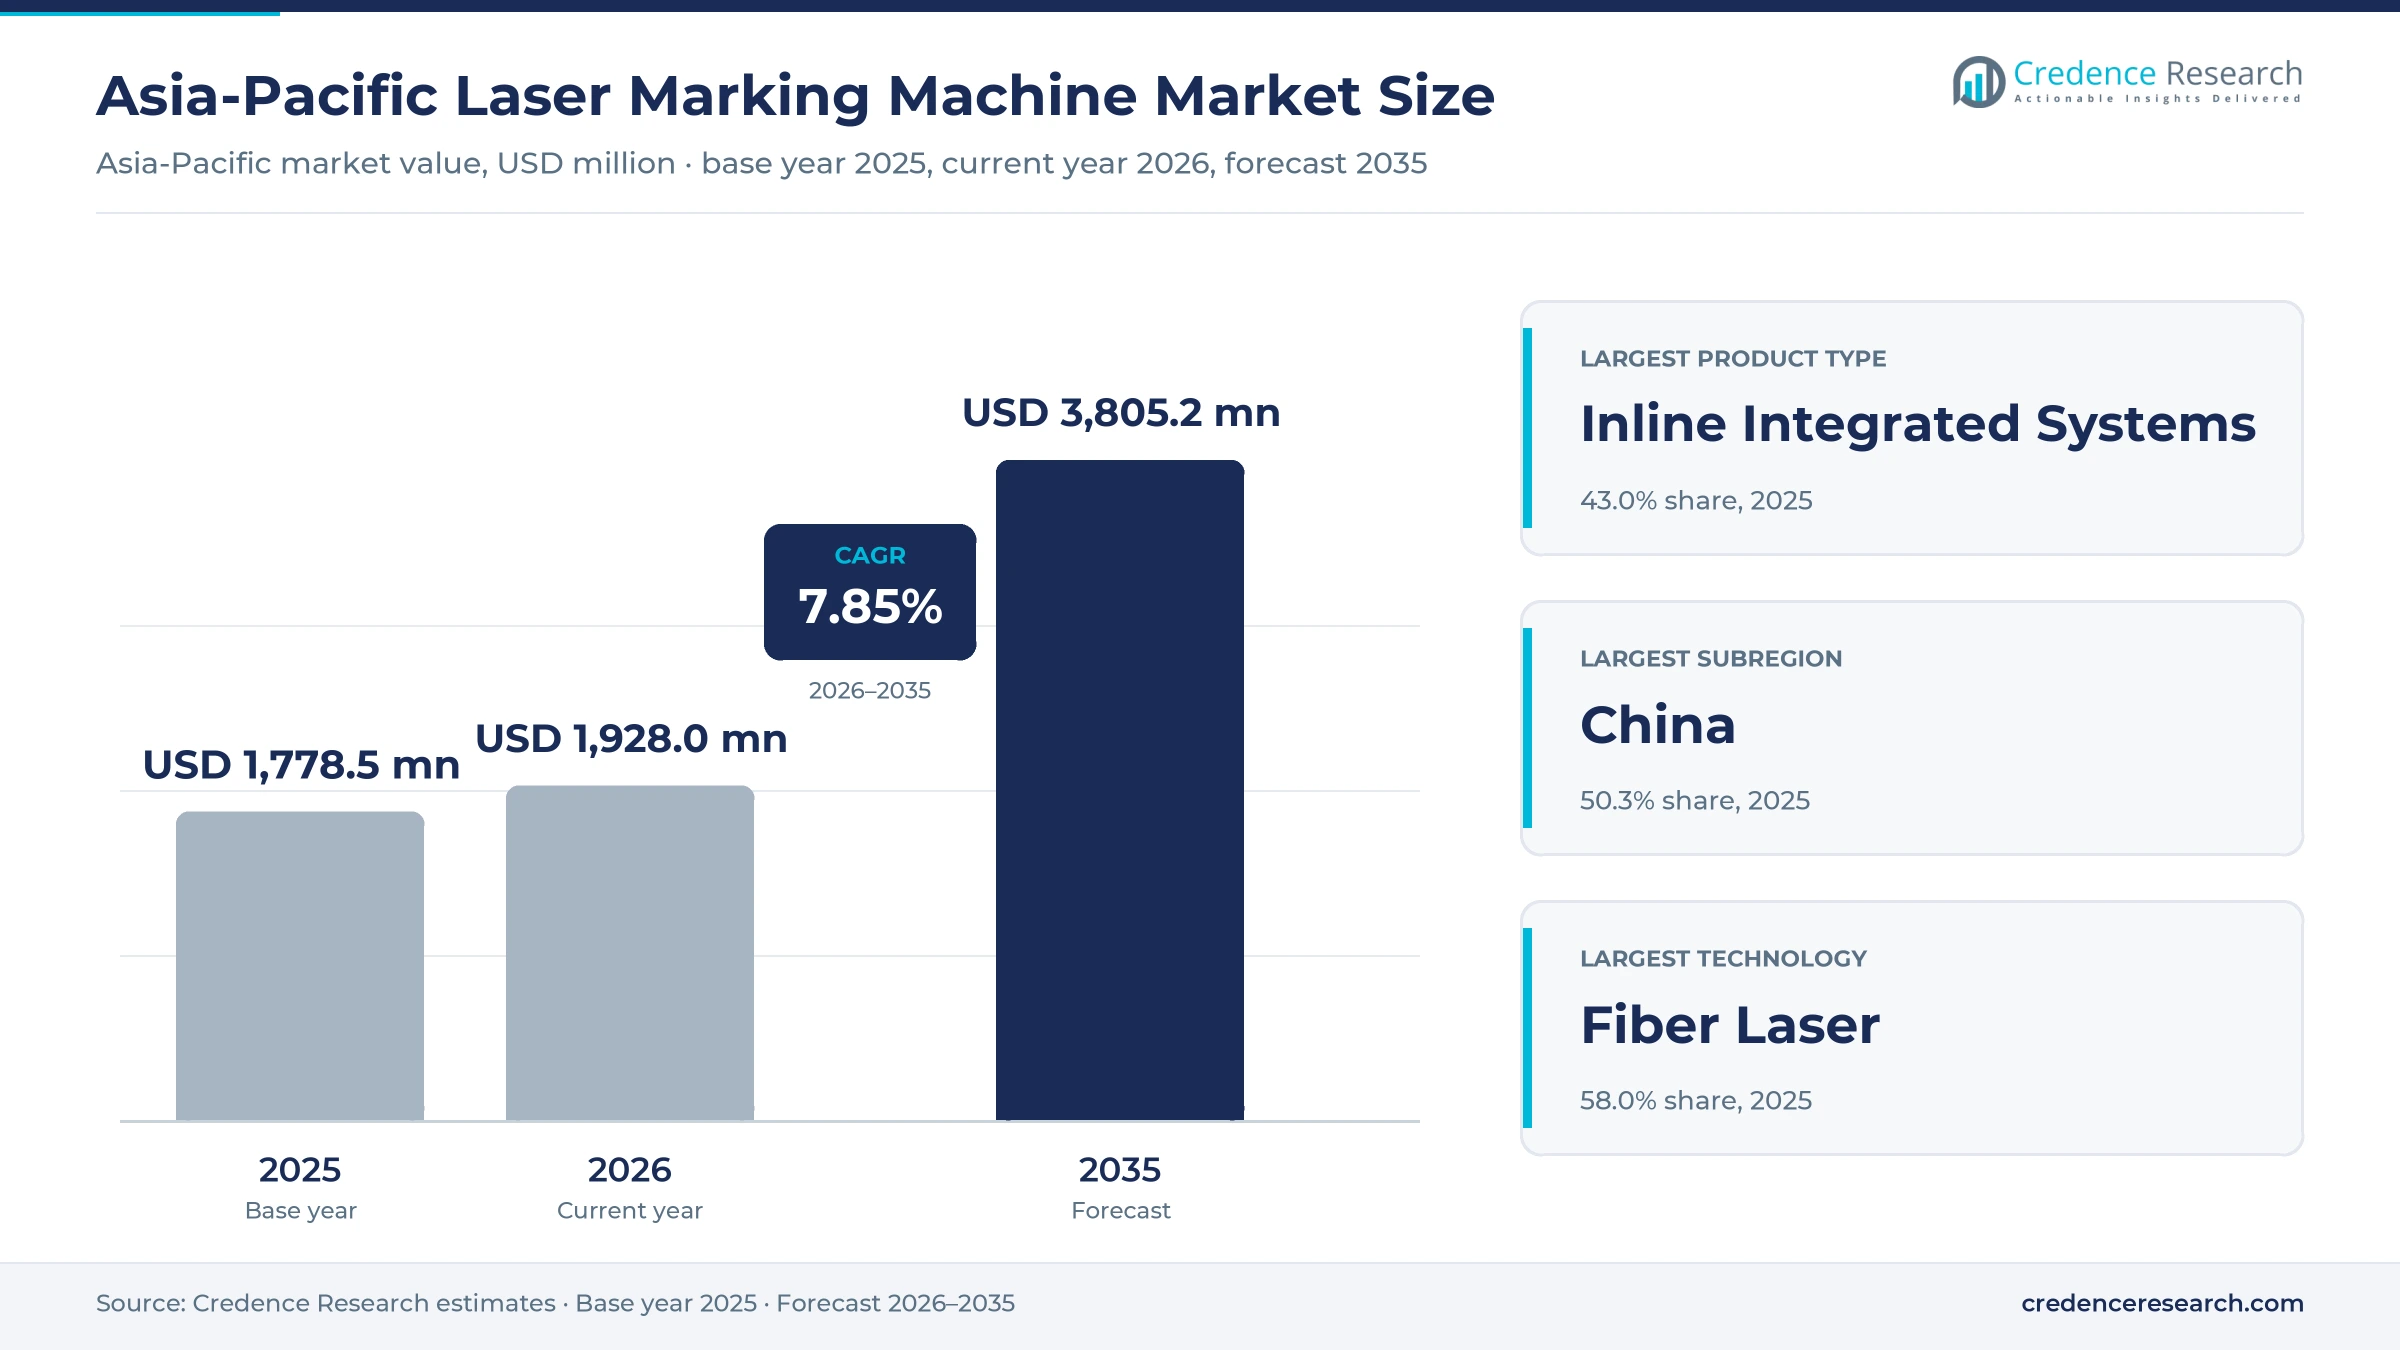
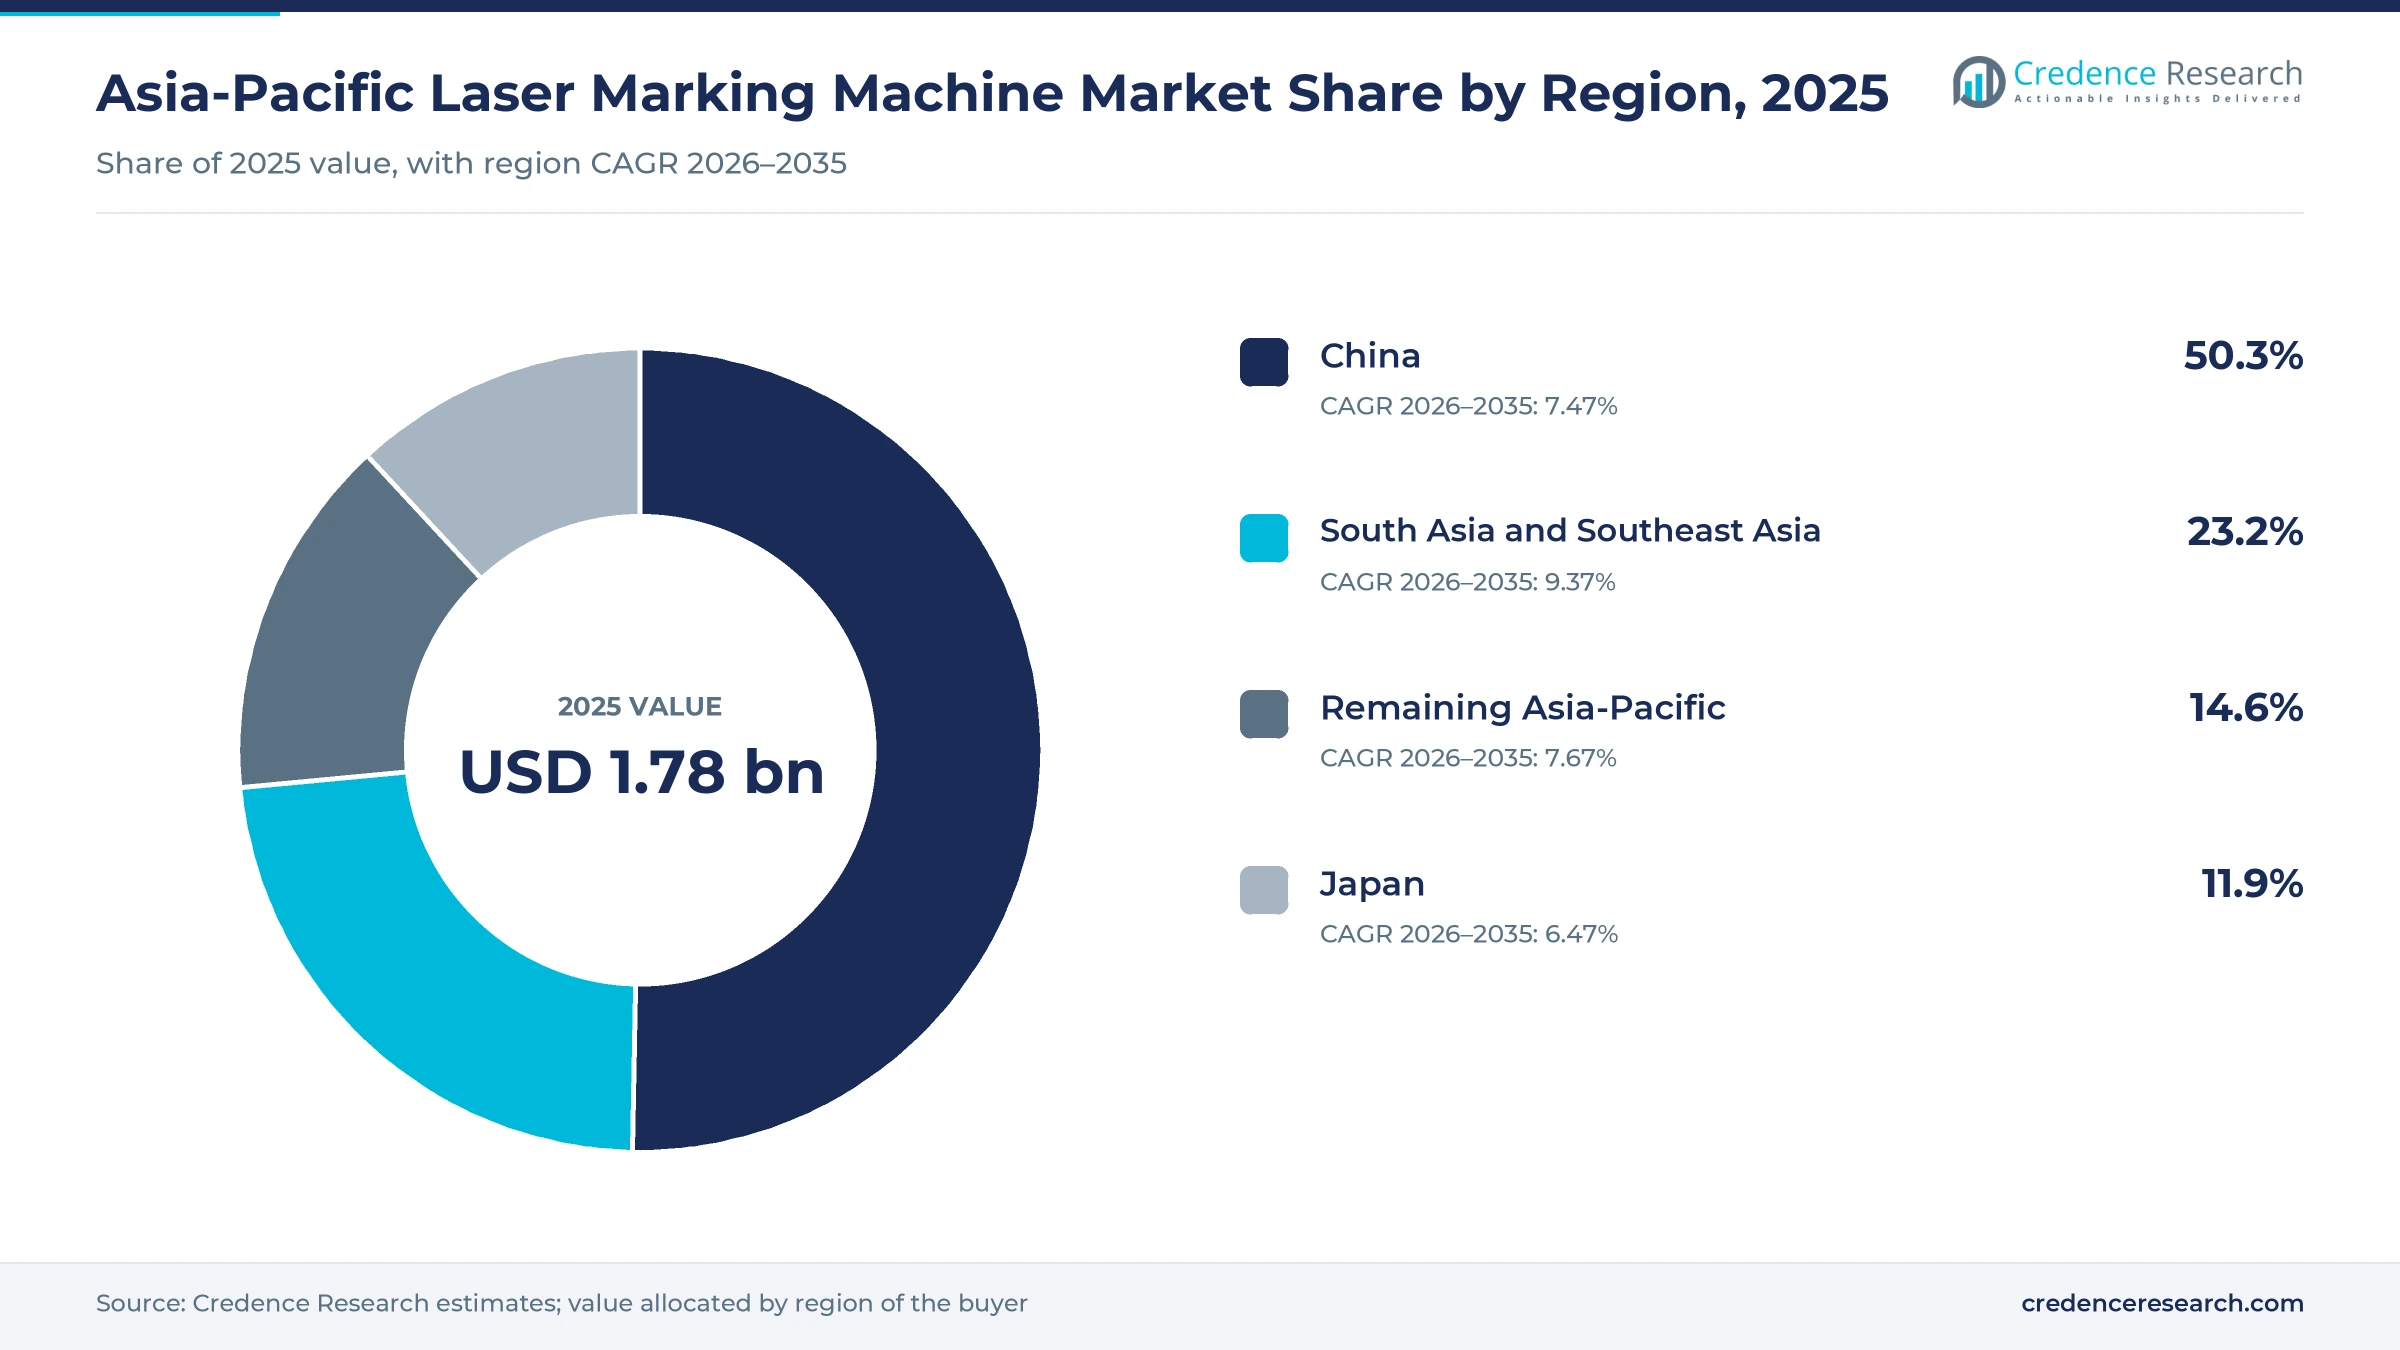
The Asia-Pacific laser marking machine market was valued at USD 1.78 billion in 2025 and is projected to increase from USD 1.93 billion in 2026 to USD 3.81 billion by 2035, registering a CAGR of 7.85% during 2026–2035. Battery makers, electronics assemblers and regulated device producers buy these systems because permanent codes now follow products through production, recall and recycling. China held the largest share, 50.3% in 2025, on the strength of its battery and electronics output. South Asia and Southeast Asia form the fastest-growing subregion at 9.37% a year, as Indian component approvals and Vietnamese electronics exports pull new lines into the area. The most important commercial change is the rule change in China, where a mandatory project approved in March 2026 would set one coding framework for consumer, power and storage batteries. Buyers are also moving toward lines that mark and read in one step, which favors suppliers with built-in vision and verification.
What does a laser marking machine purchase cover in Asia-Pacific?
The market counts new industrial machines that use a fiber, CO2, UV or other solid-state source to write permanent codes, text and logos on parts and packs. Buyers purchase bench-top workstations, inline stations, portable units and compact desktop systems, usually with the controller, scan head and software included. Sales run directly from makers, through authorized distributors or through integrators that build complete lines.
The estimates exclude inkjet and thermal coders, labels, laser cutting and welding equipment, used machines and standalone laser sources sold to machine builders. Contract marking fees are also excluded, although contract providers count as machine buyers. Value is measured at the first sale to the user, so aftermarket service and spare parts stay outside the totals.
Asia-Pacific Laser Marking Machine Market Insights
- Asia-Pacific demand rises from USD 1.78 billion in 2025 to USD 3.81 billion by 2035, a 7.85% annual pace that follows battery, electronics and device coding work.
- China led the region with 50.3% of 2025 value, supported by battery output and by a mandatory coding project approved in March 2026.
- Inline Integrated Systems led with 43.0% of 2025 value because code generation increasingly sits inside the production line rather than beside it.
- India set phased QR deadlines in June 2026, with vaccines, narcotic and anti-cancer drugs due by July 1, 2027, which widens regulated coding demand.
- Han's Laser opened bases in Vietnam and India during 2025, which brings Chinese equipment supply closer to the fastest-growing buyers in the region.
Inline systems and fiber sources take most of the spending
Why do inline integrated systems take the largest budget?
Based on product type, the market is categorized into bench-top workstations, inline integrated systems, portable marking systems and compact desktop systems. Inline Integrated Systems led with 43.0% of 2025 value because China's coding project, approved on March 31, 2026, covers cells, modules, packs, clusters and full systems, so Credence Research expects codes to be applied at several stations along a line. Inline Integrated Systems also grow fastest at 8.49% a year as suppliers merge marking with vision. Keyence's MD-X head, for example, uses a built-in camera to correct X, Y and theta offsets before each mark, according to Keyence product documentation.
How did fiber sources become the default choice?
Based on technology, the market is categorized into fiber laser, CO2 laser, UV laser and non-fiber visible and infrared solid-state laser. Fiber Laser led with 58.0% of 2025 value because domestic source competition is intense, and Raycus reported a gross margin of 23.13% on pulsed fiber lasers in its 2025 annual report. UV Laser grow fastest at 9.39% a year as packaging moves to thin films that heat can damage. Domino launched its Ux360i UV coder at interpack in May 2026 for these films, and it reports QR marking up to 80% faster than its previous UV model.
Which factories buy the most machines today?
Based on end-use industry, the market is categorized into electronics and semiconductors, automotive and EV batteries, medical devices and pharmaceuticals, and diversified manufacturing. Electronics and Semiconductors led with 38.0% of 2025 value because volumes are large, as Vietnam Customs recorded USD 107.75 billion of computer and electronics exports in 2025, up 48.4%. Automotive and EV Batteries grow fastest at 9.13% a year as each pack needs a lasting identity. CnEVPost reported 1,187 GWh of global EV battery installations in 2025, up 31.7%, and CATL and BYD together held 55.6% of that total.
What separates traceability work from regulatory coding?
Based on application, the market is categorized into traceability coding, regulatory identification and branding and personalisation. Traceability Coding led with 54.0% of 2025 value because battery and electronics plants track parts internally, and Amendment No. 1 to China's GB/T 34014-2017 battery coding standard took effect on Aug. 1, 2026. Regulatory Identification grow fastest at 8.70% a year as legal deadlines arrive. China's medical products regulator announced on March 13, 2026 that all Class II devices must carry UDI codes by June 1, 2027, and that Class I devices must follow by June 1, 2029.
| Segment Group | Leading Sub-segment | Share, 2025 | Fastest-growing Sub-segment | CAGR, 2026–2035 |
|---|---|---|---|---|
| By Product Type | Inline Integrated Systems | 43.0% | Inline Integrated Systems | 8.49% |
| By Technology | Fiber Laser | 58.0% | UV Laser | 9.39% |
| By End-Use Industry | Electronics and Semiconductors | 38.0% | Automotive and EV Batteries | 9.13% |
| By Application | Traceability Coding | 54.0% | Regulatory Identification | 8.70% |
Request a Free Sample
Fill in your details and we'll send you a free sample report.
- Sample data tables & charts
- Research methodology
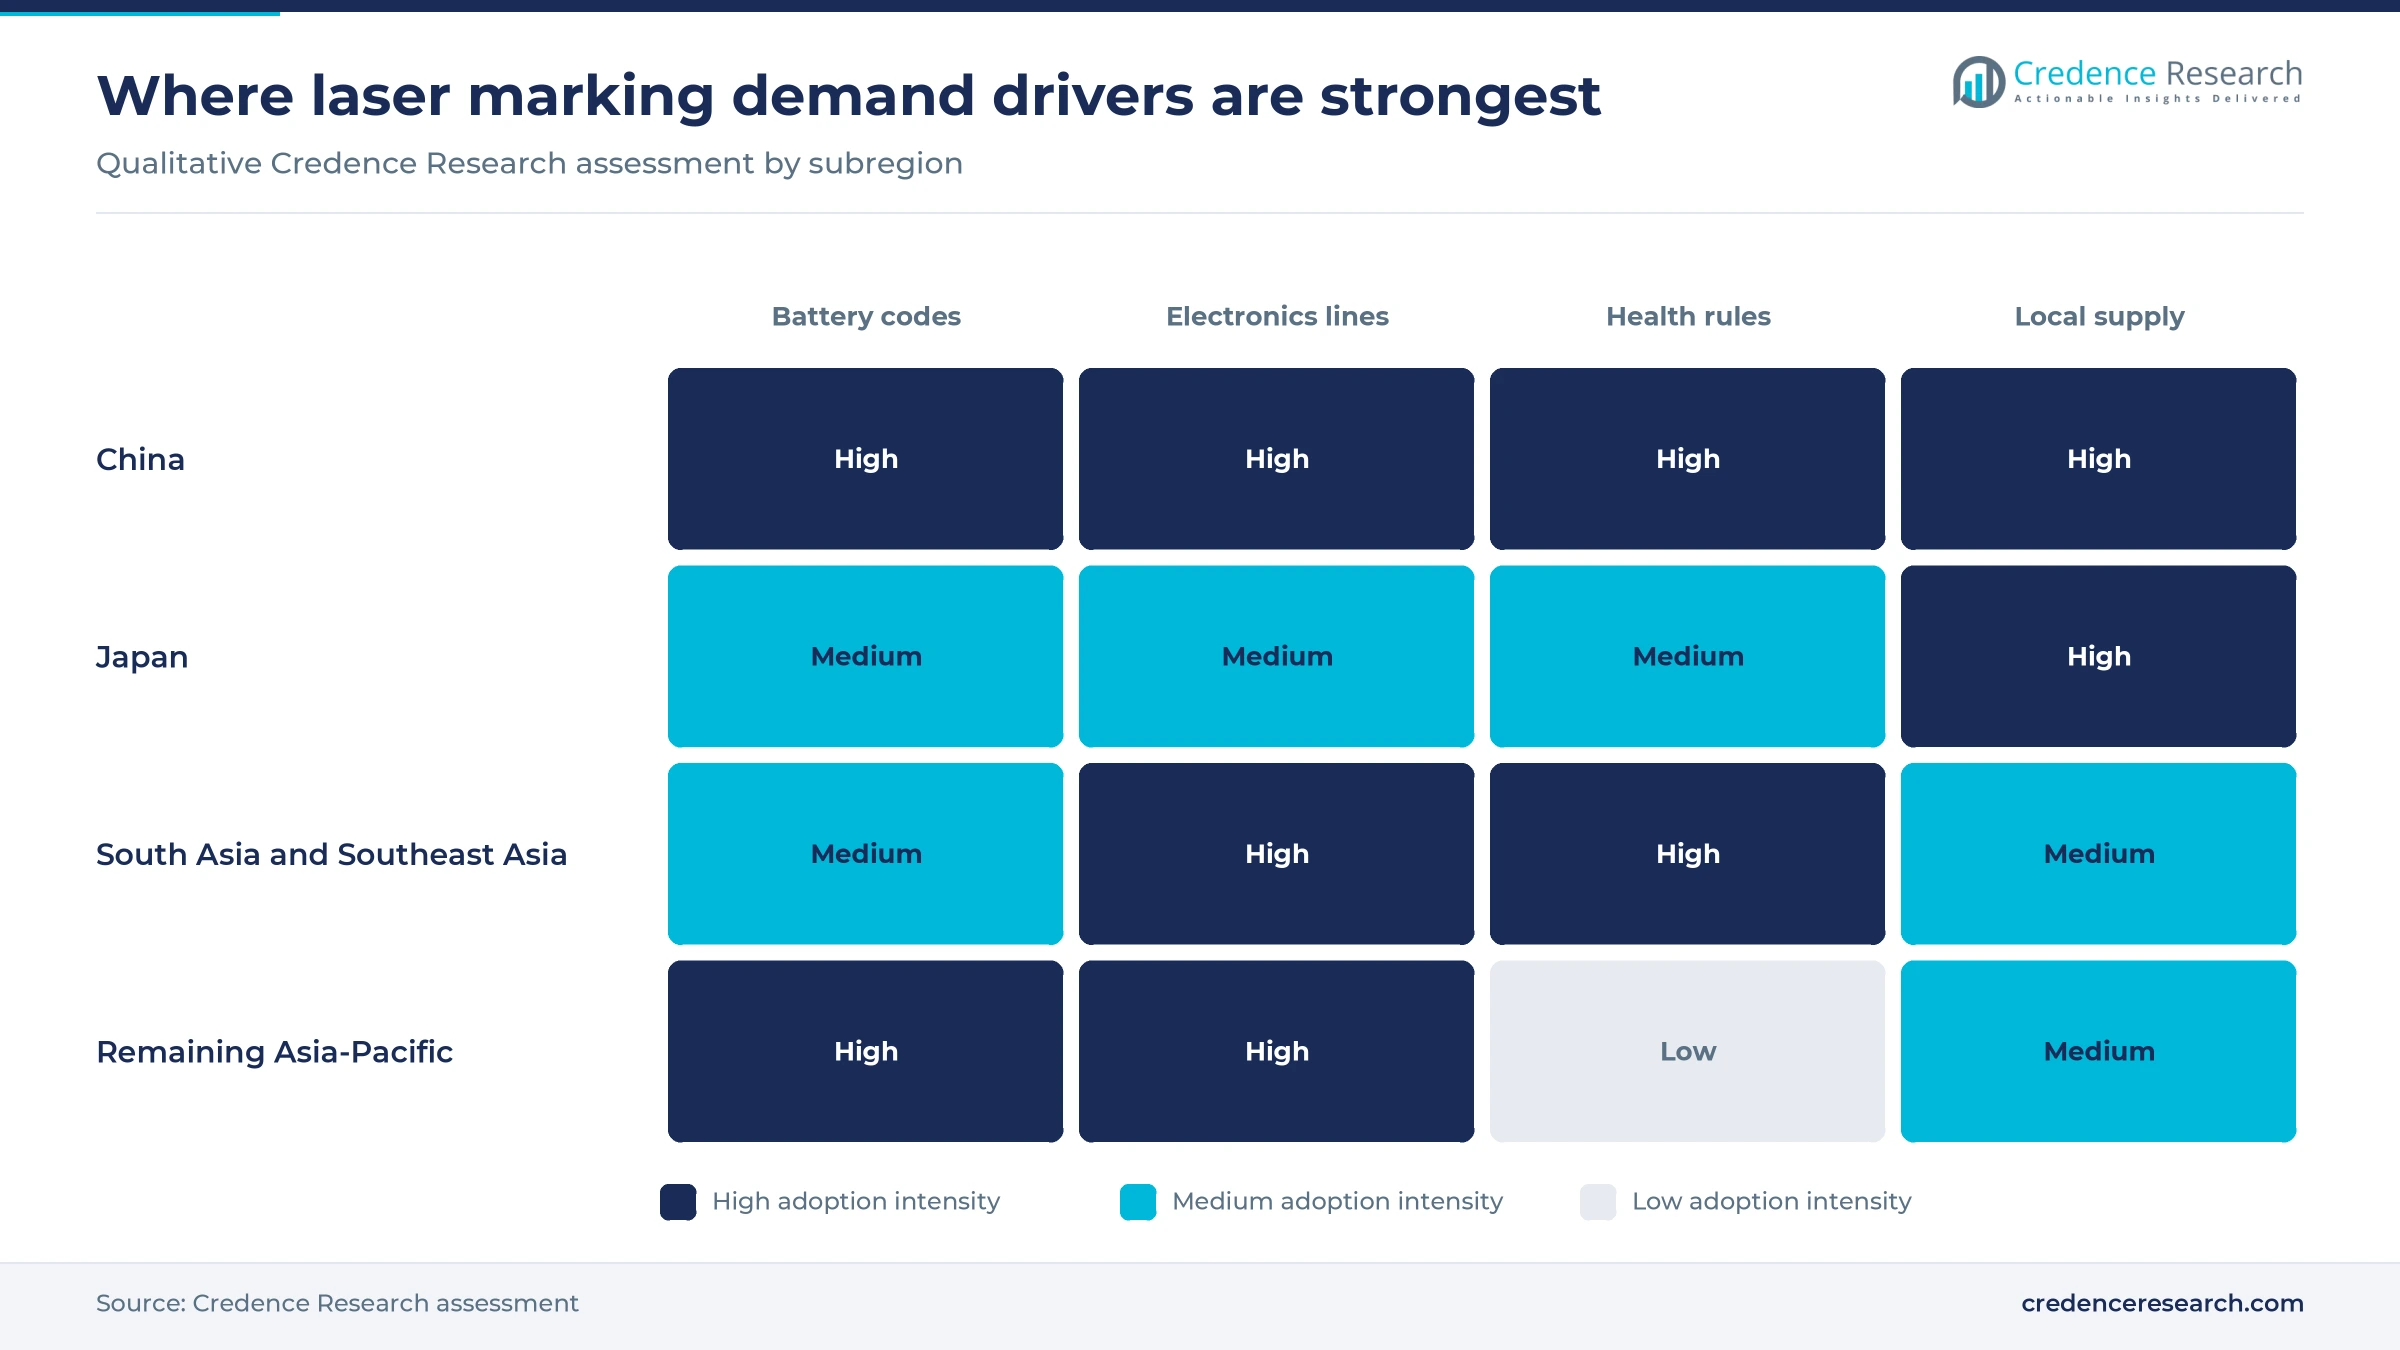
Battery codes and electronics lines lift equipment orders
Battery traceability investment reaches every pack level
Credence Research treats battery traceability as the strongest source of new equipment demand, although the published rules do not prescribe laser marks. CnEVPost reported 1,187 GWh of EV battery installations in 2025, up 31.7% from 901.4 GWh, with CATL and BYD leading. Vehicle data point the same way, as CAAM reported NEV sales of 16.49 million in 2025 and forecast 19 million for 2026, so more packs need codes each year. Japan is adding capacity too, as METI approved up to JPY 347.9 billion for 12 battery projects on Sept. 6, 2024. South Korea began assigning identification numbers at the manufacturing stage in February 2025, according to its transport ministry, with lifecycle tracking due by 2027. These codes usually feed the wider compliance software stack that plants already run.
Electronics production deepens outside the coastal Chinese base
Electronics production is spreading across more countries, and each new assembly line needs its own coding stations. Vietnam Customs data show computer, electronics and component exports of USD 107.75 billion in 2025, an increase of about USD 35.15 billion in one year. India's electronics minister of state told parliament on July 29, 2026 that production reached Rs 13.11 lakh crore in fiscal 2025-26, up 15.8%. India has also approved 75 applications under its Electronics Component Manufacturing Scheme, worth an expected Rs 61,671 crore of investment. Semiconductor capacity adds a further layer, because SEMI forecast in October 2026 that 300mm fab equipment spending would reach USD 149 billion in 2026, up 31%. Wafer and package marks therefore remain a steady line item.
Integrated marking and verification replaces separate inspection
Plants increasingly want a code checked at the moment it is written, because a rejected part costs more once it moves down the line. Keyence builds a camera and distance sensor into its MD-X and MD-U heads, and its documentation says the MD-U also monitors laser output and lens dirt to prevent marking errors. Panasonic Industry sells its LP-ABR10 2D code reader next to its LP-RH CO2 and LP-RV fiber markers, which lets one supplier cover both tasks. Domino's Ux360i, launched in May 2026, connects to ERP and MES systems and writes GS1-compliant 2D codes. Inline systems already held 43.0% of 2025 value, which shows how far this preference has moved budgets toward the line.
Device and drug identification rules widen the buyer base
Health product rules are adding buyers that previously relied on printed labels alone. India's health ministry widened its QR code mandate in June 2026, moving beyond the top 300 brands to vaccines, antimicrobials, narcotic and psychotropic drugs, and anti-cancer drugs. Most of these classes must comply by July 1, 2027, while antimicrobials follow by July 1, 2028. China's NMPA, National Health Commission and National Healthcare Security Administration set UDI dates of June 1, 2027 and June 1, 2029 in a March 13, 2026 notice. Japan's health ministry revised its bar code guideline for medical devices in 2022, according to Emergo by UL. Medical devices and pharmaceuticals accordingly form a smaller but steady group of regulated buyers.
UV coding and local supply open new buying routes
The shift toward UV coding on thin packaging films
UV sources are winning work on packaging that older CO2 and fiber heads can damage, and this shift is moving marking into food and drug plants. Domino describes the Ux360i, launched in May 2026, as a photochemical coder that acts only on the top layer of heat-sensitive plastics and films. The same launch cites more than 50 beam delivery options and QR marking up to 80% faster than the earlier model, which simplifies retrofits on crowded lines. Keyence also lists a dedicated MD-U UV marker with position correction for moving targets, so buyers now have competing options. India's nine-element QR requirement, published in June 2026, adds data density that favors fine, high-contrast marks. UV Laser grow at 9.39% a year, the fastest rate among the source types.
The rise of Chinese equipment bases in neighboring countries
Chinese laser suppliers are moving capacity toward customers rather than shipping everything from home. The LaserFair trade publication reported in June 2026 that Han's Laser production bases in Vietnam, India and Mexico began operating during 2025. Australian Manufacturing reported that Han's announced a USD 150 million Southeast Asian operations center in February 2026. Battery customers are moving in parallel, since EVE Energy began operating its Malaysian base on Feb. 16, 2025, with a design of 684 million cells a year across 15 lines. Thailand's Board of Investment also approved more than USD 1 billion from a Sunwoda unit in March 2025, which shortens service distances and could reduce lead times for machines sold into these plants.
Opportunity in Indian battery and component plants
India offers an opening for suppliers that can serve new lines before local habits and vendor lists settle. The road transport ministry released draft battery pack Aadhaar guidelines in January 2026, according to Mercom India, which would give each pack a nationwide digital identity. Component approvals add scale, with 75 applications and a projected Rs 4.51 lakh crore of production under the electronics scheme. Han's Laser already opened an Indian base in 2025, so local service is becoming a sales requirement. Sellers can also bundle with Indian processing equipment purchases for buyers fitting out several workshops at the same time.
Opportunity in retrofitting Japanese and Korean battery lines
Japan and South Korea offer a replacement opening because many of their projects need higher code quality rather than extra low-cost capacity. METI's September 2024 program lifts Japanese battery capacity from 85 GWh a year to 120 GWh, against a 150 GWh target for 2030. Panasonic and Subaru alone take 16 GWh a year under that plan, while Toyota and its partners take 9 GWh for next-generation cells. South Korea wants lifecycle battery tracking by 2027, according to its transport ministry in February 2025, which raises the value of readable, lasting identity marks. Suppliers with verified code grading can therefore sell broader coding equipment upgrades into plants that already own older stations.
Price erosion and unsettled rules test supplier margins
Source price cuts squeeze machine margins
Falling source prices help buyers, but they weaken the margin that funds service and software. Raycus reported a total gross margin of 20.36% for 2025 in its annual report. Machine makers using commodity sources therefore compete mainly on price in standard workstations. Smaller builders are most exposed, and some may leave the segment. Stronger suppliers respond by selling vision, validation and line integration, which are harder for buyers to compare on price alone.
Factory spending cycles delay equipment orders
Marking machines are capital purchases, so orders can slip when wider factory budgets tighten. CAAM described domestic car demand as sluggish in January 2026 and forecast only 1% total vehicle sales growth. Suppliers tied to one industry feel these pauses first, and distributors carry the stock risk. Service contracts and retrofit offers can soften the effect between larger plant projects. Buyers can also defer marking stations until a new line is confirmed, which pushes machine orders later than the capacity announcement.
Unfinished coding rules complicate line design
Several important rules are still drafts or voluntary, which makes it harder for buyers to freeze machine specifications. China's mandatory battery coding work was only approved as a project on March 31, 2026, and it would replace GB/T 45565-2025. India's battery pack guidelines were still a draft in January 2026. Neither text, as reported, prescribes laser marks specifically, so label makers can compete for the same work. Integrators reduce this risk through software-configurable code formats and modular stations.
Trade friction disrupts imported source supply
Trade measures add delivery and pricing risk for buyers that specify foreign sources or sell into export programs. IPG Photonics warned in May 2025 of potential shipment delays linked to tariffs, according to Optics.org, although most of what it makes for China is produced outside the United States. Plants that need imported high-beam-quality sources face longer planning cycles as a result. Local substitution helps, but validated medical lines cannot change sources quickly.
China leads while South Asia and Southeast Asia grow fastest
| Region | Value, 2025 (USD billion) | Share, 2025 | CAGR, 2026–2035 |
|---|---|---|---|
| China | 0.89 | 50.3% | 7.47% |
| South Asia and Southeast Asia | 0.41 | 23.2% | 9.37% |
| Remaining Asia-Pacific | 0.26 | 14.6% | 7.67% |
| Japan | 0.21 | 11.9% | 6.47% |
China combines battery scale with new coding mandates
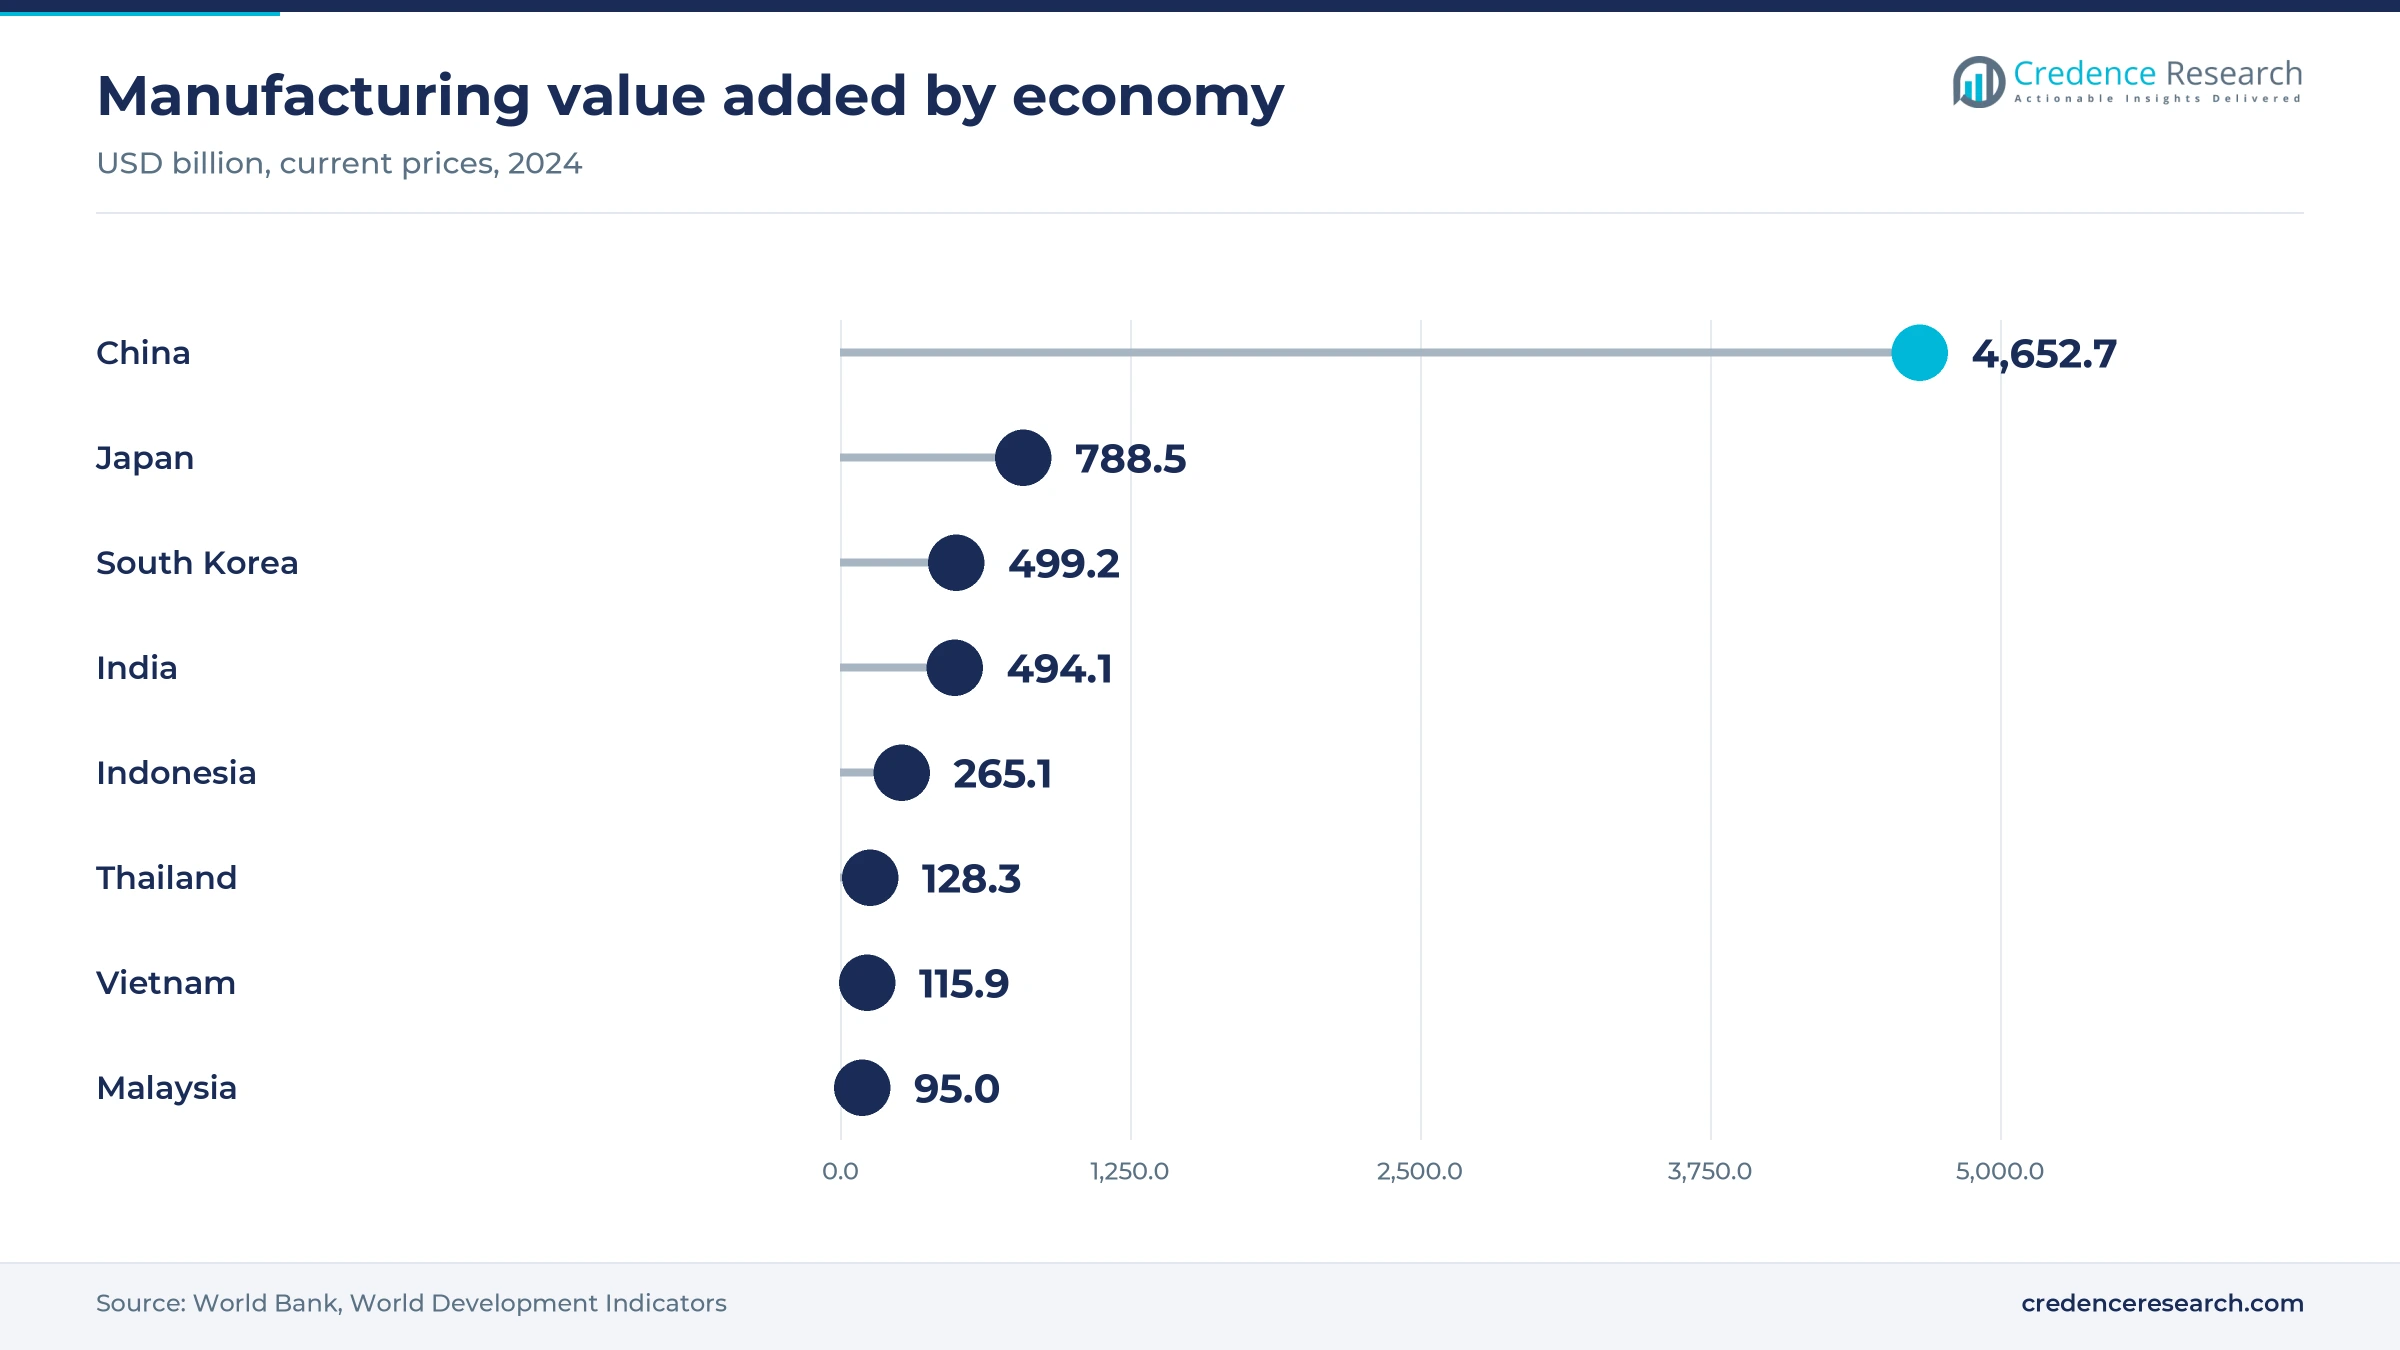
China held 50.3% of 2025 value and grows at 7.47% a year, below the regional pace because its installed base is already large. The Standardization Administration approved a mandatory lithium battery coding project on March 31, 2026, with MIIT as proposer and CESI leading the drafting. Vehicle output adds volume, since CAAM counted 34.4 million vehicle sales in 2025 and 16.49 million NEV sales. World Bank figures show manufacturing value added of about USD 4.65 trillion in 2024, which is far larger than any neighbor.
South Asia and Southeast Asia gains new assembly lines
South Asia and Southeast Asia held 23.2% of 2025 value and is the fastest-growing subregion at 9.37% a year. Vietnam Customs recorded a 48.4% rise in electronics exports during 2025, while India reported 15.8% production growth in fiscal 2025-26. Battery plants reinforce this demand, including the Malaysian base of EVE Energy and the Chonburi project of Sunwoda in Thailand. Han's Laser's bases in Vietnam and India also shorten service distances for local buyers.
Remaining Asia-Pacific depends on Korean chip and battery lines
Remaining Asia-Pacific held 14.6% of 2025 value and grows at 7.67% a year, with South Korea, Taiwan and Australia forming most of its demand. South Korea matters most in Credence Research's model, because World Bank data show about USD 499 billion of manufacturing value added in 2024. EO Technics, based in Anyang, supplies laser and wafer markers to semiconductor customers, according to its SEMI directory listing. Korea's battery identification system, in force since February 2025, adds further demand from cell and pack makers.
Japan buys for quality more than for new volume
Japan held 11.9% of 2025 value and grows slowest at 6.47% a year, since its factories mainly replace or upgrade existing stations. World Bank data show manufacturing value added falling from about USD 855 billion in 2023 to USD 788 billion in 2024, in current dollars. However, METI's 12 subsidized battery projects support new lines at Panasonic, Subaru, Mazda, Nissan and Toyota partners. Keyence and Panasonic Industry both market their systems directly in Japan, which gives buyers strong local support.
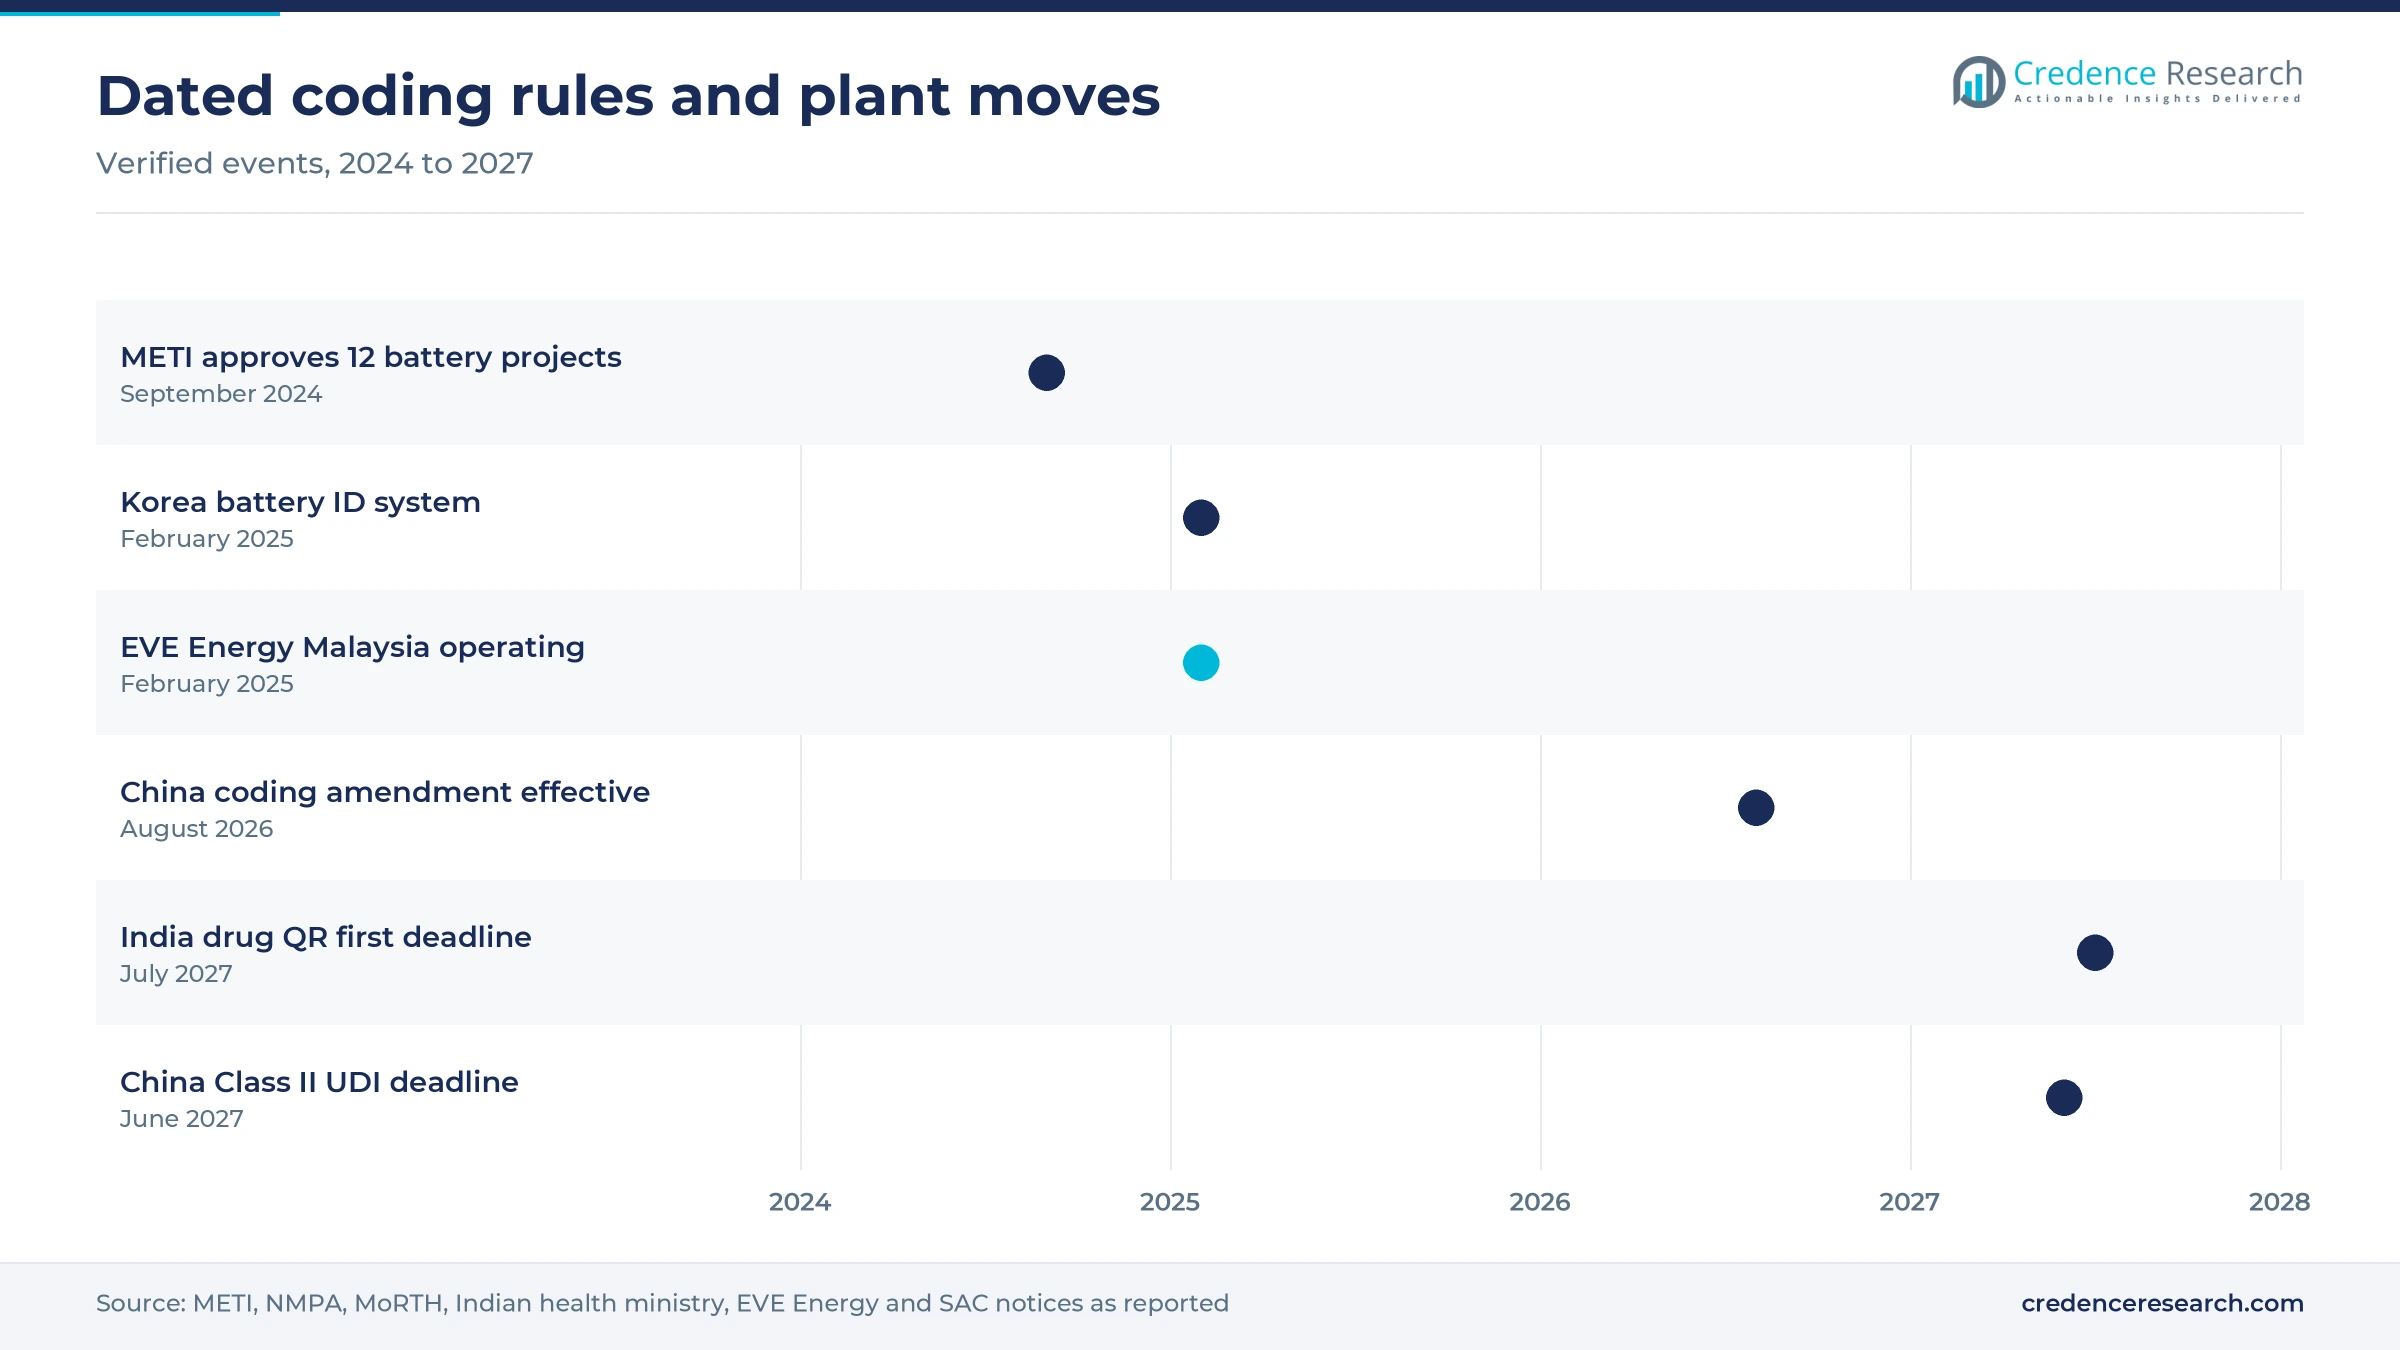
Coding rules and new plants set the 2024 to 2026 record
| Development | Status and market relevance |
|---|---|
| In September 2024, Japan's METI approved up to JPY 347.9 billion for 12 EV battery projects, including a 16 GWh Panasonic and Subaru cell plan. | Approved, supports new domestic lines |
| In February 2025, EVE Energy began operating its Malaysian battery base, designed for 684 million cells a year on 15 lines. | Operating, second-phase buildings finished by February 2026 |
| In January 2026, China issued Amendment No. 1 to its GB/T 34014-2017 battery coding standard, effective Aug. 1, 2026. | In force, voluntary standard |
| In March 2026, China approved a mandatory lithium battery coding project covering consumer, power and storage batteries. | Drafting, would replace GB/T 45565-2025 |
| In June 2026, India widened its drug QR code mandate to vaccines, antimicrobials, narcotic and anti-cancer drugs. | Phased, deadlines in 2027 and 2028 |
Source choice depends on substrate, speed and code quality
- Fiber sources mark metals and many engineering plastics, and they dominate standard parts work because Keyence, Panasonic Industry and Chinese builders all offer them.
- UV sources mark heat-sensitive plastics and films through a photochemical effect, which Domino uses in its Ux360i coder launched in May 2026.
- CO2 sources suit paper, glass and many packaging materials, and Videojet rated its 60-watt 3640 at 600 pharmaceutical products per minute in December 2017.
- Hybrid and green sources cover fine or reflective work, and Keyence lists both its MD-X hybrid and its MD-T telecentric green markers for such jobs.
Need a Custom Version of This Report?
Tailor the scope, geography, or segments to your exact requirements.
- Custom geography or segment scope
- Direct access to our analyst team
Local scale competes with Japanese vision-led systems
Competition splits between Chinese volume builders, Japanese vision-led suppliers and global coding specialists serving packaging lines. Han's Laser lists fiber and UV marking equipment alongside welding and PCB systems, which lets it bundle marking into larger factory orders. Keyence sells several source types with built-in cameras and sensors, while Panasonic Industry pairs its markers with a 2D code reader. EO Technics focuses on semiconductor customers through laser and wafer markers from Korea. Domino, Videojet and Markem-Imaje approach the region from coding, and they compete on regulated packaging lines where validation and uptime matter. Raycus shapes costs across the field as a major source supplier. Buyers increasingly compare software, verification and local service, because basic marking quality has converged among established suppliers.
Companies profiled and their roles in this market
| Company | Type | Role in the market |
|---|---|---|
| Han's Laser | Chinese equipment group | Sells fiber and UV marking equipment and began bases in Vietnam and India in 2025 |
| Keyence | Japanese automation supplier | Offers MD-X, MD-U, MD-F, ML-Z and MD-T markers with built-in sensing |
| Panasonic Industry | Japanese component and systems supplier | Sells LP-RH CO2 and LP-RV fiber markers plus the LP-ABR10 code reader |
| EO Technics | Korean semiconductor equipment maker | Supplies laser markers and wafer markers from Anyang |
| Domino Printing Sciences | Coding specialist | Launched the Ux360i UV coder for films and pharmaceutical packs in May 2026 |
| Videojet Technologies | Coding specialist | Markets laser marking machines to Indian buyers through its local site |
| Markem-Imaje | Coding specialist | Sells SmartLase CO2 laser coders and runs a Bhiwadi site for coder assembly and support |
| Raycus Laser | Chinese source supplier | Supplies fiber sources to machine builders |
Credence Research view on where orders will concentrate
Credence Research's view is that the next decade favors suppliers that sell an audited code rather than only a mark. Battery rules in China, Korea and India all link a physical identity to a database, so failed reads carry a compliance cost. Chinese builders should keep winning standard stations on price, particularly as Han's Laser localizes in Vietnam and India. Japanese suppliers are better placed in high-value lines that need vision and documented reliability. The most assumption-heavy estimate here is the split among product formats, because no public statistics separate them.
How Credence Research built these estimates
The report uses 2025 as the base year and 2035 as the forecast year. Market values come from the Credence Research model, and subregional and segment splits are Credence Research estimates informed by public manufacturing, battery and electronics data. Sources used include the World Bank, national customs and ministry statements, regulators, standards notices, company product pages and named trade press opened during research. No interviews or surveys were conducted for this edition of the report.
Rule deadlines and plant moves shape the 2035 outlook
The market is expected to reach USD 3.81 billion by 2035, with growth moving gradually from Chinese stations toward South Asian and Southeast Asian plants. The June 1, 2029 UDI date in China and the July 1, 2028 antimicrobial date in India should keep regulated buyers active through the decade. Battery work remains the swing factor, because CAAM already expects NEV growth to slow to 15.2% in 2026. Buyers should also weigh worldwide equipment pricing before specifying, since local and imported systems continue to converge.
Frequently Asked Questions
How big is the Asia-Pacific laser marking machine market?
Which subregion leads the market?
Which subregion grows fastest?
Which product format has the largest share?
Why are battery rules important for this market?
Which laser source grows fastest?
Which medical rules affect demand?
Which companies are active in the region?
Table of Content
Chapter 1 Market Segmentation
- 1.1 Segmentation Framework
- 1.1.1 Product and Service Classification
- 1.1.2 Application and End-Use Classification
- 1.1.3 Technology and Solution Classification
- 1.1.4 Customer and Distribution Channel Classification
- 1.1.5 Geographic Segmentation
- 1.1.6 Market Segment Definitions and Boundaries
- 1.2 By Product Type
- 1.2.1 Inline Integrated Systems
- 1.2.2 Bench-Top Workstations
- 1.2.3 Compact Desktop Systems
- 1.2.4 Portable Marking Systems
- 1.3 By Technology
- 1.3.1 Fiber Laser
- 1.3.2 UV Laser
- 1.3.3 CO2 Laser
- 1.3.4 Non-Fiber Visible and Infrared Solid-State Laser
- 1.4 By End-Use Industry
- 1.4.1 Electronics and Semiconductors
- 1.4.2 Automotive and EV Batteries
- 1.4.3 Diversified Manufacturing
- 1.4.4 Medical Devices and Pharmaceuticals
- 1.5 By Application
- 1.5.1 Traceability Coding
- 1.5.2 Regulatory Identification
- 1.5.3 Branding and Personalisation
Chapter 2 Introduction
- 2.1 Report Objectives and Scope
- 2.2 Product Definition and Industry Terminology
- 2.3 Market Inclusions and Exclusions
- 2.4 Research Process
- 2.4.1 Primary Research and Expert Interviews
- 2.4.2 Secondary Research and Source Review
- 2.4.3 Top-Down and Bottom-Up Estimation
- 2.4.4 Data Triangulation and Verification
- 2.5 Market Size Measurement Basis
- 2.5.1 2025: USD 1.78 billion → 2035: USD 3.81 billion
- 2.6 Historical and Forecast Reference Periods
- 2.6.1 Historical Period: 2018-2025
- 2.6.2 Base Year: 2025
- 2.6.3 Forecast Period: 2025-2035
- 2.7 Research Assumptions and Limitations
Chapter 3 Executive Summary
- 3.1 Market Snapshot and Key Findings
- 3.2 Base-Year Market Size, 2025
- 3.3 Forecast Market Size, 2035
- 3.4 Revenue and Volume Growth Outlook
- 3.5 Key Demand and Supply Indicators
- 3.6 Leading Market Segments
- 3.7 Fastest-Growing Market Opportunities
- 3.8 Regional Performance Highlights
- 3.9 Technology and Industry Transformation
- 3.10 Competitive Landscape Summary
- 3.11 Analyst View and Strategic Implications
Chapter 4 Asia-Pacific Laser Marking Machine Market Trends and Developments
- 4.1 Historical Industry Development, 2018-2025
- 4.2 Recent Market Trends and Developments
- 4.3 Demand and Customer Behavior Trends
- 4.4 Technology and Product Innovation
- 4.5 Artificial Intelligence, Automation and Digitalization
- 4.6 Local Manufacturing and Supply Chain Realignment
- 4.7 Industry Partnerships, Mergers and Acquisitions
- 4.8 Sustainability and Circular Economy Developments
- 4.9 Government and Private Sector Investment Trends
- 4.10 Emerging Business Models and Commercialization
- 4.11 Industry Developments and Announcements
Chapter 5 Asia-Pacific Laser Marking Machine Market Production, Supply and Demand Analysis
- 5.1 Demand Trend and Consumption Analysis, 2018-2025
- 5.2 Demand Forecast, 2025-2035
- 5.3 Production and Output Trend, 2018-2025
- 5.4 Production and Output Forecast, 2025-2035
- 5.5 Installed Capacity and Capacity Utilization
- 5.6 Company-Wise Production Plants and Statistics
- 5.6.1 Installed Production Capacity
- 5.6.2 Actual Production
- 5.6.3 Planned Capacity and Expansion Targets
- 5.7 Supply Chain Structure and Procurement Trends
- 5.8 Supply-Demand Gap and Bottlenecks
- 5.9 Import Dependence and Sourcing Structure
- 5.10 Contract Manufacturing and Outsourcing
- 5.11 Regional Supply and Demand Concentration
Chapter 6 Asia-Pacific Laser Marking Machine Market Pricing Analysis
- 6.1 Pricing Structure and Measurement
- 6.2 Historical Pricing Trends, 2018-2025
- 6.3 Pricing Outlook, 2025-2035
- 6.4 Average Selling Price and Unit Economics
- 6.5 Pricing by Product and Market Segment
- 6.6 Geographic Pricing Differences
- 6.7 Key Input, Energy, Labor and Logistics Costs
- 6.8 Contract Pricing and Purchasing Models
- 6.9 Pricing Sensitivity and Competitive Positioning
- 6.10 Price, Margin and Profitability Implications
Chapter 7 Asia-Pacific Laser Marking Machine Market Dynamics
- 7.1 Market Growth Drivers
- 7.1.1 Demand-Side Drivers
- 7.1.2 Technology and Innovation Drivers
- 7.1.3 Infrastructure and Investment Drivers
- 7.1.4 Regulatory and Policy Drivers
- 7.2 Market Restraints
- 7.2.1 Cost and Affordability Constraints
- 7.2.2 Technology and Adoption Barriers
- 7.2.3 Supply Chain and Operational Constraints
- 7.3 Market Challenges
- 7.3.1 Competitive Pressure and Margin Erosion
- 7.3.2 Skills, Infrastructure and Implementation Gaps
- 7.4 Emerging Market Opportunities
- 7.5 Market Dynamics Impact and Time-Horizon Assessment
Chapter 8 Asia-Pacific Laser Marking Machine Value Chain Analysis
- 8.1 Industry Value Chain Overview
- 8.2 Upstream Suppliers and Critical Inputs
- 8.3 Technology and Component Providers
- 8.4 Manufacturing or Service Delivery
- 8.5 Distribution, Channel Partners and Integrators
- 8.6 Downstream Applications and End Users
- 8.7 Value Addition and Profit Pools
- 8.8 Vertical Integration and Outsourcing
- 8.9 Supplier Concentration and Risk
- 8.10 Supply Chain Localization and Resilience
Chapter 9 Asia-Pacific Laser Marking Machine Market Regulations and Policies
- 9.1 Relevant Laws, Standards and Compliance Frameworks
- 9.2 Product, Service, Safety and Quality Requirements
- 9.3 Government Policies, Incentives and Subsidies
- 9.4 Imports, Exports and Trade Barriers
- 9.5 Public Procurement and Local Content Requirements
- 9.6 Environmental and Sustainability Compliance
- 9.7 Upcoming Policy Changes and Market Implications
Chapter 10 Asia-Pacific Laser Marking Machine Market Hotspots and Opportunities
- 10.1 Market Opportunity Mapping and Growth Hotspots
- 10.2 High-Growth Applications and Customer Groups
- 10.3 Underserved Markets and White-Space Opportunities
- 10.4 Emerging Technology and Product Opportunities
- 10.5 New Capacity and Investment Hotspots
- 10.6 Market Entry and Expansion Opportunities
- 10.7 Distribution and Partnership Opportunities
- 10.8 Near-Term and Long-Term Commercial Potential
- 10.9 Opportunity Attractiveness and Execution Risks
Chapter 11 Asia-Pacific Laser Marking Machine Market Outlook, 2025-2035
- 11.1 Market Size and Analysis
- 11.1.1 Revenue (Market Measurement: 2025: USD 1.78 billion → 2035: USD 3.81 billion)
- 11.1.2 Market Volume and Quantity Sold
- 11.1.3 Historical Market Size, 2018-2025
- 11.1.4 Base-Year Market Size, 2025
- 11.2 Market Forecast, 2025-2035
- 11.2.1 Revenue Forecast to 2035
- 11.2.2 Volume Forecast to 2035
- 11.2.3 CAGR and Year-on-Year Growth
- 11.2.4 Incremental Revenue Opportunity
- 11.3 Forecast Assumptions and Scenario Analysis
- 11.3.1 Base-Case Forecast
- 11.3.2 Optimistic and Conservative Scenarios
- 11.3.3 Technology, Pricing and Policy Sensitivities
- 11.4 Market Attractiveness and Growth Outlook
Chapter 12 Asia-Pacific Laser Marking Machine Market Segmentation and Outlook
- 12.1 Segmentation Summary and Market Shares, 2025
- 12.2 Largest and Fastest-Growing Segments
- 12.3 By Product Type - Market Size and Forecast, 2025-2035
- 12.3.1 Segment Definition and Scope
- 12.3.2 Historical Market Size, 2018-2025
- 12.3.3 Revenue Forecast, 2025-2035
- 12.3.4 Volume Forecast, 2025-2035
- 12.3.5 Base-Year Market Share, 2025
- 12.3.6 Segment CAGR and Growth Drivers
- 12.3.7 Subsegment Market Size and Forecast
- 12.3.7.1 Inline Integrated Systems
- 12.3.7.2 Bench-Top Workstations
- 12.3.7.3 Compact Desktop Systems
- 12.3.7.4 Portable Marking Systems
- 12.3.8 Subsegment Pricing and Adoption Trends
- 12.3.9 Leading Suppliers and Competition
- 12.3.10 Regional Demand and Opportunities
- 12.4 By Technology - Market Size and Forecast, 2025-2035
- 12.4.1 Segment Definition and Scope
- 12.4.2 Historical Market Size, 2018-2025
- 12.4.3 Revenue Forecast, 2025-2035
- 12.4.4 Volume Forecast, 2025-2035
- 12.4.5 Base-Year Market Share, 2025
- 12.4.6 Segment CAGR and Growth Drivers
- 12.4.7 Subsegment Market Size and Forecast
- 12.4.7.1 Fiber Laser
- 12.4.7.2 UV Laser
- 12.4.7.3 CO2 Laser
- 12.4.7.4 Non-Fiber Visible and Infrared Solid-State Laser
- 12.4.8 Subsegment Pricing and Adoption Trends
- 12.4.9 Leading Suppliers and Competition
- 12.4.10 Regional Demand and Opportunities
- 12.5 By End-Use Industry - Market Size and Forecast, 2025-2035
- 12.5.1 Segment Definition and Scope
- 12.5.2 Historical Market Size, 2018-2025
- 12.5.3 Revenue Forecast, 2025-2035
- 12.5.4 Volume Forecast, 2025-2035
- 12.5.5 Base-Year Market Share, 2025
- 12.5.6 Segment CAGR and Growth Drivers
- 12.5.7 Subsegment Market Size and Forecast
- 12.5.7.1 Electronics and Semiconductors
- 12.5.7.2 Automotive and EV Batteries
- 12.5.7.3 Diversified Manufacturing
- 12.5.7.4 Medical Devices and Pharmaceuticals
- 12.5.8 Subsegment Pricing and Adoption Trends
- 12.5.9 Leading Suppliers and Competition
- 12.5.10 Regional Demand and Opportunities
- 12.6 By Application - Market Size and Forecast, 2025-2035
- 12.6.1 Segment Definition and Scope
- 12.6.2 Historical Market Size, 2018-2025
- 12.6.3 Revenue Forecast, 2025-2035
- 12.6.4 Volume Forecast, 2025-2035
- 12.6.5 Base-Year Market Share, 2025
- 12.6.6 Segment CAGR and Growth Drivers
- 12.6.7 Subsegment Market Size and Forecast
- 12.6.7.1 Traceability Coding
- 12.6.7.2 Regulatory Identification
- 12.6.7.3 Branding and Personalisation
- 12.6.8 Subsegment Pricing and Adoption Trends
- 12.6.9 Leading Suppliers and Competition
- 12.6.10 Regional Demand and Opportunities
- 12.7 Segment Growth Comparison
- 12.8 Segment Attractiveness and Priority Matrix
Chapter 13 Asia-Pacific Laser Marking Machine End-Use and Application Market Outlook
- 13.1 End-Use Industry and Customer Demand Structure
- 13.2 Leading Applications and Customer Groups
- 13.3 End-Use Market Size, Share and Forecast
- 13.4 Major End-Use Industry Deep Dives
- 13.4.1 Customer Requirements and Use Cases
- 13.4.2 Demand and Replacement Cycles
- 13.4.3 Technical and Regulatory Considerations
- 13.4.4 Purchasing and Procurement Models
- 13.4.5 Leading Vendors and Distribution Channels
- 13.4.6 Forecast and Commercial Opportunities
- 13.5 Emerging Applications and Cross-Segment Demand
- 13.6 End-Use Industry Investment Priorities
Chapter 14 Asia-Pacific Laser Marking Machine Geographic Market Outlook, 2025-2035
- 14.1 Regional Market Size and Country-Level Shares, 2025
- 14.2 Country Market Size Comparison, 2025
- 14.3 Country Market Forecasts, 2025-2035
- 14.4 Subregional Industrial and Demand Clusters
- 14.5 Intra-Regional Pricing and Cost Differences
- 14.6 Cross-Border Trade and Supply Networks
- 14.7 Regional Supply and Demand Balances
- 14.8 Country Opportunity Comparison and Prioritization
Note: Every listed country is covered on the structure shown under the first country.
Chapter 15 Asia-Pacific Laser Marking Machine Technology, Innovation and Sustainability Outlook
- 15.1 Technology Landscape and Maturity
- 15.2 Product, Process and Service Innovation
- 15.3 AI, Automation and Digital Tools in the Industry
- 15.4 Technology Adoption and Performance Benchmarking
- 15.5 Innovation Pipeline and R&D Investment
- 15.6 Patent and Intellectual Property Trends
- 15.7 Energy Efficiency and Resource Management
- 15.8 Sustainability, Recycling and Circularity
- 15.9 Technology Roadmap, 2025-2035
- 15.10 Risks of Obsolescence and Technology Substitution
Chapter 16 Asia-Pacific Laser Marking Machine Market Key Strategic Imperatives
- 16.1 Growth and Market Entry Priorities
- 16.2 High-Return Products and Segments
- 16.3 Pricing, Profitability and Cost Optimization
- 16.4 Technology Investment and Product Differentiation
- 16.5 Supply Chain Localization and Resilience
- 16.6 Distribution and Customer Acquisition
- 16.7 Partnership, Acquisition and Capacity Strategy
- 16.8 Regional Expansion Priorities
- 16.9 Short-, Medium- and Long-Term Actions
Chapter 17 Competition Outlook
- 17.1 Industry Competition Characteristics
- 17.2 Market Structure and Concentration
- 17.3 Market Share and Competitive Positioning, 2025
- 17.4 Company-Wise Revenue and Product Benchmarking
- 17.5 Production and Service Capacity Benchmarking
- 17.6 Technology, Pricing and Differentiation
- 17.7 Regional Footprint and Distribution Strength
- 17.8 Mergers, Acquisitions and Strategic Alliances
- 17.9 New Entrants and Competitive Threats
- 17.10 Porter's Five Forces and Industry Attractiveness
- 17.11 Competitive Outlook, 2025-2035
Chapter 18 Company Profiles
- 18.1 Company Coverage and Selection Criteria
- 18.2 Han's Laser
- 18.2.1 Business Description
- 18.2.2 Company Ownership and Geographic Presence
- 18.2.3 Product and Service Portfolio
- 18.2.4 Manufacturing and Operating Footprint
- 18.2.5 Production Capacity and Expansion Plans
- 18.2.6 Financial Performance and Investment
- 18.2.7 Market Share and Competitive Position
- 18.2.8 Technology and Innovation Capabilities
- 18.2.9 Strategic Alliances or Partnerships
- 18.2.10 Recent Developments
- 18.2.11 Growth Strategy and Outlook
- 18.3 Keyence
- 18.4 Panasonic Industry
- 18.5 EO Technics
- 18.6 Domino Printing Sciences
- 18.7 Videojet Technologies
- 18.8 Markem-Imaje
- 18.9 Raycus Laser
- 18.10 Other Relevant Market Participants
Note: Every listed company is profiled on the structure shown under the first company. The company list is preliminary and may change based on research findings, market developments, data availability and client requirements.
Chapter 19 Disclaimer
- 19.1 Research and Forecast Disclaimer
- 19.2 Data Source and Estimation Limitations
Note: The depth of individual sections depends on data availability for this market. Volume, capacity, trade and other unit-based metrics are included where applicable.

