
Radar, 5G and satellite programs anchor regional demand
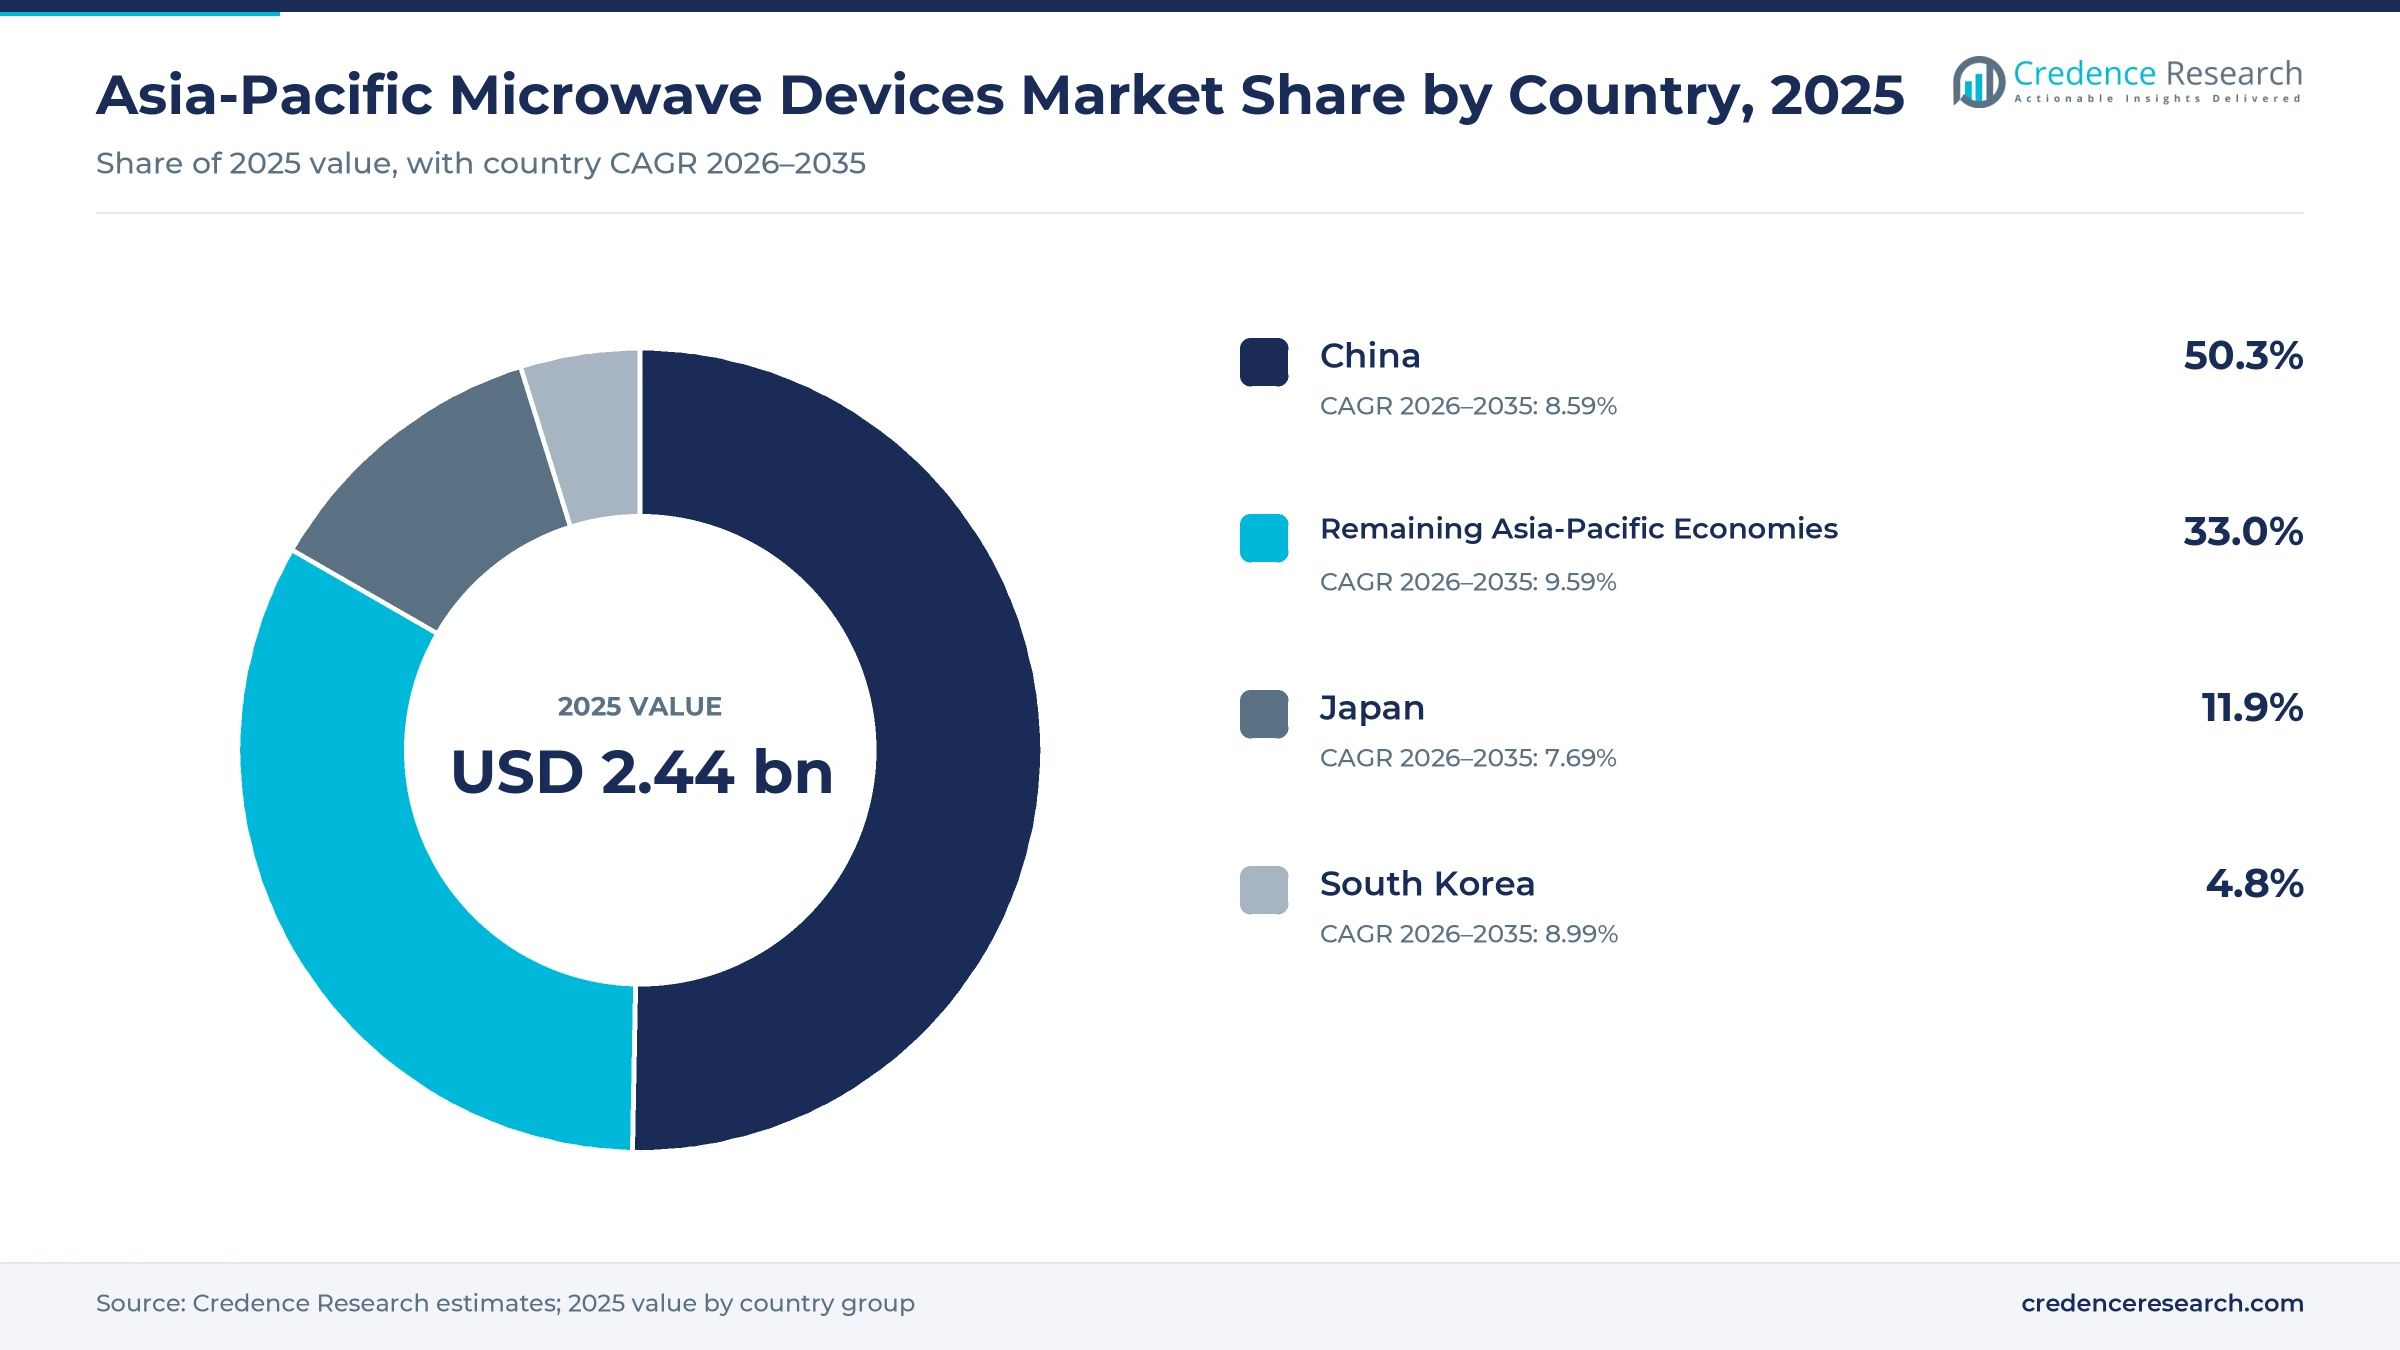
The Asia-Pacific microwave devices market was valued at USD 2.44 billion in 2025 and is projected to increase from USD 2.67 billion in 2026 to USD 5.73 billion by 2035, registering a CAGR of 8.85% during 2026–2035. Demand comes from radar and electronic warfare programs, 5G base station builders, satellite operators and industrial, medical and research users that need power amplifiers, filters, tubes and antenna components. China held the largest share, 50.3% in 2025, because it runs the largest 5G network and a broad state defense electronics base. Remaining Asia-Pacific Economies is the fastest-growing country group at 9.59% a year, as India, Australia and Southeast Asian states buy domestically built radars and expand mobile networks. Technology is also changing, because gallium nitride amplifiers now replace older silicon and tube designs in radar and massive MIMO radios. As a result, value per transmit channel is rising even where unit volumes grow slowly.
Which microwave components and subsystems are counted?
The estimate measures the value of microwave devices sold in China, Japan, South Korea and Remaining Asia-Pacific Economies, covering power amplifiers, microwave tubes, filters and passive components, and signal processing and radiating components. These devices operate roughly from 300 MHz to 300 GHz and are bought by system builders, subsystem specialists, laboratories and maintenance contractors.
The estimate excludes complete radars, base stations and satellites, consumer handset front-end modules and household microwave ovens. The value chain runs from gallium arsenide and gallium nitride wafers, ceramics and tube parts through device makers and distributors to defense, telecom, space, industrial and medical system builders.
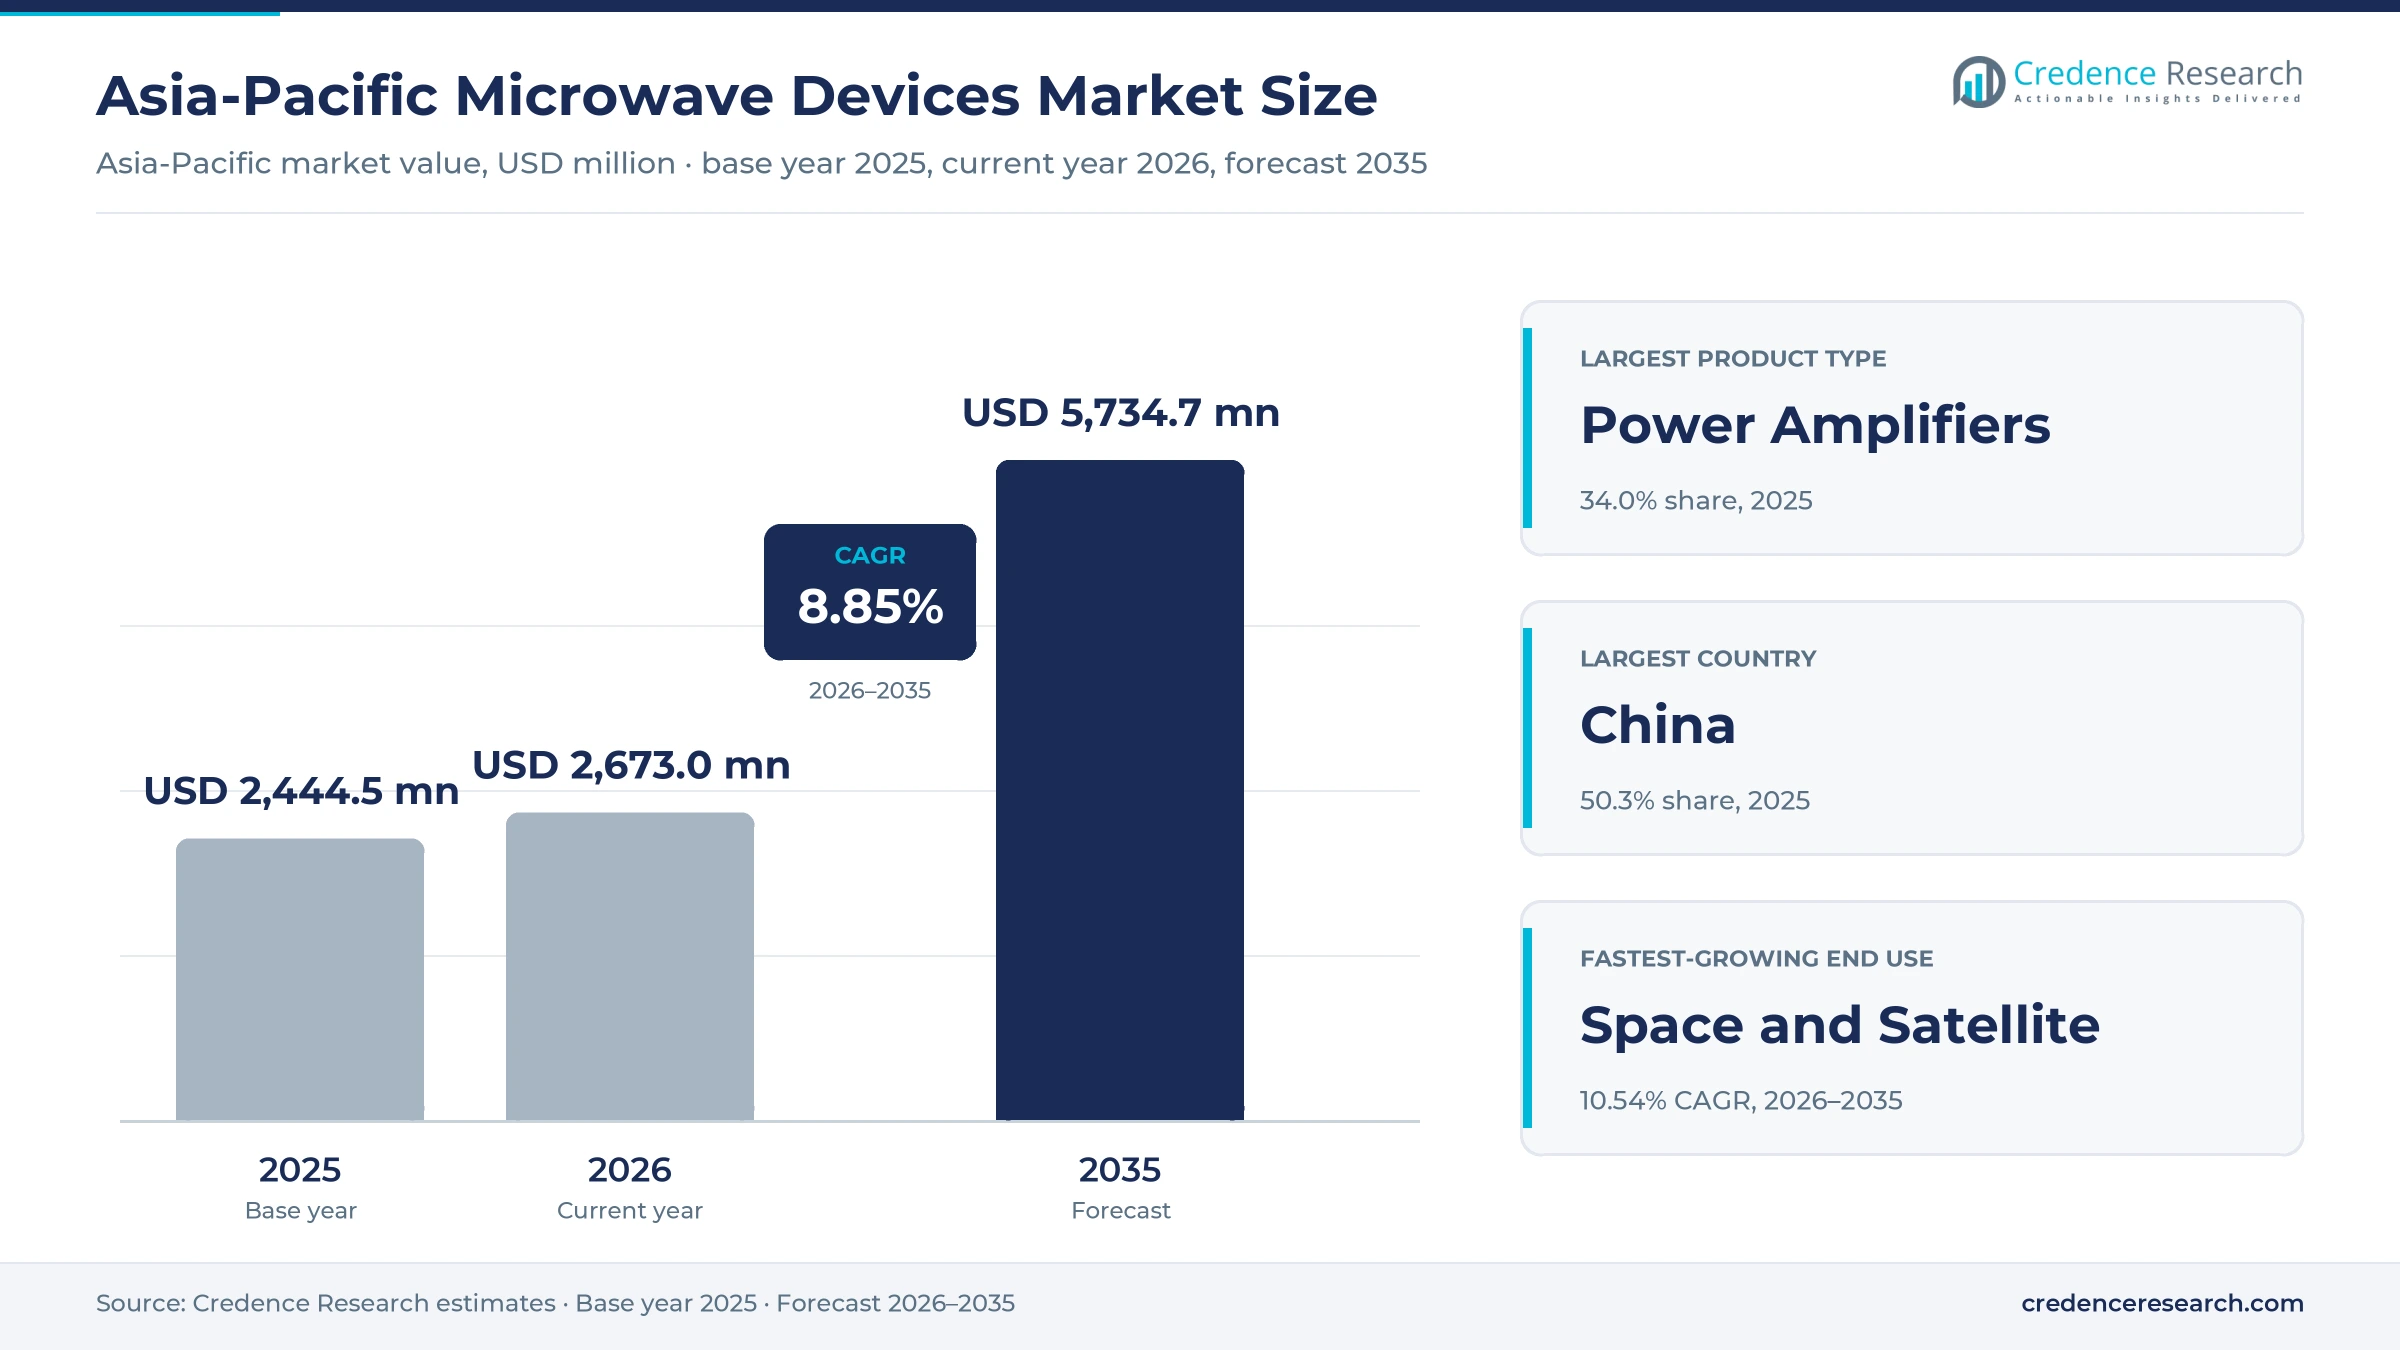
Asia-Pacific Microwave Devices Market Insights
- The Asia-Pacific microwave devices market was valued at USD 2.44 billion in 2025 and is projected to reach USD 5.73 billion by 2035, registering a CAGR of 8.85% during 2026–2035.
- China held 50.3% of 2025 value, because the country had 4.838 million 5G base stations at the end of 2025 and a large defense radar industry.
- Power amplifiers led product types with 34.0% of 2025 value, as radar and massive MIMO radios need high output power at microwave frequencies.
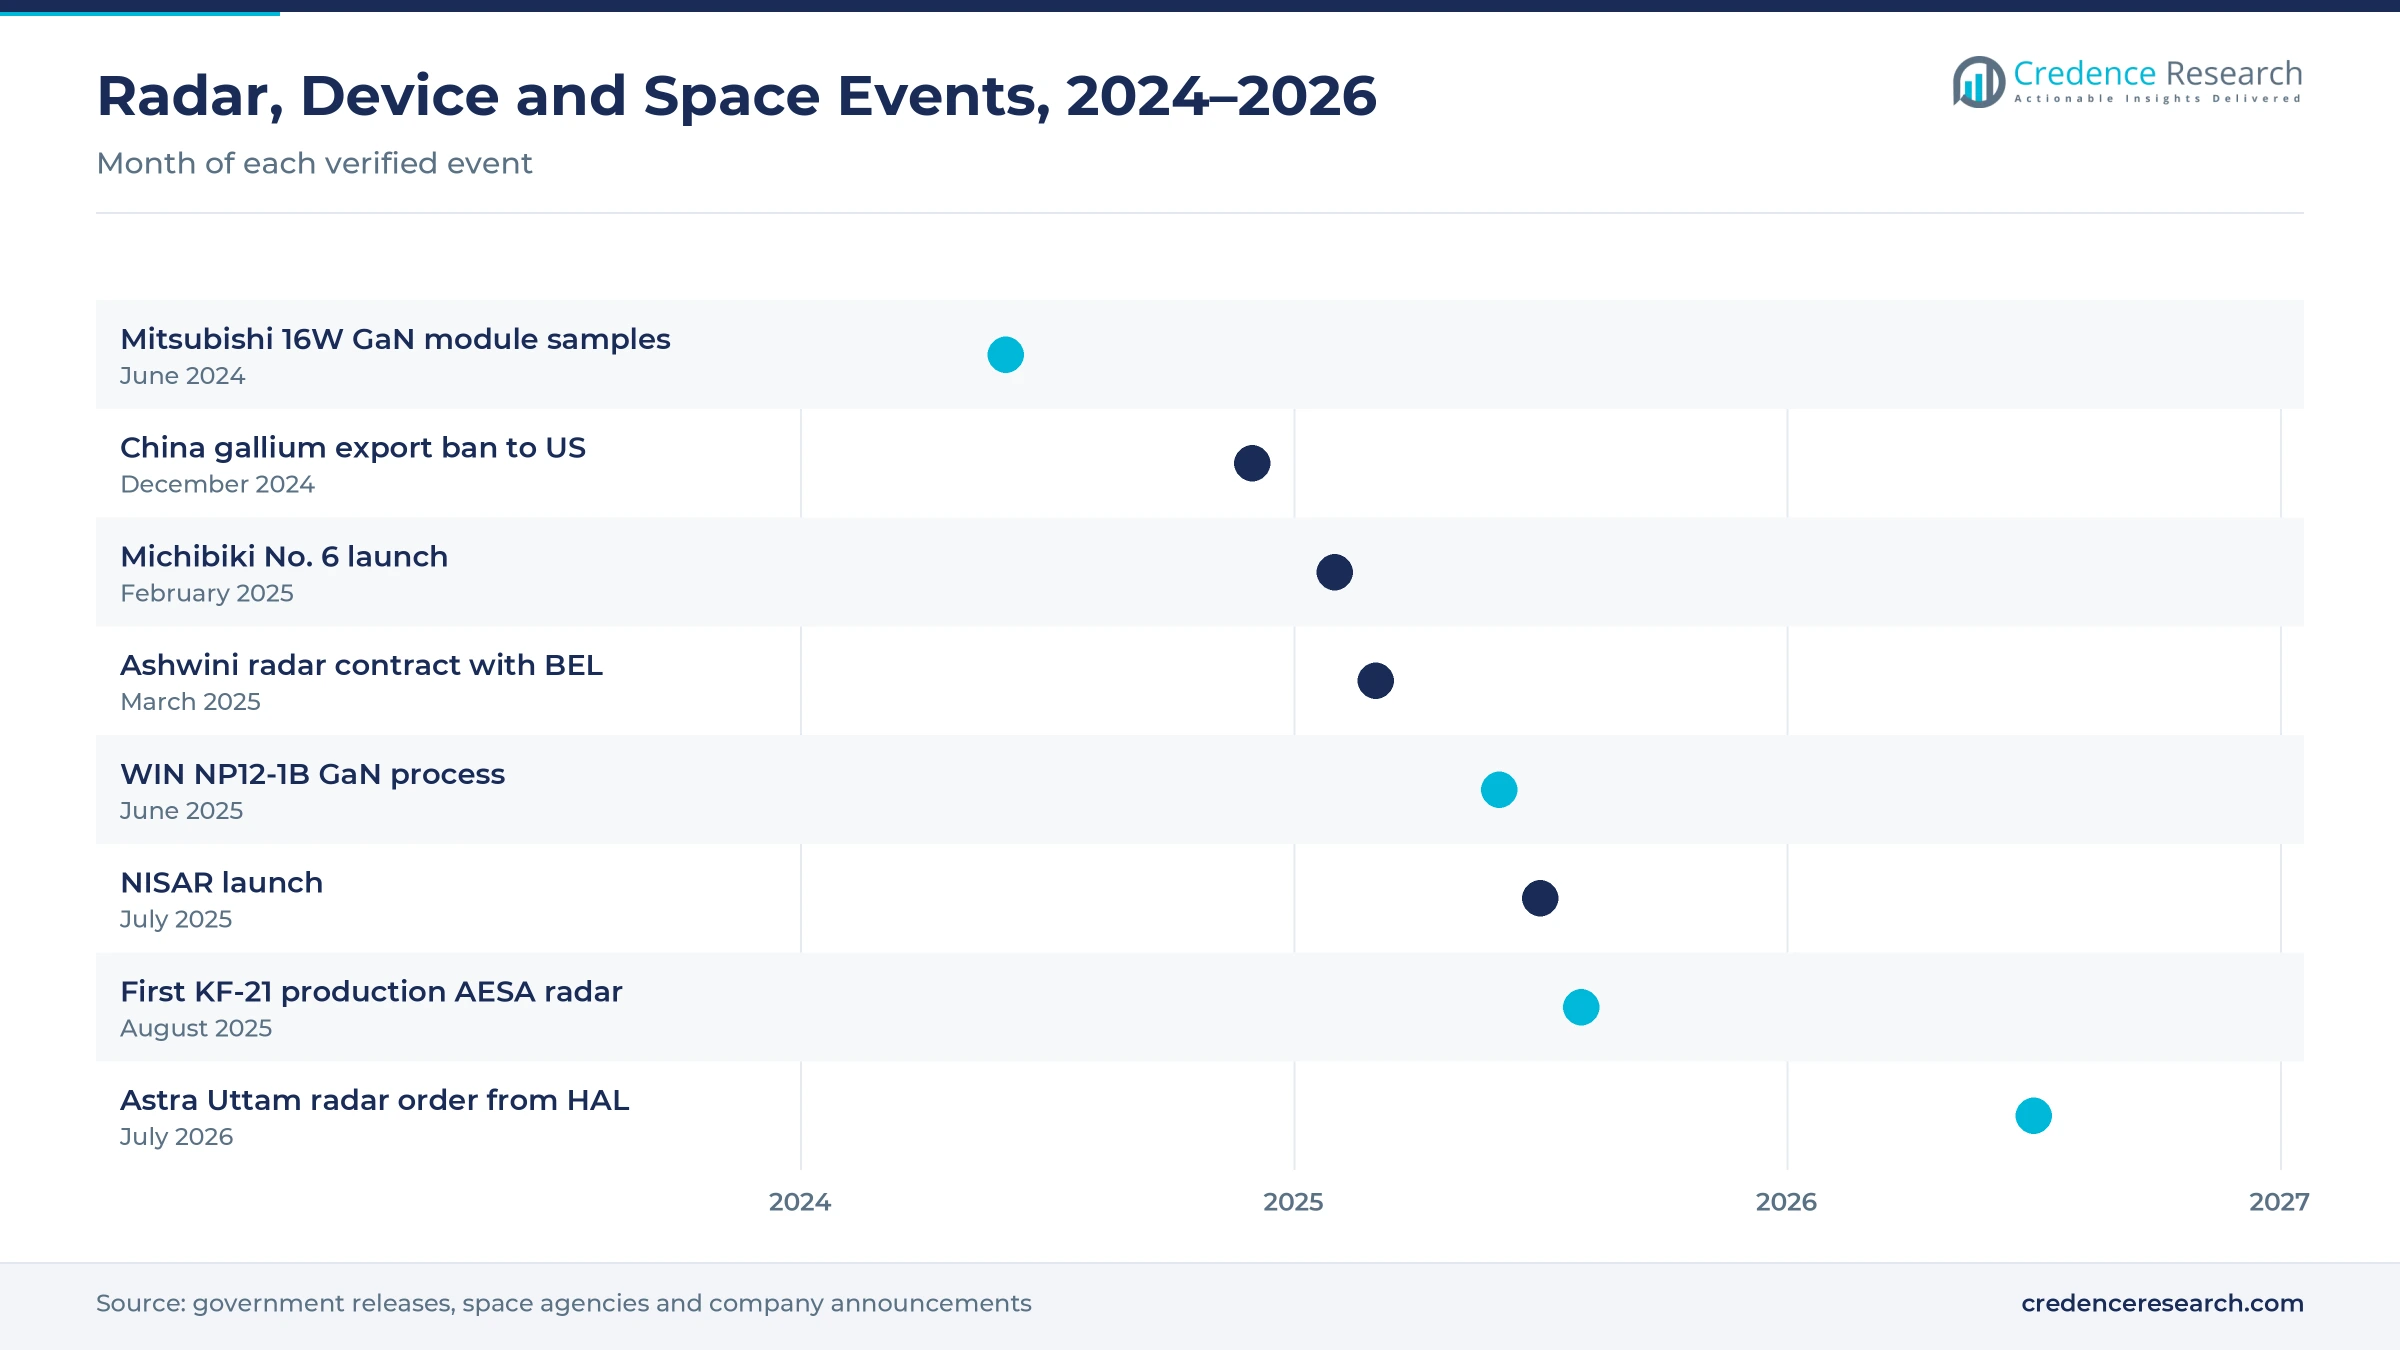
- India signed a Rs 2,906 crore contract with Bharat Electronics on March 12, 2025, for Ashwini low-level transportable AESA radars for its air force.
- Space and satellite users are the fastest-growing end use at 10.54% a year during 2026–2035, as Asian broadband constellations and radar satellites expand.
Power amplifiers, defense users and GaN devices lead
Why do power amplifiers carry the most value?
Based on product type, the market is categorized into Power Amplifiers, Microwave Tubes, Filters and Passive Components and Signal Processing and Radiating Components. Power Amplifiers led with 34.0% of 2025 value, because radar transmitters and massive MIMO radios use many high-power channels. Power Amplifiers grow fastest at 9.37% a year, as gallium nitride designs spread in radar and base station transmitters.
How do defense and space users shape demand?
Based on end-use industry, the market is categorized into Defense and Aerospace, Telecommunications, Space and Satellite, Civilian Industrial and Medical and Research. Defense and Aerospace led with 38.0% of 2025 value, because China, India, Japan and South Korea are buying new radars and fighter avionics. Space and Satellite grows fastest at 10.54% a year, as broadband constellations, navigation satellites and radar imaging missions need flight-qualified amplifiers and filters.
Why do radar and electronic warfare lead applications?
Based on application, the market is categorized into Radar and Electronic Warfare, Wireless Connectivity, Thermal Processing and Medical Therapy and Measurement and Research. Radar and Electronic Warfare led with 40.0% of 2025 value and also grows fastest at 9.21% a year, because each active array radar holds hundreds or thousands of transmit and receive modules. Wireless connectivity follows closely, since operators keep adding 5G and 5G-Advanced radios.
How fast are compound semiconductor devices gaining share?
Based on technology, the market is categorized into Compound Semiconductor Devices, Silicon Microwave Devices, Passive Microwave Structures and Vacuum Electronics. Compound Semiconductor Devices led with 42.0% of 2025 value and grow fastest at 9.74% a year, because RF gallium nitride and gallium arsenide parts deliver higher power and efficiency. Vacuum electronics keep a niche in high-power weather radars, accelerators and plasma heating.
| Segment Group | Leading Sub-segment | Share, 2025 | Fastest-growing Sub-segment | CAGR, 2026–2035 |
|---|---|---|---|---|
| By Product Type | Power Amplifiers | 34.0% | Power Amplifiers | 9.37% |
| By End-Use Industry | Defense and Aerospace | 38.0% | Space and Satellite | 10.54% |
| By Application | Radar and Electronic Warfare | 40.0% | Radar and Electronic Warfare | 9.21% |
| By Technology | Compound Semiconductor Devices | 42.0% | Compound Semiconductor Devices | 9.74% |
Request a Free Sample
Fill in your details and we'll send you a free sample report.
- Sample data tables & charts
- Research methodology
Defense localization, 5G and space programs lift demand
How do radar upgrades and local production lift demand?
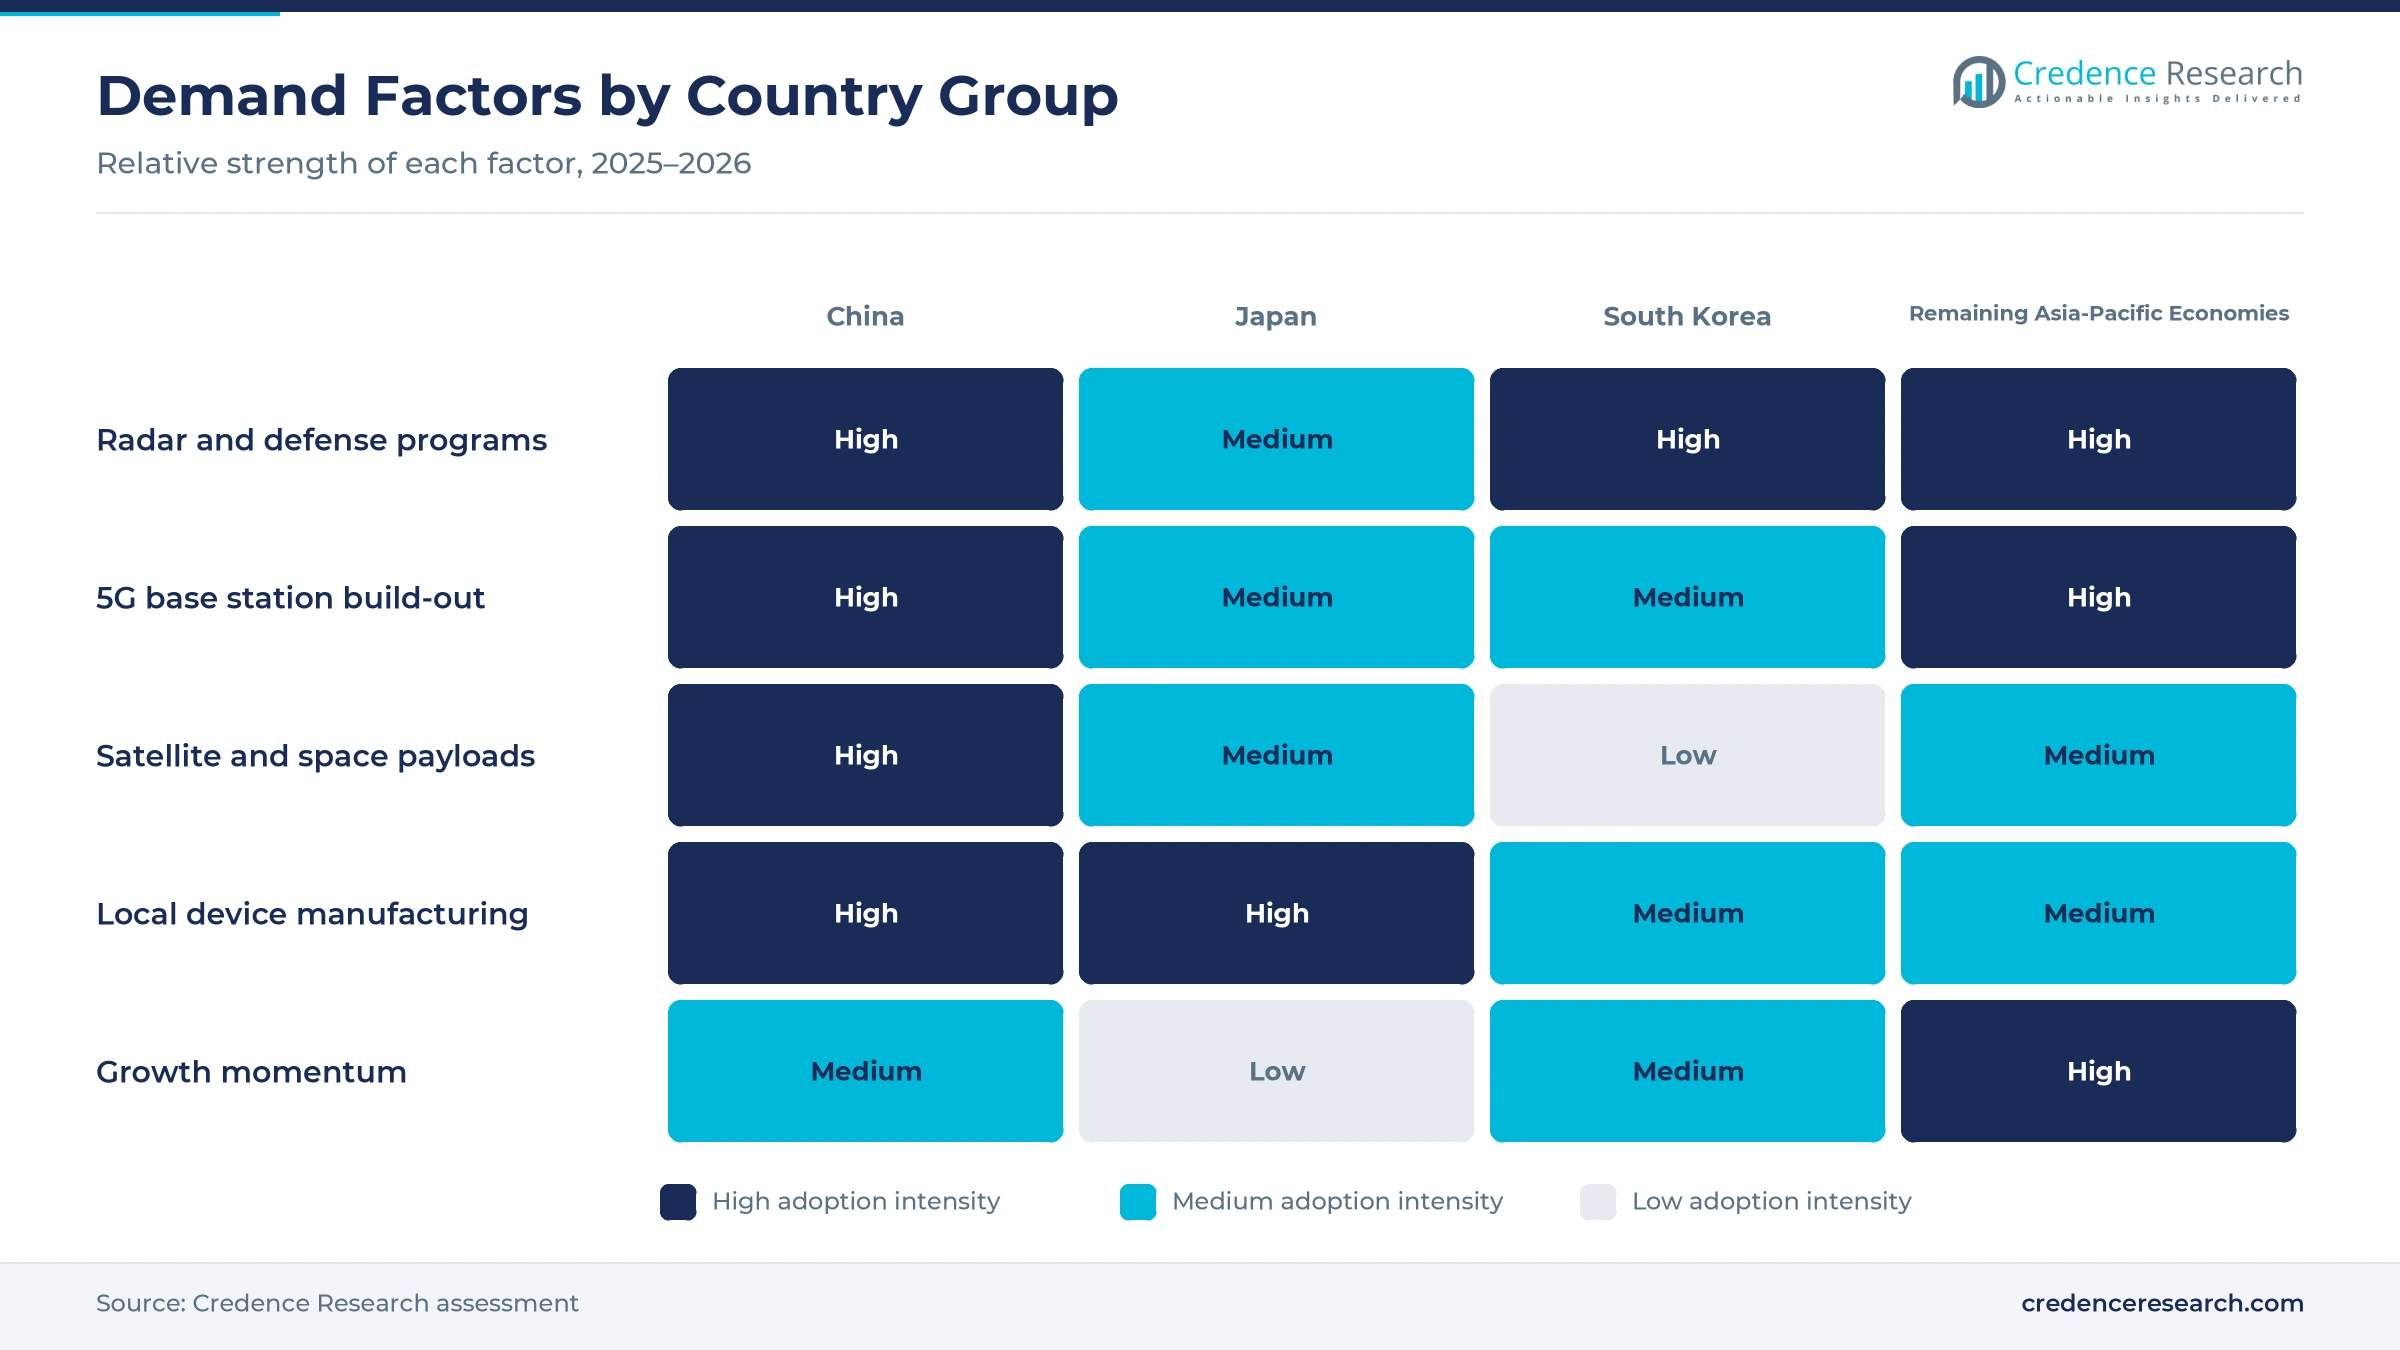
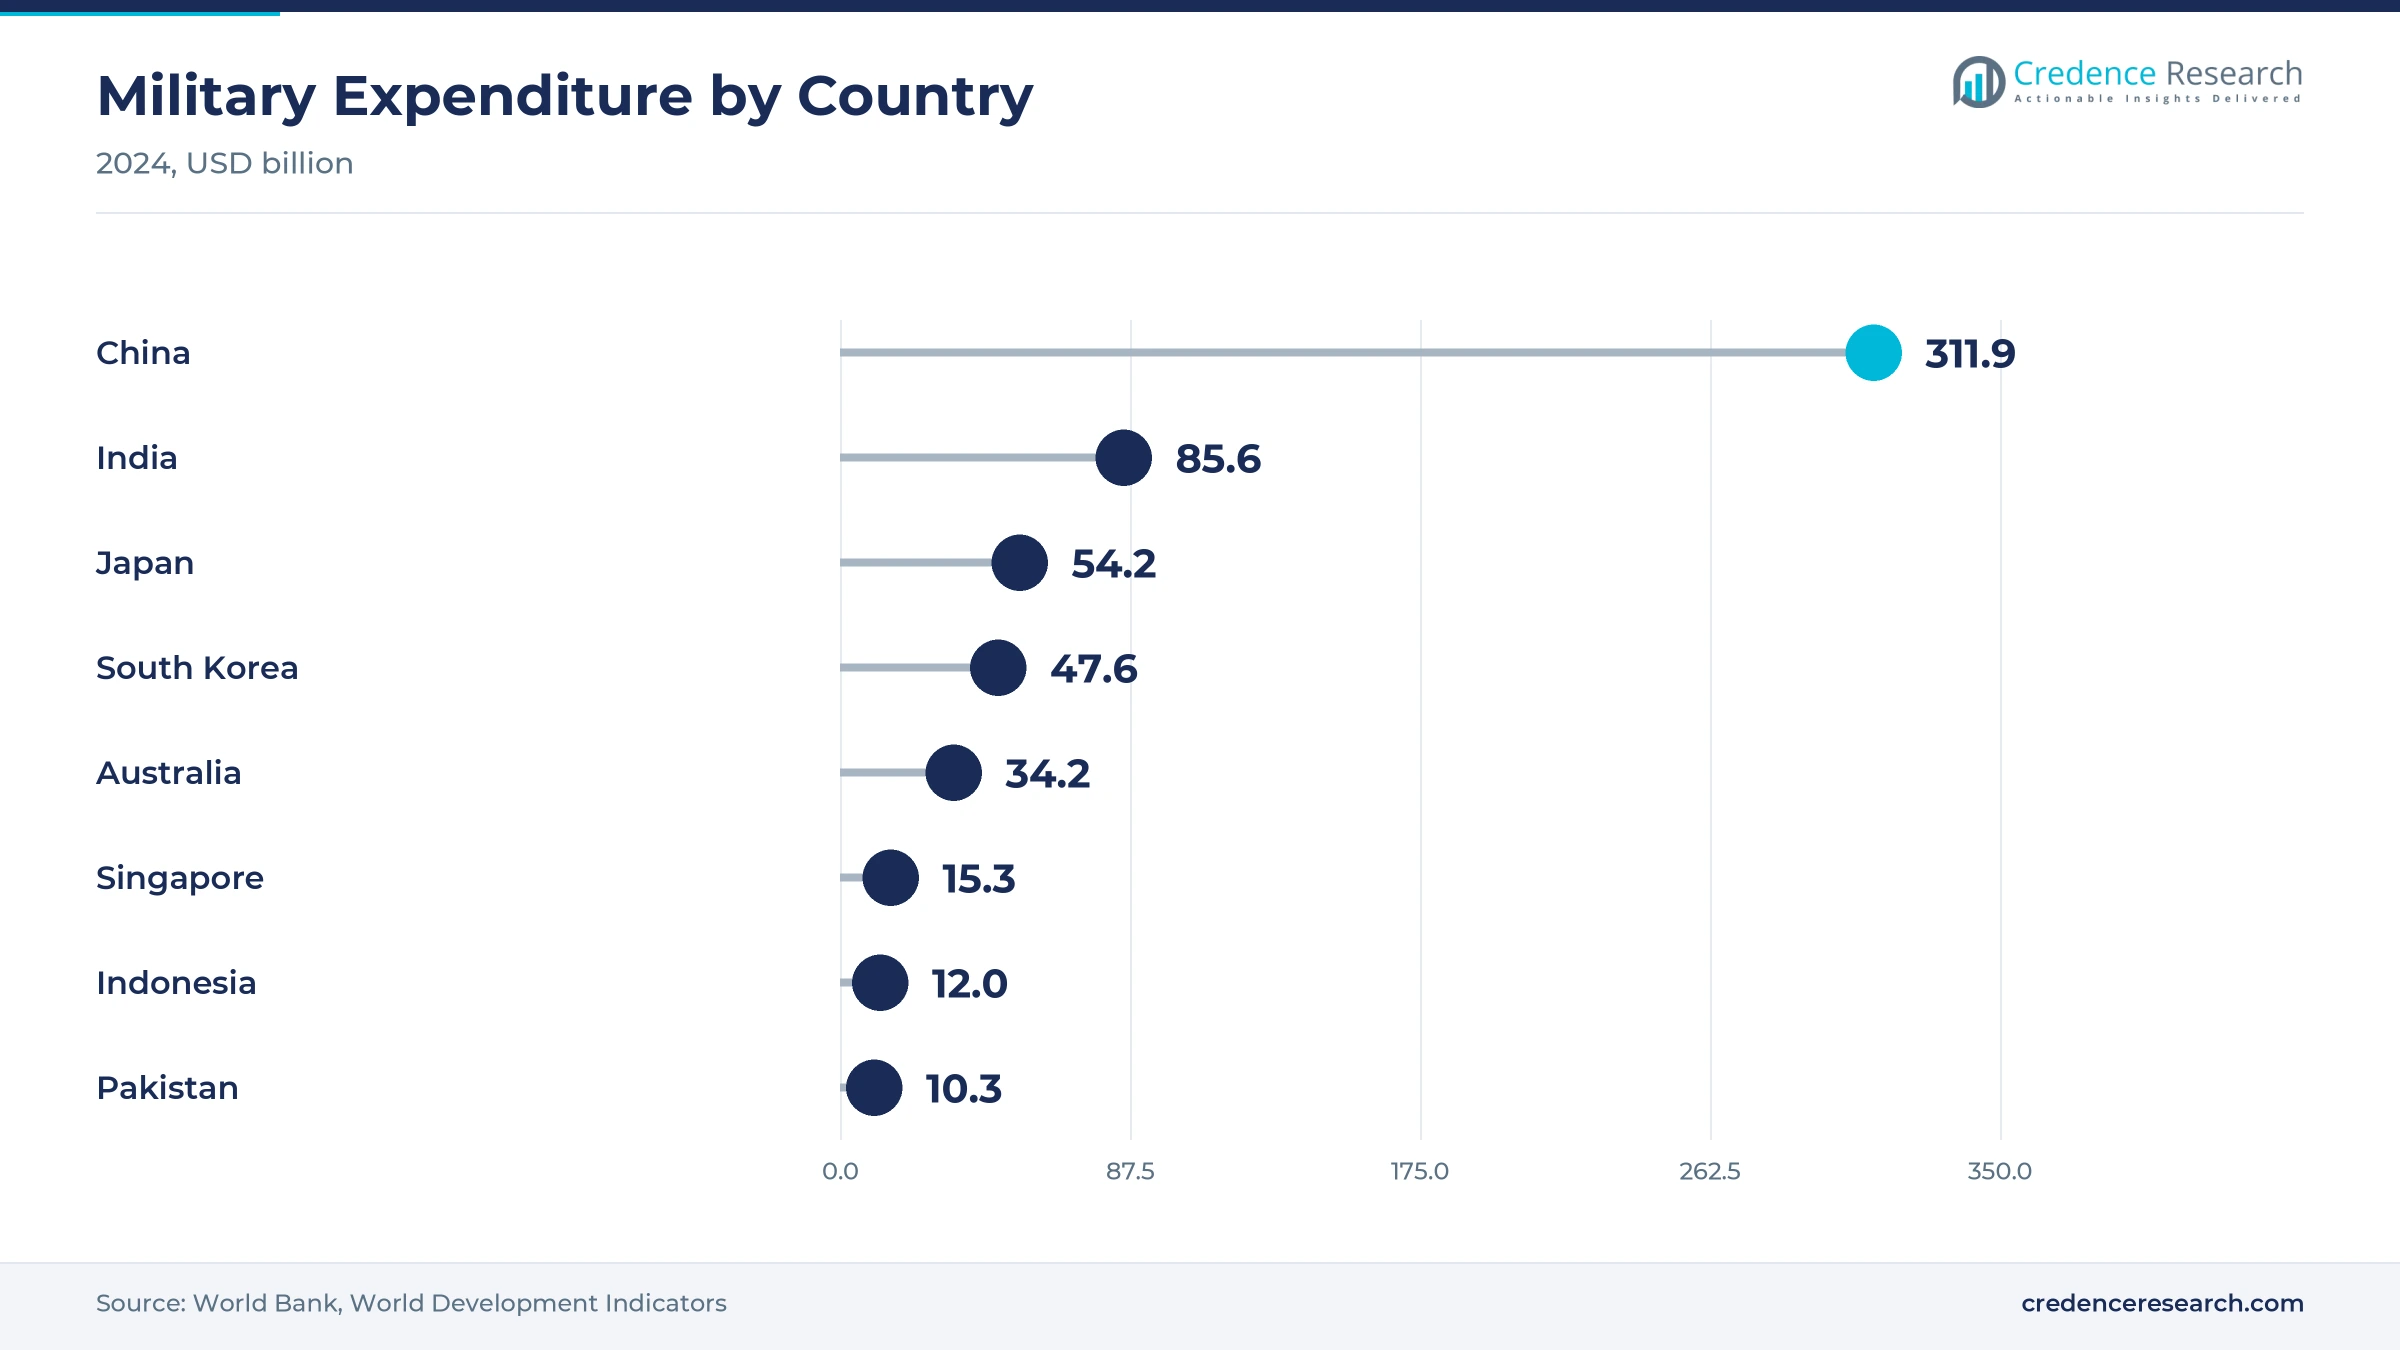
Governments across the region are replacing older radars with solid-state active arrays and asking local firms to build them, which raises device content per system. China spent about USD 311.9 billion on its military in 2024, India USD 85.6 billion and Japan USD 54.2 billion, according to World Bank data. India's Ministry of Defence signed a Rs 2,906 crore contract with Bharat Electronics on March 12, 2025, for Ashwini low-level transportable radars, which use solid-state AESA technology designed by DRDO. India's defense production also reached a record Rs 1,50,590 crore in fiscal 2024-25, up about 18%, according to the Press Information Bureau. As a result, defense and aerospace led end uses with 38.0% of 2025 value.
How do 5G build-outs and upgrade cycles add device volume?
Mobile operators in China and India keep adding base stations and upgrading radios, which sustains demand for amplifiers, filters and circulators. China had 4.838 million 5G base stations at the end of 2025, or 34.4 per 10,000 people, according to Ministry of Industry and Information Technology data reported by China Daily. The same release said 5G-Advanced service covered more than 330 cities, while 5G subscriptions reached 1.204 billion. India installed more than 5.08 lakh 5G base transceiver stations, reaching 99.9% of districts, according to the Department of Telecommunications year-end review reported by The Statesman. Therefore, wireless connectivity held a large share of application value, and operators now favor higher-efficiency amplifiers that cut site power bills.
Why do satellite links and radar imaging need more devices?
Asian space programs are launching communication, navigation and radar imaging satellites, and each payload needs flight-qualified amplifiers, filters and antenna components. The NASA-ISRO NISAR satellite lifted off on a GSLV-F16 on July 30, 2025, carrying L-band and S-band synthetic aperture radars, with ISRO supplying the S-band radar, according to the Indian Space Research Organisation. JAXA launched the Michibiki No. 6 navigation satellite on an H3 rocket on Feb. 2, 2025. China completed its 13th broadband satellite launch of 2025 on Nov. 10, 2025, and Guowang and Qianfan together plan about 28,000 satellites, according to Broadband Breakfast. As a result, space and satellite users grow fastest by end use at 10.54% a year.
Why do weather and research systems still need tubes?
Weather services, research laboratories and industrial heating users still need high-power microwave sources, which keeps a steady market for klystrons, magnetrons and gyrotrons. The India Meteorological Department placed a Rs 171.38 crore order with Astra Microwave Products for six S-band Doppler weather radars using klystron technology, announced Dec. 11, 2025, according to IIFL. China Electronics Technology Group showed S-, C- and X-band phased array weather radars among more than 100 radar systems at the World Radar Expo in Hefei in May 2025, China Daily reported. Canon Electron Tubes & Devices in Japan also supplies klystrons and gyrotrons for plasma heating, according to Fusion Energy Base. Therefore, vacuum electronics remain a smaller but steady technology group for high-power uses.
GaN amplifiers, wideband filters and counter-drone radar
How is the shift to GaN amplifier modules changing designs?
Device makers are shifting base station and radar transmitters from discrete silicon parts to gallium nitride modules, which deliver more power in less space. Mitsubishi Electric began shipping samples of a 16W average-power GaN power amplifier module for 5G massive MIMO base stations on June 11, 2024, after an 8W module in September 2023. WIN Semiconductors in Taiwan announced its NP12-1B 0.12-micron GaN-on-SiC process for K-band to V-band radar, electronic warfare and communications on June 4, 2025, according to RFGlobalnet. Sumitomo Electric and Osaka Metropolitan University built a GaN transistor on a 2-inch diamond substrate in May 2025 to lower heat. As a result, compound semiconductor devices grow fastest by technology at 9.74% a year.
Why is the rise of wideband acoustic filters notable?
Filter makers are moving beyond surface acoustic wave filters to higher-frequency acoustic designs, because 5G-Advanced, Wi-Fi 7 and future 6G radios use wider channels above 5 GHz. Murata Manufacturing announced mass production of the first high-frequency filter using XBAR technology on July 7, 2025, with a 5,150 to 7,125 MHz passband and 2.2 dB typical insertion loss. Murata said the filter targets smartphones, wearables, notebook PCs and communication gateways. Mitsubishi Electric also aimed a 3.6 to 4.0 GHz 16W module at East and Southeast Asia in March 2025, according to Business Wire. Therefore, filters and passive components held a large share in 2025 and keep gaining content per radio.
Can India's radar subsystem localization open new demand?
India offers an opening for local and foreign device makers because the government now buys radars, avionics and their subsystems from domestic suppliers. Astra Microwave Products received a Rs 2,205.23 crore order from Hindustan Aeronautics for 122 avionics units and 121 interface frames for the Uttam AESA radar, to be executed over five years, Business Today reported on July 31, 2026. Analog Devices signed a memorandum with Tata Electronics, Tata Motors and Tejas Networks on Sept. 18, 2024, to explore making its products at Tata facilities in Gujarat and Assam. Private firms made about 23% of India's defense production in fiscal 2024-25, according to the Press Information Bureau. As a result, India is the main reason the Remaining Asia-Pacific Economies group gains share through 2035.
Can counter-drone radars create a new device opening?
Drone threats create an opening for compact short-range radars and jammers, which need many low-cost amplifiers and antenna elements. Japan's draft budget for fiscal 2026 set aside 100.1 billion yen for several thousand drones in a coastal defense system, inside a record 9,035.3 billion yen total, according to Adnkronos. China Electronics Technology Group showed its JY-11 S-band three-face array radar for low-altitude and counter-drone surveillance at the World Radar Expo in May 2025, China Daily reported. India's Ashwini radar can track fighters as well as drones and helicopters, according to the Ministry of Defence. Therefore, radar and electronic warfare grow fastest by application at 9.21% a year.
Gallium controls, export rules and thin talent slow growth
How do gallium export controls affect device supply?
China dominates refined gallium output, so export controls can raise wafer costs for compound semiconductor makers elsewhere in the region. China's commerce ministry banned exports of gallium, germanium and antimony dual-use items to the United States on Dec. 3, 2024, then suspended the ban on Nov. 9, 2025 while keeping its licensing rules, Mining Weekly reported. As a result, Japanese, Korean and Taiwanese fabs that buy gallium still face licensing delays and price swings. Device makers respond by holding larger stocks, qualifying second sources and recycling gallium from production scrap.
Why do export rules and offset demands fragment the market?
Defense microwave devices fall under strict export licensing, so suppliers cannot sell the same parts freely across every Asian country. China builds most military devices through state groups, while India and South Korea favor domestic suppliers in radar and avionics programs. In turn, foreign device makers must license technology, form joint ventures or supply only lower-level parts. This fragmentation raises costs, although it also creates local assembly and test work for regional subsystem specialists.
How do scarce RF engineers slow program schedules?
Microwave design, packaging and test work needs experienced engineers, and many new radar and satellite programs compete for the same small talent pool. Indian, Korean and Southeast Asian suppliers often depend on a few senior designers to qualify new modules for military or space use. As a result, qualification can take longer than planned and delay deliveries. Companies respond with university programs, design centers and partnerships with foreign device makers that bring proven processes.
How do telecom spending pauses make orders uneven?
Operators in China and India have already built most of their first 5G coverage, so new site additions are slowing and spending shifts toward upgrades. When operators pause capital spending, amplifier and filter makers see orders fall for several quarters. In turn, suppliers with heavy telecom exposure face volatile factory loading and pricing pressure. Device makers reduce this risk by selling into defense, space and industrial markets that follow longer program cycles.
China leads while India and Southeast Asia grow fastest
| Country | Value, 2025 (USD billion) | Share, 2025 | CAGR, 2026–2035 |
|---|---|---|---|
| China | 1.23 | 50.3% | 8.59% |
| Remaining Asia-Pacific Economies | 0.81 | 33.0% | 9.59% |
| Japan | 0.29 | 11.9% | 7.69% |
| South Korea | 0.12 | 4.8% | 8.99% |
Why does China hold half of regional value?
China held 50.3% of 2025 value and grows at 8.59% a year, slightly below the regional rate. The country had 4.838 million 5G base stations at the end of 2025 and spent about USD 311.9 billion on defense in 2024, according to national and World Bank data. China Electronics Technology Group unveiled more than 100 radar systems at the World Radar Expo in Hefei in May 2025. Growth is slightly slower because the first 5G wave is complete, although satellite constellations add new demand.
How does Japan sustain high-value device demand?
Japan held 11.9% of 2025 value and grows at 7.69% a year, the slowest rate in the region. Japan hosts Mitsubishi Electric, Sumitomo Electric Device Innovations, Murata Manufacturing and Canon Electron Tubes & Devices, which supply amplifiers, filters and tubes across Asia. The draft fiscal 2026 defense budget reached a record 9,035.3 billion yen, and JAXA launched Michibiki No. 6 in February 2025. Growing demand for satellite communication equipment also supports Japanese makers of space-grade parts.
Why does South Korea add radar device demand?
South Korea held 4.8% of 2025 value and grows at 8.99% a year, above the regional average. Hanwha Systems rolled out the first mass-produced AESA radar for the KF-21 fighter on Aug. 5, 2025, with about 1,000 transmit and receive modules per antenna, according to EDR Magazine. The company plans to deliver 40 radar units between 2025 and 2028. South Korea spent about USD 47.6 billion on defense in 2024, according to World Bank data, which supports steady radar and electronic warfare budgets.
How do India, Taiwan and Southeast Asia grow fastest?
Remaining Asia-Pacific Economies held 33.0% of 2025 value and grows fastest at 9.59% a year. India leads this group, with Bharat Electronics and Astra Microwave Products building radars and subsystems and more than 5.08 lakh 5G base stations installed. Taiwan adds compound semiconductor capacity through WIN Semiconductors, while Australia, Singapore and Indonesia spent USD 34.2 billion, USD 15.3 billion and USD 12.0 billion on defense in 2024. As a result, this diverse country group gains regional share through 2035.
Radar orders and device launches from 2024 to 2026
| Development | Status and market relevance |
|---|---|
| In June 2024, Mitsubishi Electric began shipping samples of a 16W GaN power amplifier module for 5G massive MIMO base stations. | Raises output power for 32T32R radios |
| In March 2025, India's Ministry of Defence signed a Rs 2,906 crore contract with Bharat Electronics for Ashwini AESA radars. | Solid-state radar designed by DRDO |
| In June 2025, WIN Semiconductors announced its NP12-1B 0.12-micron GaN-on-SiC process for K-band to V-band applications. | Targets radar, electronic warfare and communications |
| In July 2025, Murata Manufacturing started mass production of the first high-frequency filter using XBAR technology. | Covers 5,150 to 7,125 MHz for 5G and Wi-Fi 7 |
| In August 2025, Hanwha Systems rolled out the first mass-produced AESA radar for the KF-21 fighter. | About 1,000 transmit and receive modules per array |
GaN, acoustic filters and AESA modules reshape devices
- GaN-on-SiC transistors handle higher voltage and heat than gallium arsenide, so radar and base station makers use them for the final amplifier stage.
- Acoustic filters such as Murata's XBAR design now reach bands above 5 GHz, which suits Wi-Fi 7 and 5G-Advanced equipment in homes, offices and networks.
- AESA transmit and receive modules combine amplifiers, phase shifters and switches, and they also power synthetic aperture radar satellites such as NISAR.
- Klystrons and gyrotrons still deliver the highest pulse power for weather radars, accelerators and fusion plasma heating.
Need a Custom Version of This Report?
Tailor the scope, geography, or segments to your exact requirements.
- Custom geography or segment scope
- Direct access to our analyst team
Japanese device makers face rising local champions
Competition combines Japanese and American device makers with fast-growing state and private champions in China and India. Mitsubishi Electric and Sumitomo Electric Device Innovations compete on GaN amplifiers for base stations and radar, while Murata Manufacturing leads in filters and passive parts. Analog Devices and Qorvo sell integrated RF devices, and Qorvo agreed to sell its Beijing and Dezhou assembly and test sites to Luxshare under a long-term supply agreement. WIN Semiconductors offers compound semiconductor foundry processes, and Canon Electron Tubes & Devices supplies klystrons and gyrotrons. China Electronics Technology Group, Bharat Electronics and Astra Microwave Products build military radar systems and subsystems for national programs. Suppliers compete on output power, efficiency, qualification records, export licenses and local production.
Companies profiled and their roles in this market
| Company | Type | Role in the market |
|---|---|---|
| Mitsubishi Electric | Japanese device maker | Began sampling a 16W GaN power amplifier module for 5G massive MIMO base stations in June 2024 |
| Sumitomo Electric Device Innovations | Japanese GaN specialist | Offers GaN-on-SiC HEMT transistors, such as a 600W S-band part, for radar and wireless infrastructure amplifiers |
| Murata Manufacturing | Japanese component maker | Started mass production of an XBAR filter for 5,150 to 7,125 MHz in July 2025 |
| Analog Devices | U.S. device maker | Signed a memorandum with Tata companies in September 2024 to explore manufacturing in India |
| Qorvo | U.S. device maker | Agreed to sell its Beijing and Dezhou assembly and test facilities to Luxshare, which keeps serving Chinese customers |
| Canon Electron Tubes & Devices | Japanese tube maker | Supplies klystrons and gyrotrons for radar, accelerators and plasma heating |
| WIN Semiconductors | Taiwanese compound foundry | Announced a 0.12-micron GaN-on-SiC process for K-band to V-band in June 2025 |
| Astra Microwave Products | Indian subsystem specialist | Won Uttam AESA radar and IMD weather radar orders in 2025 and 2026 |
| Bharat Electronics | Indian defense electronics group | Signed the Ashwini AESA radar contract for the Indian Air Force in March 2025 |
| China Electronics Technology Group | Chinese state electronics group | Unveiled more than 100 radar systems at the World Radar Expo in May 2025 |
Credence Research view on regional device demand
Credence Research's view is that Asia-Pacific microwave device demand will grow faster than the global average because defense buyers are localizing radar production while operators and space agencies add new radios and payloads. China remains the anchor because of its 5G network and state radar industry, while India adds the most new programs. Gallium nitride amplifiers and wideband filters raise value per channel. Suppliers that secure gallium supply, hold export licenses and build local assembly and test capacity are best placed through 2035.
How the regional estimate was built
The report uses 2025 as the base year and presents market values in USD million through 2035. Market values come from the Credence Research model, and country, product type, end-use industry, application and technology splits are Credence Research estimates. Country shares follow the Credence Research regional model, checked against military expenditure, 5G base station counts and the location of device makers in each group. Inputs include national statistics, World Bank data, government releases, space agency pages, company press releases and trade media. No interviews or surveys were used in preparing these estimates.
Space, radar and GaN devices lead growth to 2035
The Asia-Pacific microwave devices market is expected to reach USD 5.73 billion by 2035, an 8.85% CAGR during 2026–2035, as governments buy domestically built radars and operators and space agencies add new radios and payloads. Remaining Asia-Pacific Economies and South Korea should gain share, while China stays the largest country market. Space and satellite users, power amplifiers and compound semiconductor devices are expected to grow faster than the regional average. Tighter gallium supply would lower this outlook, while faster constellation launches would raise it.
Frequently Asked Questions
How big is the Asia-Pacific microwave devices market?
Which country leads regional demand?
Which country group grows fastest?
Which product type holds the largest share?
Which end use grows fastest?
How does defense spending affect demand?
Which technology grows fastest?
Who are the main companies in the market?
Table of Content
Chapter 1 Market Segmentation
- 1.1 Segmentation Framework
- 1.1.1 Product and Service Classification
- 1.1.2 Application and End-Use Classification
- 1.1.3 Technology and Solution Classification
- 1.1.4 Customer and Distribution Channel Classification
- 1.1.5 Geographic Segmentation
- 1.1.6 Market Segment Definitions and Boundaries
- 1.2 By Product Type
- 1.2.1 Power Amplifiers
- 1.2.2 Microwave Tubes
- 1.2.3 Filters and Passive Components
- 1.2.4 Signal Processing and Radiating Components
- 1.3 By End-Use Industry
- 1.3.1 Defense and Aerospace
- 1.3.2 Telecommunications
- 1.3.3 Space and Satellite
- 1.3.4 Civilian Industrial
- 1.3.5 Medical and Research
- 1.4 By Application
- 1.4.1 Radar and Electronic Warfare
- 1.4.2 Wireless Connectivity
- 1.4.3 Thermal Processing and Medical Therapy
- 1.4.4 Measurement and Research
- 1.5 By Technology
- 1.5.1 Compound Semiconductor Devices
- 1.5.2 Silicon Microwave Devices
- 1.5.3 Passive Microwave Structures
- 1.5.4 Vacuum Electronics
- 1.6 By Country
- 1.6.1 China
- 1.6.2 Japan
- 1.6.3 South Korea
- 1.6.4 Remaining Asia-Pacific Economies
Chapter 2 Introduction
- 2.1 Report Objectives and Scope
- 2.2 Product Definition and Industry Terminology
- 2.3 Market Inclusions and Exclusions
- 2.4 Research Process
- 2.4.1 Primary Research and Expert Interviews
- 2.4.2 Secondary Research and Source Review
- 2.4.3 Top-Down and Bottom-Up Estimation
- 2.4.4 Data Triangulation and Verification
- 2.5 Market Size Measurement Basis
- 2.5.1 2025: USD 2.44 billion → 2035: USD 5.73 billion
- 2.6 Historical and Forecast Reference Periods
- 2.6.1 Historical Period: 2018-2025
- 2.6.2 Base Year: 2025
- 2.6.3 Forecast Period: 2025-2035
- 2.7 Research Assumptions and Limitations
Chapter 3 Executive Summary
- 3.1 Market Snapshot and Key Findings
- 3.2 Base-Year Market Size, 2025
- 3.3 Forecast Market Size, 2035
- 3.4 Revenue and Volume Growth Outlook
- 3.5 Key Demand and Supply Indicators
- 3.6 Leading Market Segments
- 3.7 Fastest-Growing Market Opportunities
- 3.8 Regional Performance Highlights
- 3.9 Technology and Industry Transformation
- 3.10 Competitive Landscape Summary
- 3.11 Analyst View and Strategic Implications
Chapter 4 Asia-Pacific Microwave Devices Market Trends and Developments
- 4.1 Historical Industry Development, 2018-2025
- 4.2 Recent Market Trends and Developments
- 4.3 Demand and Customer Behavior Trends
- 4.4 Technology and Product Innovation
- 4.5 Artificial Intelligence, Automation and Digitalization
- 4.6 Local Manufacturing and Supply Chain Realignment
- 4.7 Industry Partnerships, Mergers and Acquisitions
- 4.8 Sustainability and Circular Economy Developments
- 4.9 Government and Private Sector Investment Trends
- 4.10 Emerging Business Models and Commercialization
- 4.11 Industry Developments and Announcements
Chapter 5 Asia-Pacific Microwave Devices Market Production, Supply and Demand Analysis
- 5.1 Demand Trend and Consumption Analysis, 2018-2025
- 5.2 Demand Forecast, 2025-2035
- 5.3 Production and Output Trend, 2018-2025
- 5.4 Production and Output Forecast, 2025-2035
- 5.5 Installed Capacity and Capacity Utilization
- 5.6 Company-Wise Production Plants and Statistics
- 5.6.1 Installed Production Capacity
- 5.6.2 Actual Production
- 5.6.3 Planned Capacity and Expansion Targets
- 5.7 Supply Chain Structure and Procurement Trends
- 5.8 Supply-Demand Gap and Bottlenecks
- 5.9 Import Dependence and Sourcing Structure
- 5.10 Contract Manufacturing and Outsourcing
- 5.11 Regional Supply and Demand Concentration
Chapter 6 Asia-Pacific Microwave Devices Market Pricing Analysis
- 6.1 Pricing Structure and Measurement
- 6.2 Historical Pricing Trends, 2018-2025
- 6.3 Pricing Outlook, 2025-2035
- 6.4 Average Selling Price and Unit Economics
- 6.5 Pricing by Product and Market Segment
- 6.6 Geographic Pricing Differences
- 6.7 Key Input, Energy, Labor and Logistics Costs
- 6.8 Contract Pricing and Purchasing Models
- 6.9 Pricing Sensitivity and Competitive Positioning
- 6.10 Price, Margin and Profitability Implications
Chapter 7 Asia-Pacific Microwave Devices Market Dynamics
- 7.1 Market Growth Drivers
- 7.1.1 Demand-Side Drivers
- 7.1.2 Technology and Innovation Drivers
- 7.1.3 Infrastructure and Investment Drivers
- 7.1.4 Regulatory and Policy Drivers
- 7.2 Market Restraints
- 7.2.1 Cost and Affordability Constraints
- 7.2.2 Technology and Adoption Barriers
- 7.2.3 Supply Chain and Operational Constraints
- 7.3 Market Challenges
- 7.3.1 Competitive Pressure and Margin Erosion
- 7.3.2 Skills, Infrastructure and Implementation Gaps
- 7.4 Emerging Market Opportunities
- 7.5 Market Dynamics Impact and Time-Horizon Assessment
Chapter 8 Asia-Pacific Microwave Devices Value Chain Analysis
- 8.1 Industry Value Chain Overview
- 8.2 Upstream Suppliers and Critical Inputs
- 8.3 Technology and Component Providers
- 8.4 Manufacturing or Service Delivery
- 8.5 Distribution, Channel Partners and Integrators
- 8.6 Downstream Applications and End Users
- 8.7 Value Addition and Profit Pools
- 8.8 Vertical Integration and Outsourcing
- 8.9 Supplier Concentration and Risk
- 8.10 Supply Chain Localization and Resilience
Chapter 9 Asia-Pacific Microwave Devices Market Regulations and Policies
- 9.1 Relevant Laws, Standards and Compliance Frameworks
- 9.2 Product, Service, Safety and Quality Requirements
- 9.3 Government Policies, Incentives and Subsidies
- 9.4 Imports, Exports and Trade Barriers
- 9.5 Public Procurement and Local Content Requirements
- 9.6 Environmental and Sustainability Compliance
- 9.7 Upcoming Policy Changes and Market Implications
Chapter 10 Asia-Pacific Microwave Devices Market Hotspots and Opportunities
- 10.1 Market Opportunity Mapping and Growth Hotspots
- 10.2 High-Growth Applications and Customer Groups
- 10.3 Underserved Markets and White-Space Opportunities
- 10.4 Emerging Technology and Product Opportunities
- 10.5 New Capacity and Investment Hotspots
- 10.6 Market Entry and Expansion Opportunities
- 10.7 Distribution and Partnership Opportunities
- 10.8 Near-Term and Long-Term Commercial Potential
- 10.9 Opportunity Attractiveness and Execution Risks
Chapter 11 Asia-Pacific Microwave Devices Market Outlook, 2025-2035
- 11.1 Market Size and Analysis
- 11.1.1 Revenue (Market Measurement: 2025: USD 2.44 billion → 2035: USD 5.73 billion)
- 11.1.2 Market Volume and Quantity Sold
- 11.1.3 Historical Market Size, 2018-2025
- 11.1.4 Base-Year Market Size, 2025
- 11.2 Market Forecast, 2025-2035
- 11.2.1 Revenue Forecast to 2035
- 11.2.2 Volume Forecast to 2035
- 11.2.3 CAGR and Year-on-Year Growth
- 11.2.4 Incremental Revenue Opportunity
- 11.3 Forecast Assumptions and Scenario Analysis
- 11.3.1 Base-Case Forecast
- 11.3.2 Optimistic and Conservative Scenarios
- 11.3.3 Technology, Pricing and Policy Sensitivities
- 11.4 Market Attractiveness and Growth Outlook
Chapter 12 Asia-Pacific Microwave Devices Market Segmentation and Outlook
- 12.1 Segmentation Summary and Market Shares, 2025
- 12.2 Largest and Fastest-Growing Segments
- 12.3 By Product Type - Market Size and Forecast, 2025-2035
- 12.3.1 Segment Definition and Scope
- 12.3.2 Historical Market Size, 2018-2025
- 12.3.3 Revenue Forecast, 2025-2035
- 12.3.4 Volume Forecast, 2025-2035
- 12.3.5 Base-Year Market Share, 2025
- 12.3.6 Segment CAGR and Growth Drivers
- 12.3.7 Subsegment Market Size and Forecast
- 12.3.7.1 Power Amplifiers
- 12.3.7.2 Microwave Tubes
- 12.3.7.3 Filters and Passive Components
- 12.3.7.4 Signal Processing and Radiating Components
- 12.3.8 Subsegment Pricing and Adoption Trends
- 12.3.9 Leading Suppliers and Competition
- 12.3.10 Regional Demand and Opportunities
- 12.4 By End-Use Industry - Market Size and Forecast, 2025-2035
- 12.4.1 Segment Definition and Scope
- 12.4.2 Historical Market Size, 2018-2025
- 12.4.3 Revenue Forecast, 2025-2035
- 12.4.4 Volume Forecast, 2025-2035
- 12.4.5 Base-Year Market Share, 2025
- 12.4.6 Segment CAGR and Growth Drivers
- 12.4.7 Subsegment Market Size and Forecast
- 12.4.7.1 Defense and Aerospace
- 12.4.7.2 Telecommunications
- 12.4.7.3 Space and Satellite
- 12.4.7.4 Civilian Industrial
- 12.4.7.5 Medical and Research
- 12.4.8 Subsegment Pricing and Adoption Trends
- 12.4.9 Leading Suppliers and Competition
- 12.4.10 Regional Demand and Opportunities
- 12.5 By Application - Market Size and Forecast, 2025-2035
- 12.5.1 Segment Definition and Scope
- 12.5.2 Historical Market Size, 2018-2025
- 12.5.3 Revenue Forecast, 2025-2035
- 12.5.4 Volume Forecast, 2025-2035
- 12.5.5 Base-Year Market Share, 2025
- 12.5.6 Segment CAGR and Growth Drivers
- 12.5.7 Subsegment Market Size and Forecast
- 12.5.7.1 Radar and Electronic Warfare
- 12.5.7.2 Wireless Connectivity
- 12.5.7.3 Thermal Processing and Medical Therapy
- 12.5.7.4 Measurement and Research
- 12.5.8 Subsegment Pricing and Adoption Trends
- 12.5.9 Leading Suppliers and Competition
- 12.5.10 Regional Demand and Opportunities
- 12.6 By Technology - Market Size and Forecast, 2025-2035
- 12.6.1 Segment Definition and Scope
- 12.6.2 Historical Market Size, 2018-2025
- 12.6.3 Revenue Forecast, 2025-2035
- 12.6.4 Volume Forecast, 2025-2035
- 12.6.5 Base-Year Market Share, 2025
- 12.6.6 Segment CAGR and Growth Drivers
- 12.6.7 Subsegment Market Size and Forecast
- 12.6.7.1 Compound Semiconductor Devices
- 12.6.7.2 Silicon Microwave Devices
- 12.6.7.3 Passive Microwave Structures
- 12.6.7.4 Vacuum Electronics
- 12.6.8 Subsegment Pricing and Adoption Trends
- 12.6.9 Leading Suppliers and Competition
- 12.6.10 Regional Demand and Opportunities
- 12.7 By Country - Market Size and Forecast, 2025-2035
- 12.7.1 Segment Definition and Scope
- 12.7.2 Historical Market Size, 2018-2025
- 12.7.3 Revenue Forecast, 2025-2035
- 12.7.4 Volume Forecast, 2025-2035
- 12.7.5 Base-Year Market Share, 2025
- 12.7.6 Segment CAGR and Growth Drivers
- 12.7.7 Subsegment Market Size and Forecast
- 12.7.7.1 China
- 12.7.7.2 Japan
- 12.7.7.3 South Korea
- 12.7.7.4 Remaining Asia-Pacific Economies
- 12.7.8 Subsegment Pricing and Adoption Trends
- 12.7.9 Leading Suppliers and Competition
- 12.7.10 Regional Demand and Opportunities
- 12.8 Segment Growth Comparison
- 12.9 Segment Attractiveness and Priority Matrix
Chapter 13 Asia-Pacific Microwave Devices End-Use and Application Market Outlook
- 13.1 End-Use Industry and Customer Demand Structure
- 13.2 Leading Applications and Customer Groups
- 13.3 End-Use Market Size, Share and Forecast
- 13.4 Major End-Use Industry Deep Dives
- 13.4.1 Customer Requirements and Use Cases
- 13.4.2 Demand and Replacement Cycles
- 13.4.3 Technical and Regulatory Considerations
- 13.4.4 Purchasing and Procurement Models
- 13.4.5 Leading Vendors and Distribution Channels
- 13.4.6 Forecast and Commercial Opportunities
- 13.5 Emerging Applications and Cross-Segment Demand
- 13.6 End-Use Industry Investment Priorities
Chapter 14 Asia-Pacific Microwave Devices Geographic Market Outlook, 2025-2035
- 14.1 Regional Market Size and Country-Level Shares, 2025
- 14.2 Country Market Size Comparison, 2025
- 14.3 Country Market Forecasts, 2025-2035
- 14.4 Subregional Industrial and Demand Clusters
- 14.5 Intra-Regional Pricing and Cost Differences
- 14.6 Cross-Border Trade and Supply Networks
- 14.7 Regional Supply and Demand Balances
- 14.8 Country Opportunity Comparison and Prioritization
Note: Every listed country is covered on the structure shown under the first country.
Chapter 15 Asia-Pacific Microwave Devices Technology, Innovation and Sustainability Outlook
- 15.1 Technology Landscape and Maturity
- 15.2 Product, Process and Service Innovation
- 15.3 AI, Automation and Digital Tools in the Industry
- 15.4 Technology Adoption and Performance Benchmarking
- 15.5 Innovation Pipeline and R&D Investment
- 15.6 Patent and Intellectual Property Trends
- 15.7 Energy Efficiency and Resource Management
- 15.8 Sustainability, Recycling and Circularity
- 15.9 Technology Roadmap, 2025-2035
- 15.10 Risks of Obsolescence and Technology Substitution
Chapter 16 Asia-Pacific Microwave Devices Market Key Strategic Imperatives
- 16.1 Growth and Market Entry Priorities
- 16.2 High-Return Products and Segments
- 16.3 Pricing, Profitability and Cost Optimization
- 16.4 Technology Investment and Product Differentiation
- 16.5 Supply Chain Localization and Resilience
- 16.6 Distribution and Customer Acquisition
- 16.7 Partnership, Acquisition and Capacity Strategy
- 16.8 Regional Expansion Priorities
- 16.9 Short-, Medium- and Long-Term Actions
Chapter 17 Competition Outlook
- 17.1 Industry Competition Characteristics
- 17.2 Market Structure and Concentration
- 17.3 Market Share and Competitive Positioning, 2025
- 17.4 Company-Wise Revenue and Product Benchmarking
- 17.5 Production and Service Capacity Benchmarking
- 17.6 Technology, Pricing and Differentiation
- 17.7 Regional Footprint and Distribution Strength
- 17.8 Mergers, Acquisitions and Strategic Alliances
- 17.9 New Entrants and Competitive Threats
- 17.10 Porter's Five Forces and Industry Attractiveness
- 17.11 Competitive Outlook, 2025-2035
Chapter 18 Company Profiles
- 18.1 Company Coverage and Selection Criteria
- 18.2 Mitsubishi Electric
- 18.2.1 Business Description
- 18.2.2 Company Ownership and Geographic Presence
- 18.2.3 Product and Service Portfolio
- 18.2.4 Manufacturing and Operating Footprint
- 18.2.5 Production Capacity and Expansion Plans
- 18.2.6 Financial Performance and Investment
- 18.2.7 Market Share and Competitive Position
- 18.2.8 Technology and Innovation Capabilities
- 18.2.9 Strategic Alliances or Partnerships
- 18.2.10 Recent Developments
- 18.2.11 Growth Strategy and Outlook
- 18.3 Sumitomo Electric Device Innovations
- 18.4 Murata Manufacturing
- 18.5 Analog Devices
- 18.6 Qorvo
- 18.7 Canon Electron Tubes & Devices
- 18.8 WIN Semiconductors
- 18.9 Astra Microwave Products
- 18.10 Bharat Electronics
- 18.11 China Electronics Technology Group
- 18.12 Other Relevant Market Participants
Note: Every listed company is profiled on the structure shown under the first company. The company list is preliminary and may change based on research findings, market developments, data availability and client requirements.
Chapter 19 Disclaimer
- 19.1 Research and Forecast Disclaimer
- 19.2 Data Source and Estimation Limitations
Note: The depth of individual sections depends on data availability for this market. Volume, capacity, trade and other unit-based metrics are included where applicable.

