
Imported equipment carries most packages into Australia
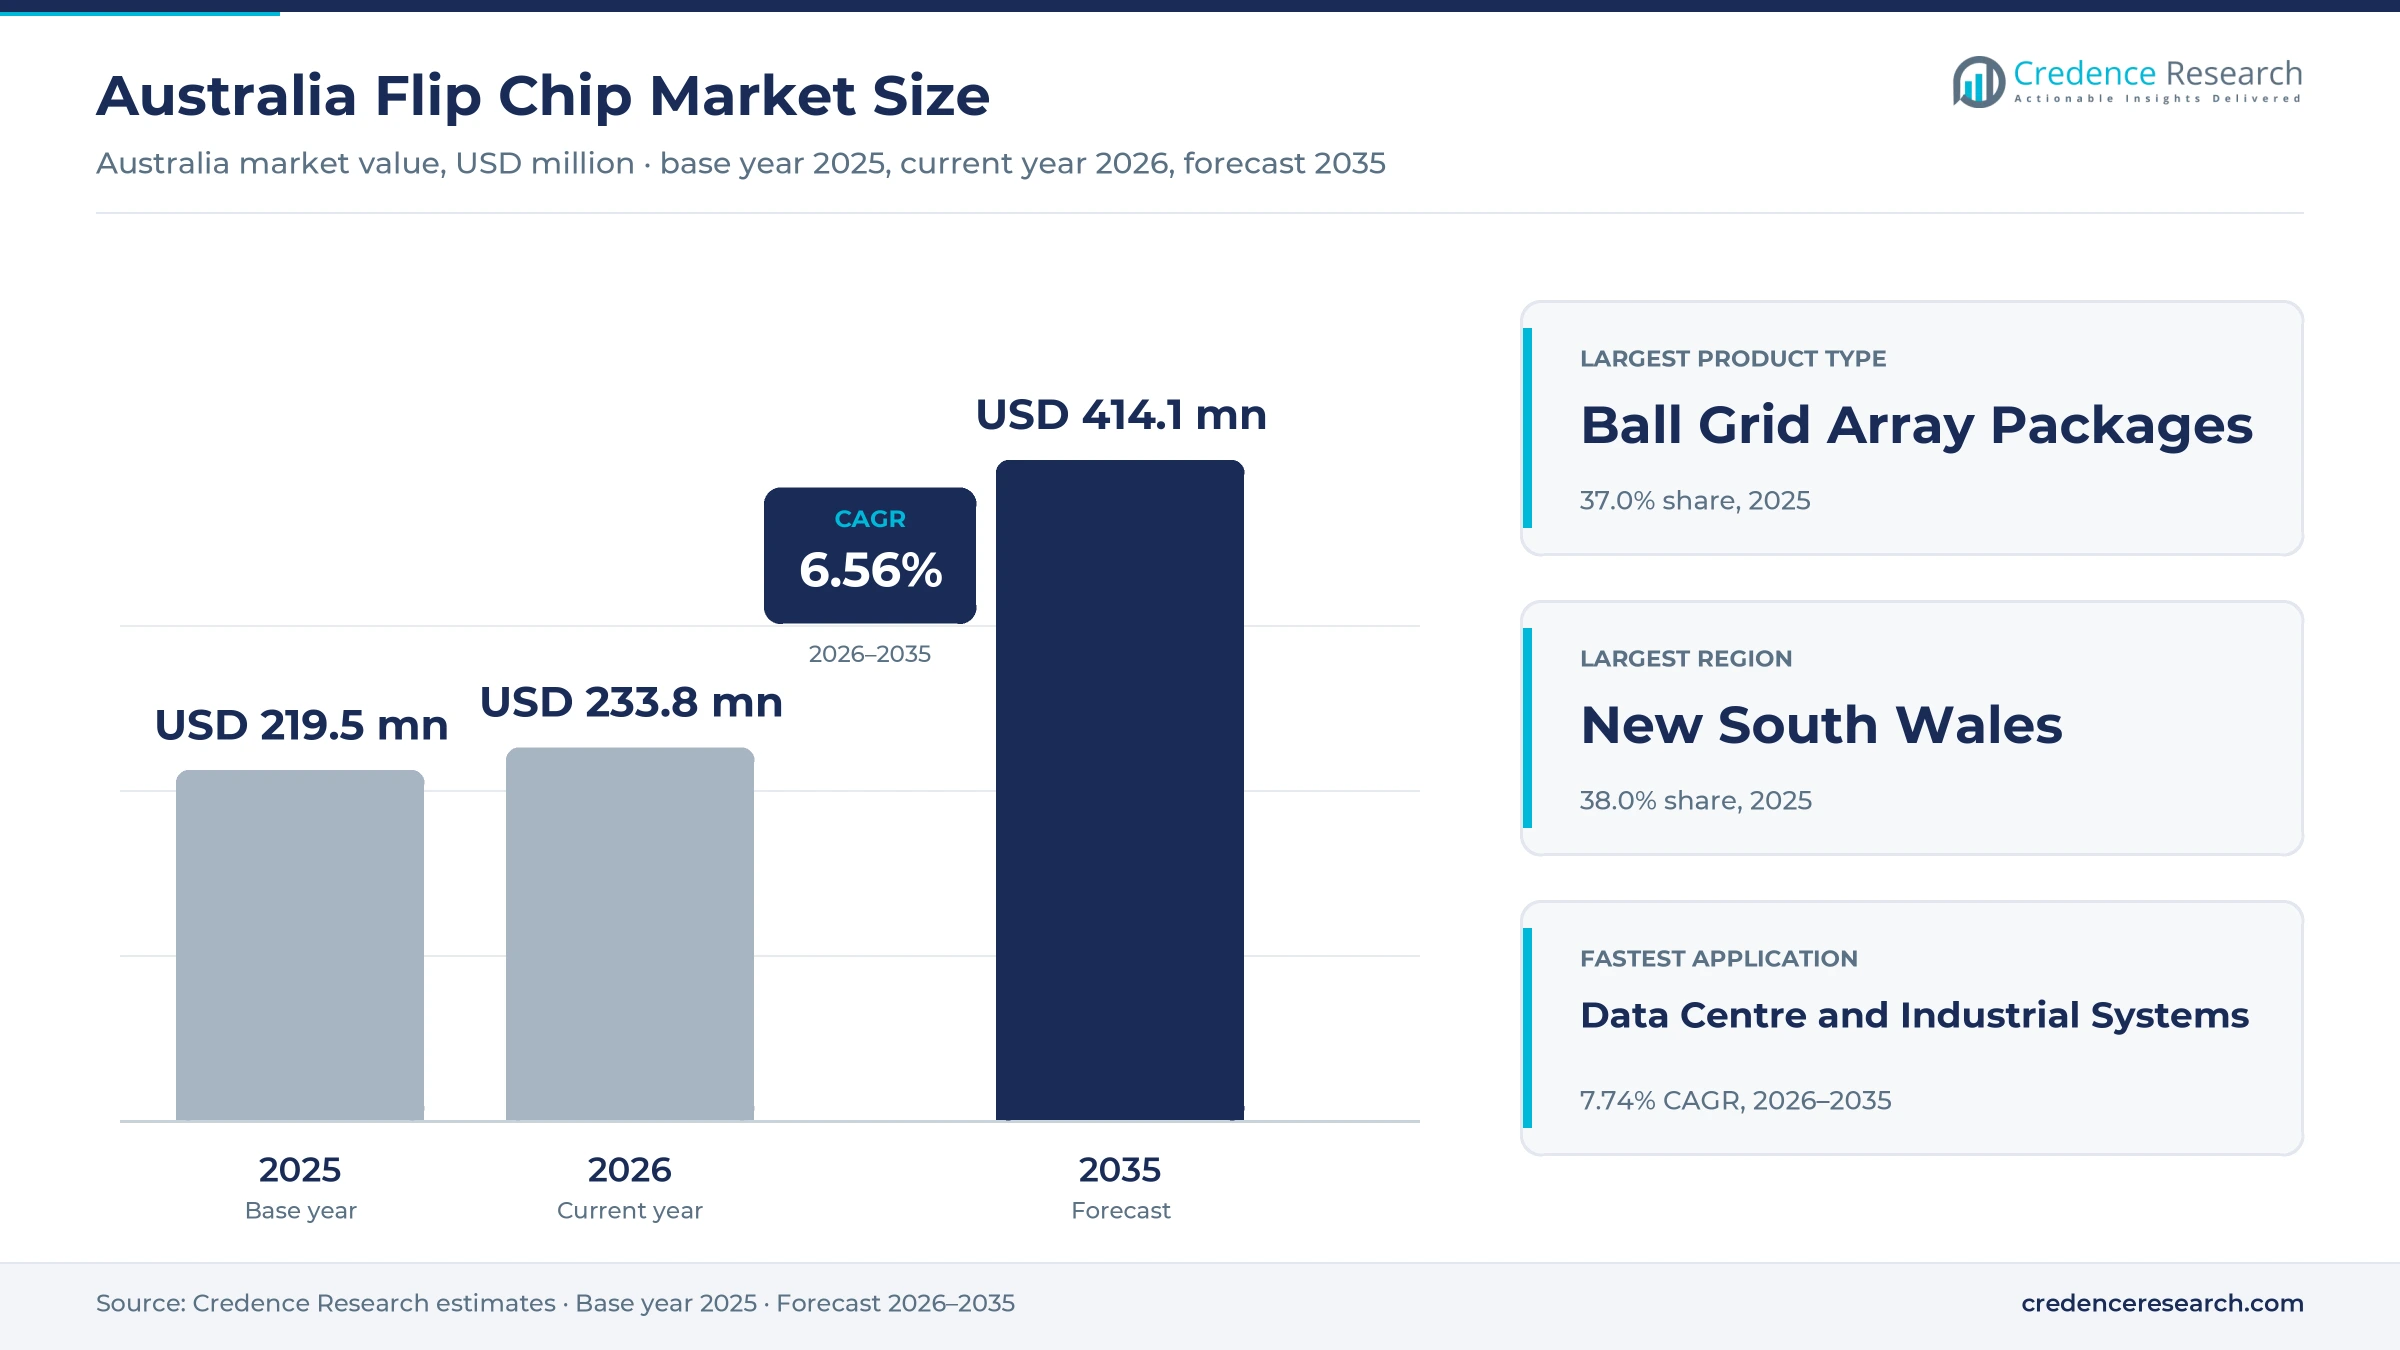
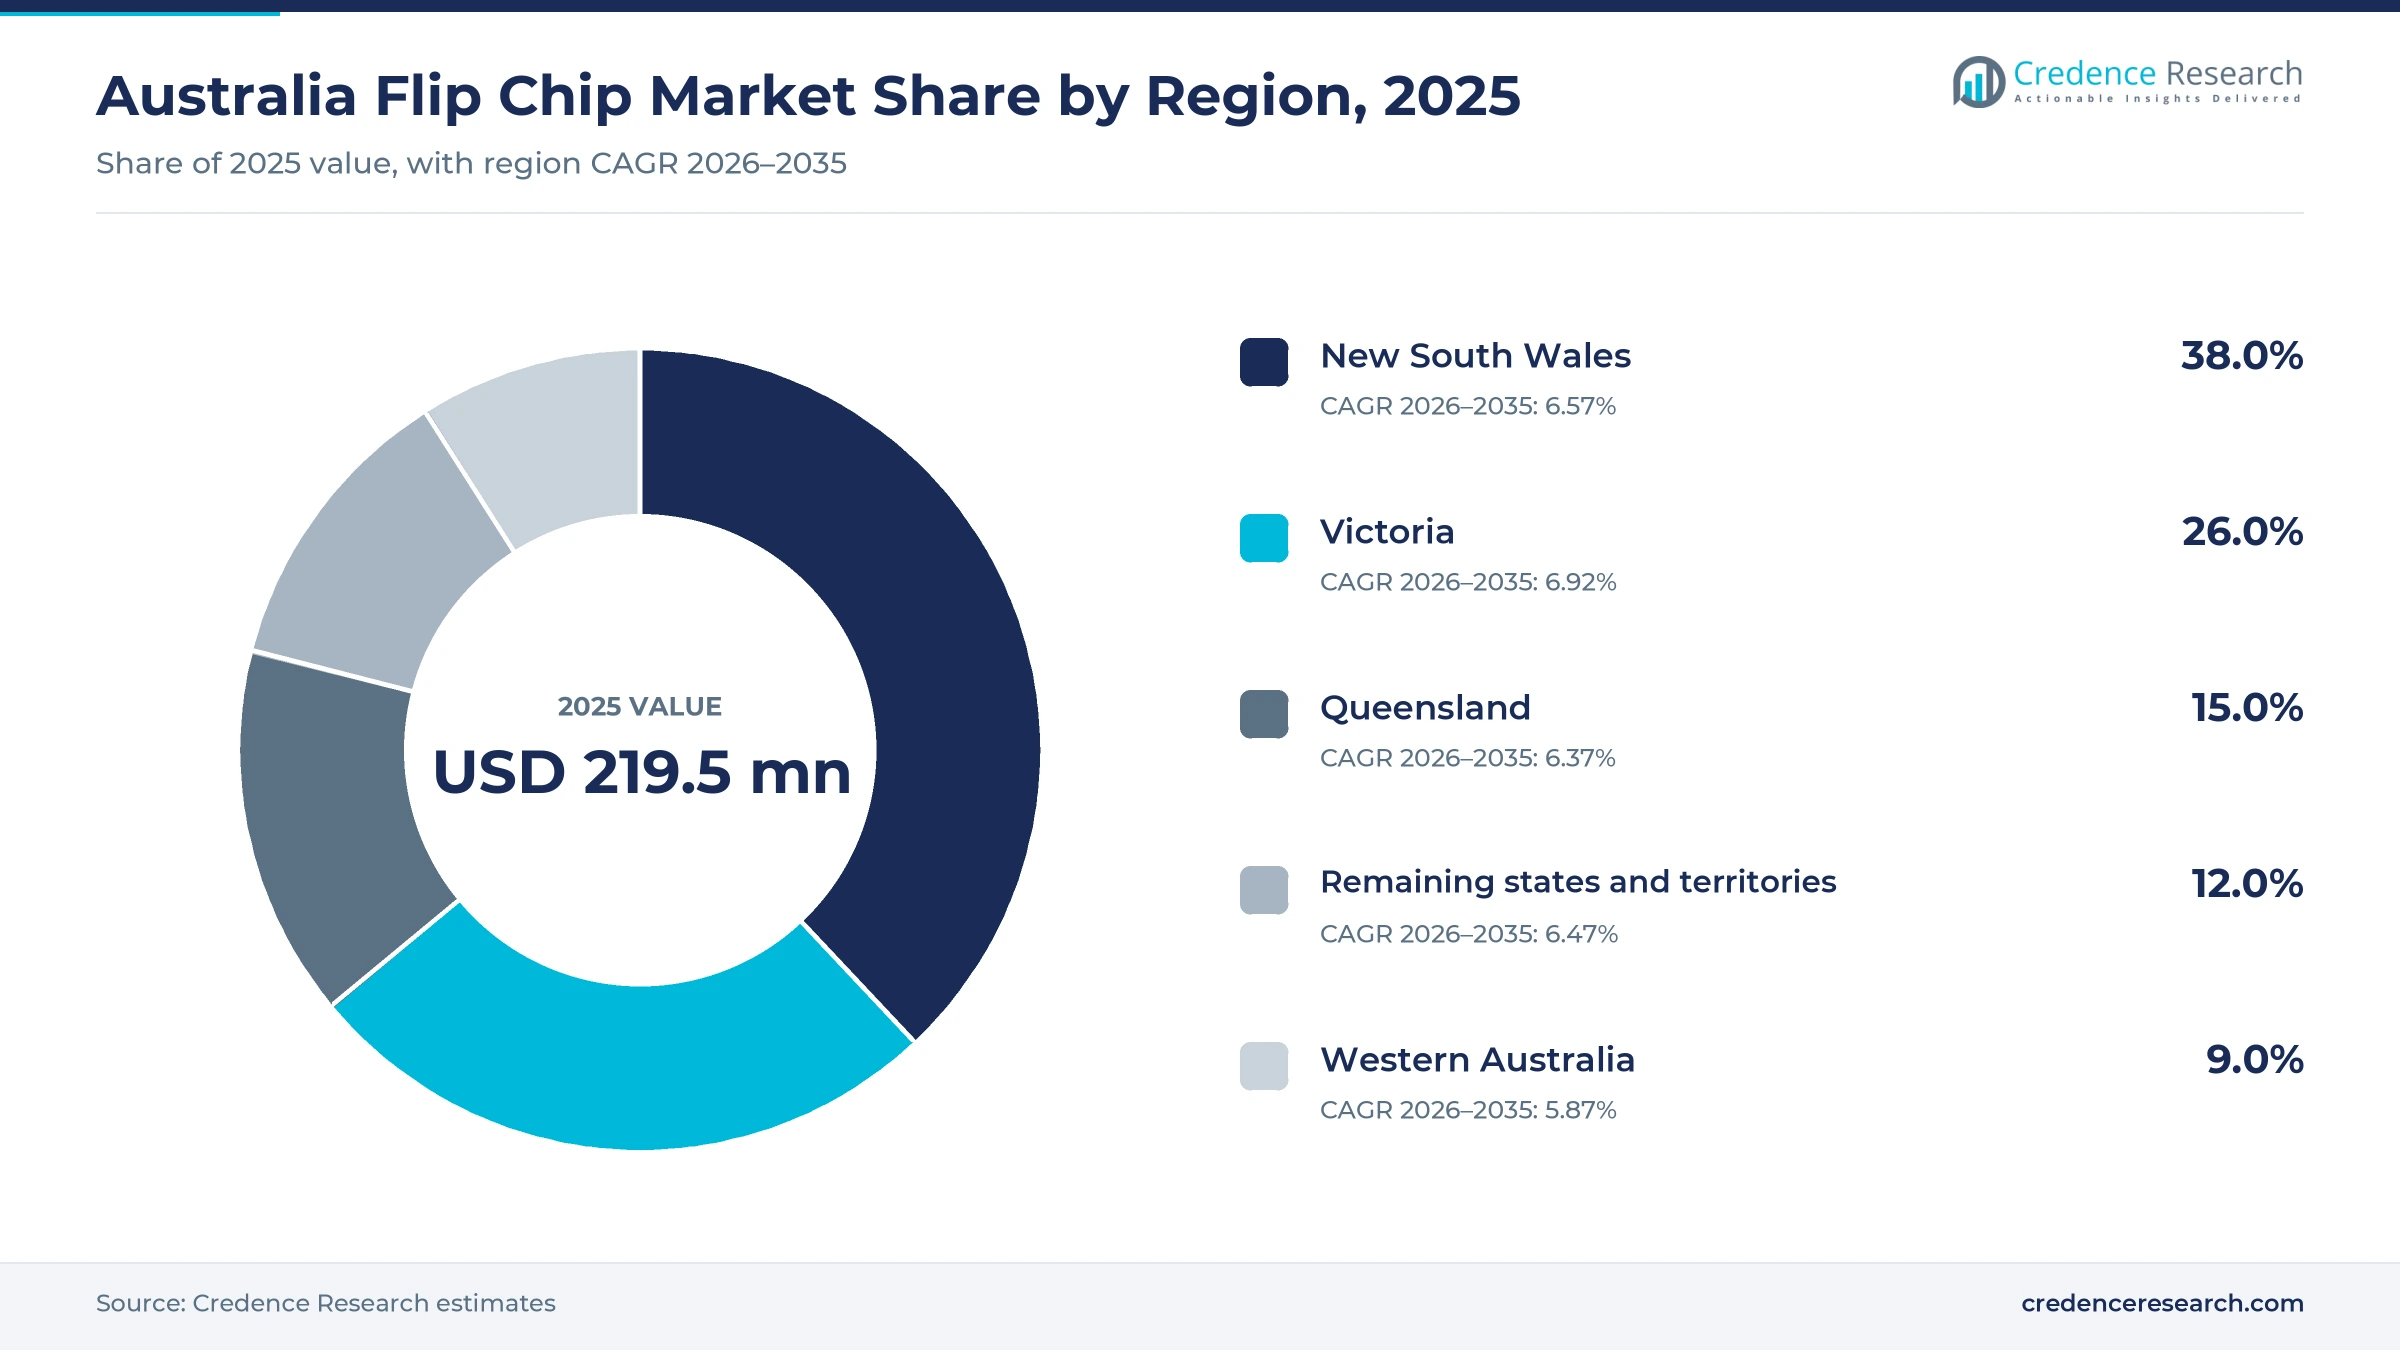
The Australia flip chip market was valued at USD 219.5 million in 2025 and is projected to increase from USD 233.8 million in 2026 to USD 414.1 million by 2035, registering a CAGR of 6.56% during 2026–2035. Demand comes from cloud operators, telecom carriers, defense contractors and device makers that buy processors, accelerators, modems and radio chips packaged face down on solder or copper bumps, mostly inside imported servers, phones and network gear. New South Wales held the largest regional share, 38.0% in 2025, because Sydney hosts the largest cluster of hyperscale data centers and carrier exchanges in the country. Victoria is the fastest-growing region at 6.92% a year, as new cloud capacity rises around Melbourne. However, the commercial picture is changing quickly, because hyperscale operators committed tens of billions of Australian dollars to new local capacity in 2025 and 2026, which shifts value toward accelerator packages.
Which packages and buyers does the estimate cover?
The estimate measures the value of flip-chip packaged semiconductors consumed in Australia, including chip-scale packages, ball grid arrays, land and pin grid arrays and advanced integrated packages that join dies to a substrate through bumps. It counts packages that arrive inside imported equipment as well as loose components bought through distributors or directly from suppliers.
The estimate excludes wire-bonded packages, bare wafers, printed circuit boards and the finished value of the equipment that carries the packages. The value chain runs from foreign wafer fabs and assembly plants through equipment makers and distributors to the cloud operators, carriers, contractors and households that use the devices in Australia.
Australia Flip Chip Market Insights
- The Australia flip chip market was valued at USD 219.5 million in 2025 and is projected to reach USD 414.1 million by 2035, registering a CAGR of 6.56% during 2026–2035.
- New South Wales held a 38.0% share of 2025 value, because Sydney hosts the largest concentration of hyperscale data centers and the state had 8.67 million residents in March 2026.
- Ball grid array packages led with a 37.0% share of 2025 value, because processors, network chips and memory controllers in imported equipment mostly use this format.
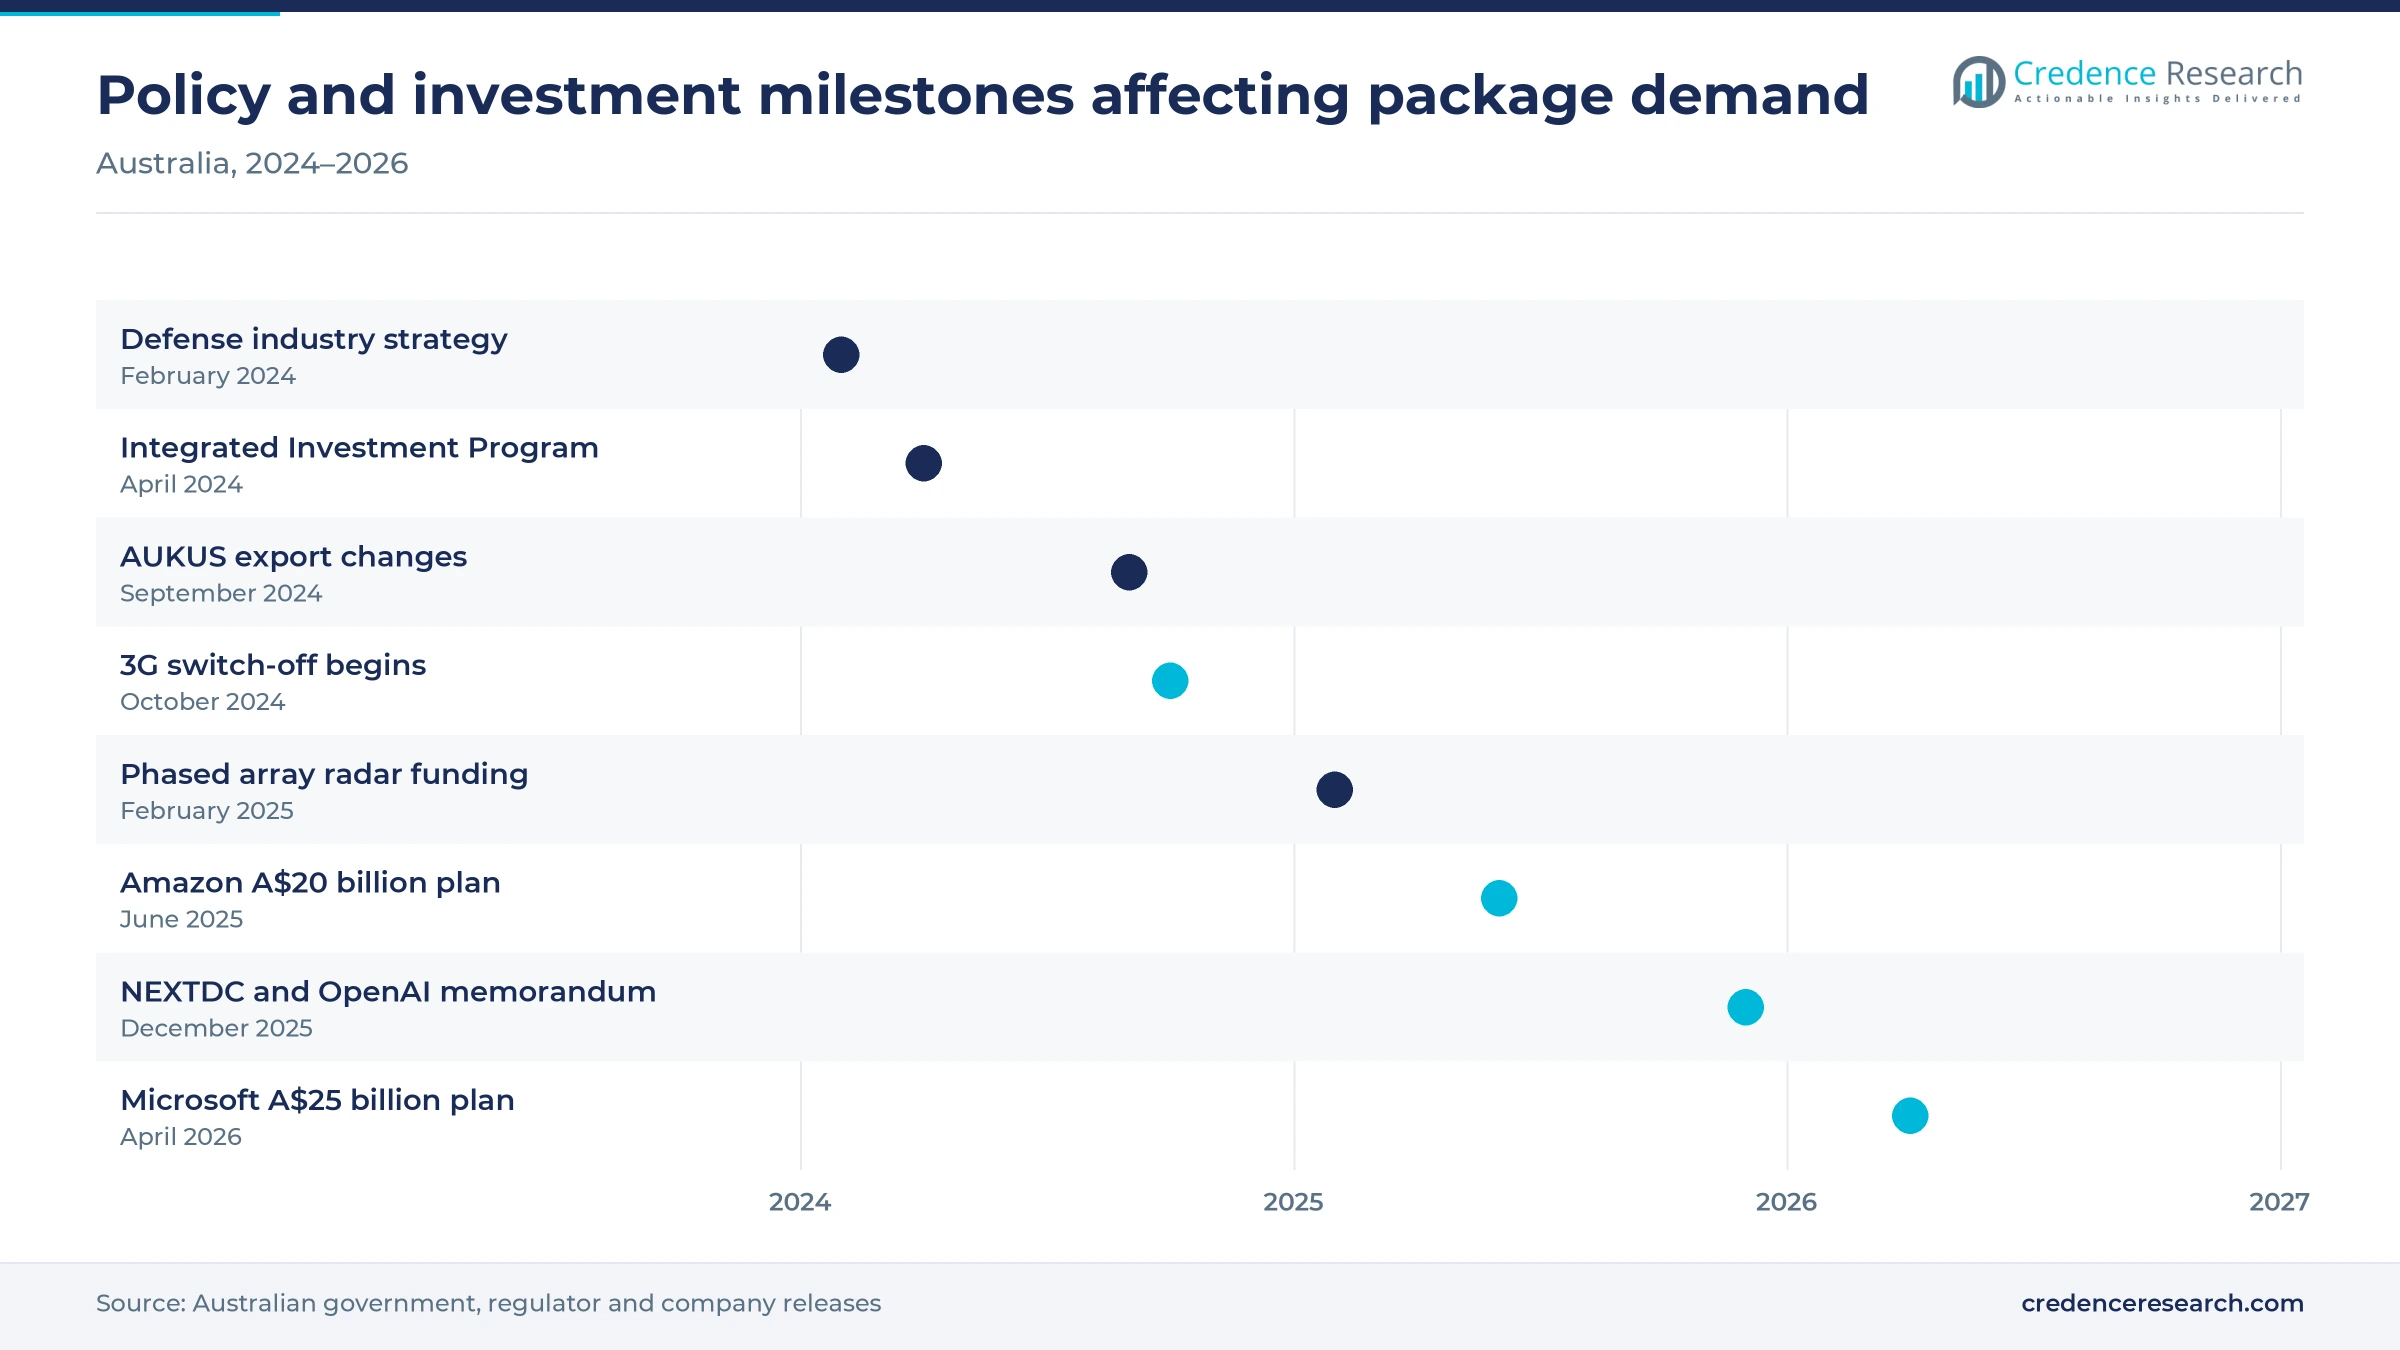
- Amazon announced on June 14, 2025, that it will invest A$20 billion in Australian data center infrastructure from 2025 to 2029, which lifts demand for server packages.
- Advanced integrated packages grow fastest at 8.26% a year during 2026–2035, as accelerator clusters for local AI services move from plans to installation.
Ball grid arrays lead while advanced packages grow fastest
Why do ball grid arrays hold the largest value?
Based on product type, the market is categorized into chip-scale packages, ball grid array packages, land and pin grid array packages and advanced integrated packages. Ball Grid Array Packages led with a 37.0% share of 2025 value, because server, router and handset processors mostly use ball grid array packaging. Advanced Integrated Packages grow fastest at 8.26% a year, as accelerator modules with stacked memory reach local AI clusters.
How do consumer devices still anchor package value?
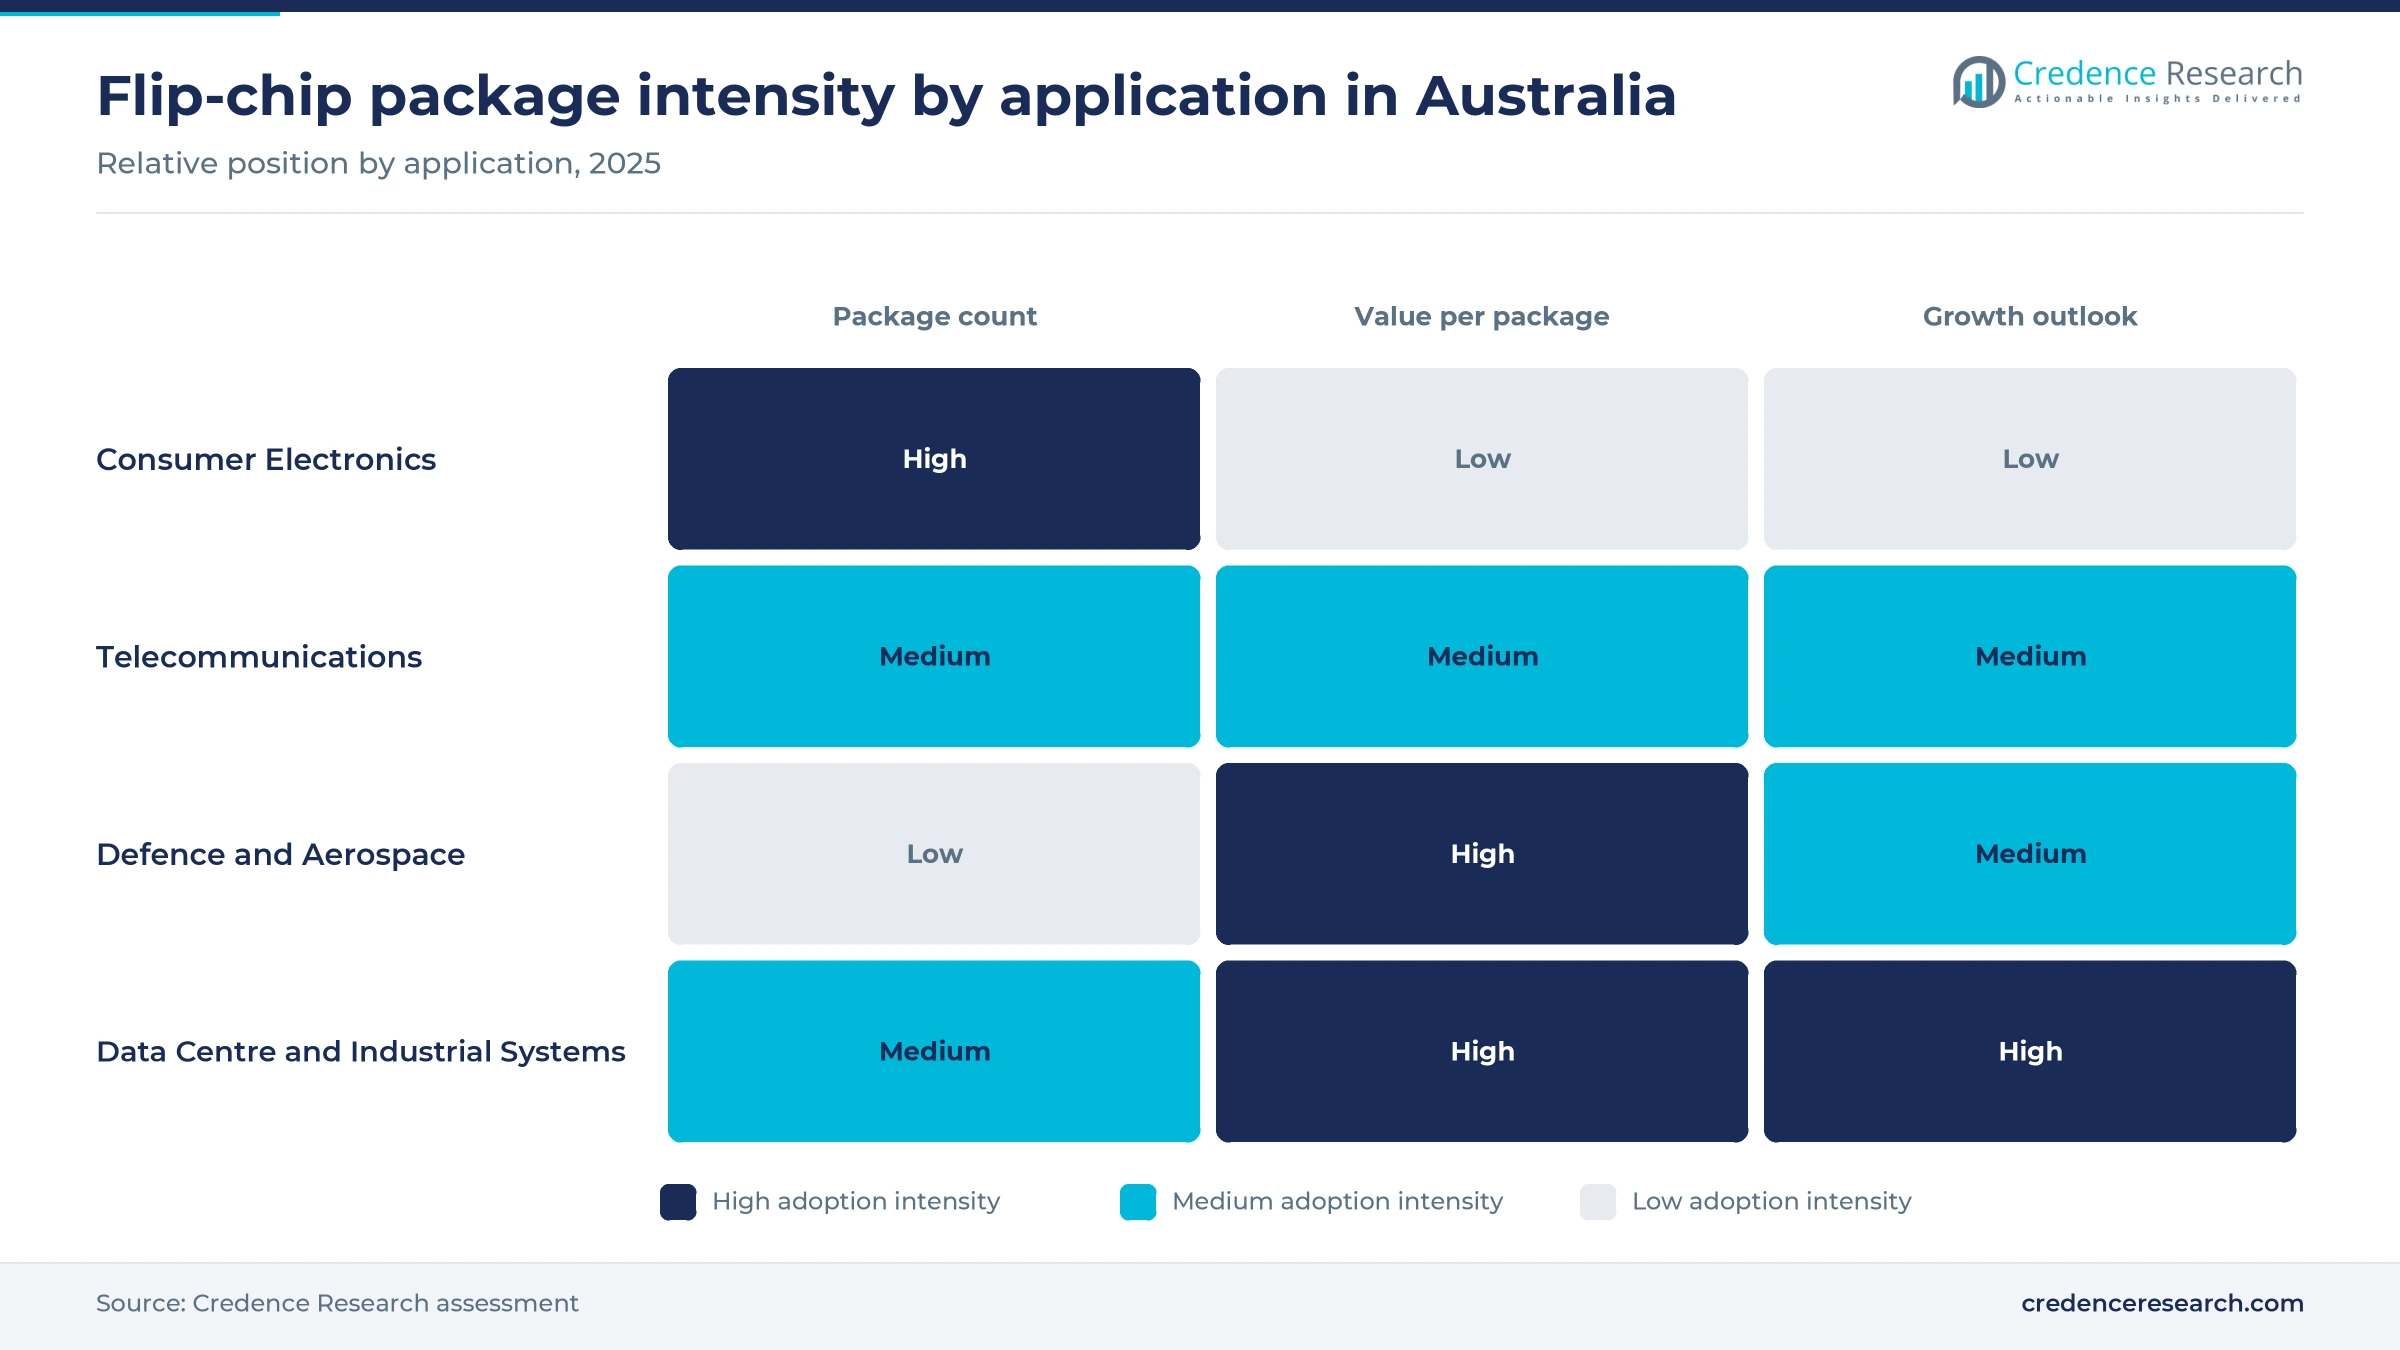
Based on application, the market is categorized into consumer electronics, telecommunications, defence and aerospace, and data centre and industrial systems. Consumer Electronics led with a 40.0% share of 2025 value, because phones, laptops and consoles contain several flip-chip packages each. Data Centre and Industrial Systems grow fastest at 7.74% a year, as hyperscale operators fill new halls with accelerator servers.
Why do solder bumps remain the main interconnect?
Based on technology, the market is categorized into solder bump interconnects, copper pillar interconnects and gold bump interconnects. Solder Bump Interconnects led with a 52.0% share of 2025 value, because mature processors and radio chips still use tin-silver solder balls. Copper Pillar Interconnects grow fastest at 7.70% a year, as finer bump pitches suit accelerators, modems and stacked memory.
How do equipment imports carry most packages?
Based on sales channel, the market is categorized into embedded equipment imports, authorised component distribution and direct component procurement. Embedded Equipment Imports led with a 72.0% share of 2025 value, because Australia buys most servers, phones and network gear fully assembled. Direct Component Procurement grows fastest at 7.46% a year, as local designers and defense manufacturers source parts directly.
| Segment Group | Leading Sub-segment | Share, 2025 | Fastest-growing Sub-segment | CAGR, 2026–2035 |
|---|---|---|---|---|
| By Product Type | Ball Grid Array Packages | 37.0% | Advanced Integrated Packages | 8.26% |
| By Application | Consumer Electronics | 40.0% | Data Centre and Industrial Systems | 7.74% |
| By Technology | Solder Bump Interconnects | 52.0% | Copper Pillar Interconnects | 7.70% |
| By Sales Channel | Embedded Equipment Imports | 72.0% | Direct Component Procurement | 7.46% |
Request a Free Sample
Fill in your details and we'll send you a free sample report.
- Sample data tables & charts
- Research methodology
Cloud builds, network refresh and defense lift demand
How does cloud and accelerator procurement lift demand?
Hyperscale construction is the largest source of new package demand, because every server board carries processors, accelerators and network chips mounted face down. Amazon said on June 14, 2025, that it will invest A$20 billion from 2025 to 2029 to expand its data centers in Sydney and Melbourne. Microsoft then announced A$25 billion on April 23, 2026, and plans to grow its local footprint by more than 140% by the end of 2029. Sharon AI also signed a six-year agreement with NVIDIA in June 2026 for up to 40,000 Grace Blackwell GB300 GPUs. Data centers used about 4 TWh in fiscal 2025, about 2.2% of demand on the National Electricity Market, according to the Australian Energy Market Operator. As a result, Data Centre and Industrial Systems grow fastest at 7.74% a year during 2026–2035.
Why does telecom capacity and equipment refresh matter?
Carrier network upgrades replace radios, baseband units and customer devices, and each one uses flip-chip processors and modems. Telstra and Optus began switching off their 3G networks on Oct. 28, 2024, which forced users to replace payment terminals, security cameras, asset trackers and older phones. Telstra had 6,421 5G sites at Jan. 31, 2025, and added 1,339 in the prior year, according to the competition regulator. Optus had 4,939 5G sites and TPG 3,759 on its own network at the same date. Telstra, Ericsson and Qualcomm then reached a 682 Mbps uplink in February 2026 on a live Queensland network using an X85 modem. In turn, carrier refresh keeps telecommunications demand steady, while phones help consumer electronics hold 40.0% of 2025 value.
How does defense electronics qualification and sustainment add value?
Defense programs need radar, electronic warfare and communications electronics that are qualified, tracked and supported for decades. The 2024 Integrated Investment Program sets A$330 billion of spending over the decade to 2033-34, according to the defense minister, with defense spending reaching about 2.4% of GDP. The government also committed A$272 million in February 2025 for up to 14 multi-mission phased array radars from CEA Technologies in Canberra. The Defence Trade Controls Amendment Act took effect on Sept. 1, 2024, removing permit requirements for most military and dual-use goods moved among Australia, the U.K. and the U.S. As a result, local contractors can source qualified packages from allied suppliers with fewer approvals and shorter lead times.
Why do local chip design and quantum programs add new buyers?
Australian chip designers and computing projects add direct buyers of packaged parts, because each new product needs prototype and production packages from foreign assembly plants. Sydney-based Morse Micro raised A$88 million in a Series C round on Sept. 23, 2025, led by MegaChips with the National Reconstruction Fund Corporation participating. The company says its Wi-Fi HaLow chips have reached mass production with leading device makers, and its total funding exceeds A$290 million. The Commonwealth and Queensland governments also committed A$940 million in April 2024 to a PsiQuantum computer near Brisbane Airport. In turn, direct component procurement grows fastest at 7.46% a year during 2026–2035.
Copper pillars and sovereign AI sites reshape demand
Why is the shift to finer interconnect pitch gaining pace?
Accelerators and stacked memory need more connections in a smaller area, which pushes package makers toward finer plated bumps. The global semiconductor market reached about USD 795.6 billion in 2025, up 26.2%, according to the World Semiconductor Trade Statistics spring 2026 forecast. The same forecast expects logic sales to rise 37.3% and memory sales 249.5% in 2026. Sharon AI plans more than 55,000 NVIDIA GPUs in Australia by mid-2027, up from 432 online in September 2025. As a result, copper pillar interconnects grow fastest at 7.70% a year during 2026–2035, while solder bumps keep their lead in mature processors and consumer devices.
Why is the rise of sovereign AI facilities notable?
Sovereign AI facilities are emerging as a distinct demand pool, because government, defense and health workloads must stay in Australia under strict security rules. NEXTDC signed a memorandum with OpenAI on Dec. 5, 2025, to plan a GPU supercluster at its S7 site in Eastern Creek, with the first phase expected in the second half of 2027. The government released its National AI Plan in December 2025 and then set expectations for data center developers on energy, water and local skills. Blackstone also closed its A$24 billion acquisition of AirTrunk, a hyperscale data center operator, in December 2024. In turn, advanced integrated packages grow fastest at 8.26% a year during 2026–2035.
Can defense sustainment open direct supply programs?
Long defense programs give suppliers a clear opening, because qualified packages must be stocked and supported long after commercial parts reach end of life. The Defence Industry Development Strategy of Feb. 29, 2024, named seven sovereign industrial priorities, including battlespace awareness and management systems. The same release lifted defense industry grant programs to A$183.8 million. CEA Technologies will produce up to 14 phased array radars, which will be based at the Edinburgh Defence Precinct in South Australia. As a result, authorized distributors and direct suppliers that hold traceable stock of qualified parts can win long sustainment contracts, while the remaining states and territories grow at 6.47% a year.
Is there room to grow in regional 5G and IoT devices?
Regional network expansion offers an opening, because new sites and connected devices outside capital cities need fresh modems and radio chips. Only 17% of Telstra's new 5G sites in the year to January 2025 were in major cities, according to the ACCC infrastructure report. Business guidance from the Commonwealth also listed EFTPOS terminals, security systems, scanners, smartwatches and asset trackers among devices affected by the 3G closure. Morse Micro also launched a second-generation HaLow system-on-chip in 2025 for long-range IoT links. In turn, small regional sensors and trackers add steady volume for chip-scale packages, which suit compact battery-powered devices.
Import reliance, grid limits and price swings weigh
How does import reliance limit local control of supply?
Most flip-chip packages used in Australia arrive already mounted inside finished equipment, and the rest come from foreign suppliers of advanced semiconductor packaging. Direct imports of integrated circuits reached about USD 492.7 million in 2025, up from USD 449.5 million in 2024, according to UN Comtrade data. As a result, local buyers have little influence over package choices, lead times and allocation in tight markets. Buyers respond with longer contracts, multiple suppliers and buffer stock.
Why do grid and energy limits slow data center builds?
Accelerator halls draw large amounts of power, so grid connections can delay the servers that carry the most valuable packages. The energy market operator expects data center use to reach about 12 TWh by 2029-30, about 6% of grid-supplied electricity, with average growth of 25% a year. The national expectations ask developers to fund new renewable supply and their share of grid connections. In turn, projects without secured power face later installation dates. Operators respond with power purchase agreements and on-site renewable supply.
How do qualification and export rules raise costs?
Defense and aerospace buyers need traceable, qualified parts, which adds testing, paperwork and holding costs. The 2024 export control changes removed many permits among the three AUKUS partners, but three new controls can still require permits for some supplies and transfers. Small Australian contractors often lack dedicated compliance staff for these rules. As a result, qualified parts cost more and take longer to approve than commercial parts. Suppliers respond with authorized distribution, obsolescence planning and lifetime buys.
Why do memory-driven price swings complicate budgets?
Package demand rides on wider semiconductor cycles, so sharp price moves in memory and accelerators can upset buying plans. The spring 2026 industry forecast expects memory sales to rise about 250% in 2026, well above growth in other product groups. Higher memory prices raise the cost of servers and phones that carry flip-chip packages. In turn, Australian buyers paying in local currency may delay or resize refresh programs. Buyers respond with staged orders, multi-year cloud contracts and closer tracking of supplier allocation.
New South Wales leads while Victoria grows fastest
| Region | Value, 2025 (USD million) | Share, 2025 | CAGR, 2026–2035 |
|---|---|---|---|
| New South Wales | 83.4 | 38.0% | 6.57% |
| Victoria | 57.1 | 26.0% | 6.92% |
| Queensland | 32.9 | 15.0% | 6.37% |
| Remaining states and territories | 26.3 | 12.0% | 6.47% |
| Western Australia | 19.8 | 9.0% | 5.87% |
Why does Sydney anchor the largest regional share?
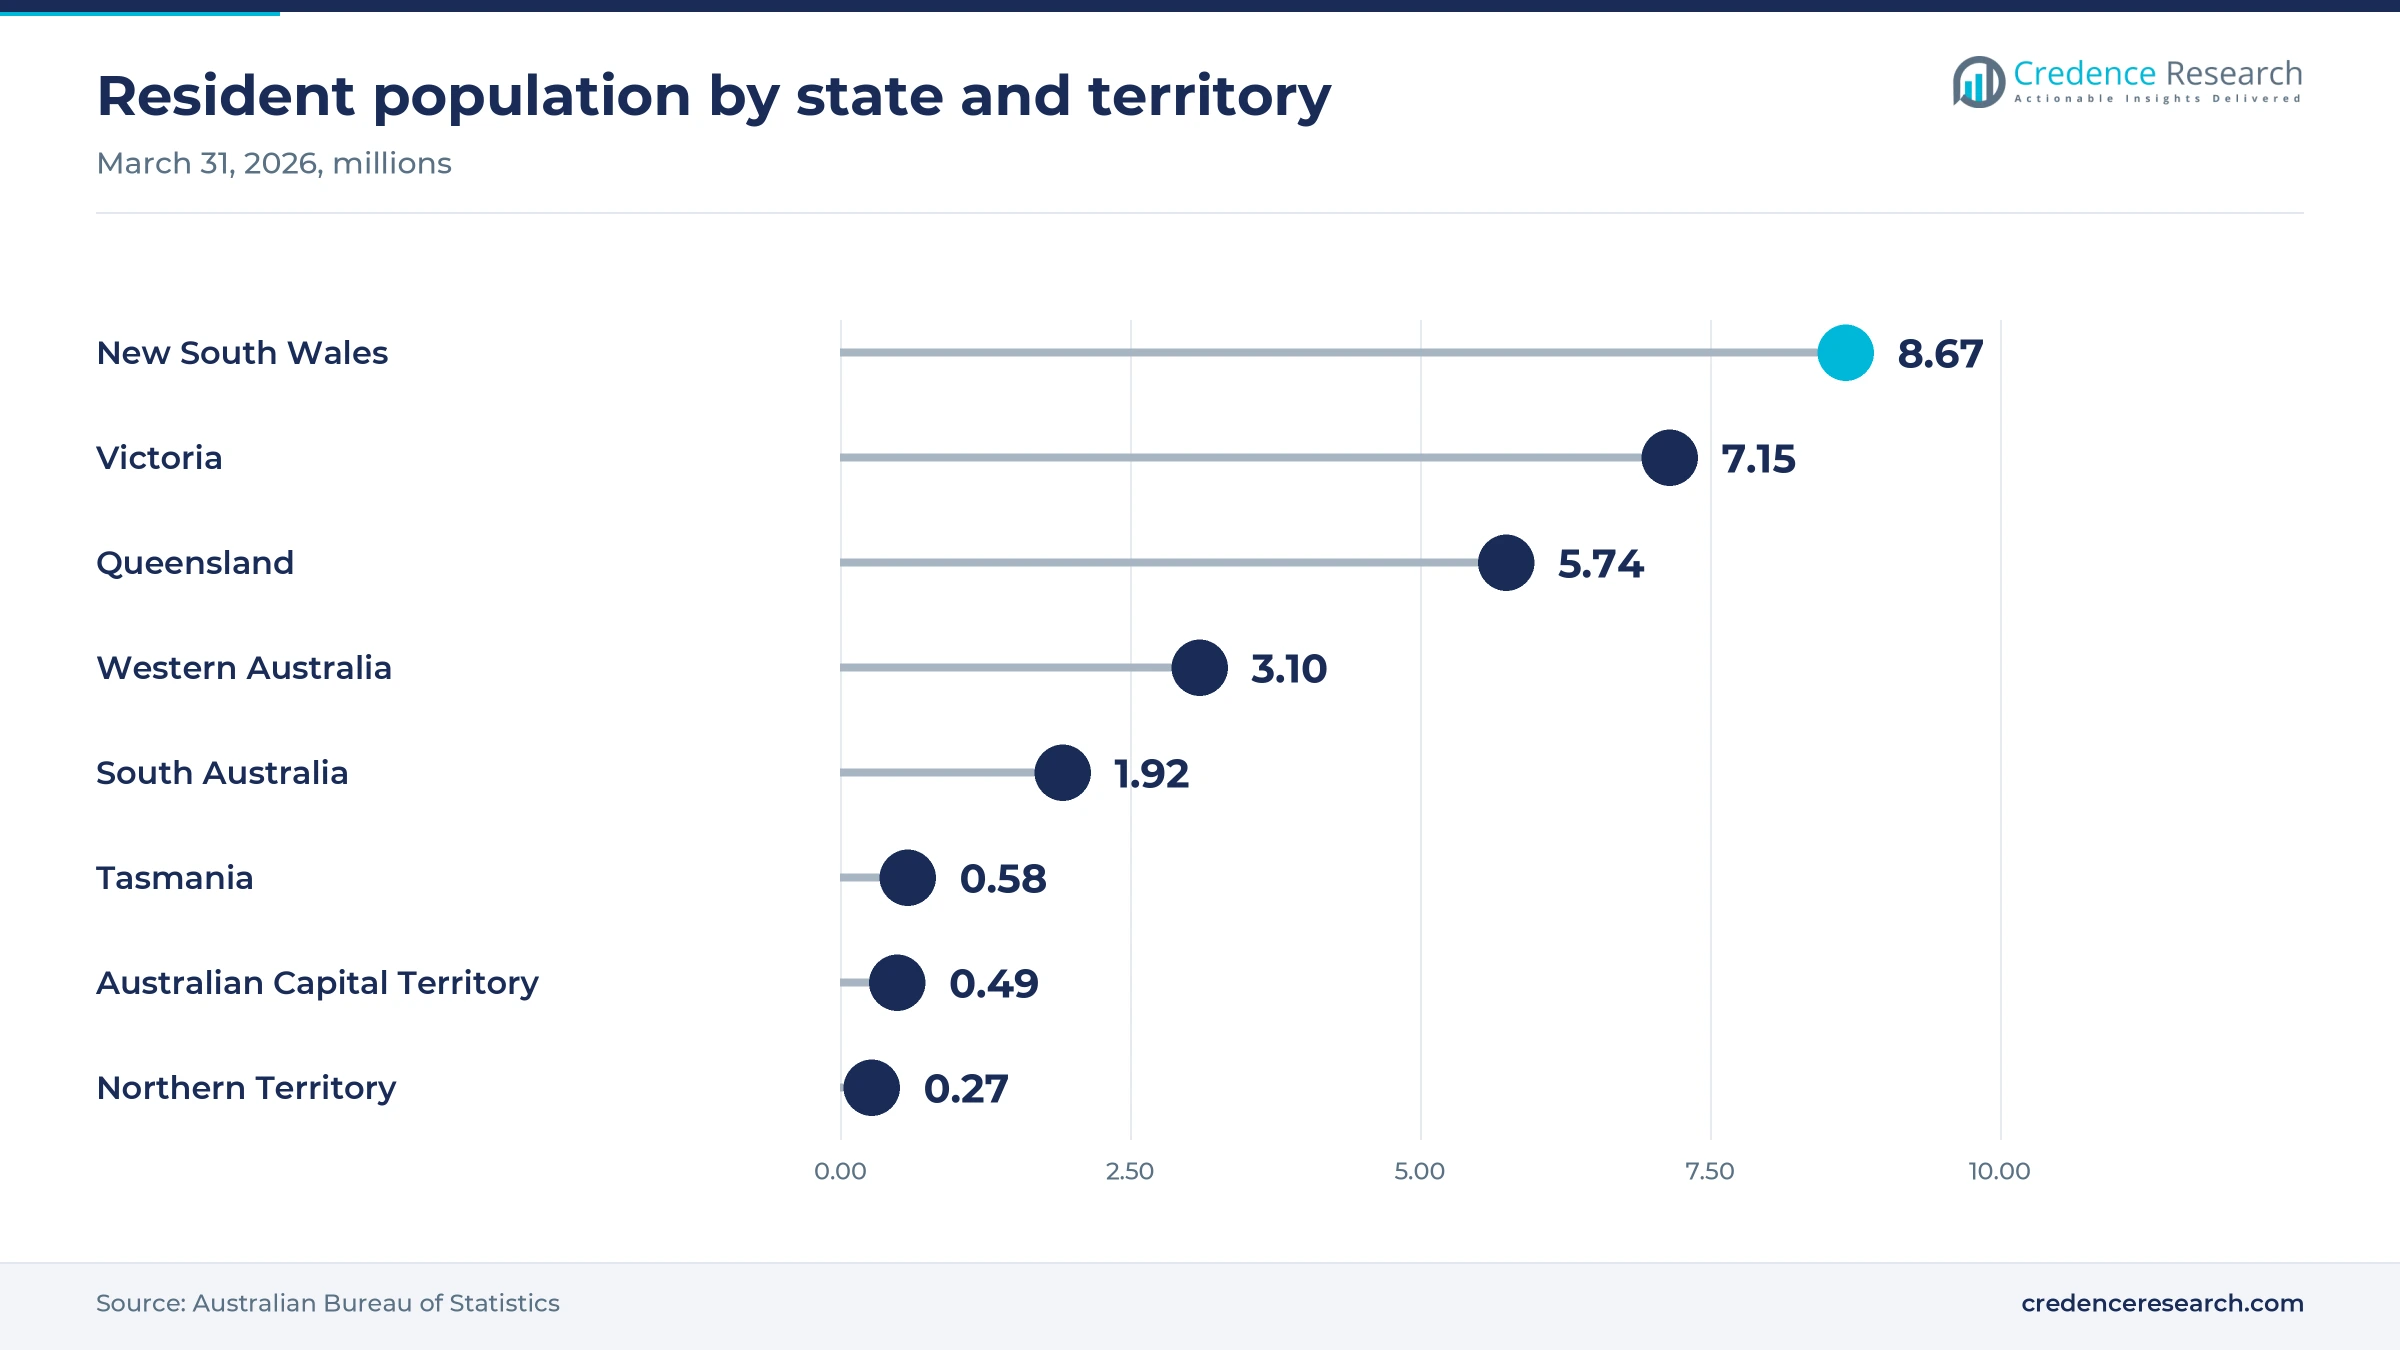
New South Wales held a 38.0% share of 2025 value and grows at 6.57% a year, because Sydney hosts the largest cluster of hyperscale campuses in the country. AirTrunk runs three Sydney facilities, while NEXTDC plans its sovereign AI campus at Eastern Creek in Sydney's west. The state also had 8.67 million residents at March 31, 2026, according to the Australian Bureau of Statistics. As a result, the state leads both server and consumer device demand.
Why is Victoria growing fastest?
Victoria held a 26.0% share of 2025 value and grows fastest at 6.92% a year, because new cloud capacity is rising around Melbourne. Amazon will expand its Melbourne data centers under its A$20 billion plan, and the three solar farms it supports are in Victoria and Queensland. AirTrunk also runs two facilities in Melbourne, which add hyperscale capacity in the state. Victoria added 109,500 residents in the year to March 2026, the largest gain in the country, which adds device and network demand.
How does Queensland add network and computing demand?
Queensland held a 15.0% share of 2025 value and grows at 6.37% a year during 2026–2035. Telstra, Ericsson and Qualcomm ran their February 2026 uplink test on a live Queensland 5G network, which shows how carriers trial new modems there. PsiQuantum is also building its quantum computer near Brisbane Airport with A$940 million of government support. The state added 90,100 residents in the year to March 2026, which keeps phone and laptop demand rising.
What shapes demand in Western Australia?
Western Australia held a 9.0% share of 2025 value and grows at 5.87% a year, because demand rests on mining technology, research computing and households rather than hyperscale campuses. The Pawsey Supercomputing Centre in Kensington runs Setonix, built by HPE with AMD EPYC processors and Instinct MI250X accelerators. The state grew its population fastest at 2.1% in the year to March 2026, which supports steady consumer device purchases.
Why do Canberra and South Australia carry defense demand?
The remaining states and territories held a 12.0% share of 2025 value and grow at 6.47% a year. Canberra hosts CEA Technologies, which will produce up to 14 phased array radars, and the Gadi supercomputer, which added 720 Intel Sapphire Rapids nodes in 2023. South Australia, with 1.92 million residents, hosts the Edinburgh Defence Precinct, where those radars will be based. As a result, defense electronics give these zones a larger share than their population suggests.
Cloud, defense and chip design milestones since 2024
| Development | Status and market relevance |
|---|---|
| In April 2024, the Commonwealth and Queensland governments committed A$940 million to a PsiQuantum computer near Brisbane Airport. | Creates a local buyer of photonic and control chips |
| In February 2025, the government committed A$272 million for up to 14 phased array radars from CEA Technologies. | Supports qualified radar electronics demand |
| In June 2025, Amazon announced A$20 billion of investment in Australian data centers from 2025 to 2029. | Lifts server and network package demand in Sydney and Melbourne |
| In September 2025, Morse Micro raised A$88 million in a Series C round led by MegaChips. | Scales a Sydney chip designer that buys packaged parts |
| In April 2026, Microsoft announced A$25 billion of investment in Australian cloud and AI infrastructure through 2029. | Adds accelerator capacity across Australian cloud regions |
Bump metallurgy decides where each package fits
- Solder bump interconnects join the die to the substrate with tin-silver balls, which keeps cost low for mature processors, radio chips and consumer devices.
- Copper pillar interconnects use plated copper posts capped with solder, which allows finer pitch and better current handling for accelerators, modems and data center processors.
- Gold bump interconnects bond display drivers and some sensors through gold stud or plated bumps, which suits fine-pitch glass and film assemblies.
- Underfill and substrate design spread thermal and mechanical stress across the joint, which protects large dies in servers and rugged defense electronics from cracking.
Need a Custom Version of This Report?
Tailor the scope, geography, or segments to your exact requirements.
- Custom geography or segment scope
- Direct access to our analyst team
Global processor and modem makers shape local supply
Competition centers on global processor, accelerator and modem makers whose chips reach Australia mostly inside imported servers, network gear and phones. Advanced Micro Devices supplies the EPYC processors and Instinct accelerators in the Setonix supercomputer at the Pawsey Supercomputing Centre in Western Australia. Intel supplies Sapphire Rapids processors for the Gadi system in Canberra. NVIDIA signed a six-year agreement with Sharon AI in June 2026 covering up to 40,000 Grace Blackwell GB300 GPUs in Australian data centers. Qualcomm supplied the X85 modem used in a 682 Mbps uplink test with Telstra and Ericsson in February 2026. Analog, power and microcontroller suppliers sell through authorized distributors to local designers and defense contractors. Companies compete on performance per watt, package density, supply allocation, long-term availability and the support they give to cloud operators, carriers and qualified defense programs.
Which chip suppliers are verified in Australian deployments?
| Company | Type | Role in the market |
|---|---|---|
| Advanced Micro Devices | Processor and accelerator maker | Supplies EPYC and Instinct parts for the Setonix supercomputer |
| Intel | Processor maker | Supplies Sapphire Rapids processors for the Gadi system in Canberra |
| NVIDIA | Accelerator maker | Six-year GB300 agreement with Sharon AI for Australian capacity |
| Qualcomm | Modem and radio chip maker | X85 modem used in a Telstra 5G uplink test in Queensland |
Credence Research view on Australian package demand
Credence Research's view is that Australian flip-chip demand will grow steadily because cloud operators, carriers and defense programs keep adding equipment that relies on dense packages. Ball grid arrays remain the largest value pool, while advanced integrated packages and copper pillar interconnects grow fastest as accelerator clusters arrive. Most value will still arrive inside imported equipment, so global allocation decisions shape local supply. Suppliers that combine reliable allocation, long-term availability and strong distributor support should gain the most share by 2035, while Victoria offers the fastest regional growth.
How the national package estimate was built
The report uses 2025 as the base year on a calendar basis, and market values come from the Credence Research model. That model combines official population statistics, trade data, energy market forecasts, regulator infrastructure reports, government defense releases, industry statistics and company releases. Regional shares, segment splits and regional growth rates are Credence Research estimates based on population, data center locations, carrier networks and defense programs. No interviews or surveys were conducted for this report, and every source is public.
Data center and defense buying carry growth to 2035
The Australia flip chip market is projected to reach USD 414.1 million by 2035, growing at a 6.56% CAGR during 2026–2035. Hyperscale expansion in Sydney and Melbourne will keep server and accelerator packages at the center of demand, while sovereign AI facilities add capacity from 2027. Carrier refresh and regional 5G sites will support modem and radio chip demand through the decade. Defense radar, communications and sustainment programs will add qualified parts bought through distributors and directly. However, grid connections, import reliance and memory price swings may slow some projects, so steady supplier allocation will matter.
Frequently Asked Questions
How big is the Australia flip chip market?
Which region leads the Australia flip chip market?
Which region grows fastest?
Which product type holds the largest share?
Which application grows fastest?
How do most packages reach Australian buyers?
Which companies are active in the Australia flip chip market?
What are the main challenges for the market?
Table of Content
Chapter 1 Market Segmentation
- 1.1 Segmentation Framework
- 1.1.1 Product and Service Classification
- 1.1.2 Application and End-Use Classification
- 1.1.3 Technology and Solution Classification
- 1.1.4 Customer and Distribution Channel Classification
- 1.1.5 Geographic Segmentation
- 1.1.6 Market Segment Definitions and Boundaries
- 1.2 By Product Type
- 1.2.1 Chip-Scale Packages
- 1.2.2 Ball Grid Array Packages
- 1.2.3 Land and Pin Grid Array Packages
- 1.2.4 Advanced Integrated Packages
- 1.3 By Application
- 1.3.1 Consumer Electronics
- 1.3.2 Telecommunications
- 1.3.3 Defence and Aerospace
- 1.3.4 Data Centre and Industrial Systems
- 1.4 By Technology
- 1.4.1 Solder Bump Interconnects
- 1.4.2 Copper Pillar Interconnects
- 1.4.3 Gold Bump Interconnects
- 1.5 By Sales Channel
- 1.5.1 Embedded Equipment Imports
- 1.5.2 Authorised Component Distribution
- 1.5.3 Direct Component Procurement
Chapter 2 Introduction
- 2.1 Report Objectives and Scope
- 2.2 Product Definition and Industry Terminology
- 2.3 Market Inclusions and Exclusions
- 2.4 Research Process
- 2.4.1 Primary Research and Expert Interviews
- 2.4.2 Secondary Research and Source Review
- 2.4.3 Top-Down and Bottom-Up Estimation
- 2.4.4 Data Triangulation and Verification
- 2.5 Market Size Measurement Basis
- 2.5.1 2025: USD 219.5 million → 2035: USD 414.1 million
- 2.6 Historical and Forecast Reference Periods
- 2.6.1 Historical Period: 2018-2025
- 2.6.2 Base Year: 2025
- 2.6.3 Forecast Period: 2025-2035
- 2.7 Research Assumptions and Limitations
Chapter 3 Executive Summary
- 3.1 Market Snapshot and Key Findings
- 3.2 Base-Year Market Size, 2025
- 3.3 Forecast Market Size, 2035
- 3.4 Revenue and Volume Growth Outlook
- 3.5 Key Demand and Supply Indicators
- 3.6 Leading Market Segments
- 3.7 Fastest-Growing Market Opportunities
- 3.8 Regional Performance Highlights
- 3.9 Technology and Industry Transformation
- 3.10 Competitive Landscape Summary
- 3.11 Analyst View and Strategic Implications
Chapter 4 Australia Flip Chip Market Trends and Developments
- 4.1 Historical Industry Development, 2018-2025
- 4.2 Recent Market Trends and Developments
- 4.3 Demand and Customer Behavior Trends
- 4.4 Technology and Product Innovation
- 4.5 Artificial Intelligence, Automation and Digitalization
- 4.6 Local Manufacturing and Supply Chain Realignment
- 4.7 Industry Partnerships, Mergers and Acquisitions
- 4.8 Sustainability and Circular Economy Developments
- 4.9 Government and Private Sector Investment Trends
- 4.10 Emerging Business Models and Commercialization
- 4.11 Industry Developments and Announcements
Chapter 5 Australia Flip Chip Market Production, Supply and Demand Analysis
- 5.1 Demand Trend and Consumption Analysis, 2018-2025
- 5.2 Demand Forecast, 2025-2035
- 5.3 Production and Output Trend, 2018-2025
- 5.4 Production and Output Forecast, 2025-2035
- 5.5 Installed Capacity and Capacity Utilization
- 5.6 Company-Wise Production Plants and Statistics
- 5.6.1 Installed Production Capacity
- 5.6.2 Actual Production
- 5.6.3 Planned Capacity and Expansion Targets
- 5.7 Supply Chain Structure and Procurement Trends
- 5.8 Supply-Demand Gap and Bottlenecks
- 5.9 Import Dependence and Sourcing Structure
- 5.10 Contract Manufacturing and Outsourcing
- 5.11 Regional Supply and Demand Concentration
Chapter 6 Australia Flip Chip Market Pricing Analysis
- 6.1 Pricing Structure and Measurement
- 6.2 Historical Pricing Trends, 2018-2025
- 6.3 Pricing Outlook, 2025-2035
- 6.4 Average Selling Price and Unit Economics
- 6.5 Pricing by Product and Market Segment
- 6.6 Geographic Pricing Differences
- 6.7 Key Input, Energy, Labor and Logistics Costs
- 6.8 Contract Pricing and Purchasing Models
- 6.9 Pricing Sensitivity and Competitive Positioning
- 6.10 Price, Margin and Profitability Implications
Chapter 7 Australia Flip Chip Market Dynamics
- 7.1 Market Growth Drivers
- 7.1.1 Demand-Side Drivers
- 7.1.2 Technology and Innovation Drivers
- 7.1.3 Infrastructure and Investment Drivers
- 7.1.4 Regulatory and Policy Drivers
- 7.2 Market Restraints
- 7.2.1 Cost and Affordability Constraints
- 7.2.2 Technology and Adoption Barriers
- 7.2.3 Supply Chain and Operational Constraints
- 7.3 Market Challenges
- 7.3.1 Competitive Pressure and Margin Erosion
- 7.3.2 Skills, Infrastructure and Implementation Gaps
- 7.4 Emerging Market Opportunities
- 7.5 Market Dynamics Impact and Time-Horizon Assessment
Chapter 8 Australia Flip Chip Value Chain Analysis
- 8.1 Industry Value Chain Overview
- 8.2 Upstream Suppliers and Critical Inputs
- 8.3 Technology and Component Providers
- 8.4 Manufacturing or Service Delivery
- 8.5 Distribution, Channel Partners and Integrators
- 8.6 Downstream Applications and End Users
- 8.7 Value Addition and Profit Pools
- 8.8 Vertical Integration and Outsourcing
- 8.9 Supplier Concentration and Risk
- 8.10 Supply Chain Localization and Resilience
Chapter 9 Australia Flip Chip Market Regulations and Policies
- 9.1 Relevant Laws, Standards and Compliance Frameworks
- 9.2 Product, Service, Safety and Quality Requirements
- 9.3 Government Policies, Incentives and Subsidies
- 9.4 Imports, Exports and Trade Barriers
- 9.5 Public Procurement and Local Content Requirements
- 9.6 Environmental and Sustainability Compliance
- 9.7 Upcoming Policy Changes and Market Implications
Chapter 10 Australia Flip Chip Market Hotspots and Opportunities
- 10.1 Market Opportunity Mapping and Growth Hotspots
- 10.2 High-Growth Applications and Customer Groups
- 10.3 Underserved Markets and White-Space Opportunities
- 10.4 Emerging Technology and Product Opportunities
- 10.5 New Capacity and Investment Hotspots
- 10.6 Market Entry and Expansion Opportunities
- 10.7 Distribution and Partnership Opportunities
- 10.8 Near-Term and Long-Term Commercial Potential
- 10.9 Opportunity Attractiveness and Execution Risks
Chapter 11 Australia Flip Chip Market Outlook, 2025-2035
- 11.1 Market Size and Analysis
- 11.1.1 Revenue (Market Measurement: 2025: USD 219.5 million → 2035: USD 414.1 million)
- 11.1.2 Market Volume and Quantity Sold
- 11.1.3 Historical Market Size, 2018-2025
- 11.1.4 Base-Year Market Size, 2025
- 11.2 Market Forecast, 2025-2035
- 11.2.1 Revenue Forecast to 2035
- 11.2.2 Volume Forecast to 2035
- 11.2.3 CAGR and Year-on-Year Growth
- 11.2.4 Incremental Revenue Opportunity
- 11.3 Forecast Assumptions and Scenario Analysis
- 11.3.1 Base-Case Forecast
- 11.3.2 Optimistic and Conservative Scenarios
- 11.3.3 Technology, Pricing and Policy Sensitivities
- 11.4 Market Attractiveness and Growth Outlook
Chapter 12 Australia Flip Chip Market Segmentation and Outlook
- 12.1 Segmentation Summary and Market Shares, 2025
- 12.2 Largest and Fastest-Growing Segments
- 12.3 By Product Type - Market Size and Forecast, 2025-2035
- 12.3.1 Segment Definition and Scope
- 12.3.2 Historical Market Size, 2018-2025
- 12.3.3 Revenue Forecast, 2025-2035
- 12.3.4 Volume Forecast, 2025-2035
- 12.3.5 Base-Year Market Share, 2025
- 12.3.6 Segment CAGR and Growth Drivers
- 12.3.7 Subsegment Market Size and Forecast
- 12.3.7.1 Chip-Scale Packages
- 12.3.7.2 Ball Grid Array Packages
- 12.3.7.3 Land and Pin Grid Array Packages
- 12.3.7.4 Advanced Integrated Packages
- 12.3.8 Subsegment Pricing and Adoption Trends
- 12.3.9 Leading Suppliers and Competition
- 12.3.10 Regional Demand and Opportunities
- 12.4 By Application - Market Size and Forecast, 2025-2035
- 12.4.1 Segment Definition and Scope
- 12.4.2 Historical Market Size, 2018-2025
- 12.4.3 Revenue Forecast, 2025-2035
- 12.4.4 Volume Forecast, 2025-2035
- 12.4.5 Base-Year Market Share, 2025
- 12.4.6 Segment CAGR and Growth Drivers
- 12.4.7 Subsegment Market Size and Forecast
- 12.4.7.1 Consumer Electronics
- 12.4.7.2 Telecommunications
- 12.4.7.3 Defence and Aerospace
- 12.4.7.4 Data Centre and Industrial Systems
- 12.4.8 Subsegment Pricing and Adoption Trends
- 12.4.9 Leading Suppliers and Competition
- 12.4.10 Regional Demand and Opportunities
- 12.5 By Technology - Market Size and Forecast, 2025-2035
- 12.5.1 Segment Definition and Scope
- 12.5.2 Historical Market Size, 2018-2025
- 12.5.3 Revenue Forecast, 2025-2035
- 12.5.4 Volume Forecast, 2025-2035
- 12.5.5 Base-Year Market Share, 2025
- 12.5.6 Segment CAGR and Growth Drivers
- 12.5.7 Subsegment Market Size and Forecast
- 12.5.7.1 Solder Bump Interconnects
- 12.5.7.2 Copper Pillar Interconnects
- 12.5.7.3 Gold Bump Interconnects
- 12.5.8 Subsegment Pricing and Adoption Trends
- 12.5.9 Leading Suppliers and Competition
- 12.5.10 Regional Demand and Opportunities
- 12.6 By Sales Channel - Market Size and Forecast, 2025-2035
- 12.6.1 Segment Definition and Scope
- 12.6.2 Historical Market Size, 2018-2025
- 12.6.3 Revenue Forecast, 2025-2035
- 12.6.4 Volume Forecast, 2025-2035
- 12.6.5 Base-Year Market Share, 2025
- 12.6.6 Segment CAGR and Growth Drivers
- 12.6.7 Subsegment Market Size and Forecast
- 12.6.7.1 Embedded Equipment Imports
- 12.6.7.2 Authorised Component Distribution
- 12.6.7.3 Direct Component Procurement
- 12.6.8 Subsegment Pricing and Adoption Trends
- 12.6.9 Leading Suppliers and Competition
- 12.6.10 Regional Demand and Opportunities
- 12.7 Segment Growth Comparison
- 12.8 Segment Attractiveness and Priority Matrix
Chapter 13 Australia Flip Chip End-Use and Application Market Outlook
- 13.1 End-Use Industry and Customer Demand Structure
- 13.2 Leading Applications and Customer Groups
- 13.3 End-Use Market Size, Share and Forecast
- 13.4 Major End-Use Industry Deep Dives
- 13.4.1 Customer Requirements and Use Cases
- 13.4.2 Demand and Replacement Cycles
- 13.4.3 Technical and Regulatory Considerations
- 13.4.4 Purchasing and Procurement Models
- 13.4.5 Leading Vendors and Distribution Channels
- 13.4.6 Forecast and Commercial Opportunities
- 13.5 Emerging Applications and Cross-Segment Demand
- 13.6 End-Use Industry Investment Priorities
Chapter 14 Australia Flip Chip Geographic Market Outlook, 2025-2035
- 14.1 Domestic Market Distribution and Demand Clusters
- 14.2 State- or Province-Wise Market Size and Forecast, 2025-2035
- 14.3 City and Metropolitan Market Outlook
- 14.4 Industrial, Manufacturing and Commercial Clusters
- 14.5 Geographic Concentration of Key End Users
- 14.6 Local Pricing and Purchasing Differences
- 14.7 Domestic Production Facilities and Capacity Map
- 14.8 Local Infrastructure and Project Pipeline
- 14.9 State-Level Policy and Incentive Differences
- 14.10 Subnational Investment Hotspots and Opportunities
- 14.11 Distribution and Logistics Networks
- 14.12 Domestic Competitive Footprint
Chapter 15 Australia Flip Chip Technology, Innovation and Sustainability Outlook
- 15.1 Technology Landscape and Maturity
- 15.2 Product, Process and Service Innovation
- 15.3 AI, Automation and Digital Tools in the Industry
- 15.4 Technology Adoption and Performance Benchmarking
- 15.5 Innovation Pipeline and R&D Investment
- 15.6 Patent and Intellectual Property Trends
- 15.7 Energy Efficiency and Resource Management
- 15.8 Sustainability, Recycling and Circularity
- 15.9 Technology Roadmap, 2025-2035
- 15.10 Risks of Obsolescence and Technology Substitution
Chapter 16 Australia Flip Chip Market Key Strategic Imperatives
- 16.1 Growth and Market Entry Priorities
- 16.2 High-Return Products and Segments
- 16.3 Pricing, Profitability and Cost Optimization
- 16.4 Technology Investment and Product Differentiation
- 16.5 Supply Chain Localization and Resilience
- 16.6 Distribution and Customer Acquisition
- 16.7 Partnership, Acquisition and Capacity Strategy
- 16.8 Regional Expansion Priorities
- 16.9 Short-, Medium- and Long-Term Actions
Chapter 17 Competition Outlook
- 17.1 Industry Competition Characteristics
- 17.2 Market Structure and Concentration
- 17.3 Market Share and Competitive Positioning, 2025
- 17.4 Company-Wise Revenue and Product Benchmarking
- 17.5 Production and Service Capacity Benchmarking
- 17.6 Technology, Pricing and Differentiation
- 17.7 Regional Footprint and Distribution Strength
- 17.8 Mergers, Acquisitions and Strategic Alliances
- 17.9 New Entrants and Competitive Threats
- 17.10 Porter's Five Forces and Industry Attractiveness
- 17.11 Competitive Outlook, 2025-2035
Chapter 18 Company Profiles
- 18.1 Company Coverage and Selection Criteria
- 18.2 Intel
- 18.2.1 Business Description
- 18.2.2 Company Ownership and Geographic Presence
- 18.2.3 Product and Service Portfolio
- 18.2.4 Manufacturing and Operating Footprint
- 18.2.5 Production Capacity and Expansion Plans
- 18.2.6 Financial Performance and Investment
- 18.2.7 Market Share and Competitive Position
- 18.2.8 Technology and Innovation Capabilities
- 18.2.9 Strategic Alliances or Partnerships
- 18.2.10 Recent Developments
- 18.2.11 Growth Strategy and Outlook
- 18.3 Advanced Micro Devices
- 18.4 NVIDIA
- 18.5 Qualcomm
- 18.6 Broadcom
- 18.7 Texas Instruments
- 18.8 NXP Semiconductors
- 18.9 STMicroelectronics
- 18.10 Infineon Technologies
- 18.11 Microchip Technology
- 18.12 Other Relevant Market Participants
Note: Every listed company is profiled on the structure shown under the first company. The company list is preliminary and may change based on research findings, market developments, data availability and client requirements.
Chapter 19 Disclaimer
- 19.1 Research and Forecast Disclaimer
- 19.2 Data Source and Estimation Limitations
Note: The depth of individual sections depends on data availability for this market. Volume, capacity, trade and other unit-based metrics are included where applicable.

