
Thailand consumer electronics rides wide connectivity
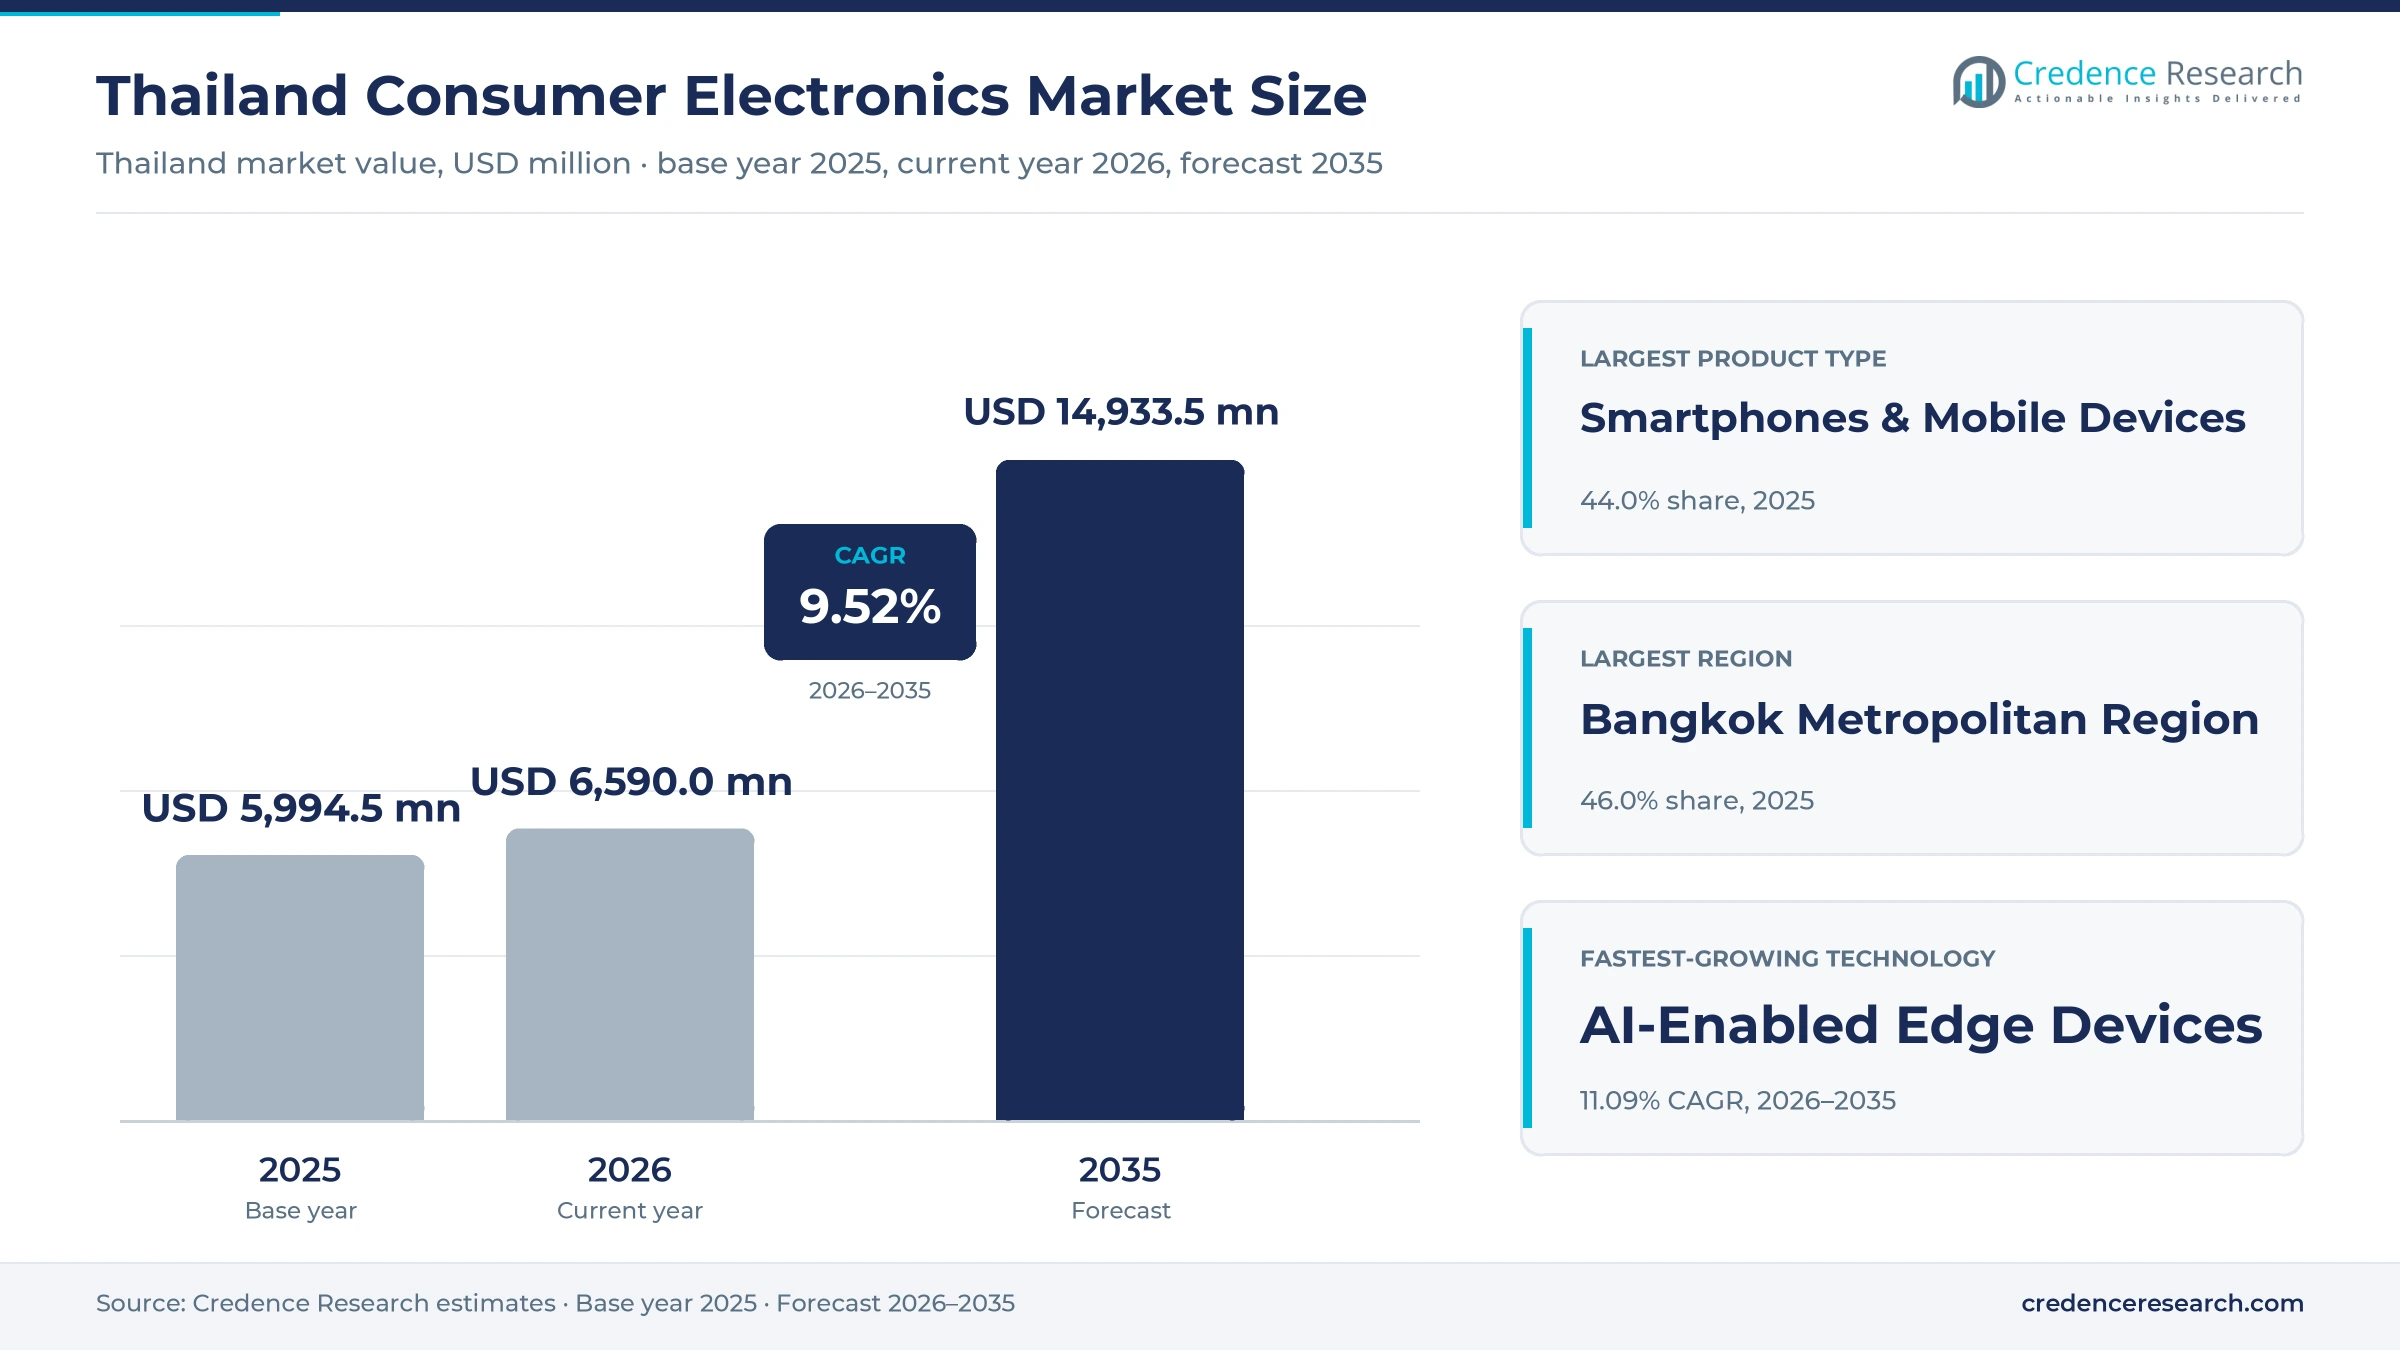
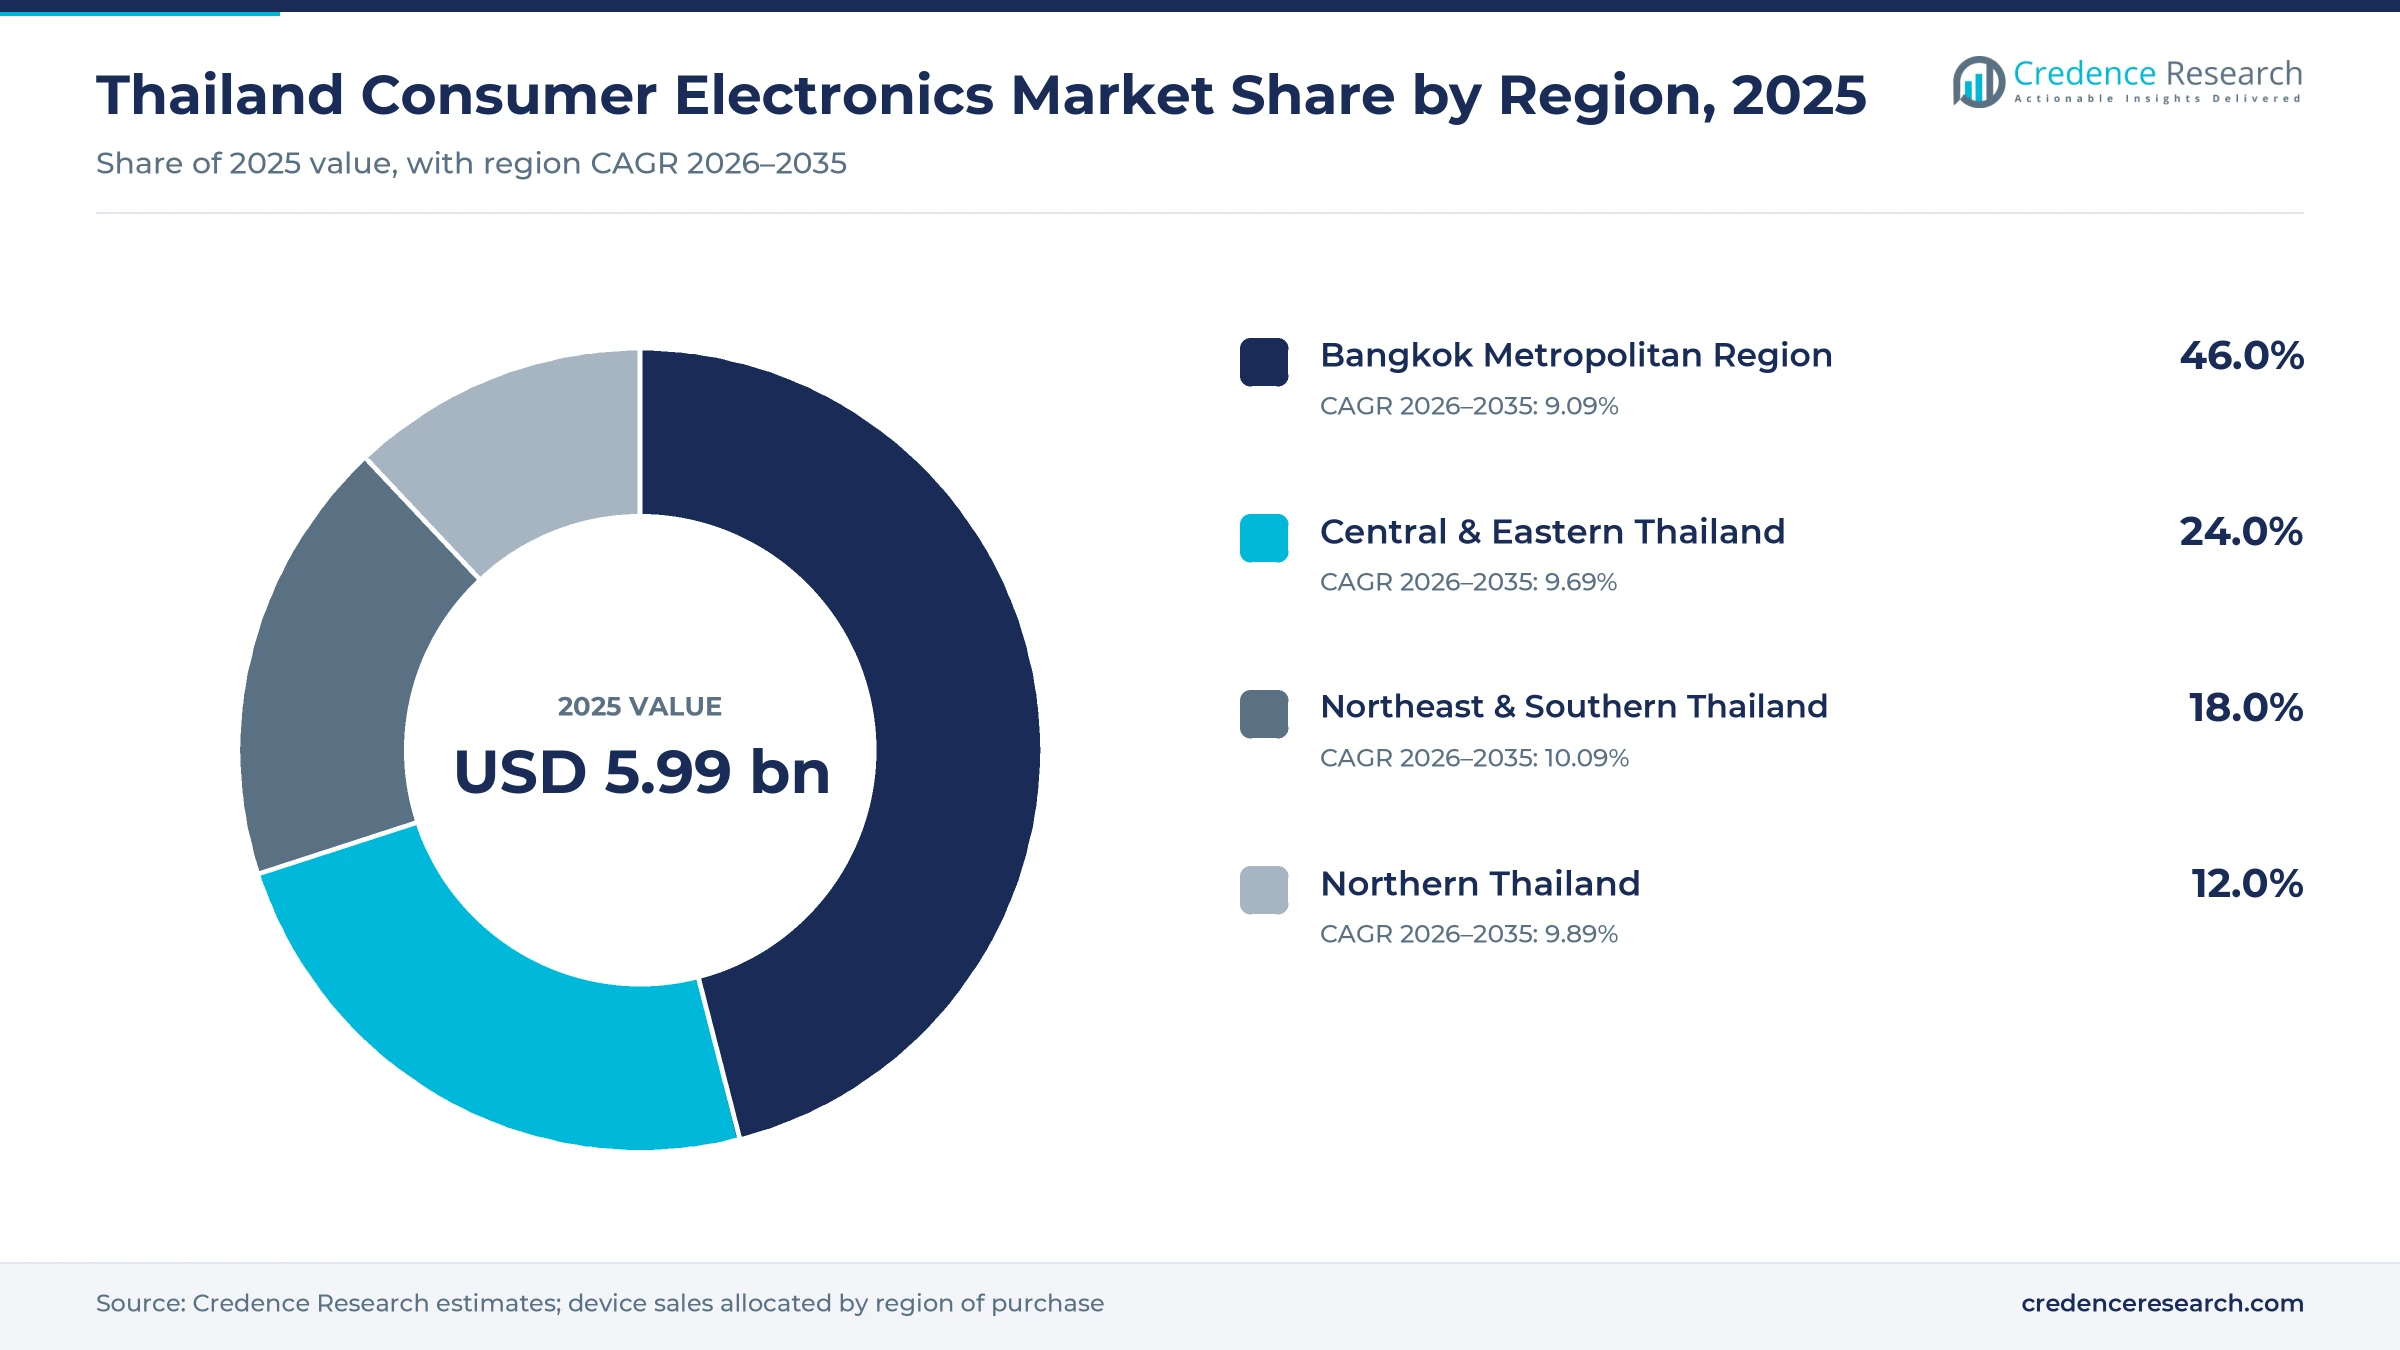
The Thailand consumer electronics market was valued at USD 5.99 billion in 2025 and is projected to increase from USD 6.59 billion in 2026 to USD 14.93 billion by 2035, registering a CAGR of 9.52% during 2026–2035. Demand comes from households that replace phones, laptops, televisions and wearables more often as networks, apps and online stores improve. The Bangkok Metropolitan Region held the largest regional share, 46.0% in 2025, because the capital combines the highest incomes with dense brand stores, malls and fast delivery. Northeast & Southern Thailand is the fastest-growing region at 10.09% a year, as marketplaces and telecom shops reach provincial buyers. Smartphones and mobile devices led the product mix in 2025, while AI-enabled devices are spreading across mid-range and premium tiers. A June 2025 spectrum auction added new mobile capacity, which supports wider 5G handset adoption across the country.
Which devices and sales channels does the estimate cover?
The estimate measures retail sales value of finished consumer devices sold in Thailand to individuals, households, students and small offices. It covers smartphones and tablets, laptops and desktop computers, televisions and home entertainment systems, and audio products and wearables. Values are stated at current prices and include sales through brand stores, electronics chains, department stores, online marketplaces and telecom operator shops.
The estimate excludes large home appliances such as refrigerators and washing machines, enterprise servers, components sold to factories and devices assembled in Thailand for export. The value chain runs from chip, display and component suppliers through regional assembly to brand owners, national distributors and the retailers and operators that sell, finance and service devices.
Thailand Consumer Electronics Market Insights
- The Thailand consumer electronics market was valued at USD 5.99 billion in 2025 and is projected to reach USD 14.93 billion by 2035, registering a CAGR of 9.52% during 2026–2035.
- The Bangkok Metropolitan Region held 46.0% of 2025 sales, because the capital pairs the highest incomes with dense brand stores and malls.
- Smartphones and mobile devices led with 44.0% of 2025 value, because handsets are the main connected device for most Thai buyers.
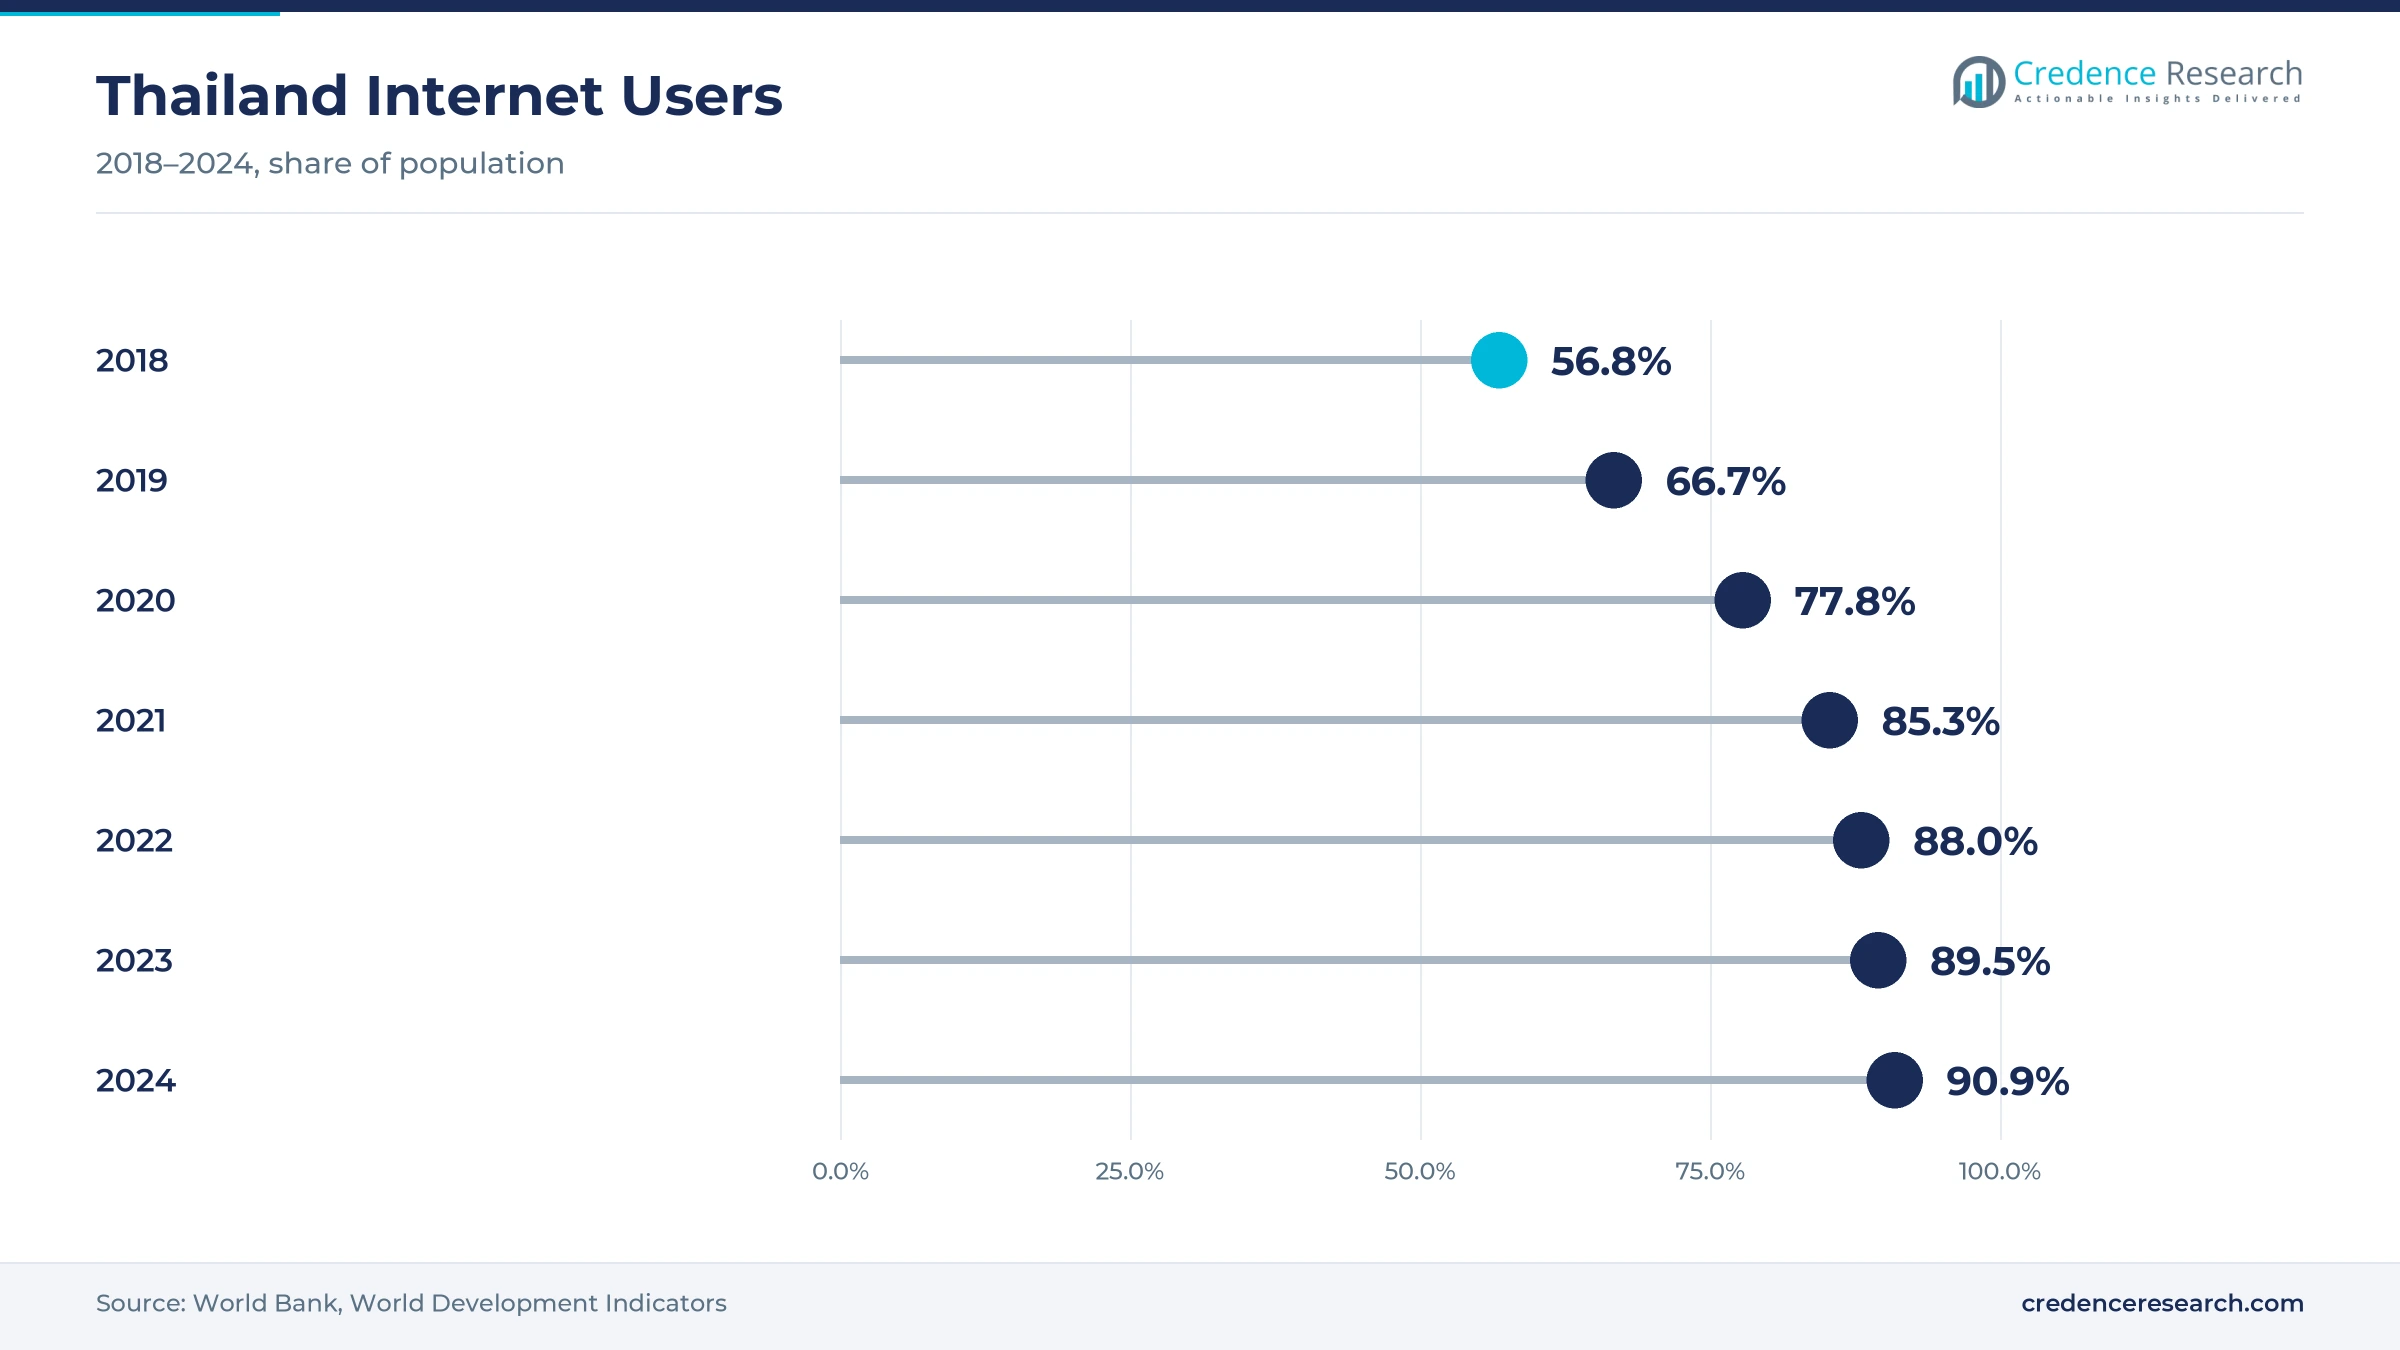
- Internet users reached 90.9% of Thailand's population in 2024, up from 39.3% in 2015, based on World Bank data, which widens the base for connected devices.
- The Board of Investment reported 880 semiconductor and advanced electronics projects from 2023 to mid-2026, which deepens the local supply base for device brands.
Smartphones lead while wearables and AI devices grow fastest
Why do smartphones lead product demand?
Based on product type, the market is categorized into smartphones and mobile devices, computing devices, TVs and home entertainment, and audio and wearables. Smartphones & Mobile Devices led with 44.0% of 2025 value, because handsets serve as the main screen for messaging, payments, shopping and video. Audio & Wearables grow fastest at 10.74% a year, as smartwatches, fitness bands and earbuds become low-cost add-ons to phones.
Which uses account for most device spending?
Based on application, the market is categorized into personal connectivity and communication, productivity and learning, entertainment and gaming, and smart home and lifestyle. Personal Connectivity & Communication led with 42.0% of 2025 value, because phones and tablets are bought first for chat, social media and mobile banking. Smart Home & Lifestyle grows fastest at 10.81% a year, as brands link televisions, speakers and appliances through one app.
How fast are AI-enabled devices gaining share?
Based on technology, the market is categorized into 5G and Wi-Fi 6/7 connected devices, AI-enabled edge devices, OLED, QLED and mini-LED displays, and IoT and smart home protocols. 5G & Wi-Fi 6/7 Connected Devices led with 38.0% of 2025 value, because most new phones, routers and laptops ship with the latest network standards. AI-Enabled Edge Devices grow fastest at 11.09% a year, as on-device AI features move from flagship phones into mid-range laptops and televisions.
Which sales channels are gaining share?
Based on distribution channel, the market is categorized into brand and specialist stores, electronics chains and department stores, e-commerce marketplaces and operator and telco channels. Electronics Chains & Department Stores led with 30.0% of 2025 value, because shoppers still compare screens and laptops in malls before buying. E-Commerce Marketplaces grow fastest at 10.71% a year, as live selling and fast delivery reach provincial towns.
| Segment Group | Leading Sub-segment | Share, 2025 | Fastest-growing Sub-segment | CAGR, 2026–2035 |
|---|---|---|---|---|
| By Product Type | Smartphones & Mobile Devices | 44.0% | Audio & Wearables | 10.74% |
| By Application | Personal Connectivity & Communication | 42.0% | Smart Home & Lifestyle | 10.81% |
| By Technology | 5G & Wi-Fi 6/7 Connected Devices | 38.0% | AI-Enabled Edge Devices | 11.09% |
| By Distribution Channel | Electronics Chains & Department Stores | 30.0% | E-Commerce Marketplaces | 10.71% |
Request a Free Sample
Fill in your details and we'll send you a free sample report.
- Sample data tables & charts
- Research methodology
Connectivity, online retail and investment lift device sales
How does near-universal connectivity lift device demand?
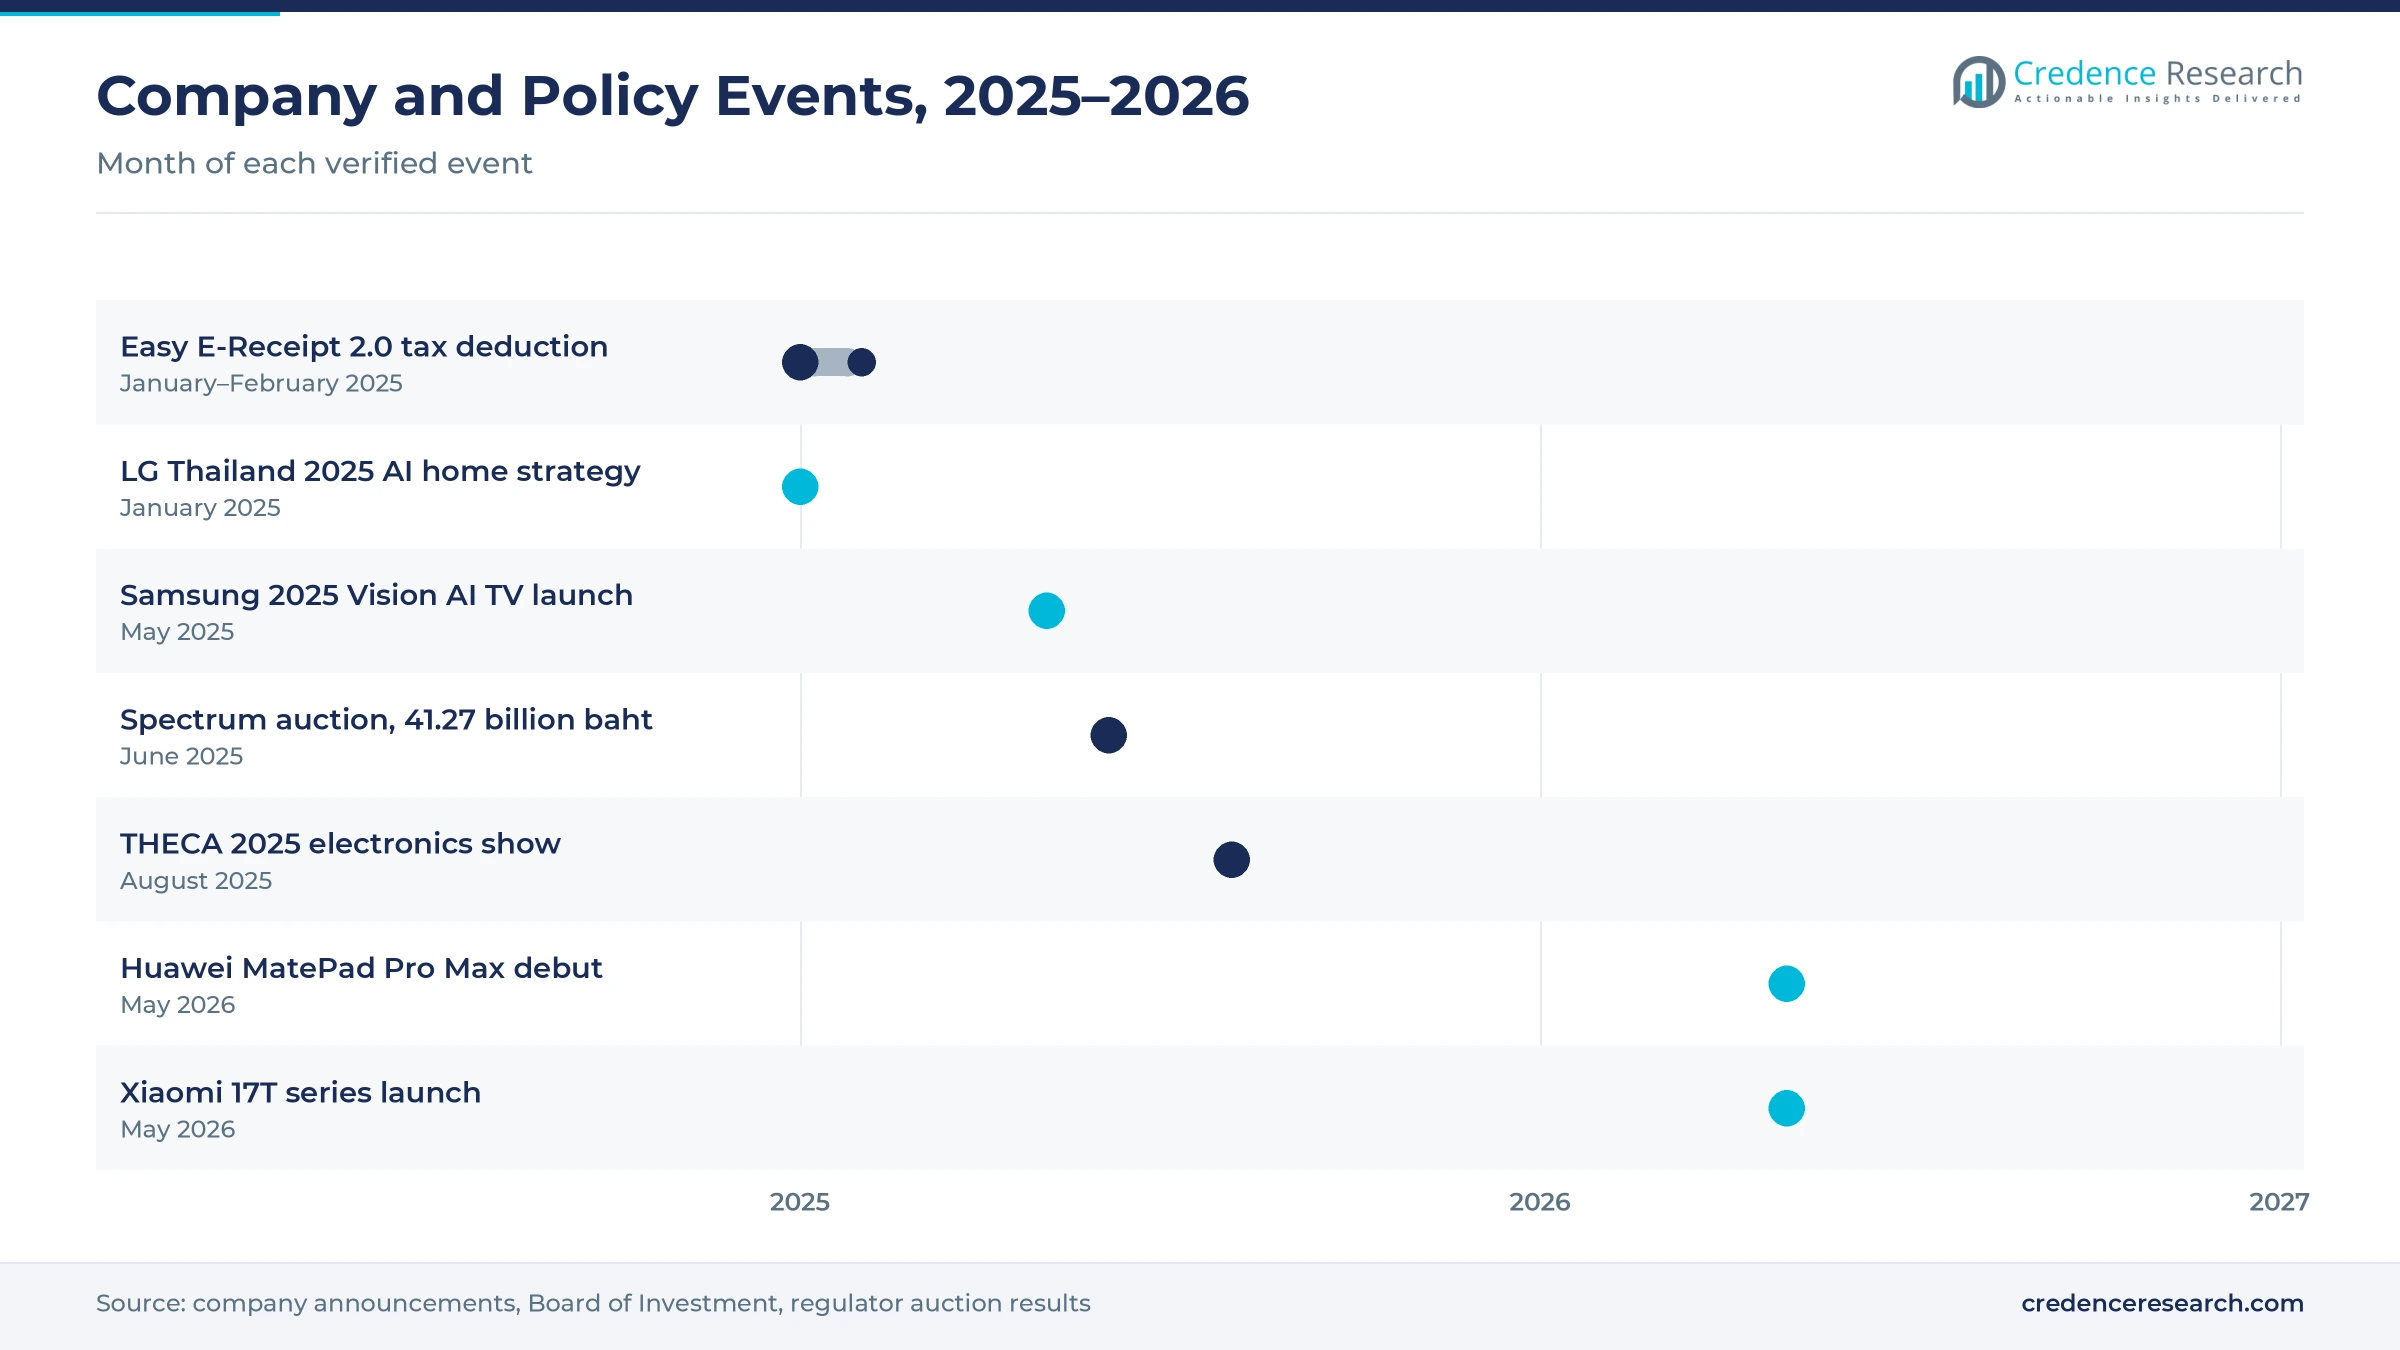
Near-universal connectivity is the base of device demand, because each network upgrade pushes households to replace phones, routers and screens. Internet users reached 90.9% of the population in 2024, up from 39.3% in 2015, according to World Bank data. Mobile subscriptions stood at 160.6 per 100 people in 2024, which shows that many users carry more than one connected device. In June 2025, the telecom regulator's spectrum auction raised about 41.27 billion baht, with Advanced Wireless Network winning 2100 MHz and True Move H winning 1500 MHz and 2300 MHz spectrum, as reported by The Nation. As a result, smartphones and mobile devices hold 44.0% of 2025 value, and 5G handsets keep replacing older 4G smartphones.
Why does mobile-first online retail widen the buyer base?
Mobile-first online retail widens the buyer base, because marketplaces deliver phones, laptops and wearables to provinces with few brand stores. Thai e-commerce reached about 1.1 trillion baht in 2024, up 14% from 980 billion baht in 2023, based on industry figures reported by Thailand Business News. Shopee had a 75% usage rate among online shoppers, followed by Lazada at 67% and TikTok at 51%, which shows how much buying runs through a few apps. In January 2025, LG Electronics Thailand also set a goal to raise its online retail mix from 7% to 15% through LG.com. In turn, e-commerce marketplaces grow at 10.71% a year, the fastest channel rate through 2035.
How does a deeper electronics investment base support supply?
A deeper electronics investment base supports supply, because local component and assembly capacity shortens lead times for brands that sell in Thailand. The Board of Investment said on Aug. 3, 2026, that Thailand had drawn 880 semiconductor and advanced electronics projects worth more than $26.8 billion in applications from 2023 to mid-2026, according to a BOI release. Printed circuit board projects alone accounted for $9.85 billion across 224 projects in that period. The agency also hosted the THECA 2025 trade show at BITEC Bangkok from Aug. 20 to 22, 2025, with more than 250 organizations from 15 countries. As a result, device brands gain closer access to boards, modules and service parts.
How do tax incentives and AI features speed upgrades?
Tax incentives and AI features speed upgrades, because buyers replace devices earlier when prices fall and new functions appear. The Easy E-Receipt 2.0 program let taxpayers deduct up to 50,000 baht for purchases made from Jan. 16 to Feb. 28, 2025, with e-tax invoices required, according to tax guidance on the program. Samsung showed its 2025 Vision AI televisions at Central World from May 16 to 18, 2025, with OLED models from 44,990 baht and QLED models from 13,990 baht, based on its Thai newsroom. Samsung followed with a Galaxy AI launch event on Sept. 4, 2025. Therefore, AI-enabled edge devices grow at 11.09% a year, the fastest technology rate in the forecast.
Wearables, AI homes and provincial buyers reshape demand
How is the rise of wearables changing the product mix?
The rise of wearables is changing the product mix, because brands now sell watches, bands and earbuds alongside every phone launch. Huawei held the global debut of its MatePad Pro Max tablet in Bangkok on May 7, 2026, together with the WATCH FIT 5 series. Huawei also said WATCH FIT shipments had passed 24 million units worldwide by April 2026. Xiaomi launched its 17T series at Conrad Bangkok on May 29, 2026, with the Watch S5 from 5,690 baht, the Smart Band 10 Pro from 2,490 baht and Buds 6 at 3,690 baht. As a result, audio and wearables become the fastest-growing product group in the forecast, as wearable technology moves into health tracking.
Why is the shift to AI-linked homes gaining pace?
The shift to AI-linked homes is gaining pace, because brands want televisions, phones and appliances to work through one app. LG Electronics Thailand set its 2025 strategy in January 2025 around ThinQ control and an AI home platform that integrates more than 170 IoT brands. Samsung's 2025 televisions act as SmartThings hubs, which let owners control other devices from the screen. Xiaomi also launched Mijia appliances with its May 2026 phones, including a GentleAir air conditioner from 14,298 baht. In turn, smart home and lifestyle uses grow at 10.81% a year, as buyers add smart home devices to existing phones and televisions.
Can provincial buyers open a new growth channel?
Provincial buyers offer a large opening, because connectivity now reaches most households outside Bangkok while store coverage remains thin. LG reported more than 900 authorized dealers nationwide across modern and traditional trade in January 2025, which shows how far brands already reach. Xiaomi sells its new phones through Xiaomi Stores and authorized dealers nationwide, with pre-orders open from May 30 to June 5, 2026. Mobile subscriptions of 160.6 per 100 people in 2024 also show that handsets reach every income group. As a result, Isan and the southern provinces become the fastest-growing zone in the forecast, as installment plans and delivery widen access.
Is there room for AI laptops and creator devices?
AI laptops and creator devices are an opening, because students, freelancers and small offices need more computing power for video, design and AI tools. The Board of Investment expects demand for AI server and data center infrastructure to rise by up to 22% a year, which builds local AI services that devices can use. The agency also projects semiconductors and advanced packaging to grow by 15% to 20% a year. Samsung's September 2025 launch paired a premium AI tablet with new Galaxy phones, which shows brands pushing AI beyond handsets. In turn, laptop and tablet demand concentrates in the Bangkok Metropolitan Region, where most creators, students and small offices work and buy.
Price pressure, debt and gray imports slow trading up
How does price pressure limit trading up?
Price pressure limits trading up, because many households compare headline prices online before buying phones and laptops. Component and memory costs can rise quickly, which forces brands to raise prices or cut specifications. As a result, mid-market buyers delay upgrades and keep devices longer. Brands respond with installment plans, trade-in offers and entry models that keep core features. Retailers also use bundled warranties and accessories to protect margins during heavy promotion periods such as payday and double-date sales.
Why does household debt slow big-ticket buying?
Household debt slows big-ticket buying, because lenders tighten approval for installment plans when repayment risk rises. Large televisions and premium laptops rely heavily on consumer credit, which makes them sensitive to lending conditions. In turn, buyers shift toward smaller screens and older models during weak periods. Brands and retailers respond with zero-interest campaigns funded by card issuers and with refurbished or previous-generation devices at lower price points for budget-conscious households.
How do gray imports affect brands?
Gray imports affect authorized brands, because parallel phones and accessories sell online below official prices without local warranty. Shoppers who compare prices on marketplaces often choose these cheaper listings, which lowers official channel sales. As a result, brands lose service revenue and face warranty disputes. Firms respond with official stores on marketplaces, serial-number checks and longer local warranties that make authorized products easier to identify and more attractive to buy.
Why do short product cycles strain retailers?
Short product cycles strain retailers, because brands launch new phones, watches and televisions several times a year. Stock bought for one season can lose value quickly when successors arrive, which pushes retailers into discounting. In turn, smaller dealers in provincial towns face tight cash flow and limited display space. Brands respond with consignment stock, price protection and faster replenishment, which help dealers carry new models without heavy write-downs.
Bangkok leads while the Northeast and south grow fastest
| Region | Value, 2025 (USD billion) | Share, 2025 | CAGR, 2026–2035 |
|---|---|---|---|
| Bangkok Metropolitan Region | 2.76 | 46.0% | 9.09% |
| Central & Eastern Thailand | 1.44 | 24.0% | 9.69% |
| Northeast & Southern Thailand | 1.08 | 18.0% | 10.09% |
| Northern Thailand | 0.72 | 12.0% | 9.89% |
Why does the Bangkok Metropolitan Region hold the largest share?
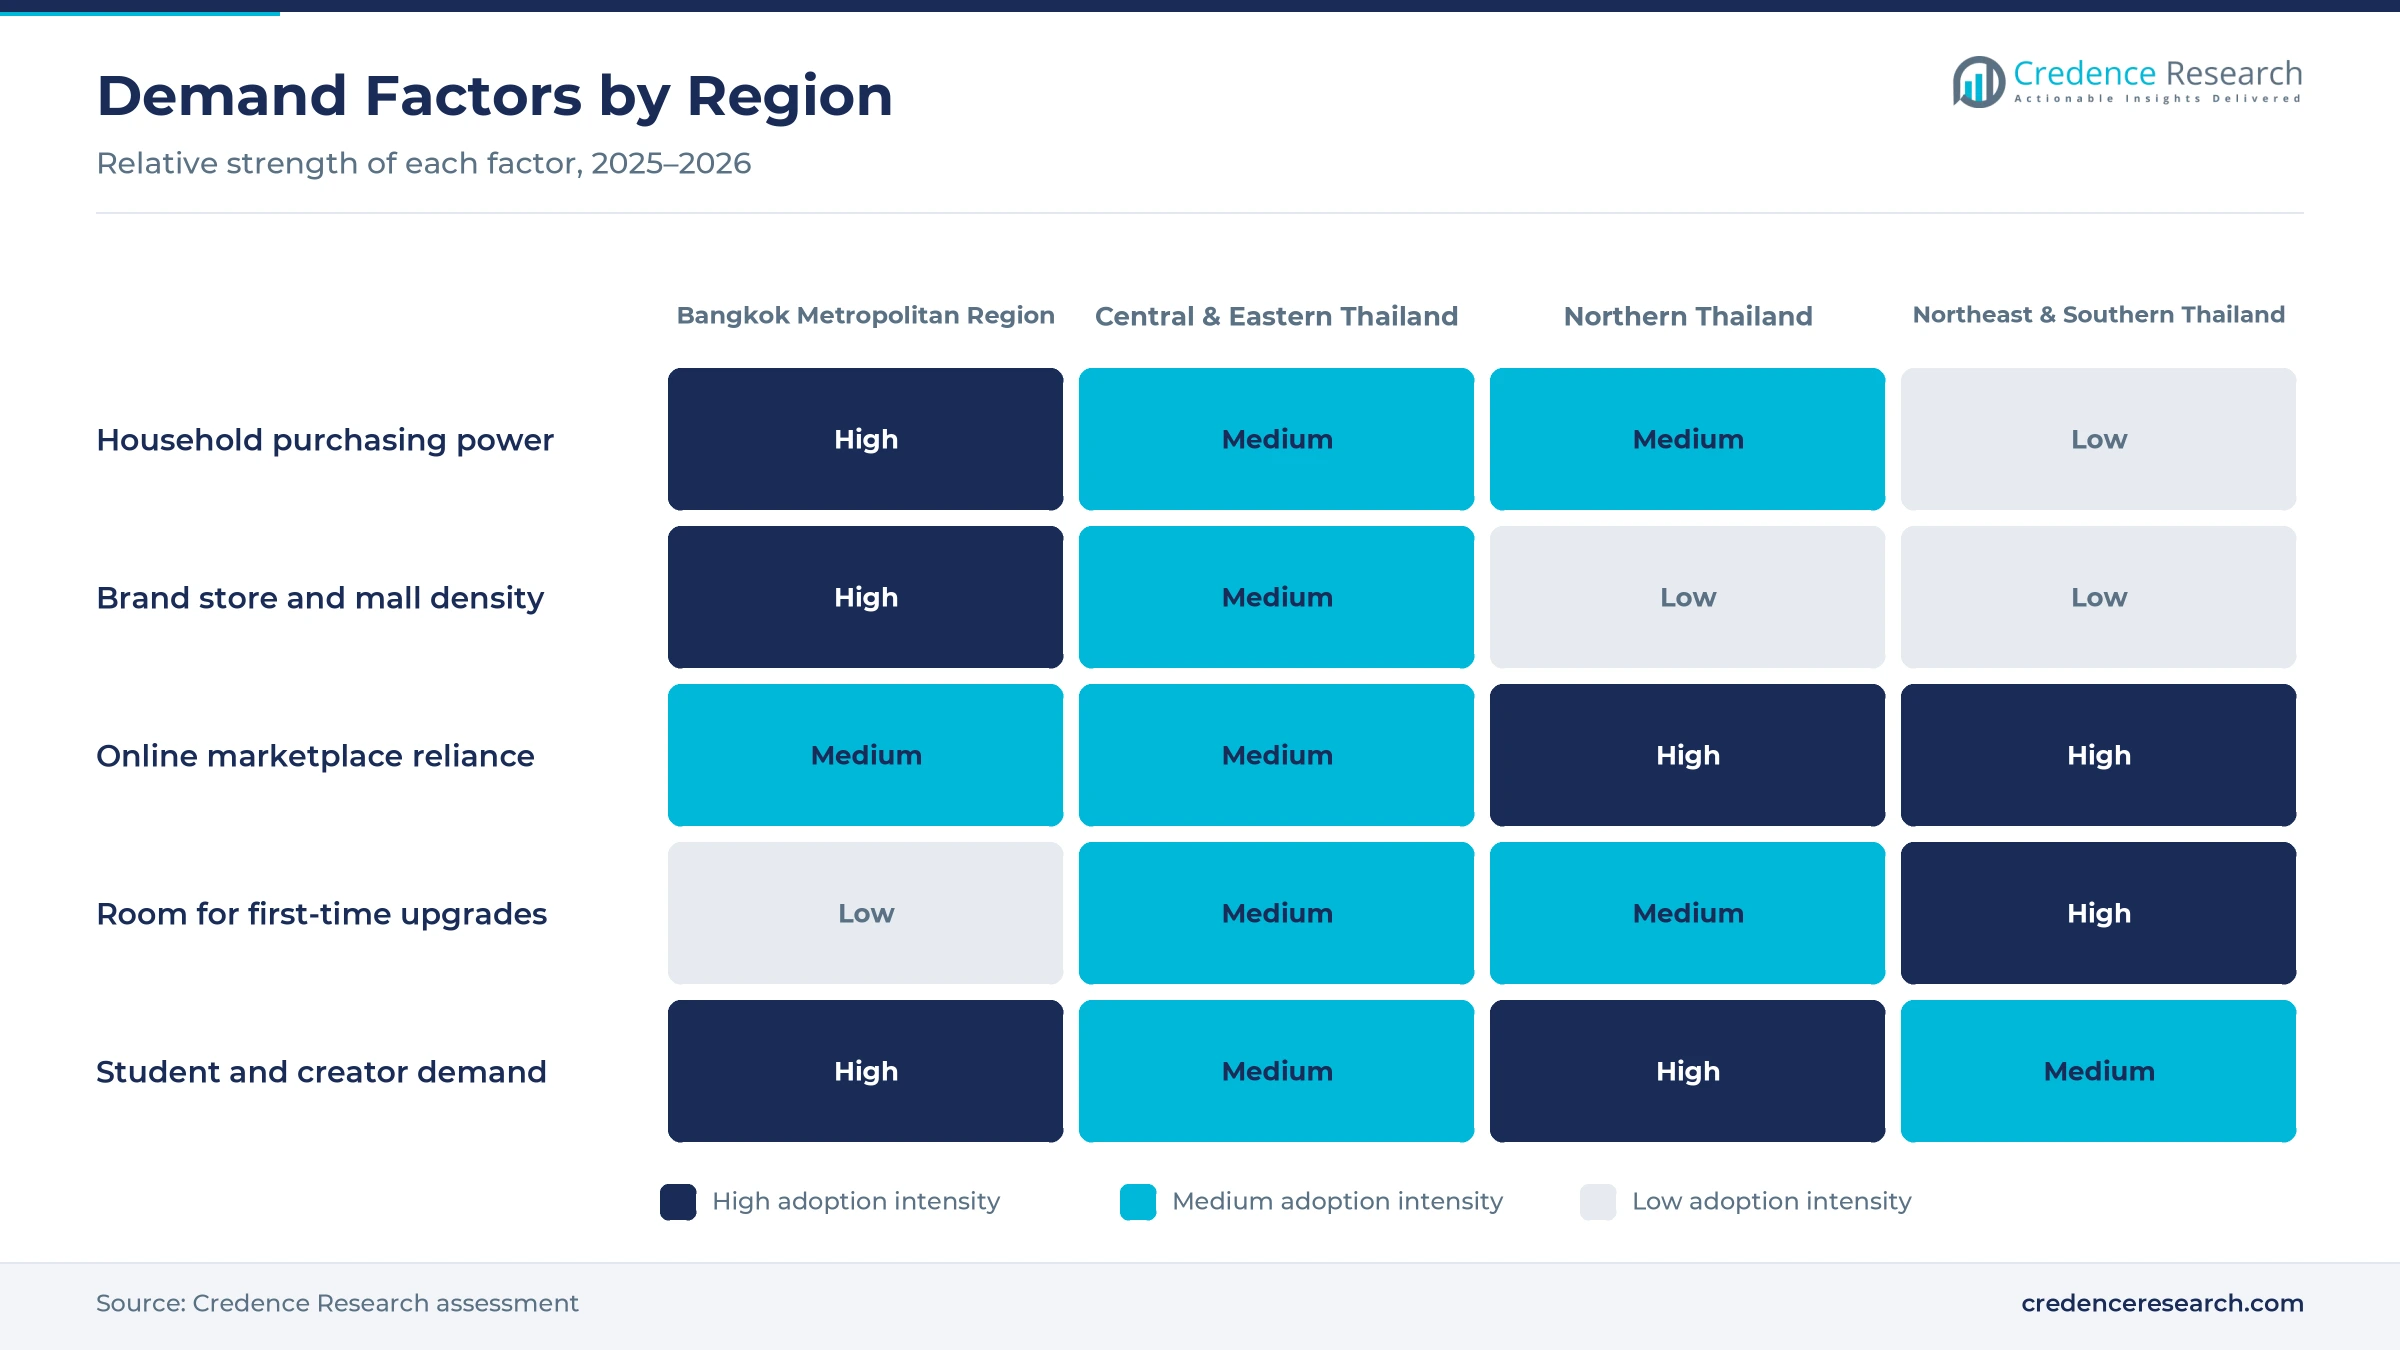
The Bangkok Metropolitan Region held 46.0% of 2025 value and grows at 9.09% a year, because the capital has the highest incomes, the densest malls and most brand flagship stores. Apple Central World, opened on July 31, 2020, in Ratchaprasong, is the company's largest store in Thailand. Samsung also staged its 2025 AI television launch at Central World. However, growth slows here as most buyers already own several devices, so replacement and premium upgrades drive sales.
How does Central & Eastern Thailand add volume?
Central & Eastern Thailand held 24.0% of 2025 value and grows at 9.69% a year, because industrial provinces such as Chonburi, Rayong and Ayutthaya employ large factory workforces with steady wages. New electronics and circuit board plants in the eastern corridor add jobs that support device buying. In turn, electronics chains and operator shops expand in provincial malls. Tourism in Pattaya also lifts demand for phones, cameras and audio products among residents and visitors.
What drives demand in Northern Thailand?
Northern Thailand held 12.0% of 2025 value and grows at 9.89% a year, because Chiang Mai serves as a hub for universities, tourism and remote workers. Students and freelancers buy laptops, tablets and headphones for study and creative work. However, rural districts have fewer stores, which makes online marketplaces important for delivery. Installment plans through telecom shops also help households in smaller towns move to 5G phones and connected televisions.
Why is Northeast & Southern Thailand growing fastest?
Northeast & Southern Thailand held 18.0% of 2025 value and grows fastest at 10.09% a year, because large populations in Isan and tourism cities in the south are still trading up from basic devices. Khon Kaen, Udon Thani, Hat Yai and Phuket anchor retail growth. As a result, marketplaces, dealers and telecom shops are adding coverage, and first-time buyers of laptops and wearables lift volume.
Spectrum, launches and investment marked 2025 and 2026
| Development | Status and market relevance |
|---|---|
| In January 2025, LG Electronics Thailand set its 2025 strategy around AI home control and wider online sales. | Targets higher online and business sales through LG.com and dealers |
| In May 2025, Samsung launched its 2025 Vision AI televisions and soundbars at Central World in Bangkok. | Brings AI picture and smart home control to more price tiers |
| In June 2025, the telecom regulator held a spectrum auction that raised about 41.27 billion baht. | Adds mobile capacity that supports wider 5G handset use |
| In May 2026, Huawei held the global debut of its MatePad Pro Max tablet and new wearables in Bangkok. | Positions Bangkok as a launch venue for tablets and smartwatches |
| In May 2026, Xiaomi launched its 17T phones, wearables and Mijia appliances in Bangkok. | Extends phone launches into watches, earbuds and home devices |
5G, AI chips and premium panels change the device mix
- 5G and Wi-Fi seven radios are moving into mid-range phones and routers, which lets households stream video and play games on more devices at once.
- On-device AI processors handle translation, photo editing and voice assistants without cloud delays, which gives buyers a clear reason to upgrade.
- OLED and mini-LED panels are spreading from flagship televisions into mid-priced models, which raises average selling prices for screens.
- Smart home platforms such as LG ThinQ and Samsung SmartThings link televisions, phones and appliances, which keeps buyers inside one brand.
Need a Custom Version of This Report?
Tailor the scope, geography, or segments to your exact requirements.
- Custom geography or segment scope
- Direct access to our analyst team
Korean, Chinese and U.S. brands compete on ecosystems
Competition is led by Korean, Chinese and U.S. brands that sell through malls, electronics chains, online marketplaces and telecom shops. Samsung competes across phones, tablets, televisions and soundbars, and it stages launches at Central World in Bangkok. Apple runs two company stores, including its largest at Central World, and sells through authorized resellers and operators. LG Electronics focuses on AI home control, OLED televisions and a network of more than 900 dealers. Xiaomi and Huawei pair phones with wearables, tablets and home devices, and both held launches in Bangkok in May 2026. Sony, ASUS, Panasonic, Dell and HP compete in audio, televisions and computers. Rivals compete on price, AI features, ecosystem links, installment offers and after-sales service, while marketplace campaigns decide much of the volume.
Companies profiled and their roles in this market
| Company | Type | Role in the market |
|---|---|---|
| Samsung Electronics (Thailand) | Device maker | Launched 2025 Vision AI televisions at Central World in May 2025 |
| Apple Thailand | Device maker | Runs Apple Central World, its largest store in Thailand, opened July 2020 |
| LG Electronics (Thailand) | Device maker | Set a 2025 AI home strategy with more than 900 authorized dealers |
| Huawei Thailand | Device maker | Held the global debut of MatePad Pro Max in Bangkok in May 2026 |
| Xiaomi Thailand | Device maker | Launched 17T phones, wearables and Mijia appliances in May 2026 |
Credence Research view on upgrades and channels
Credence Research's view is that Thai device spending will grow faster than overall retail because connectivity is nearly universal and AI features give buyers new reasons to upgrade. Online marketplaces now reach provincial towns, and local electronics investment strengthens supply. However, household debt, price pressure and gray imports will keep margins tight. Brands that combine AI features, ecosystem links, installment plans and service networks outside Bangkok should gain share fastest through 2035. Retailers that blend mall showrooms with live selling and fast provincial delivery should also outgrow rivals that rely on one channel.
How the Thai device spending estimate was built
The report uses 2025 as the base year on a calendar basis, and market values come from the Credence Research model. That model combines connectivity data from the World Bank, investment releases from the Board of Investment, company launch disclosures and typical retail prices by device type. Segment and regional splits are Credence Research estimates based on income, urban density and retail reach by zone. Sources used are government releases, company announcements, industry news and statistical databases, and no interviews or surveys were used.
AI upgrades and provincial reach carry growth to 2035
Device sales are expected to reach USD 14.93 billion by 2035, a 9.52% CAGR during 2026–2035, as 5G, AI features and online retail keep replacement cycles short. Growth should stay strong through 2028 while AI phones, laptops and televisions move into mid-range prices. After that, wearables, smart home devices and provincial buyers will carry growth as handset ownership saturates in Bangkok. Weaker household credit would lower this outlook, while faster AI adoption would raise it. Audio and wearables are expected to grow at 10.74% a year, the fastest product rate in Thailand consumer electronics demand.
Frequently Asked Questions
How big is the Thailand consumer electronics market?
Which product type leads device sales in Thailand?
Which region leads the Thailand consumer electronics market?
Which sales channel is growing fastest?
What drives device demand in Thailand?
How fast are AI-enabled devices growing?
Who are the leading device brands in Thailand?
What are the main challenges for device brands?
Table of Content
Chapter 1 Market Segmentation
- 1.1 Segmentation Framework
- 1.1.1 Product and Service Classification
- 1.1.2 Application and End-Use Classification
- 1.1.3 Technology and Solution Classification
- 1.1.4 Customer and Distribution Channel Classification
- 1.1.5 Geographic Segmentation
- 1.1.6 Market Segment Definitions and Boundaries
- 1.2 By Product Type
- 1.2.1 Smartphones & Mobile Devices
- 1.2.2 Computing Devices
- 1.2.3 TVs & Home Entertainment
- 1.2.4 Audio & Wearables
- 1.3 By Application
- 1.3.1 Personal Connectivity & Communication
- 1.3.2 Productivity & Learning
- 1.3.3 Entertainment & Gaming
- 1.3.4 Smart Home & Lifestyle
- 1.4 By Technology
- 1.4.1 5G & Wi-Fi 6/7 Connected Devices
- 1.4.2 AI-Enabled Edge Devices
- 1.4.3 OLED, QLED & Mini-LED Displays
- 1.4.4 IoT & Smart Home Protocols
Chapter 2 Introduction
- 2.1 Report Objectives and Scope
- 2.2 Product Definition and Industry Terminology
- 2.3 Market Inclusions and Exclusions
- 2.4 Research Process
- 2.4.1 Primary Research and Expert Interviews
- 2.4.2 Secondary Research and Source Review
- 2.4.3 Top-Down and Bottom-Up Estimation
- 2.4.4 Data Triangulation and Verification
- 2.5 Market Size Measurement Basis
- 2.5.1 2025: USD 5.99 billion → 2035: USD 14.93 billion
- 2.6 Historical and Forecast Reference Periods
- 2.6.1 Historical Period: 2018-2025
- 2.6.2 Base Year: 2025
- 2.6.3 Forecast Period: 2025-2035
- 2.7 Research Assumptions and Limitations
Chapter 3 Executive Summary
- 3.1 Market Snapshot and Key Findings
- 3.2 Base-Year Market Size, 2025
- 3.3 Forecast Market Size, 2035
- 3.4 Revenue and Volume Growth Outlook
- 3.5 Key Demand and Supply Indicators
- 3.6 Leading Market Segments
- 3.7 Fastest-Growing Market Opportunities
- 3.8 Regional Performance Highlights
- 3.9 Technology and Industry Transformation
- 3.10 Competitive Landscape Summary
- 3.11 Analyst View and Strategic Implications
Chapter 4 Thailand Consumer Electronics Market Trends and Developments
- 4.1 Historical Industry Development, 2018-2025
- 4.2 Recent Market Trends and Developments
- 4.3 Demand and Customer Behavior Trends
- 4.4 Technology and Product Innovation
- 4.5 Artificial Intelligence, Automation and Digitalization
- 4.6 Local Manufacturing and Supply Chain Realignment
- 4.7 Industry Partnerships, Mergers and Acquisitions
- 4.8 Sustainability and Circular Economy Developments
- 4.9 Government and Private Sector Investment Trends
- 4.10 Emerging Business Models and Commercialization
- 4.11 Industry Developments and Announcements
Chapter 5 Thailand Consumer Electronics Market Production, Supply and Demand Analysis
- 5.1 Demand Trend and Consumption Analysis, 2018-2025
- 5.2 Demand Forecast, 2025-2035
- 5.3 Production and Output Trend, 2018-2025
- 5.4 Production and Output Forecast, 2025-2035
- 5.5 Installed Capacity and Capacity Utilization
- 5.6 Company-Wise Production Plants and Statistics
- 5.6.1 Installed Production Capacity
- 5.6.2 Actual Production
- 5.6.3 Planned Capacity and Expansion Targets
- 5.7 Supply Chain Structure and Procurement Trends
- 5.8 Supply-Demand Gap and Bottlenecks
- 5.9 Import Dependence and Sourcing Structure
- 5.10 Contract Manufacturing and Outsourcing
- 5.11 Regional Supply and Demand Concentration
Chapter 6 Thailand Consumer Electronics Market Pricing Analysis
- 6.1 Pricing Structure and Measurement
- 6.2 Historical Pricing Trends, 2018-2025
- 6.3 Pricing Outlook, 2025-2035
- 6.4 Average Selling Price and Unit Economics
- 6.5 Pricing by Product and Market Segment
- 6.6 Geographic Pricing Differences
- 6.7 Key Input, Energy, Labor and Logistics Costs
- 6.8 Contract Pricing and Purchasing Models
- 6.9 Pricing Sensitivity and Competitive Positioning
- 6.10 Price, Margin and Profitability Implications
Chapter 7 Thailand Consumer Electronics Market Dynamics
- 7.1 Market Growth Drivers
- 7.1.1 Demand-Side Drivers
- 7.1.2 Technology and Innovation Drivers
- 7.1.3 Infrastructure and Investment Drivers
- 7.1.4 Regulatory and Policy Drivers
- 7.2 Market Restraints
- 7.2.1 Cost and Affordability Constraints
- 7.2.2 Technology and Adoption Barriers
- 7.2.3 Supply Chain and Operational Constraints
- 7.3 Market Challenges
- 7.3.1 Competitive Pressure and Margin Erosion
- 7.3.2 Skills, Infrastructure and Implementation Gaps
- 7.4 Emerging Market Opportunities
- 7.5 Market Dynamics Impact and Time-Horizon Assessment
Chapter 8 Thailand Consumer Electronics Value Chain Analysis
- 8.1 Industry Value Chain Overview
- 8.2 Upstream Suppliers and Critical Inputs
- 8.3 Technology and Component Providers
- 8.4 Manufacturing or Service Delivery
- 8.5 Distribution, Channel Partners and Integrators
- 8.6 Downstream Applications and End Users
- 8.7 Value Addition and Profit Pools
- 8.8 Vertical Integration and Outsourcing
- 8.9 Supplier Concentration and Risk
- 8.10 Supply Chain Localization and Resilience
Chapter 9 Thailand Consumer Electronics Market Regulations and Policies
- 9.1 Relevant Laws, Standards and Compliance Frameworks
- 9.2 Product, Service, Safety and Quality Requirements
- 9.3 Government Policies, Incentives and Subsidies
- 9.4 Imports, Exports and Trade Barriers
- 9.5 Public Procurement and Local Content Requirements
- 9.6 Environmental and Sustainability Compliance
- 9.7 Upcoming Policy Changes and Market Implications
Chapter 10 Thailand Consumer Electronics Market Hotspots and Opportunities
- 10.1 Market Opportunity Mapping and Growth Hotspots
- 10.2 High-Growth Applications and Customer Groups
- 10.3 Underserved Markets and White-Space Opportunities
- 10.4 Emerging Technology and Product Opportunities
- 10.5 New Capacity and Investment Hotspots
- 10.6 Market Entry and Expansion Opportunities
- 10.7 Distribution and Partnership Opportunities
- 10.8 Near-Term and Long-Term Commercial Potential
- 10.9 Opportunity Attractiveness and Execution Risks
Chapter 11 Thailand Consumer Electronics Market Outlook, 2025-2035
- 11.1 Market Size and Analysis
- 11.1.1 Revenue (Market Measurement: 2025: USD 5.99 billion → 2035: USD 14.93 billion)
- 11.1.2 Market Volume and Quantity Sold
- 11.1.3 Historical Market Size, 2018-2025
- 11.1.4 Base-Year Market Size, 2025
- 11.2 Market Forecast, 2025-2035
- 11.2.1 Revenue Forecast to 2035
- 11.2.2 Volume Forecast to 2035
- 11.2.3 CAGR and Year-on-Year Growth
- 11.2.4 Incremental Revenue Opportunity
- 11.3 Forecast Assumptions and Scenario Analysis
- 11.3.1 Base-Case Forecast
- 11.3.2 Optimistic and Conservative Scenarios
- 11.3.3 Technology, Pricing and Policy Sensitivities
- 11.4 Market Attractiveness and Growth Outlook
Chapter 12 Thailand Consumer Electronics Market Segmentation and Outlook
- 12.1 Segmentation Summary and Market Shares, 2025
- 12.2 Largest and Fastest-Growing Segments
- 12.3 By Product Type - Market Size and Forecast, 2025-2035
- 12.3.1 Segment Definition and Scope
- 12.3.2 Historical Market Size, 2018-2025
- 12.3.3 Revenue Forecast, 2025-2035
- 12.3.4 Volume Forecast, 2025-2035
- 12.3.5 Base-Year Market Share, 2025
- 12.3.6 Segment CAGR and Growth Drivers
- 12.3.7 Subsegment Market Size and Forecast
- 12.3.7.1 Smartphones & Mobile Devices
- 12.3.7.2 Computing Devices
- 12.3.7.3 TVs & Home Entertainment
- 12.3.7.4 Audio & Wearables
- 12.3.8 Subsegment Pricing and Adoption Trends
- 12.3.9 Leading Suppliers and Competition
- 12.3.10 Regional Demand and Opportunities
- 12.4 By Application - Market Size and Forecast, 2025-2035
- 12.4.1 Segment Definition and Scope
- 12.4.2 Historical Market Size, 2018-2025
- 12.4.3 Revenue Forecast, 2025-2035
- 12.4.4 Volume Forecast, 2025-2035
- 12.4.5 Base-Year Market Share, 2025
- 12.4.6 Segment CAGR and Growth Drivers
- 12.4.7 Subsegment Market Size and Forecast
- 12.4.7.1 Personal Connectivity & Communication
- 12.4.7.2 Productivity & Learning
- 12.4.7.3 Entertainment & Gaming
- 12.4.7.4 Smart Home & Lifestyle
- 12.4.8 Subsegment Pricing and Adoption Trends
- 12.4.9 Leading Suppliers and Competition
- 12.4.10 Regional Demand and Opportunities
- 12.5 By Technology - Market Size and Forecast, 2025-2035
- 12.5.1 Segment Definition and Scope
- 12.5.2 Historical Market Size, 2018-2025
- 12.5.3 Revenue Forecast, 2025-2035
- 12.5.4 Volume Forecast, 2025-2035
- 12.5.5 Base-Year Market Share, 2025
- 12.5.6 Segment CAGR and Growth Drivers
- 12.5.7 Subsegment Market Size and Forecast
- 12.5.7.1 5G & Wi-Fi 6/7 Connected Devices
- 12.5.7.2 AI-Enabled Edge Devices
- 12.5.7.3 OLED, QLED & Mini-LED Displays
- 12.5.7.4 IoT & Smart Home Protocols
- 12.5.8 Subsegment Pricing and Adoption Trends
- 12.5.9 Leading Suppliers and Competition
- 12.5.10 Regional Demand and Opportunities
- 12.6 Segment Growth Comparison
- 12.7 Segment Attractiveness and Priority Matrix
Chapter 13 Thailand Consumer Electronics End-Use and Application Market Outlook
- 13.1 End-Use Industry and Customer Demand Structure
- 13.2 Leading Applications and Customer Groups
- 13.3 End-Use Market Size, Share and Forecast
- 13.4 Major End-Use Industry Deep Dives
- 13.4.1 Customer Requirements and Use Cases
- 13.4.2 Demand and Replacement Cycles
- 13.4.3 Technical and Regulatory Considerations
- 13.4.4 Purchasing and Procurement Models
- 13.4.5 Leading Vendors and Distribution Channels
- 13.4.6 Forecast and Commercial Opportunities
- 13.5 Emerging Applications and Cross-Segment Demand
- 13.6 End-Use Industry Investment Priorities
Chapter 14 Thailand Consumer Electronics Geographic Market Outlook, 2025-2035
- 14.1 Regional Market Size and Country-Level Shares, 2025
- 14.2 Country Market Size Comparison, 2025
- 14.3 Country Market Forecasts, 2025-2035
- 14.4 Subregional Industrial and Demand Clusters
- 14.5 Intra-Regional Pricing and Cost Differences
- 14.6 Cross-Border Trade and Supply Networks
- 14.7 Regional Supply and Demand Balances
- 14.8 Country Opportunity Comparison and Prioritization
Note: Every listed country is covered on the structure shown under the first country.
Chapter 15 Thailand Consumer Electronics Technology, Innovation and Sustainability Outlook
- 15.1 Technology Landscape and Maturity
- 15.2 Product, Process and Service Innovation
- 15.3 AI, Automation and Digital Tools in the Industry
- 15.4 Technology Adoption and Performance Benchmarking
- 15.5 Innovation Pipeline and R&D Investment
- 15.6 Patent and Intellectual Property Trends
- 15.7 Energy Efficiency and Resource Management
- 15.8 Sustainability, Recycling and Circularity
- 15.9 Technology Roadmap, 2025-2035
- 15.10 Risks of Obsolescence and Technology Substitution
Chapter 16 Thailand Consumer Electronics Market Key Strategic Imperatives
- 16.1 Growth and Market Entry Priorities
- 16.2 High-Return Products and Segments
- 16.3 Pricing, Profitability and Cost Optimization
- 16.4 Technology Investment and Product Differentiation
- 16.5 Supply Chain Localization and Resilience
- 16.6 Distribution and Customer Acquisition
- 16.7 Partnership, Acquisition and Capacity Strategy
- 16.8 Regional Expansion Priorities
- 16.9 Short-, Medium- and Long-Term Actions
Chapter 17 Competition Outlook
- 17.1 Industry Competition Characteristics
- 17.2 Market Structure and Concentration
- 17.3 Market Share and Competitive Positioning, 2025
- 17.4 Company-Wise Revenue and Product Benchmarking
- 17.5 Production and Service Capacity Benchmarking
- 17.6 Technology, Pricing and Differentiation
- 17.7 Regional Footprint and Distribution Strength
- 17.8 Mergers, Acquisitions and Strategic Alliances
- 17.9 New Entrants and Competitive Threats
- 17.10 Porter's Five Forces and Industry Attractiveness
- 17.11 Competitive Outlook, 2025-2035
Chapter 18 Company Profiles
- 18.1 Company Coverage and Selection Criteria
- 18.2 Samsung Electronics (Thailand)
- 18.2.1 Business Description
- 18.2.2 Company Ownership and Geographic Presence
- 18.2.3 Product and Service Portfolio
- 18.2.4 Manufacturing and Operating Footprint
- 18.2.5 Production Capacity and Expansion Plans
- 18.2.6 Financial Performance and Investment
- 18.2.7 Market Share and Competitive Position
- 18.2.8 Technology and Innovation Capabilities
- 18.2.9 Strategic Alliances or Partnerships
- 18.2.10 Recent Developments
- 18.2.11 Growth Strategy and Outlook
- 18.3 Apple Thailand
- 18.4 LG Electronics (Thailand)
- 18.5 Sony (Thailand)
- 18.6 Xiaomi Thailand
- 18.7 Huawei Thailand
- 18.8 ASUS Thailand
- 18.9 Panasonic Thailand
- 18.10 Dell Technologies Thailand
- 18.11 HP Thailand
- 18.12 Other Relevant Market Participants
Note: Every listed company is profiled on the structure shown under the first company. The company list is preliminary and may change based on research findings, market developments, data availability and client requirements.
Chapter 19 Disclaimer
- 19.1 Research and Forecast Disclaimer
- 19.2 Data Source and Estimation Limitations
Note: The depth of individual sections depends on data availability for this market. Volume, capacity, trade and other unit-based metrics are included where applicable.

