
Gamers, studios and AI users drive Australian GPU demand
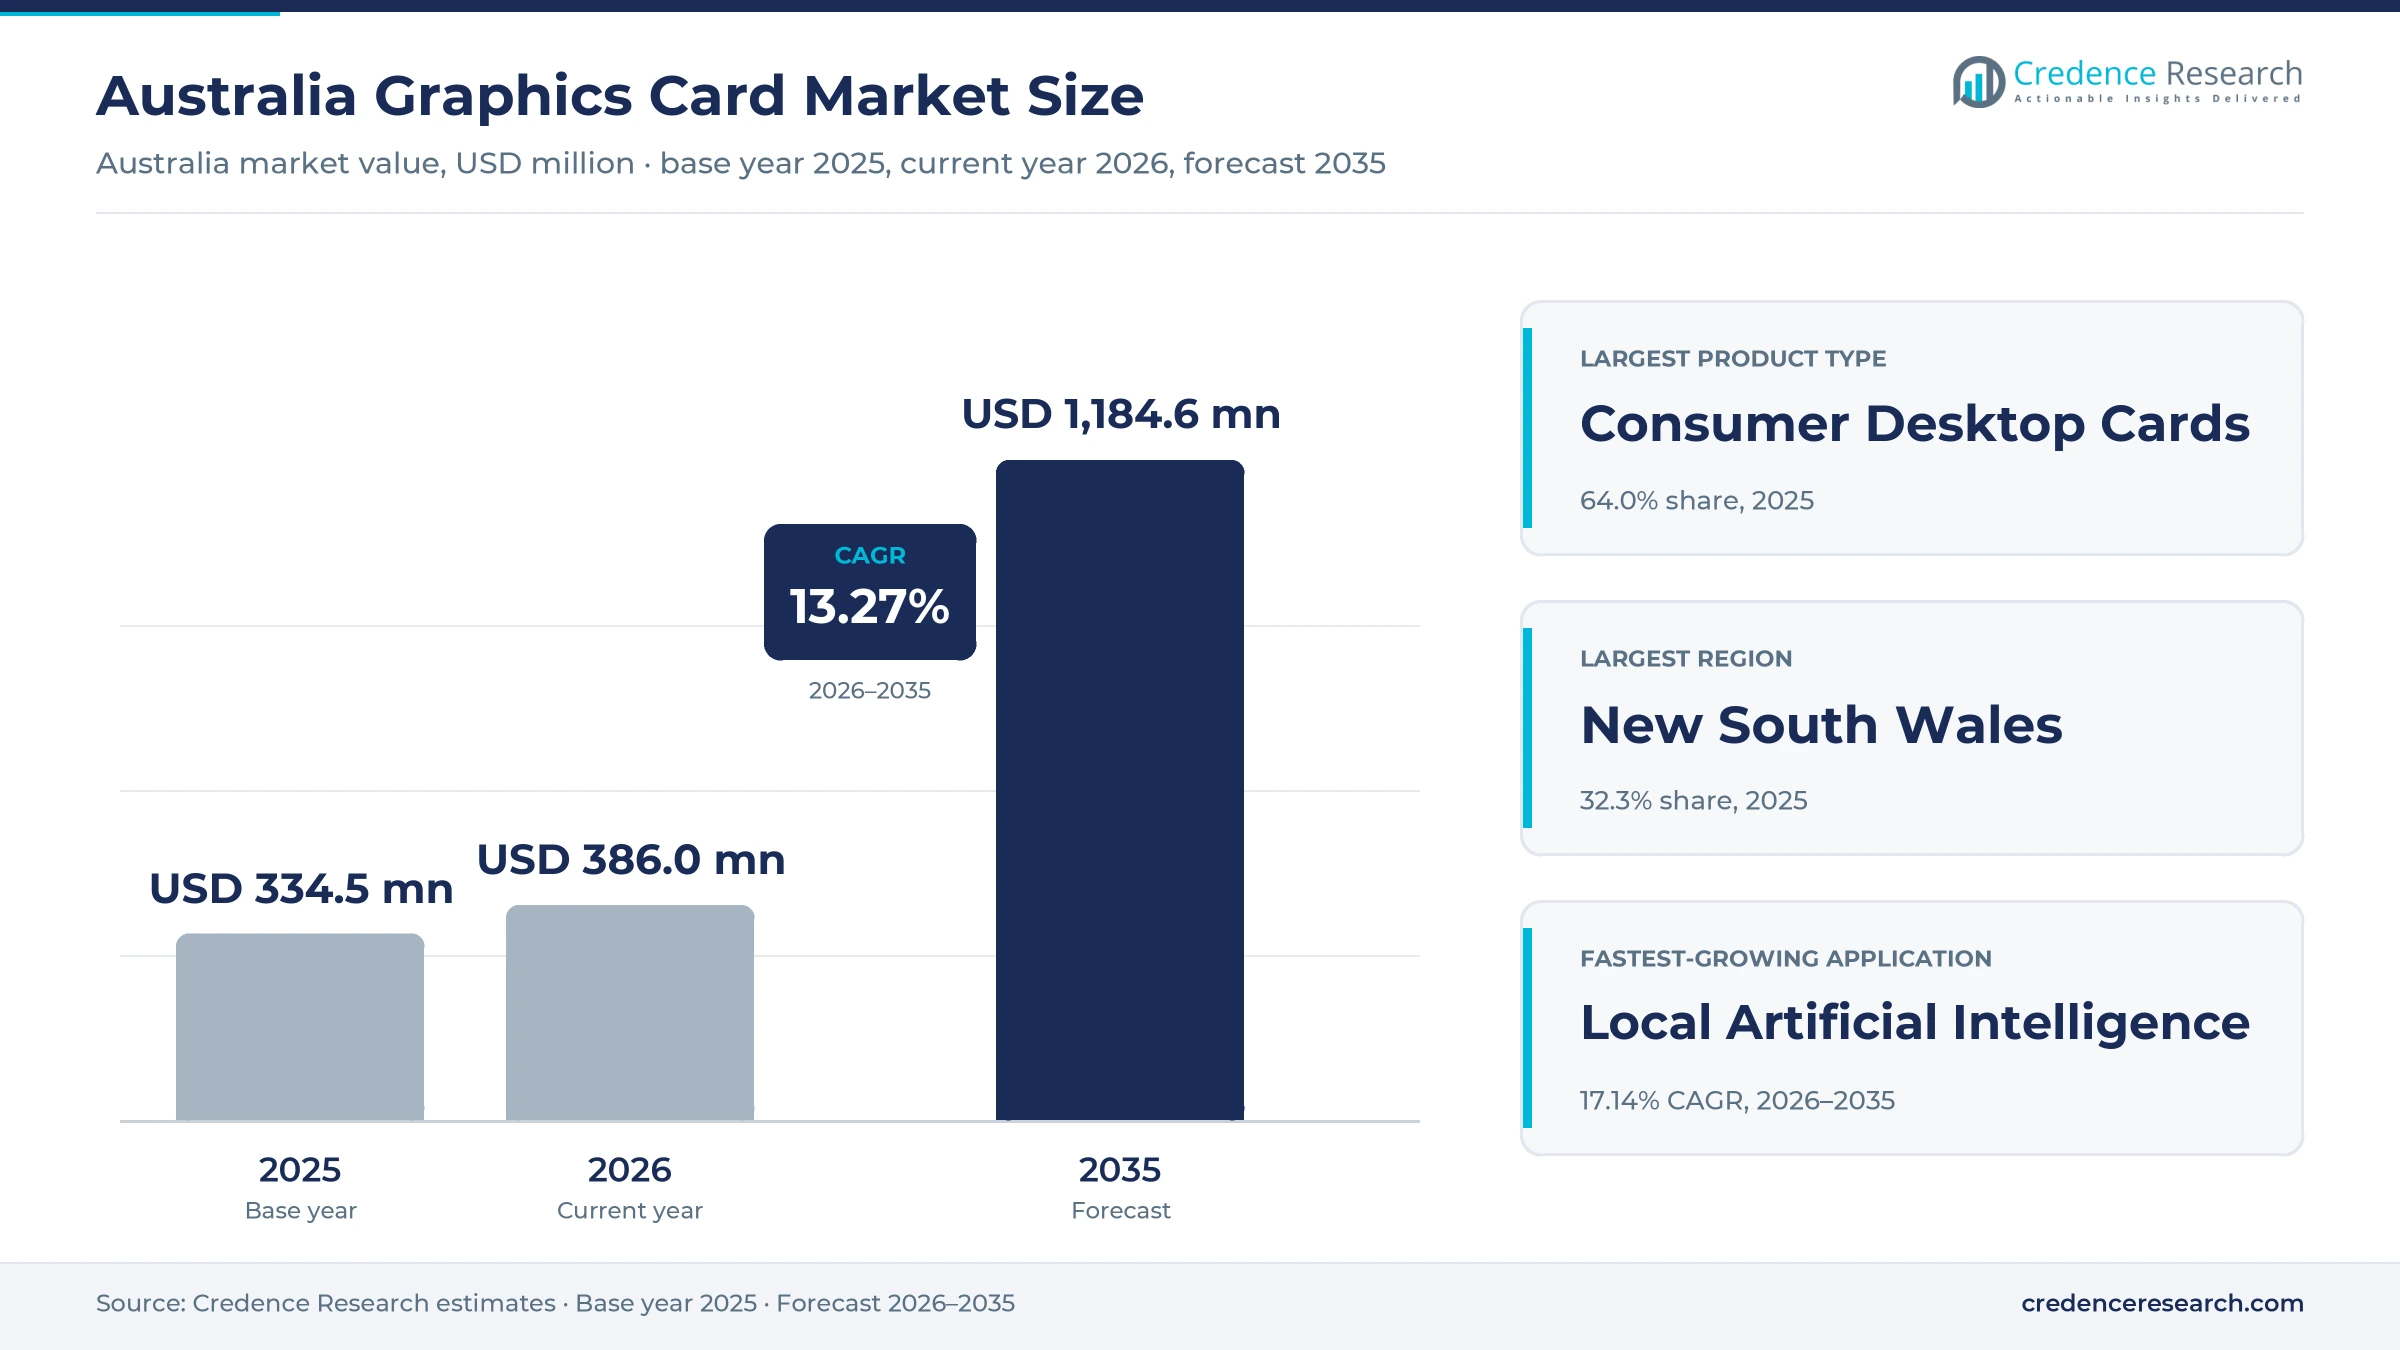
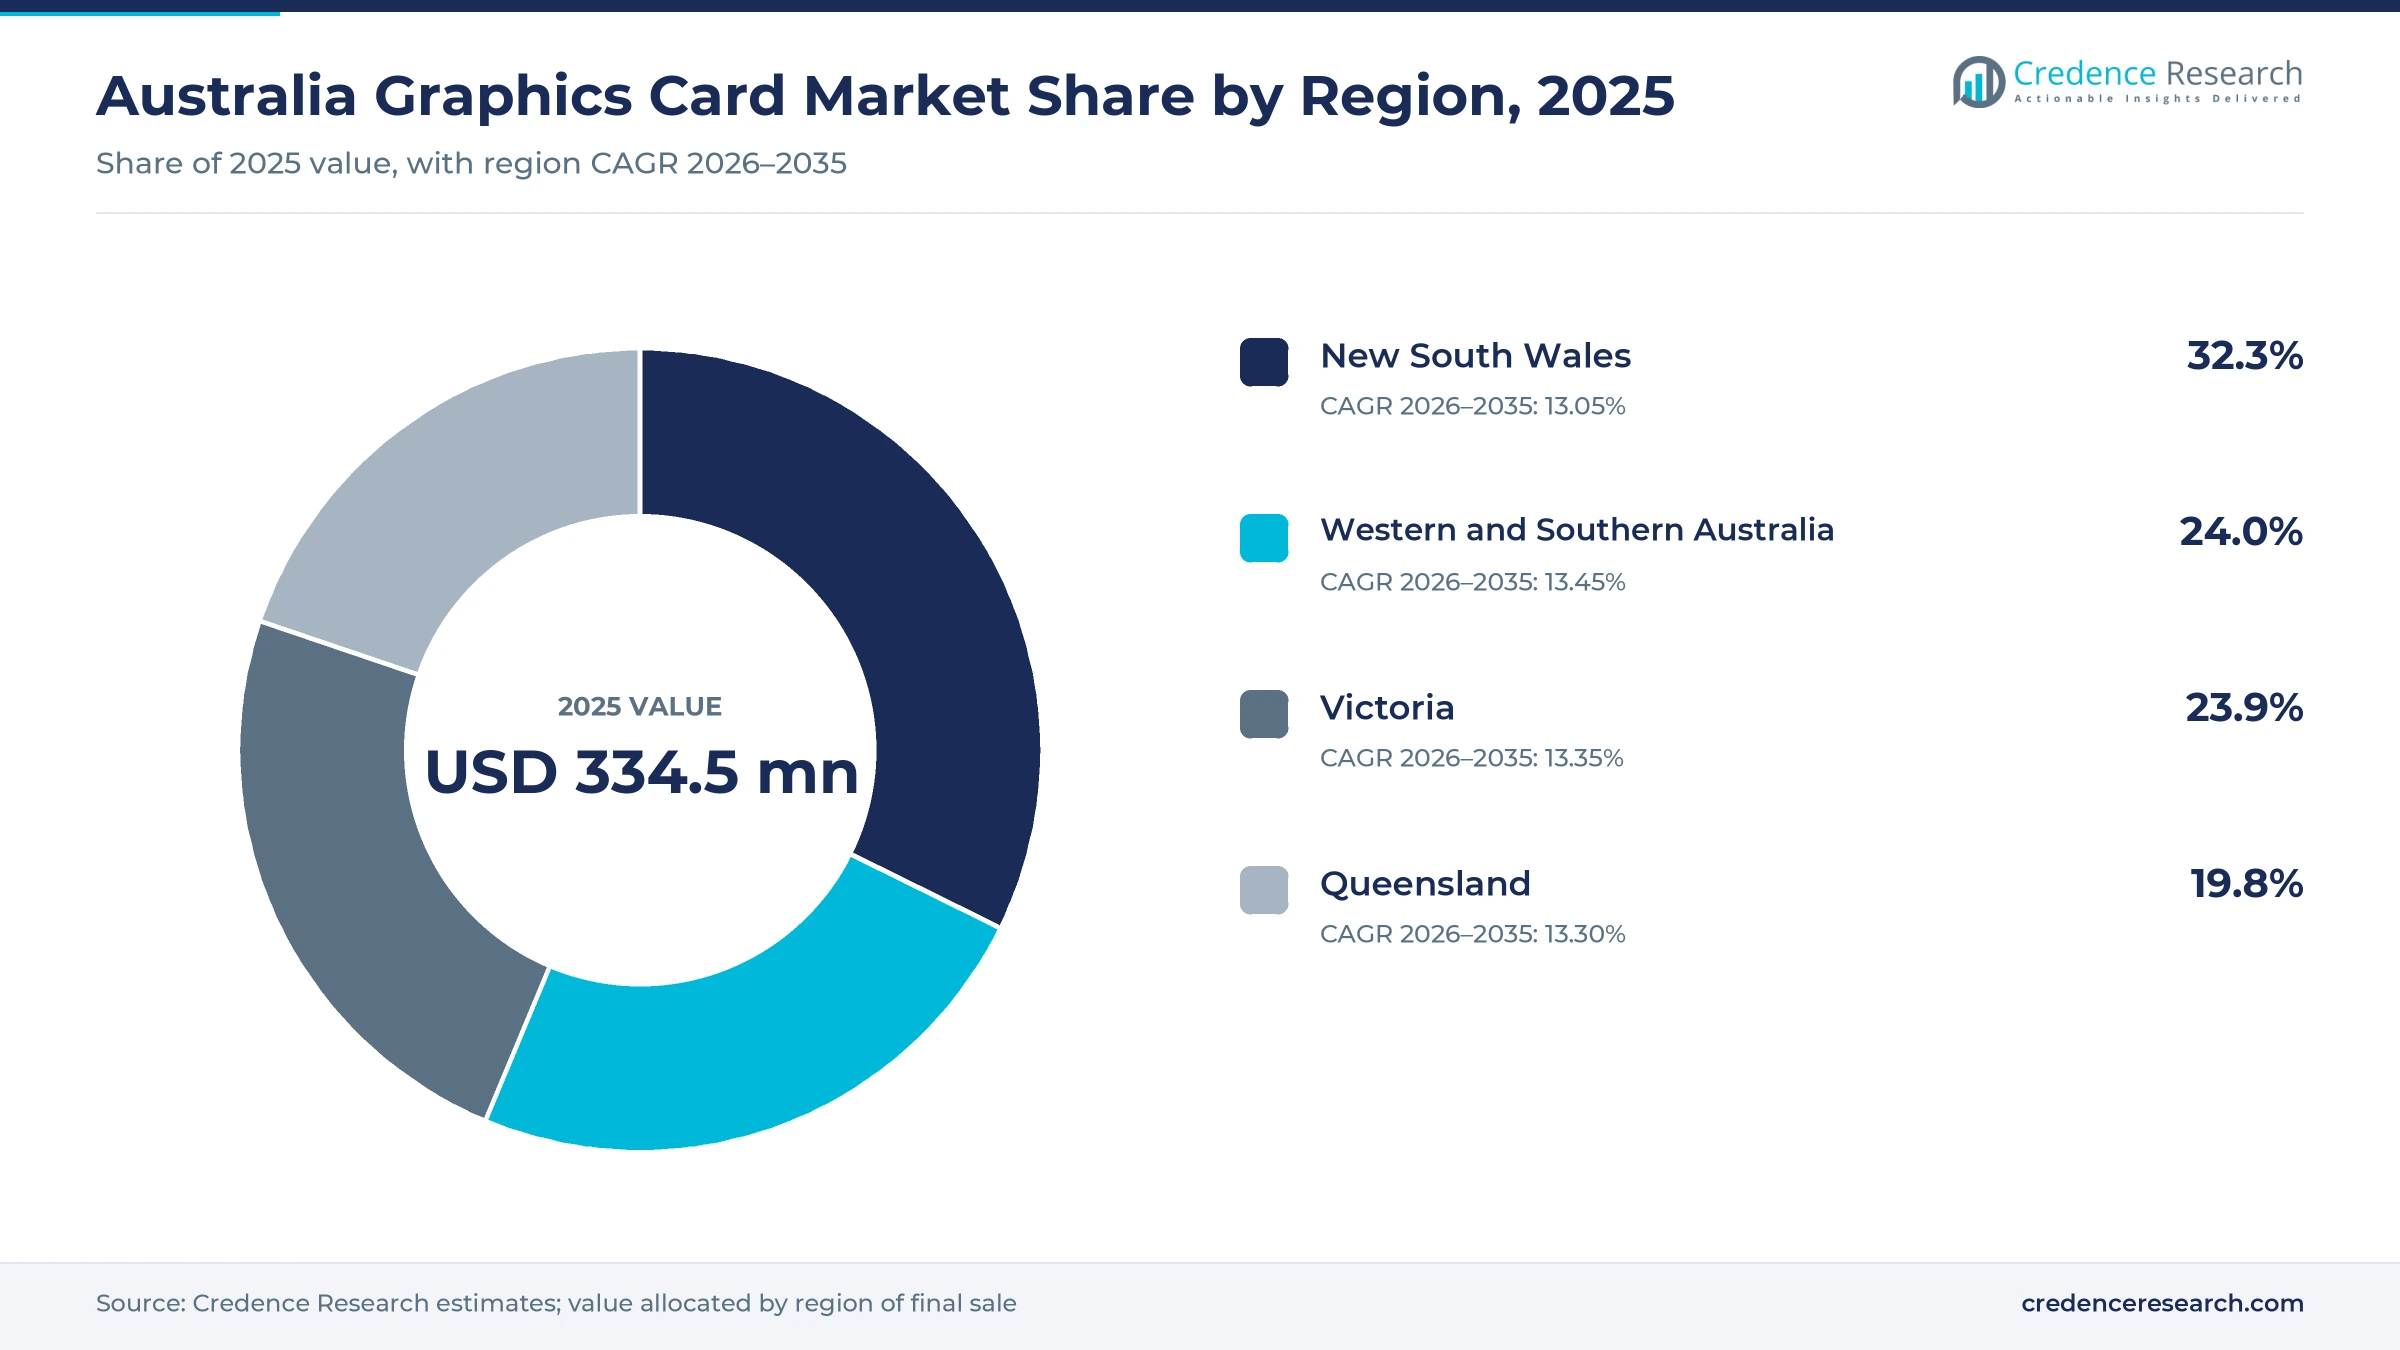
The Australia graphics card market was valued at USD 334.5 million in 2025 and is projected to increase from USD 386.0 million in 2026 to USD 1.18 billion by 2035, registering a CAGR of 13.27% during 2026–2035. Demand comes from home gamers who upgrade desktop PCs, studios that render video and visual effects, and developers and businesses that run artificial intelligence models on local machines. New South Wales held the largest regional share, 32.3% in 2025, because Sydney hosts the largest base of players, studios and corporate buyers. Western and Southern Australia is the fastest-growing zone at 13.45% a year, as Perth leads national population growth. Most cards are sold by specialist computer retailers and online marketplaces. New product generations from NVIDIA, AMD and Intel between December 2024 and March 2025 also reset performance and prices at every tier.
Which GPU products and buyers does the estimate cover?
The estimate measures the value of discrete GPU boards and mobile discrete graphics components sold in Australia to households, private enterprises, education and research buyers and government agencies. It covers consumer and professional desktop boards built on NVIDIA, AMD and Intel platforms. Values are stated at selling prices across specialist retailers, marketplaces, system builders, corporate procurement and mass-market electronics stores.
The estimate excludes integrated graphics inside processors, data center accelerators, game consoles and cloud GPU rental. The value chain runs from chip designers and memory makers through board partners and national distributors to retailers and system builders that sell finished boards or complete PCs to end users.
Australia Graphics Card Market Insights
- The Australia graphics card market was valued at USD 334.5 million in 2025 and is projected to reach USD 1.18 billion by 2035, registering a CAGR of 13.27% during 2026–2035.
- New South Wales held a 32.3% share of 2025 value, because Sydney hosts the largest base of players, studios and corporate buyers.
- Consumer desktop cards led with a 64.0% share of 2025 value, because home gamers buy most standalone boards for upgrades.
- NVIDIA announced its GeForce RTX 50 series on Jan. 6, 2025, with an Australian price of $4,039 for the top RTX 5090 model.
- About 43% of Australian small and medium businesses reported some AI adoption from December 2025 to February 2026.
Consumer desktop cards lead while local AI grows fastest
Why do consumer desktop boards lead demand?
Based on product type, the market is categorized into consumer desktop cards, professional desktop cards and mobile discrete graphics components. Consumer Desktop Cards led with a 64.0% share of 2025 value, because home gamers buy most standalone boards to upgrade existing PCs. Professional Desktop Cards grow fastest at 14.18% a year, as studios and developers buy boards with large memory for rendering and model work.
How does local AI outpace gaming in growth?
Based on application, the market is categorized into gaming, professional visualization, local artificial intelligence and office display. Gaming led with a 58.0% share of 2025 value, because most boards are bought to play new releases at higher resolution. Local Artificial Intelligence grows fastest at 17.14% a year, as developers and small firms run language and image models on their own machines.
How do the three GPU platforms split demand?
Based on technology, the market is categorized into the NVIDIA graphics platform, the AMD graphics platform and the Intel graphics platform. The NVIDIA Graphics Platform led with a 74.0% share of 2025 value, because its boards dominate gaming, studio and AI software support. The Intel Graphics Platform grows fastest at 14.05% a year, as value buyers test lower-priced entry boards with 12GB of memory.
How do specialist stores and builders reach buyers?
Based on distribution channel, the market is categorized into specialist retail and marketplaces, system builders, corporate direct procurement and mass-market electronics retail. Specialist Retail and Marketplaces led with a 46.0% share of 2025 value, because enthusiasts compare boards and stock online. Corporate Direct Procurement grows fastest at 13.85% a year, as firms buy AI-ready workstations.
| Segment Group | Leading Sub-segment | Share, 2025 | Fastest-growing Sub-segment | CAGR, 2026–2035 |
|---|---|---|---|---|
| By Product Type | Consumer Desktop Cards | 64.0% | Professional Desktop Cards | 14.18% |
| By Application | Gaming | 58.0% | Local Artificial Intelligence | 17.14% |
| By Technology | NVIDIA Graphics Platform | 74.0% | Intel Graphics Platform | 14.05% |
| By Distribution Channel | Specialist Retail and Marketplaces | 46.0% | Corporate Direct Procurement | 13.85% |
Request a Free Sample
Fill in your details and we'll send you a free sample report.
- Sample data tables & charts
- Research methodology
Gaming reach, screen work and local AI lift GPU demand
How does broad gaming participation sustain upgrades?
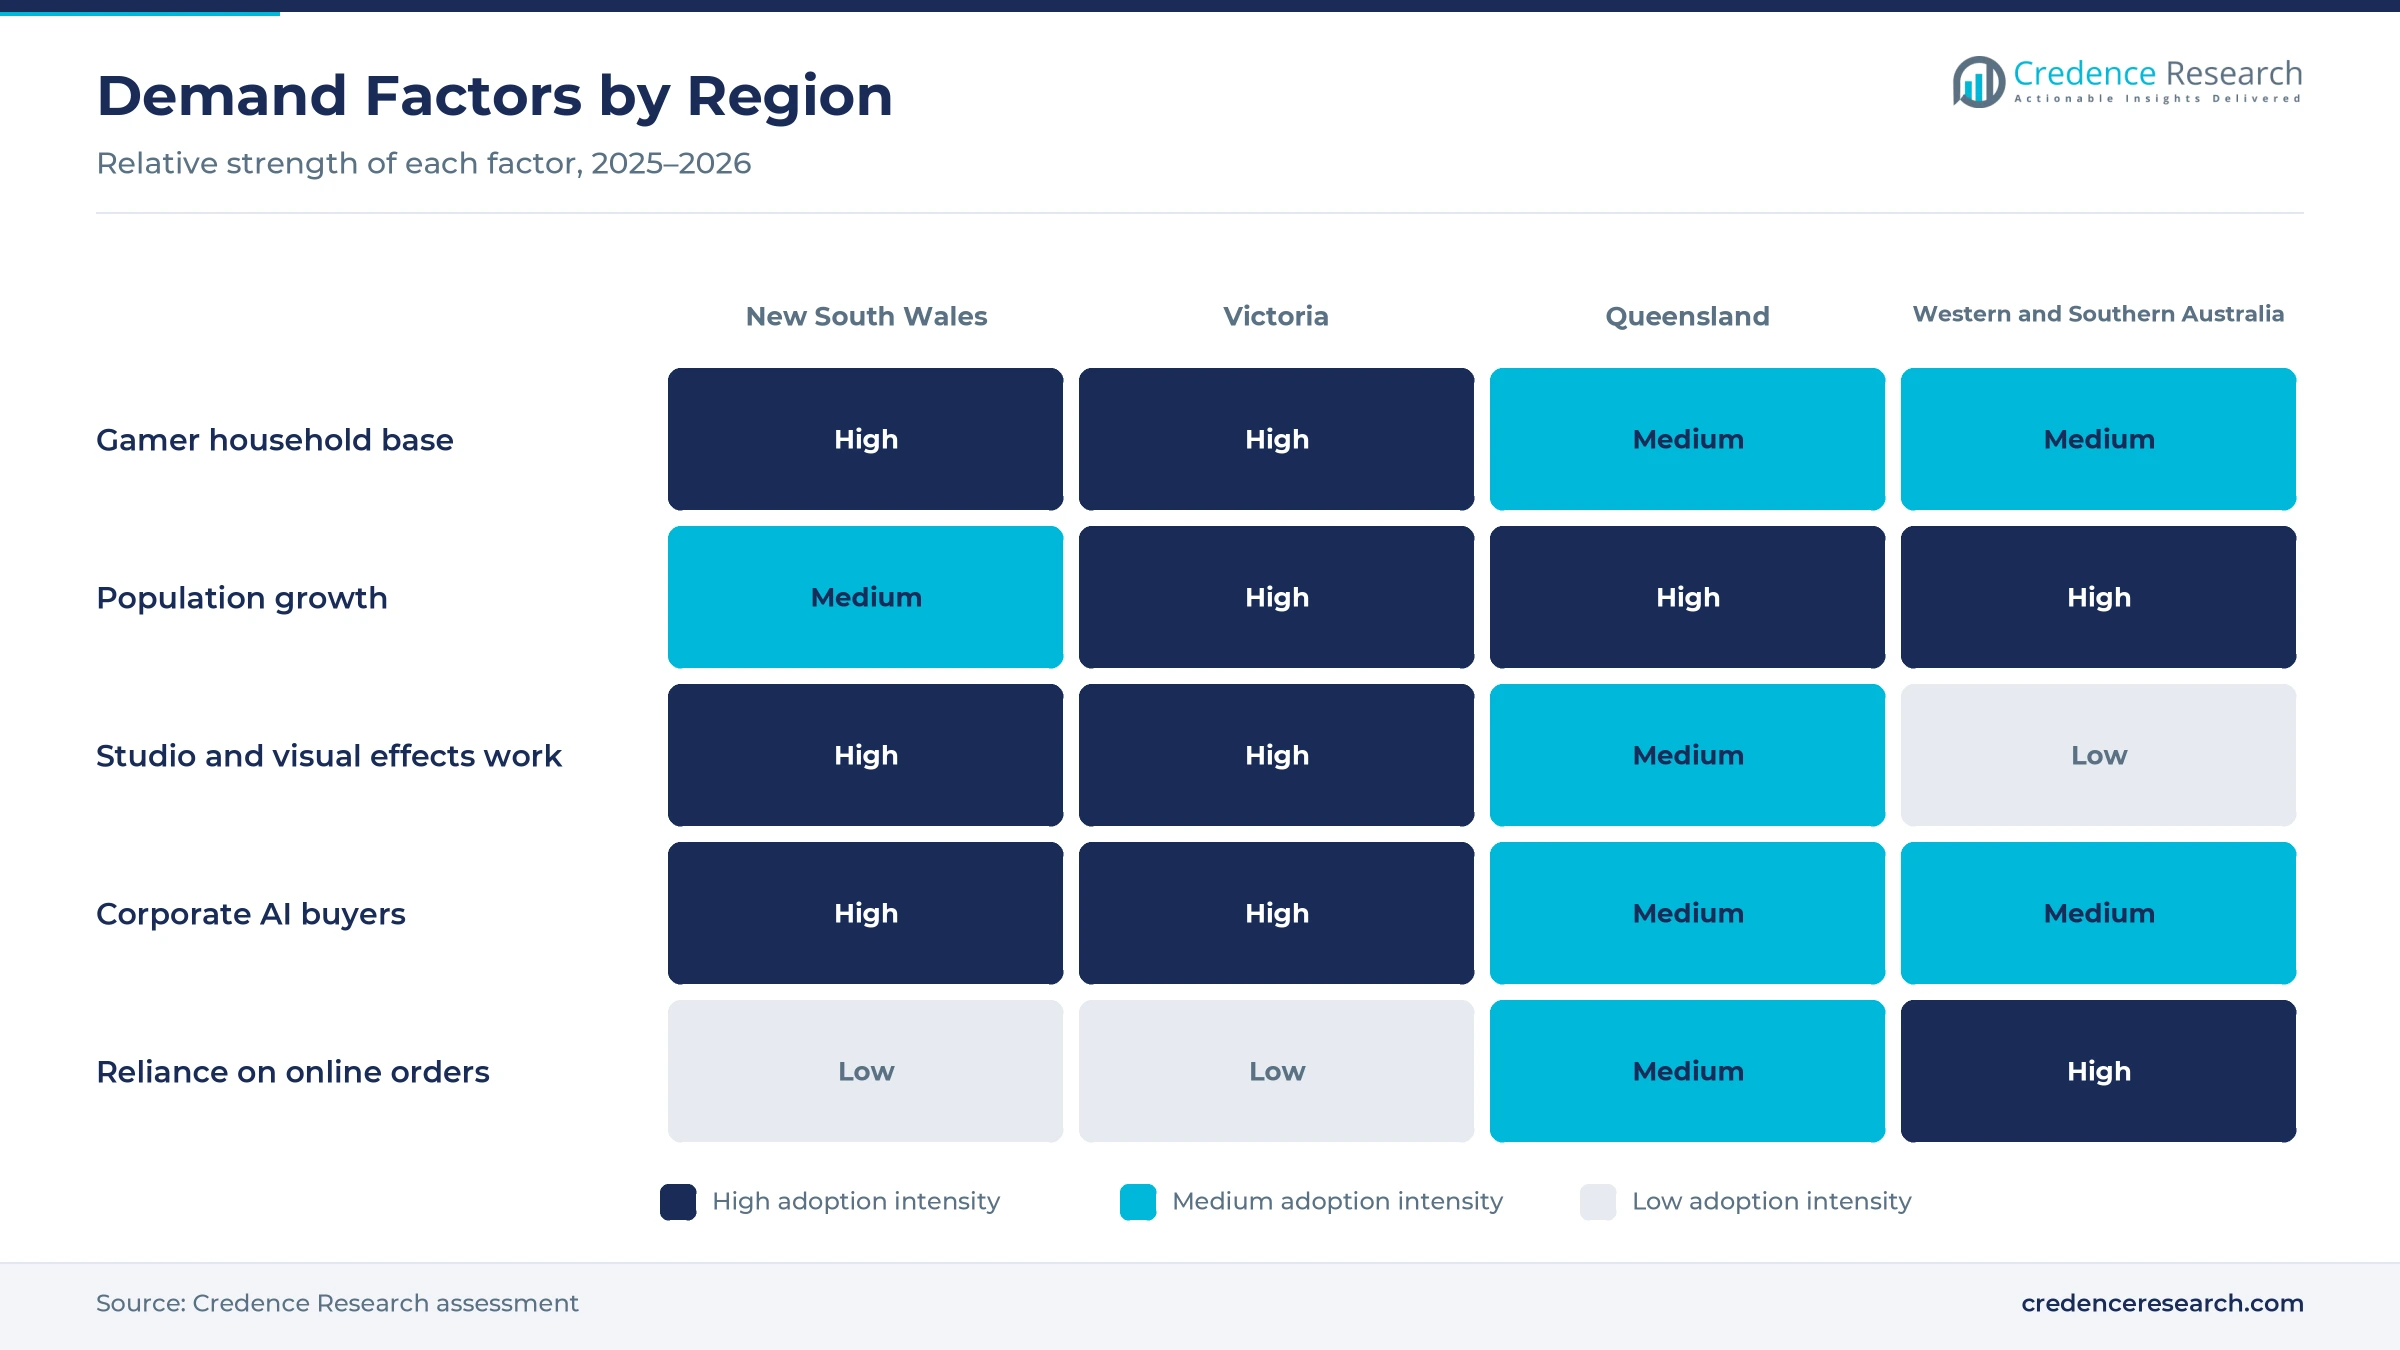
Broad gaming participation sustains upgrades, because PC players replace boards to run new releases at higher resolution and frame rates. About 82% of Australians play video games, and 58% of players use a PC, according to the Australia Plays 25 study reported by GadgetGuy in September 2025. The average player is 35 years old, and women made up 51% of players for the first time, which widens the household buyer base. Internet use reached 96.1% of the population in 2024, according to World Bank data, which supports online play and digital game sales. As a result, gaming holds a 58.0% share of 2025 value, and consumer desktop boards remain the largest product group.
Why does professional content production lift demand?
Professional content production lifts demand for workstation boards, because editing, visual effects and game development need large memory and fast rendering. Drama production spending in Australia reached a record $2.7 billion in 2024/25, up 43% on the prior year, according to Screen Australia. Post, digital and visual effects spending reached $762 million across local and international titles, up 33%, while 174 titles entered production. The federal Digital Games Tax Offset also returns 30% of qualifying development spending incurred from July 1, 2022, with a cap of $20 million per company each year. As a result, professional desktop cards grow at 14.18% a year, the fastest product rate.
How do local artificial intelligence workloads add buyers?
Local artificial intelligence workloads add a new buyer group, because developers and small firms run models on desktop boards to control data and cloud costs. About 43% of Australian small and medium businesses reported some level of AI adoption from December 2025 to February 2026, according to the National AI Centre. More than half of health, education and services businesses were actively using AI, while construction and agriculture stayed below 30%. The federal government released its National AI Plan on Dec. 2, 2025, and pledged $29.9 million to set up an AI Safety Institute in 2026. In turn, local artificial intelligence grows at 17.14% a year, the fastest application rate in the forecast.
Why do new GPU generations trigger upgrade cycles?
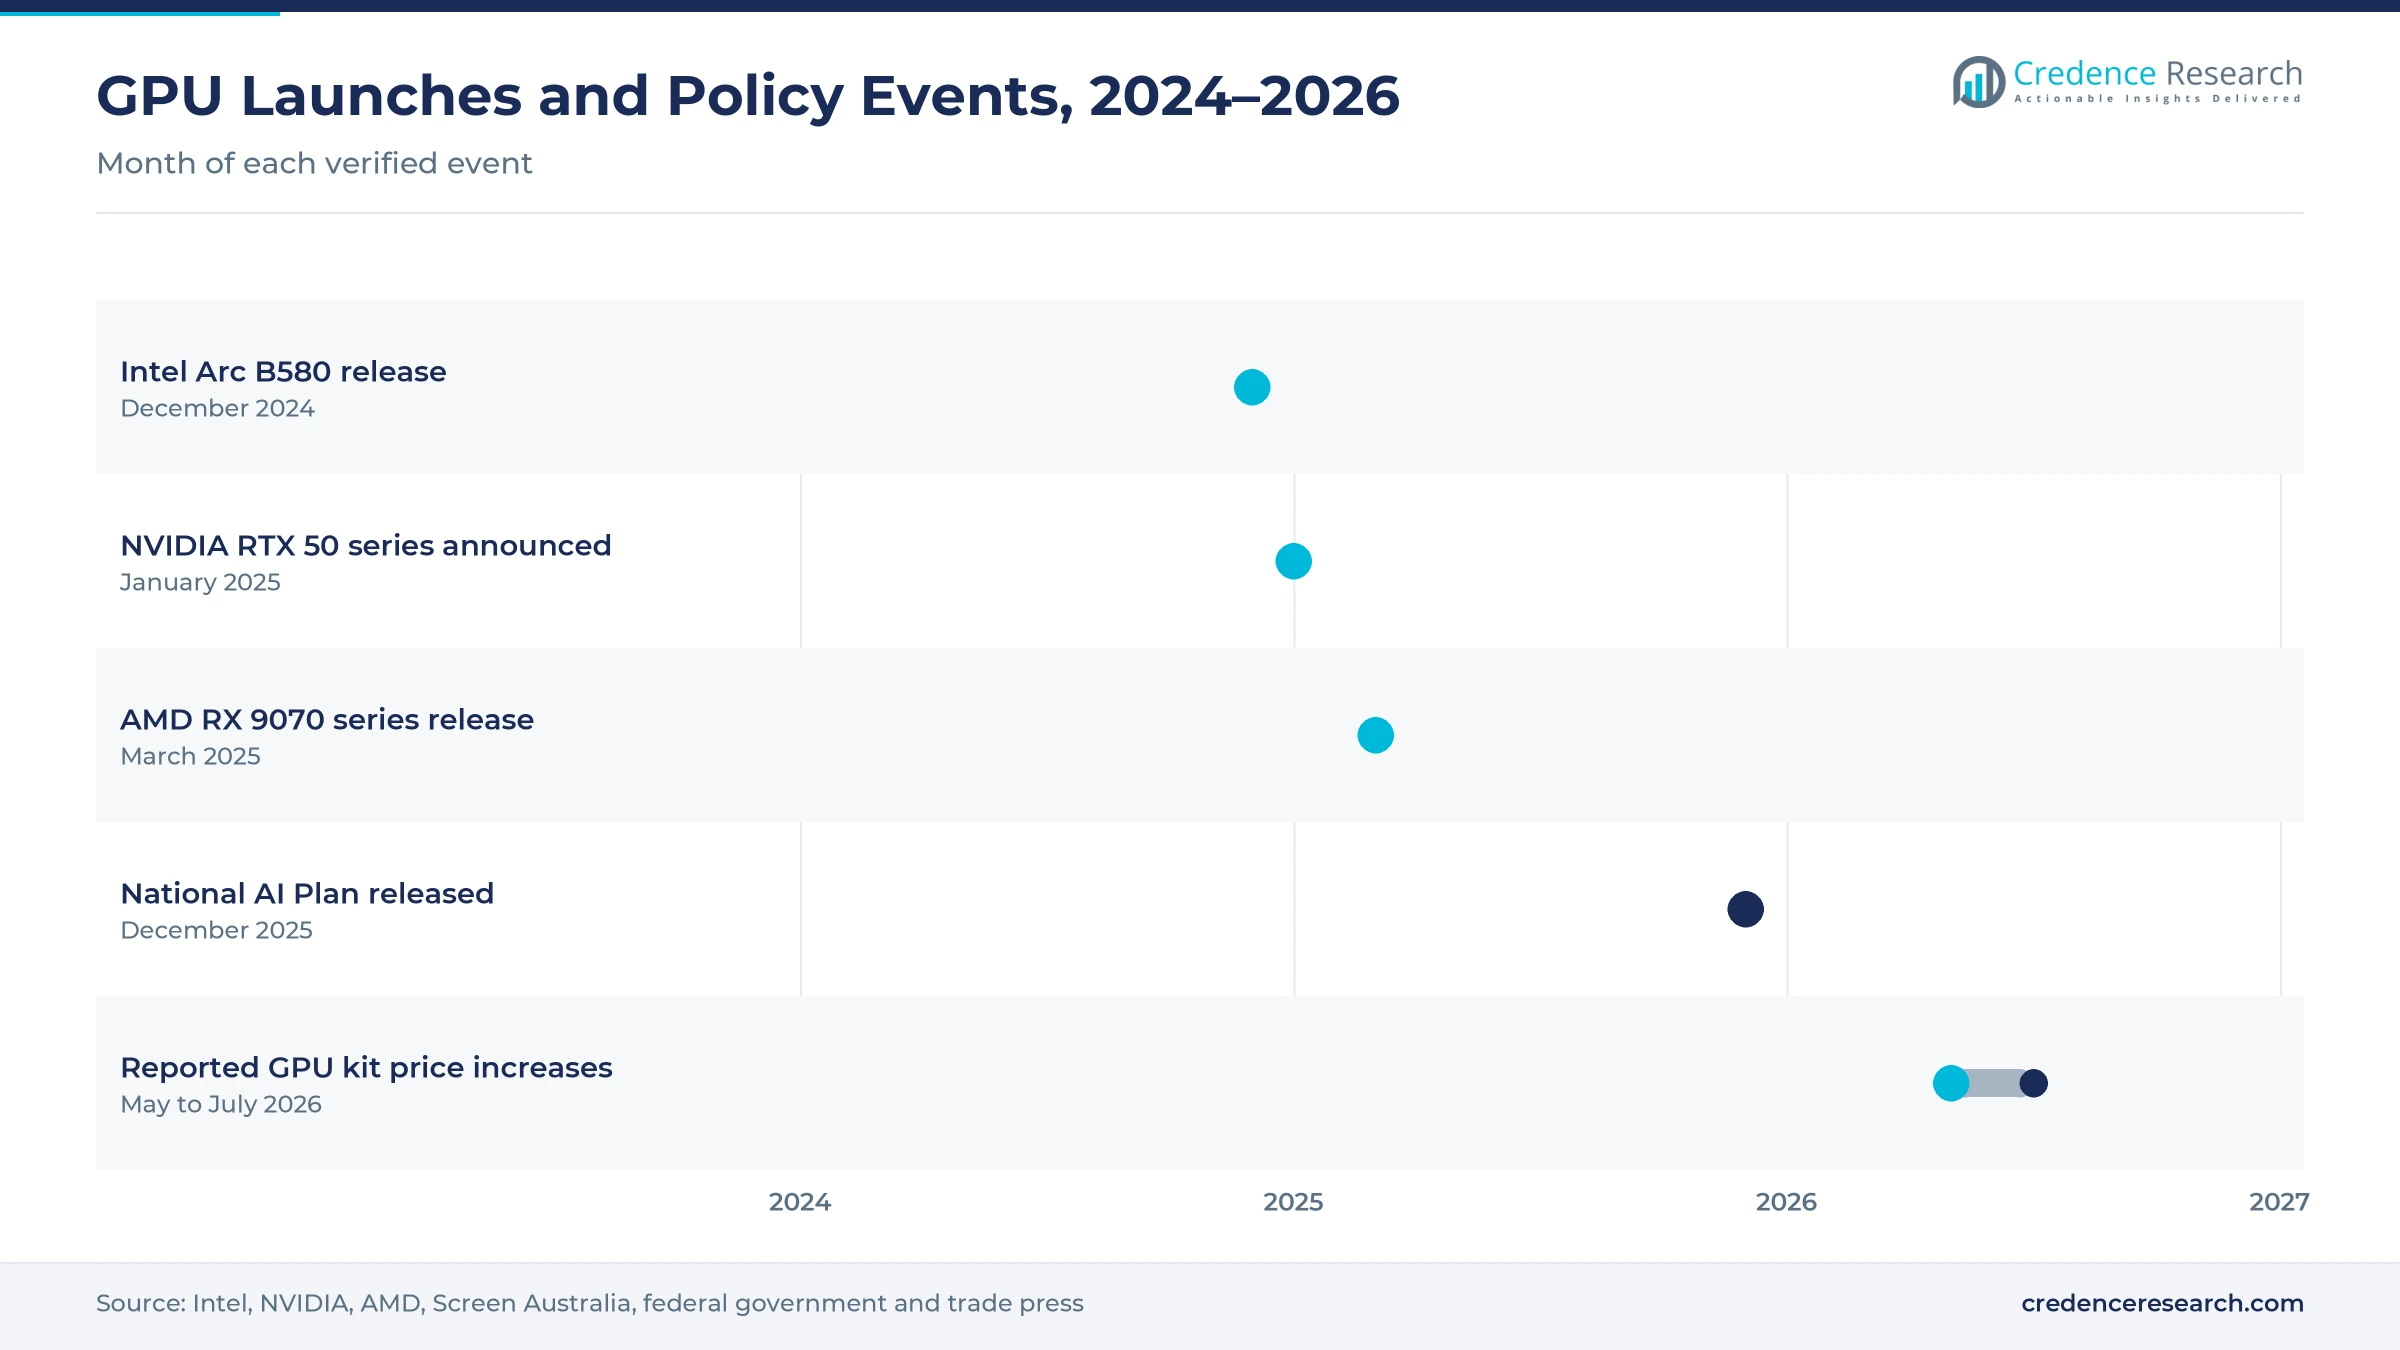
New GPU generations across all three platforms trigger regular upgrade cycles, because each launch resets performance at every price point. NVIDIA announced its GeForce RTX 50 series on Jan. 6, 2025, with Australian prices of $4,039 for the RTX 5090 and $1,109 for the RTX 5070, according to Press Start. AMD released the Radeon RX 9070 series on March 6, 2025, at U.S. prices of $599 for the XT model and $549 for the standard board. Intel released the Arc B580 with 12GB of memory on Dec. 13, 2024, at a U.S. price of $249. As a result, the NVIDIA graphics platform holds a 74.0% share of 2025 value.
Memory costs and larger frame buffers reshape pricing
How is the rise of memory costs changing board prices?
The rise of memory costs is changing board prices, because memory makers have shifted output toward high-bandwidth memory for data center GPU products. NVIDIA reportedly told board partners to expect a second GPU and memory kit price increase in 2026, according to reports in July 2026 that covered GDDR7 and GDDR6 boards. The first increase, in May 2026, reportedly affected only the RTX 5090 and a related model. Reports also put a 3GB GDDR7 chip at $60 to $70, compared with about $20 for a 2GB module. As a result, an Australian online retailer listed a GIGABYTE RTX 5090 AORUS Xtreme Waterforce 32GB board at $10,410, which pushes many buyers toward mainstream tiers.
Why is the shift to larger frame buffers gaining ground?
The shift to larger frame buffers is gaining ground, because new games, video editing and local models all need more on-board memory. Australian retailer listings show the GIGABYTE RTX 5080 AORUS Infinity with 16GB of GDDR7 memory, while top GIGABYTE RTX 5090 models carry 32GB. The ASUS RX 9070 XT Prime OC carries 16GB and was listed at $1,337 by an Australian online retailer. Intel's Arc B580 offers 12GB at its $249 U.S. launch price, which brings larger memory to the entry tier. In turn, buyers that run image and language models pay more for 16GB and 32GB boards, which supports value growth even when unit sales are flat.
Can entry and mainstream tiers win value buyers?
Entry and mainstream tiers can win value buyers, because rising flagship prices push many gamers toward boards under $1,000. Australian retailer PLE listed RTX 50 series boards from $499 to $3,799, with entry RTX 5050 models from GIGABYTE and PNY at the low end. Press Start estimated launch prices of about $866 for the RX 9070 and about $944 for the RX 9070 XT in Australia, based on U.S. prices. Intel's Arc B580 also entered at $249 in the United States, which adds a third platform to the entry tier. As a result, the Intel graphics platform grows at 14.05% a year, the fastest platform rate in the forecast.
Is there room for marketplaces and system builders?
Marketplaces and system builders have room to grow, because many buyers prefer to compare stock across sellers or order a complete PC. Australians spent a record $69 billion online in 2024, up 12% on the prior year, according to Australia Post data. About 9.8 million households made online purchases, and marketplaces were the largest category at close to $16 billion. Specialist sellers also bundle boards with PC gaming peripherals and monitors, which raises basket value. In turn, system builders grow at 13.85% a year, as buyers order AI-ready workstations and prebuilt gaming PCs instead of upgrading individual parts themselves at home.
Currency, launch supply and power limits slow upgrades
How do currency swings raise local prices?
Currency swings raise local prices, because boards are priced in U.S. dollars before import and distribution. A weaker Australian dollar lifts shelf prices even when global list prices stay flat. As a result, buyers delay upgrades or step down a tier. Distributors respond with staged price changes, bundled games and older stock offers that keep entry and mainstream boards within reach for value-focused gamers and schools.
Why does launch supply allocation frustrate buyers?
Launch supply allocation frustrates buyers, because new flagship boards arrive in small batches that sell out within hours. Australia receives a small share of global stock compared with larger markets. In turn, early buyers pay premium prices or wait several weeks. Retailers respond with preorder queues, purchase limits and bundles, while board partners add more models after launch to widen supply across price tiers.
How do power and cooling needs limit upgrades?
Power and cooling needs limit upgrades, because top boards draw high power and need large cases and strong power supplies. Many existing PCs cannot fit or power the newest cards without other upgrades. As a result, the full cost of an upgrade rises well above the board price. Board partners respond with compact designs, efficient coolers and mid-range models that run on standard power supplies.
Why do laptops and cloud play compete with boards?
Laptops and cloud play compete with desktop boards, because some buyers prefer a portable machine or a subscription. Players who choose gaming laptops buy mobile chips inside a finished system rather than a standalone board. In turn, desktop upgrade demand loses some first-time buyers each year. Board partners respond by targeting enthusiasts, creators and AI users who need performance that thin laptops and streaming services cannot match.
New South Wales leads while the west grows fastest
| Region | Value, 2025 (USD million) | Share, 2025 | CAGR, 2026–2035 |
|---|---|---|---|
| New South Wales | 108.0 | 32.3% | 13.05% |
| Western and Southern Australia | 80.3 | 24.0% | 13.45% |
| Victoria | 79.9 | 23.9% | 13.35% |
| Queensland | 66.2 | 19.8% | 13.30% |
Why does new South Wales hold the largest share?
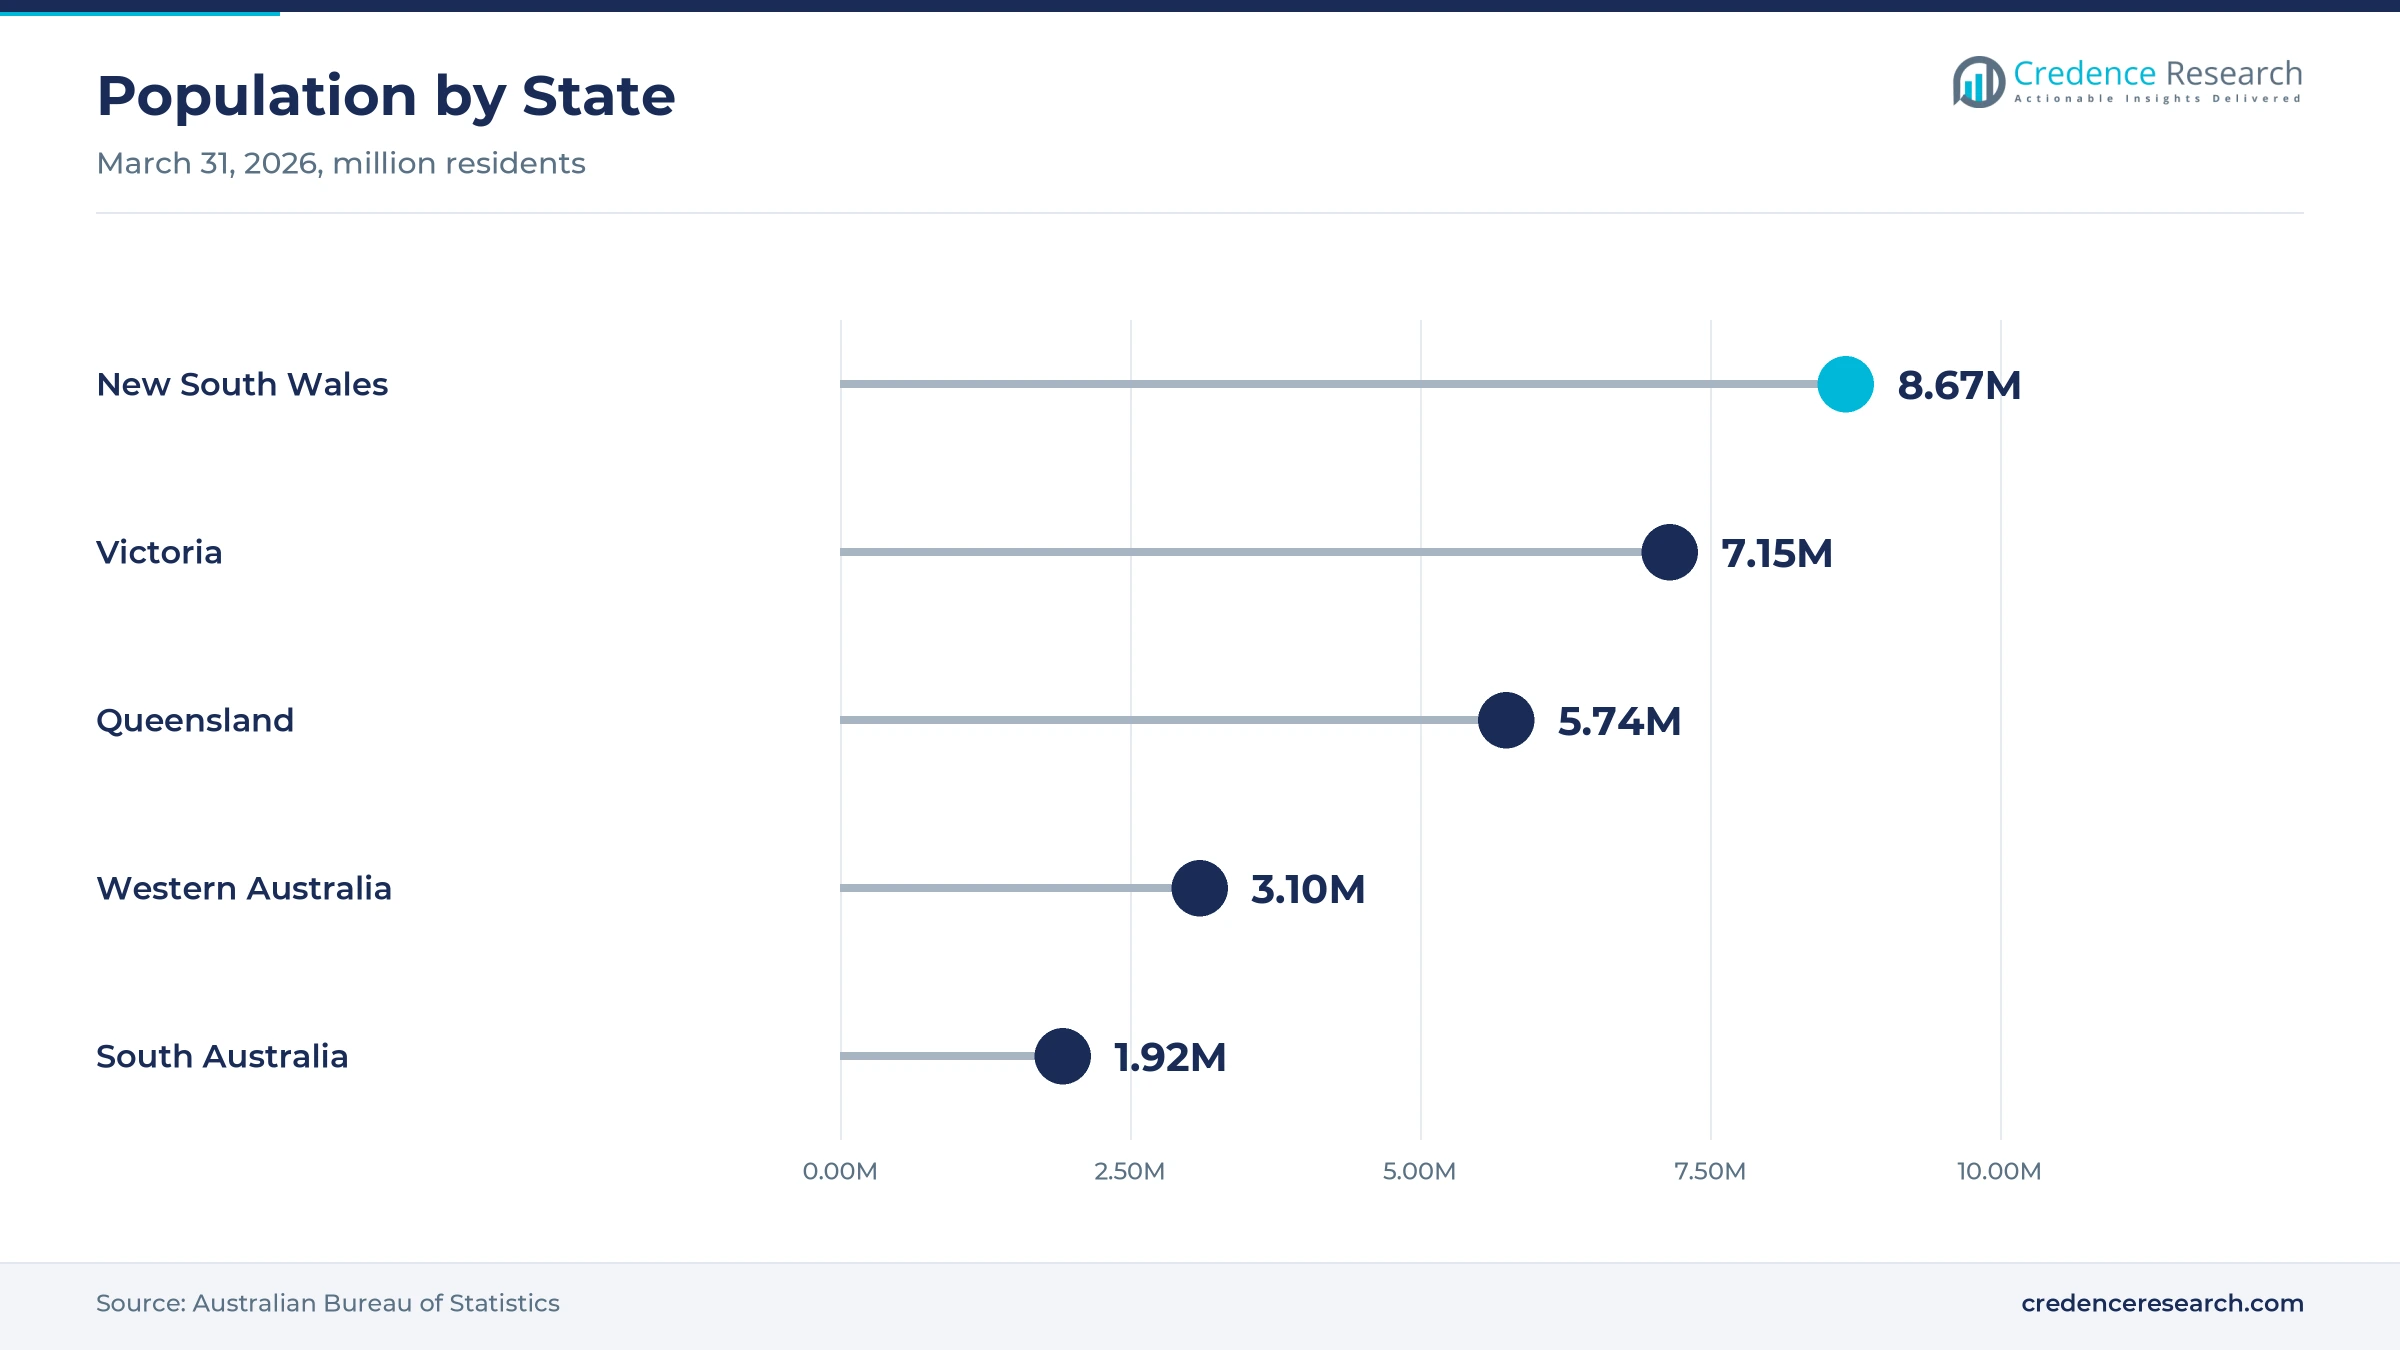
New South Wales held a 32.3% share of 2025 value and grows at 13.05% a year, because Sydney hosts the largest base of players, studios and corporate buyers. The state had about 8.67 million residents at March 31, 2026, according to the Australian Bureau of Statistics. However, growth is slower than in other zones, because state population growth was 1.1% over the year and many enthusiasts already own recent boards.
How does Victoria support studio and gaming demand?
Victoria held a 23.9% share of 2025 value and grows at 13.35% a year, because Melbourne hosts many game developers, post-production houses and enthusiast PC buyers. Victoria had about 7.15 million residents in March 2026 and grew 1.6% over the year, which supports new household demand. In turn, specialist retailers and system builders in Melbourne serve a steady flow of gaming and creator upgrades.
Why is Queensland gaining share?
Queensland held a 19.8% share of 2025 value and grows at 13.30% a year, because Brisbane and the Gold Coast attract new residents and growing studio work. Queensland had about 5.74 million residents in March 2026 and grew 1.6% over the year. As a result, demand rises for gaming boards and workstation cards among young households, students and small creative firms.
What drives growth in Western and Southern Australia?
Western and Southern Australia held a 24.0% share of 2025 value and grows fastest at 13.45% a year, because Western Australia had the fastest population growth at 2.1%. Perth and Adelaide also host mining technology, defense and research users that buy workstation boards. As a result, online sellers and local system builders gain orders from buyers far from eastern warehouses.
Three GPU launches and an AI plan marked 2024 to 2026
| Development | Status and market relevance |
|---|---|
| In December 2024, Intel released the Arc B580 with 12GB of memory at a U.S. price of $249. | Added a third platform to the entry tier |
| In January 2025, NVIDIA announced the GeForce RTX 50 series with an Australian price of $4,039 for the RTX 5090. | Reset performance and pricing at the top of the market |
| In March 2025, AMD released the Radeon RX 9070 series at U.S. prices of $549 and $599. | Strengthened competition in the mainstream and performance tiers |
| In December 2025, Screen Australia reported a record $2.7 billion in drama production spending for 2024/25. | Supports workstation demand from studios and visual effects firms |
| In December 2025, the federal government released its National AI Plan. | Supports AI adoption that lifts local model workloads |
Memory, upscaling and AI cores separate GPU generations
- GDDR7 memory raises bandwidth on new NVIDIA boards, which speeds high-resolution games and large model work.
- AI upscaling and frame generation renders frames at lower resolution and fills in detail, which lifts frame rates on mainstream boards.
- Dedicated AI cores run matrix math for local language and image models, which lets developers test models without cloud rental.
- Large frame buffers hold 16GB to 32GB of memory on performance boards, which supports 4K textures, video editing and bigger models.
Need a Custom Version of This Report?
Tailor the scope, geography, or segments to your exact requirements.
- Custom geography or segment scope
- Direct access to our analyst team
Board partners compete on cooling, price and stock
Competition is led by board partners that build cards on NVIDIA, AMD and Intel chips and sell them through Australian distributors, specialist stores and system builders. ASUS sells a full range of GPU boards on its Australian website and offers RX 9070 XT models such as the Prime OC. GIGABYTE, MSI, ZOTAC and Palit appear among the RTX 50 series brands listed by Australian retailer PLE, while GIGABYTE also sells AORUS flagship boards. SAPPHIRE was named among the partner brands expected to supply RX 9070 series boards in Australia at launch. Rivals compete on cooling design, noise, factory overclocks, warranty, local stock and price. Rising memory costs in 2026 push partners to focus on mainstream boards while keeping a few premium flagship models.
Companies profiled and their roles in this market
| Company | Type | Role in the market |
|---|---|---|
| ASUS | Board partner | Sells NVIDIA and AMD boards through its Australian website and retailers |
| GIGABYTE | Board partner | Sells RTX 50 series boards including AORUS flagship models in Australia |
| MSI | Board partner | Listed among RTX 50 series brands at Australian retailer PLE |
| SAPPHIRE | AMD board partner | Named among RX 9070 series launch partners for Australia |
| ZOTAC | Board partner | Listed among RTX 50 series brands at Australian retailer PLE |
| Palit | Board partner | Listed among RTX 50 series brands at Australian retailer PLE |
Credence Research view on Australian GPU demand
Credence Research's view is that Australian GPU demand will grow strongly because gaming stays broad, studio work keeps rising and local AI adds a new buyer group. Consumer desktop boards remain the base of the market, while professional boards and local AI use gain share. However, memory costs, a volatile currency and launch shortages will keep prices high in 2026. Board partners and retailers that hold local stock, offer mainstream boards with large memory and serve AI-ready workstation buyers should gain share fastest.
How the Australian GPU estimate was built
The report uses 2025 as the base year on a calendar basis, and market values come from the Credence Research model. That model combines population statistics, World Bank internet data, gaming participation research, screen production statistics, AI adoption surveys, company launch announcements and Australian retailer price listings. Segment splits and regional growth rates are Credence Research estimates, while regional shares follow the client-defined split. Sources used are public reports, official statistics, trade press and company websites, and no interviews or surveys were used.
Local AI and studio work carry GPU demand to 2035
Sales of GPU boards in Australia are expected to reach USD 1.18 billion by 2035, a 13.27% CAGR during 2026–2035, as gaming upgrades, studio work and local AI keep demand rising. Growth may slow in 2026 while memory costs lift prices, then recover as new product generations arrive and supply improves. After that, local AI and professional visualization will carry more growth as gaming demand matures. A weaker Australian dollar would lower this outlook, while faster AI adoption by small firms would raise it. Partners with strong local stock and large-memory boards are expected to gain the most.
Frequently Asked Questions
How big is the Australia graphics card market?
Which product type leads GPU demand in Australia?
Which region leads the Australia graphics card market?
Which application is growing fastest?
What drives GPU demand in Australia?
How do memory costs affect GPU prices?
Who are the leading board partners in Australia?
What are the main challenges for GPU sellers?
Table of Content
Chapter 1 Market Segmentation
- 1.1 Segmentation Framework
- 1.1.1 Product and Service Classification
- 1.1.2 Application and End-Use Classification
- 1.1.3 Technology and Solution Classification
- 1.1.4 Customer and Distribution Channel Classification
- 1.1.5 Geographic Segmentation
- 1.1.6 Market Segment Definitions and Boundaries
- 1.2 By Product Type
- 1.2.1 Consumer Desktop Cards
- 1.2.2 Professional Desktop Cards
- 1.2.3 Mobile Discrete Graphics Components
- 1.3 By Application
- 1.3.1 Gaming
- 1.3.2 Professional Visualization
- 1.3.3 Local Artificial Intelligence
- 1.3.4 Office Display
- 1.4 By Technology
- 1.4.1 NVIDIA Graphics Platform
- 1.4.2 AMD Graphics Platform
- 1.4.3 Intel Graphics Platform
Chapter 2 Introduction
- 2.1 Report Objectives and Scope
- 2.2 Product Definition and Industry Terminology
- 2.3 Market Inclusions and Exclusions
- 2.4 Research Process
- 2.4.1 Primary Research and Expert Interviews
- 2.4.2 Secondary Research and Source Review
- 2.4.3 Top-Down and Bottom-Up Estimation
- 2.4.4 Data Triangulation and Verification
- 2.5 Market Size Measurement Basis
- 2.5.1 2025: USD 334.5 million → 2035: USD 1.18 billion
- 2.6 Historical and Forecast Reference Periods
- 2.6.1 Historical Period: 2018-2025
- 2.6.2 Base Year: 2025
- 2.6.3 Forecast Period: 2025-2035
- 2.7 Research Assumptions and Limitations
Chapter 3 Executive Summary
- 3.1 Market Snapshot and Key Findings
- 3.2 Base-Year Market Size, 2025
- 3.3 Forecast Market Size, 2035
- 3.4 Revenue and Volume Growth Outlook
- 3.5 Key Demand and Supply Indicators
- 3.6 Leading Market Segments
- 3.7 Fastest-Growing Market Opportunities
- 3.8 Regional Performance Highlights
- 3.9 Technology and Industry Transformation
- 3.10 Competitive Landscape Summary
- 3.11 Analyst View and Strategic Implications
Chapter 4 Australia Graphics Card Market Trends and Developments
- 4.1 Historical Industry Development, 2018-2025
- 4.2 Recent Market Trends and Developments
- 4.3 Demand and Customer Behavior Trends
- 4.4 Technology and Product Innovation
- 4.5 Artificial Intelligence, Automation and Digitalization
- 4.6 Local Manufacturing and Supply Chain Realignment
- 4.7 Industry Partnerships, Mergers and Acquisitions
- 4.8 Sustainability and Circular Economy Developments
- 4.9 Government and Private Sector Investment Trends
- 4.10 Emerging Business Models and Commercialization
- 4.11 Industry Developments and Announcements
Chapter 5 Australia Graphics Card Market Production, Supply and Demand Analysis
- 5.1 Demand Trend and Consumption Analysis, 2018-2025
- 5.2 Demand Forecast, 2025-2035
- 5.3 Production and Output Trend, 2018-2025
- 5.4 Production and Output Forecast, 2025-2035
- 5.5 Installed Capacity and Capacity Utilization
- 5.6 Company-Wise Production Plants and Statistics
- 5.6.1 Installed Production Capacity
- 5.6.2 Actual Production
- 5.6.3 Planned Capacity and Expansion Targets
- 5.7 Supply Chain Structure and Procurement Trends
- 5.8 Supply-Demand Gap and Bottlenecks
- 5.9 Import Dependence and Sourcing Structure
- 5.10 Contract Manufacturing and Outsourcing
- 5.11 Regional Supply and Demand Concentration
Chapter 6 Australia Graphics Card Market Pricing Analysis
- 6.1 Pricing Structure and Measurement
- 6.2 Historical Pricing Trends, 2018-2025
- 6.3 Pricing Outlook, 2025-2035
- 6.4 Average Selling Price and Unit Economics
- 6.5 Pricing by Product and Market Segment
- 6.6 Geographic Pricing Differences
- 6.7 Key Input, Energy, Labor and Logistics Costs
- 6.8 Contract Pricing and Purchasing Models
- 6.9 Pricing Sensitivity and Competitive Positioning
- 6.10 Price, Margin and Profitability Implications
Chapter 7 Australia Graphics Card Market Dynamics
- 7.1 Market Growth Drivers
- 7.1.1 Demand-Side Drivers
- 7.1.2 Technology and Innovation Drivers
- 7.1.3 Infrastructure and Investment Drivers
- 7.1.4 Regulatory and Policy Drivers
- 7.2 Market Restraints
- 7.2.1 Cost and Affordability Constraints
- 7.2.2 Technology and Adoption Barriers
- 7.2.3 Supply Chain and Operational Constraints
- 7.3 Market Challenges
- 7.3.1 Competitive Pressure and Margin Erosion
- 7.3.2 Skills, Infrastructure and Implementation Gaps
- 7.4 Emerging Market Opportunities
- 7.5 Market Dynamics Impact and Time-Horizon Assessment
Chapter 8 Australia Graphics Card Value Chain Analysis
- 8.1 Industry Value Chain Overview
- 8.2 Upstream Suppliers and Critical Inputs
- 8.3 Technology and Component Providers
- 8.4 Manufacturing or Service Delivery
- 8.5 Distribution, Channel Partners and Integrators
- 8.6 Downstream Applications and End Users
- 8.7 Value Addition and Profit Pools
- 8.8 Vertical Integration and Outsourcing
- 8.9 Supplier Concentration and Risk
- 8.10 Supply Chain Localization and Resilience
Chapter 9 Australia Graphics Card Market Regulations and Policies
- 9.1 Relevant Laws, Standards and Compliance Frameworks
- 9.2 Product, Service, Safety and Quality Requirements
- 9.3 Government Policies, Incentives and Subsidies
- 9.4 Imports, Exports and Trade Barriers
- 9.5 Public Procurement and Local Content Requirements
- 9.6 Environmental and Sustainability Compliance
- 9.7 Upcoming Policy Changes and Market Implications
Chapter 10 Australia Graphics Card Market Hotspots and Opportunities
- 10.1 Market Opportunity Mapping and Growth Hotspots
- 10.2 High-Growth Applications and Customer Groups
- 10.3 Underserved Markets and White-Space Opportunities
- 10.4 Emerging Technology and Product Opportunities
- 10.5 New Capacity and Investment Hotspots
- 10.6 Market Entry and Expansion Opportunities
- 10.7 Distribution and Partnership Opportunities
- 10.8 Near-Term and Long-Term Commercial Potential
- 10.9 Opportunity Attractiveness and Execution Risks
Chapter 11 Australia Graphics Card Market Outlook, 2025-2035
- 11.1 Market Size and Analysis
- 11.1.1 Revenue (Market Measurement: 2025: USD 334.5 million → 2035: USD 1.18 billion)
- 11.1.2 Market Volume and Quantity Sold
- 11.1.3 Historical Market Size, 2018-2025
- 11.1.4 Base-Year Market Size, 2025
- 11.2 Market Forecast, 2025-2035
- 11.2.1 Revenue Forecast to 2035
- 11.2.2 Volume Forecast to 2035
- 11.2.3 CAGR and Year-on-Year Growth
- 11.2.4 Incremental Revenue Opportunity
- 11.3 Forecast Assumptions and Scenario Analysis
- 11.3.1 Base-Case Forecast
- 11.3.2 Optimistic and Conservative Scenarios
- 11.3.3 Technology, Pricing and Policy Sensitivities
- 11.4 Market Attractiveness and Growth Outlook
Chapter 12 Australia Graphics Card Market Segmentation and Outlook
- 12.1 Segmentation Summary and Market Shares, 2025
- 12.2 Largest and Fastest-Growing Segments
- 12.3 By Product Type - Market Size and Forecast, 2025-2035
- 12.3.1 Segment Definition and Scope
- 12.3.2 Historical Market Size, 2018-2025
- 12.3.3 Revenue Forecast, 2025-2035
- 12.3.4 Volume Forecast, 2025-2035
- 12.3.5 Base-Year Market Share, 2025
- 12.3.6 Segment CAGR and Growth Drivers
- 12.3.7 Subsegment Market Size and Forecast
- 12.3.7.1 Consumer Desktop Cards
- 12.3.7.2 Professional Desktop Cards
- 12.3.7.3 Mobile Discrete Graphics Components
- 12.3.8 Subsegment Pricing and Adoption Trends
- 12.3.9 Leading Suppliers and Competition
- 12.3.10 Regional Demand and Opportunities
- 12.4 By Application - Market Size and Forecast, 2025-2035
- 12.4.1 Segment Definition and Scope
- 12.4.2 Historical Market Size, 2018-2025
- 12.4.3 Revenue Forecast, 2025-2035
- 12.4.4 Volume Forecast, 2025-2035
- 12.4.5 Base-Year Market Share, 2025
- 12.4.6 Segment CAGR and Growth Drivers
- 12.4.7 Subsegment Market Size and Forecast
- 12.4.7.1 Gaming
- 12.4.7.2 Professional Visualization
- 12.4.7.3 Local Artificial Intelligence
- 12.4.7.4 Office Display
- 12.4.8 Subsegment Pricing and Adoption Trends
- 12.4.9 Leading Suppliers and Competition
- 12.4.10 Regional Demand and Opportunities
- 12.5 By Technology - Market Size and Forecast, 2025-2035
- 12.5.1 Segment Definition and Scope
- 12.5.2 Historical Market Size, 2018-2025
- 12.5.3 Revenue Forecast, 2025-2035
- 12.5.4 Volume Forecast, 2025-2035
- 12.5.5 Base-Year Market Share, 2025
- 12.5.6 Segment CAGR and Growth Drivers
- 12.5.7 Subsegment Market Size and Forecast
- 12.5.7.1 NVIDIA Graphics Platform
- 12.5.7.2 AMD Graphics Platform
- 12.5.7.3 Intel Graphics Platform
- 12.5.8 Subsegment Pricing and Adoption Trends
- 12.5.9 Leading Suppliers and Competition
- 12.5.10 Regional Demand and Opportunities
- 12.6 Segment Growth Comparison
- 12.7 Segment Attractiveness and Priority Matrix
Chapter 13 Australia Graphics Card End-Use and Application Market Outlook
- 13.1 End-Use Industry and Customer Demand Structure
- 13.2 Leading Applications and Customer Groups
- 13.3 End-Use Market Size, Share and Forecast
- 13.4 Major End-Use Industry Deep Dives
- 13.4.1 Customer Requirements and Use Cases
- 13.4.2 Demand and Replacement Cycles
- 13.4.3 Technical and Regulatory Considerations
- 13.4.4 Purchasing and Procurement Models
- 13.4.5 Leading Vendors and Distribution Channels
- 13.4.6 Forecast and Commercial Opportunities
- 13.5 Emerging Applications and Cross-Segment Demand
- 13.6 End-Use Industry Investment Priorities
Chapter 14 Australia Graphics Card Geographic Market Outlook, 2025-2035
- 14.1 Domestic Market Distribution and Demand Clusters
- 14.2 State- or Province-Wise Market Size and Forecast, 2025-2035
- 14.3 City and Metropolitan Market Outlook
- 14.4 Industrial, Manufacturing and Commercial Clusters
- 14.5 Geographic Concentration of Key End Users
- 14.6 Local Pricing and Purchasing Differences
- 14.7 Domestic Production Facilities and Capacity Map
- 14.8 Local Infrastructure and Project Pipeline
- 14.9 State-Level Policy and Incentive Differences
- 14.10 Subnational Investment Hotspots and Opportunities
- 14.11 Distribution and Logistics Networks
- 14.12 Domestic Competitive Footprint
Chapter 15 Australia Graphics Card Technology, Innovation and Sustainability Outlook
- 15.1 Technology Landscape and Maturity
- 15.2 Product, Process and Service Innovation
- 15.3 AI, Automation and Digital Tools in the Industry
- 15.4 Technology Adoption and Performance Benchmarking
- 15.5 Innovation Pipeline and R&D Investment
- 15.6 Patent and Intellectual Property Trends
- 15.7 Energy Efficiency and Resource Management
- 15.8 Sustainability, Recycling and Circularity
- 15.9 Technology Roadmap, 2025-2035
- 15.10 Risks of Obsolescence and Technology Substitution
Chapter 16 Australia Graphics Card Market Key Strategic Imperatives
- 16.1 Growth and Market Entry Priorities
- 16.2 High-Return Products and Segments
- 16.3 Pricing, Profitability and Cost Optimization
- 16.4 Technology Investment and Product Differentiation
- 16.5 Supply Chain Localization and Resilience
- 16.6 Distribution and Customer Acquisition
- 16.7 Partnership, Acquisition and Capacity Strategy
- 16.8 Regional Expansion Priorities
- 16.9 Short-, Medium- and Long-Term Actions
Chapter 17 Competition Outlook
- 17.1 Industry Competition Characteristics
- 17.2 Market Structure and Concentration
- 17.3 Market Share and Competitive Positioning, 2025
- 17.4 Company-Wise Revenue and Product Benchmarking
- 17.5 Production and Service Capacity Benchmarking
- 17.6 Technology, Pricing and Differentiation
- 17.7 Regional Footprint and Distribution Strength
- 17.8 Mergers, Acquisitions and Strategic Alliances
- 17.9 New Entrants and Competitive Threats
- 17.10 Porter's Five Forces and Industry Attractiveness
- 17.11 Competitive Outlook, 2025-2035
Chapter 18 Company Profiles
- 18.1 Company Coverage and Selection Criteria
- 18.2 ASUS
- 18.2.1 Business Description
- 18.2.2 Company Ownership and Geographic Presence
- 18.2.3 Product and Service Portfolio
- 18.2.4 Manufacturing and Operating Footprint
- 18.2.5 Production Capacity and Expansion Plans
- 18.2.6 Financial Performance and Investment
- 18.2.7 Market Share and Competitive Position
- 18.2.8 Technology and Innovation Capabilities
- 18.2.9 Strategic Alliances or Partnerships
- 18.2.10 Recent Developments
- 18.2.11 Growth Strategy and Outlook
- 18.3 GIGABYTE
- 18.4 MSI
- 18.5 SAPPHIRE
- 18.6 ZOTAC
- 18.7 PowerColor
- 18.8 GALAX
- 18.9 Palit
- 18.10 XFX
- 18.11 ASRock
- 18.12 Other Relevant Market Participants
Note: Every listed company is profiled on the structure shown under the first company. The company list is preliminary and may change based on research findings, market developments, data availability and client requirements.
Chapter 19 Disclaimer
- 19.1 Research and Forecast Disclaimer
- 19.2 Data Source and Estimation Limitations
Note: The depth of individual sections depends on data availability for this market. Volume, capacity, trade and other unit-based metrics are included where applicable.

