
Imported jumpers serve design, repair and prototype work
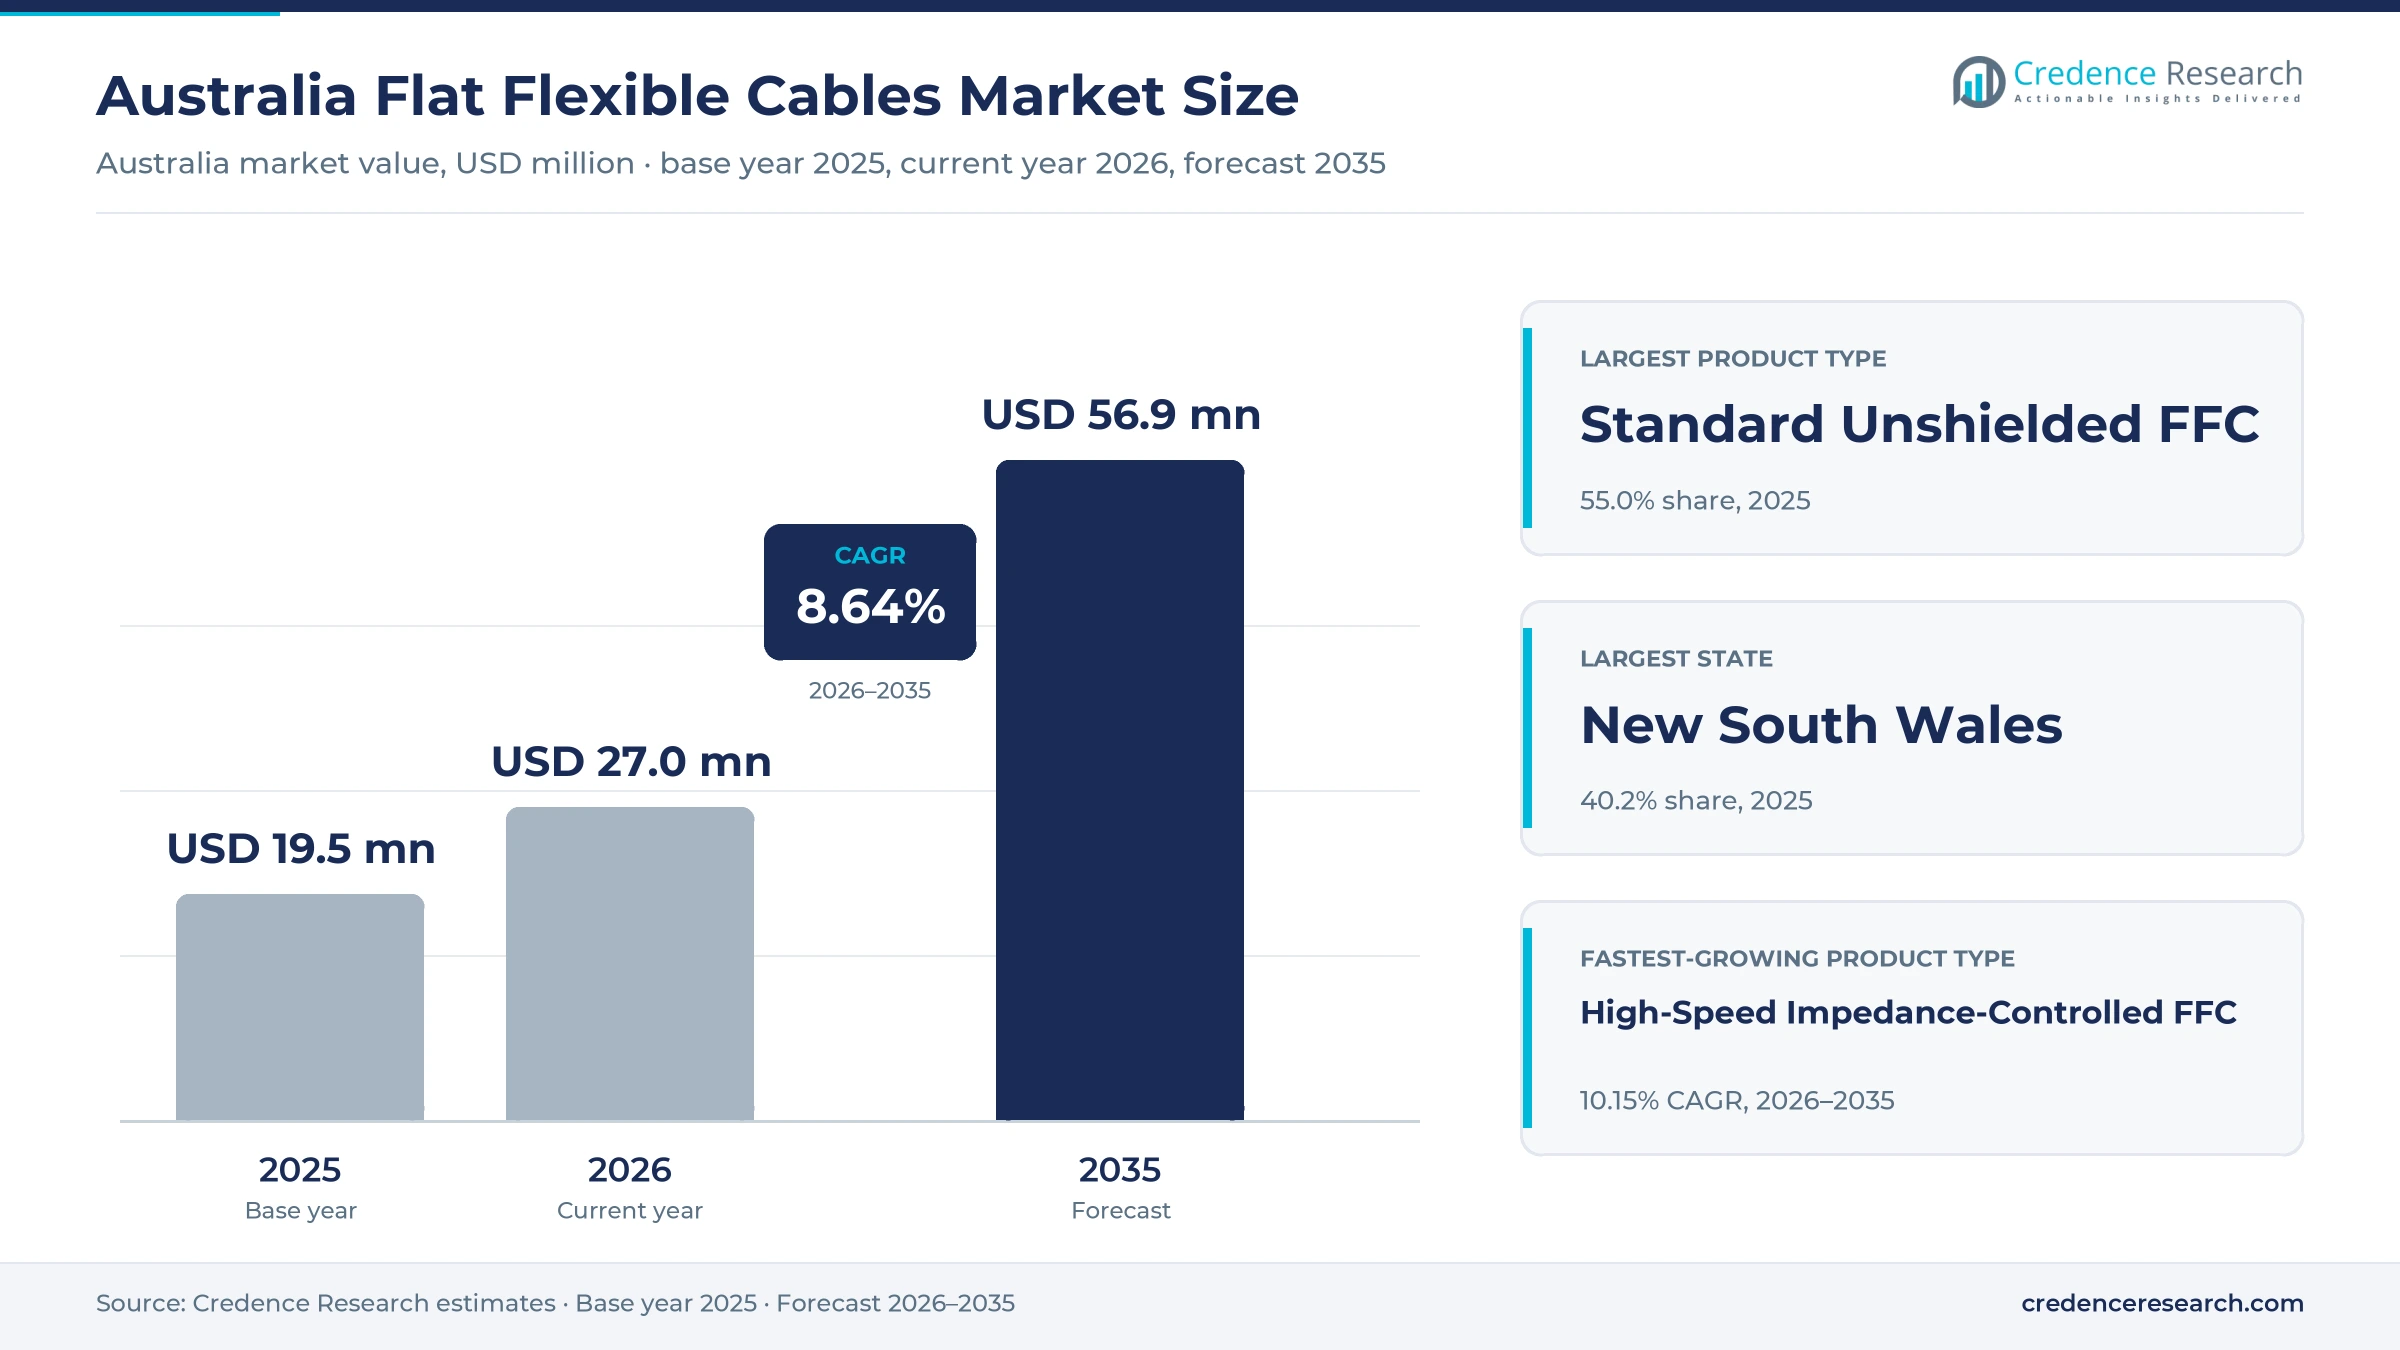
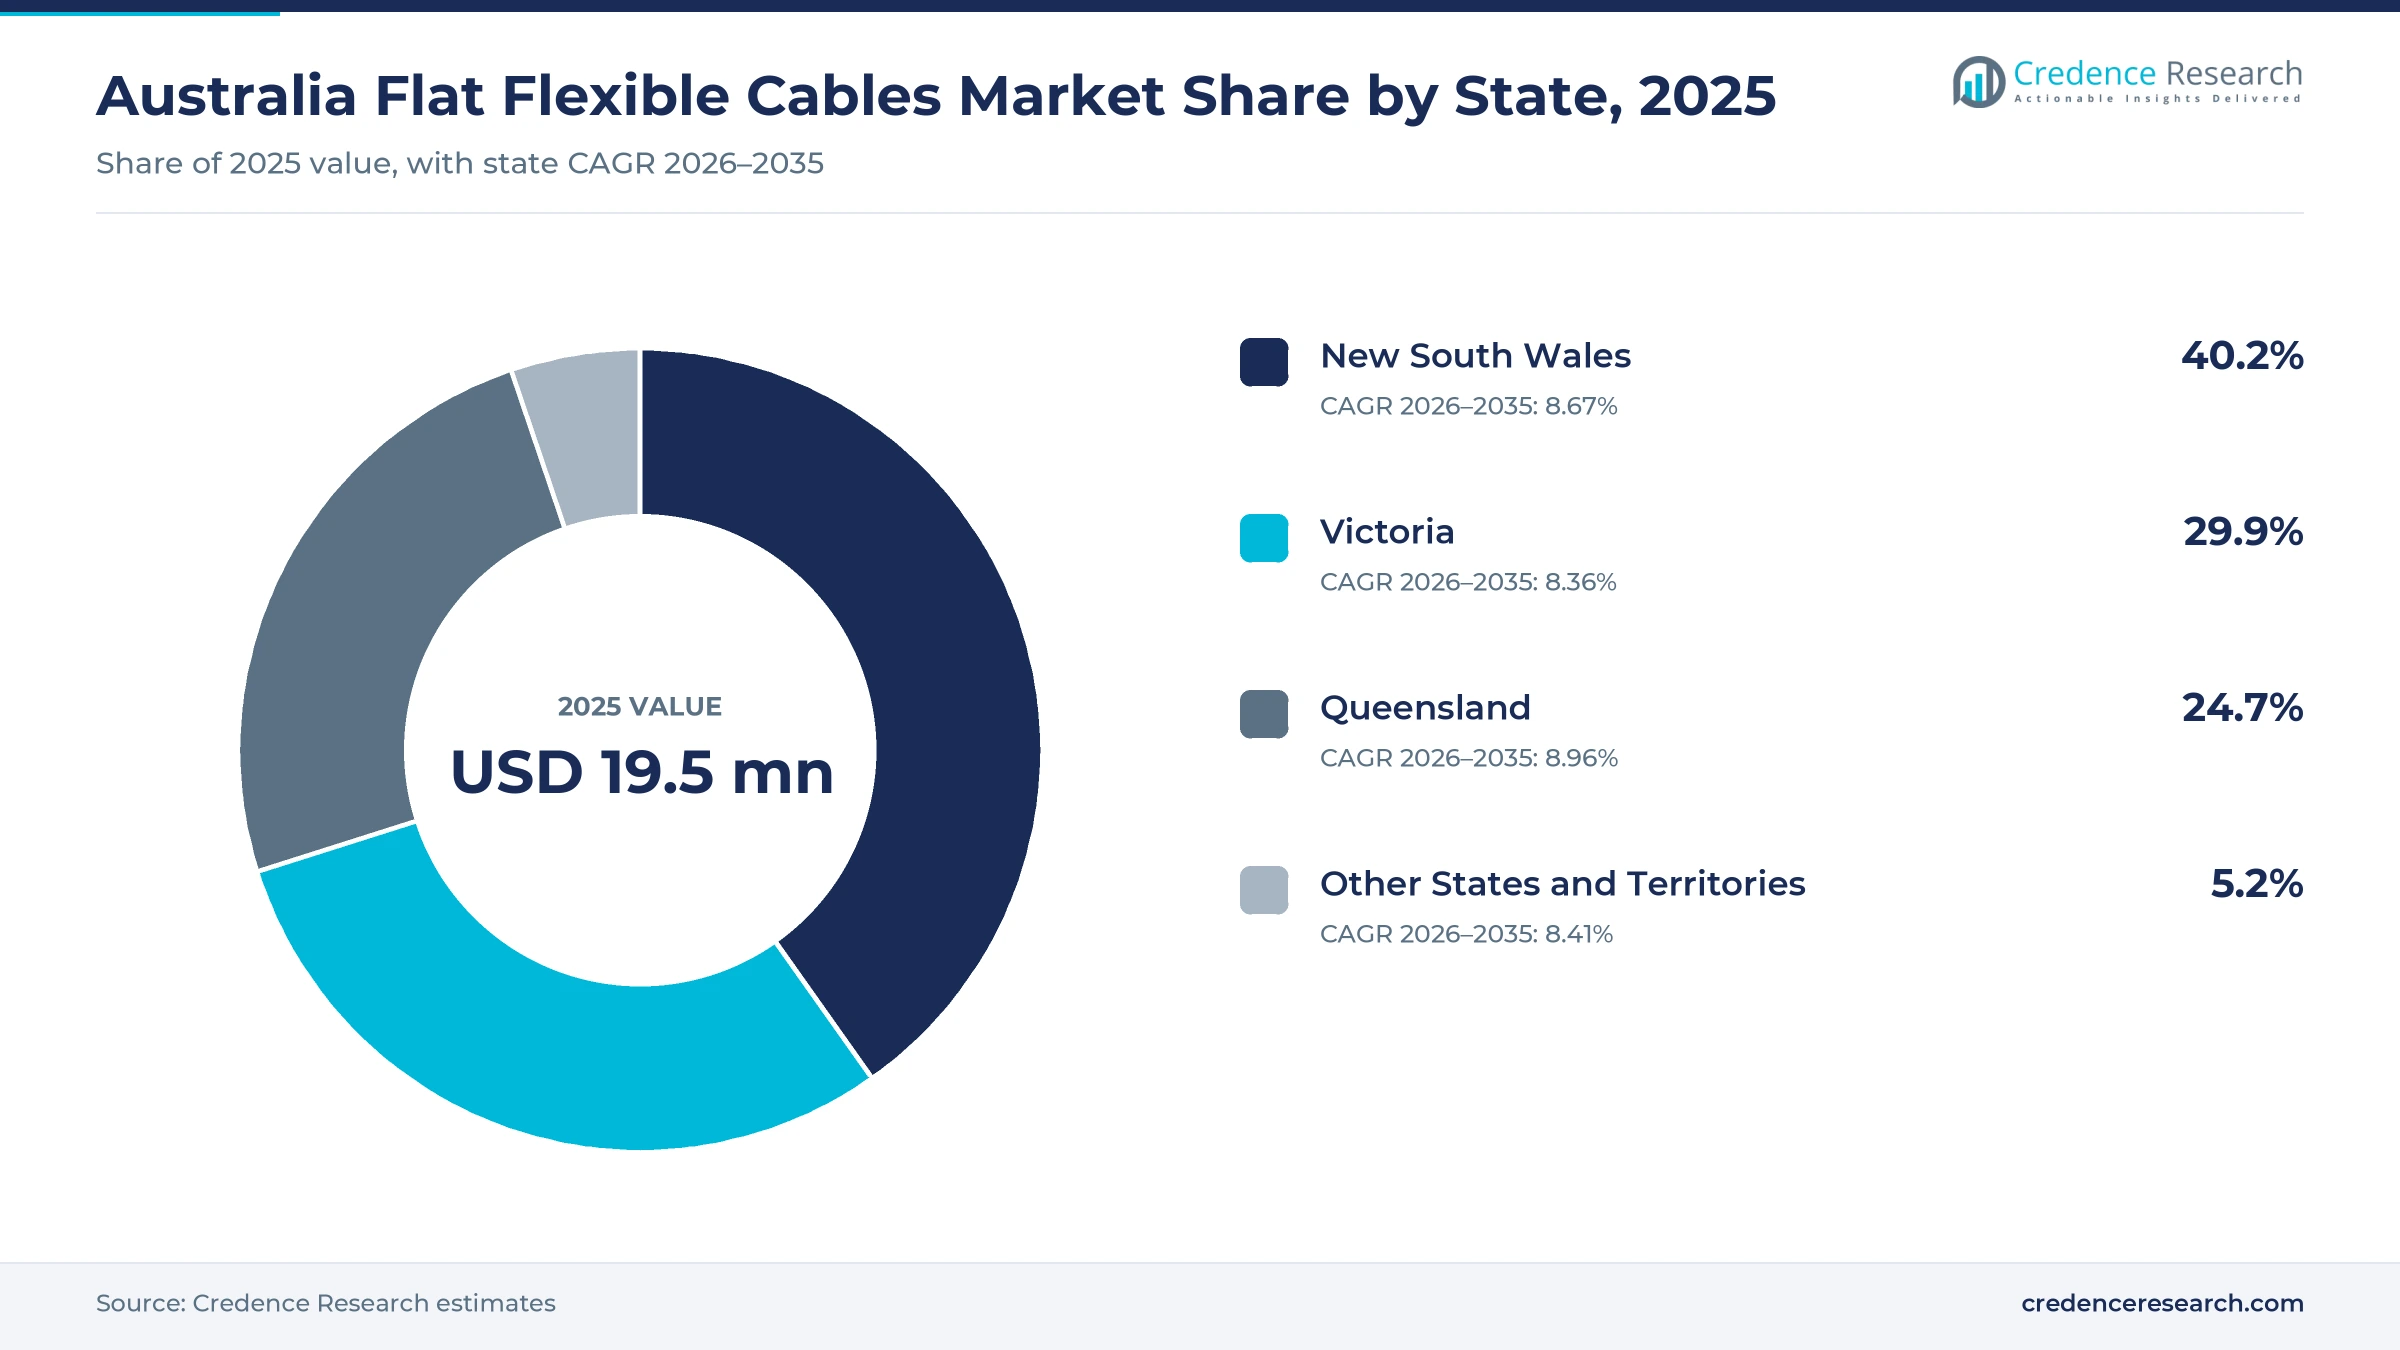
The Australia flat flexible cables market was valued at USD 19.5 million in 2025 and is projected to increase from USD 27.0 million in 2026 to USD 56.9 million by 2035, registering a CAGR of 8.64% during 2026–2035. Demand comes from equipment makers and contract assemblers that route display, camera and board signals through thin jumpers, from repair businesses that replace worn cables, and from research and prototype buyers working with single-board computers. Nearly all product is imported, so authorized catalog distributors handle most local orders. New South Wales held the largest state share, 40.2% in 2025, because it hosts the largest business research base in the country. Queensland is the fastest-growing state at 8.96% a year, helped by defense vehicle production at Redbank. Meanwhile, impedance-controlled cables with 90-ohm and 100-ohm options are moving into more industrial and vehicle designs, which raises the value of each connection.
Which cable types and buyers does the estimate cover?
Sales of flat flexible cables to buyers in Australia form the measured value, across standard unshielded, shielded and high-speed impedance-controlled types. The estimate covers laminated flat-conductor jumpers and simple etched interconnects bought by equipment makers, contract assemblers, repair businesses and research and prototype buyers.
The estimate excludes multilayer circuit boards, round ribbon cable, wire harnesses and the connectors mounted on boards. The value chain runs from overseas producers, led by suppliers in China and the United States, through global catalog distributors and local stockists to assembly lines, workshops and laboratories in Australian states.
Australia Flat Flexible Cables Market Insights
- The Australia flat flexible cables market was valued at USD 19.5 million in 2025 and is projected to reach USD 56.9 million by 2035, registering a CAGR of 8.64% during 2026–2035.
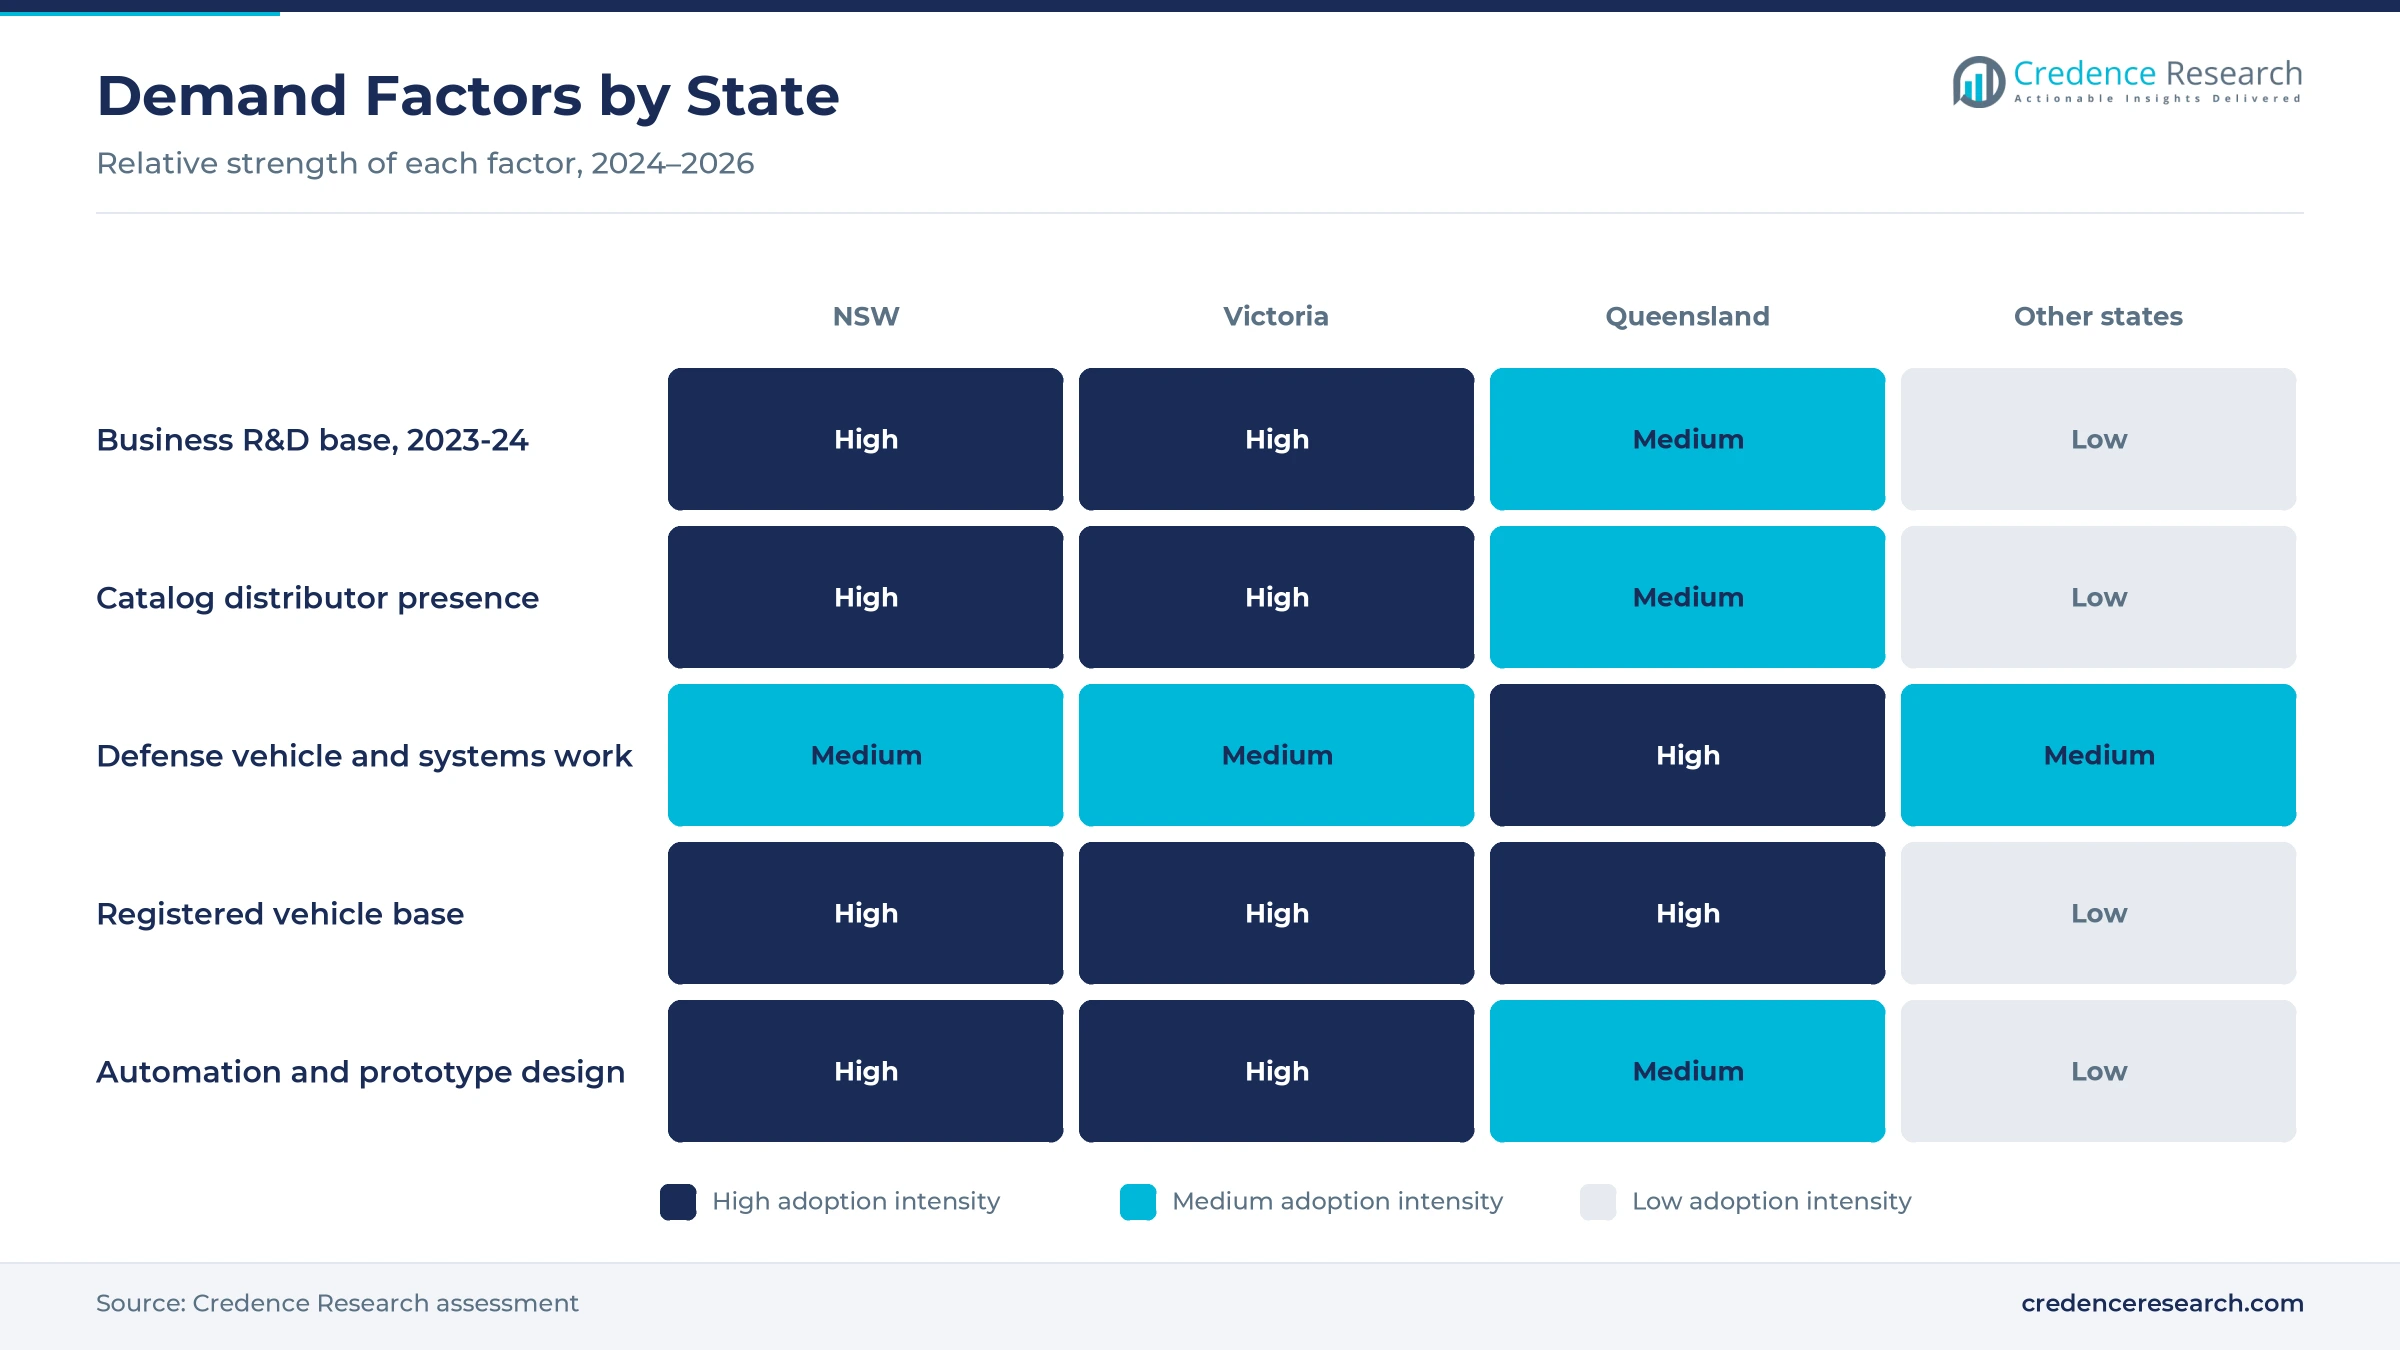
- New South Wales held 40.2% of 2025 value, as the state recorded A$9,630 million of business R&D in 2023-24, or 39% of the national total.
- Standard unshielded FFC led with 55.0% of 2025 value, because printers, keyboards, panels and repair work still use simple low-speed jumpers.
- Australia imported USD 460.27 million of fitted insulated conductors under HS 854442 in 2024, up from USD 418.21 million in 2023, and China supplied USD 231.12 million.
- Mouser Electronics opened a Melbourne customer service center in January 2024, its 12th office in Asia Pacific, which sharpened catalog competition for local engineers.
Standard FFC leads while impedance-controlled types gain
Why does standard unshielded FFC hold the largest share?
Based on product type, the market is categorized into standard unshielded FFC, shielded non-impedance-controlled FFC and high-speed impedance-controlled FFC. Standard Unshielded FFC led with a 55.0% share of 2025 value, because most low-speed board links and repair jobs need only a plain laminated jumper. High-Speed Impedance-Controlled FFC grows fastest at 10.15% a year, as camera, display and USB links move to controlled-impedance designs.
Which industries buy the most cables?
Based on end-use industry, the market is categorized into consumer electronics and computing, automotive electronics, industrial and defence electronics and medical electronics. Industrial and Defence Electronics led with a 38.0% share of 2025 value, because local design work centers on controllers, instruments and rugged equipment. Automotive Electronics grows fastest at 9.31% a year, as the electric vehicle fleet expands quickly.
How do display, camera and board links differ?
Based on application, the market is categorized into display interconnection, sensor and camera interconnection and other internal board interconnection. Display Interconnection led with a 44.0% share of 2025 value, because operator HMI display panels and instrument screens each need a jumper to the controller. Sensor and Camera Interconnection grows fastest at 9.39% a year, as machine vision spreads into automation projects.
How do Australian buyers source the cables?
Based on sales channel, the market is categorized into authorised component distribution, direct manufacturer procurement and specialist and independent supply. Authorised Component Distribution led with a 52.0% share of 2025 value, because catalog houses hold broad stock and ship small lots quickly. Authorised Component Distribution also grows fastest at 8.90% a year, as prototype and repair buyers order online in local currency.
| Segment Group | Leading Sub-segment | Share, 2025 | Fastest-growing Sub-segment | CAGR, 2026–2035 |
|---|---|---|---|---|
| By Product Type | Standard Unshielded FFC | 55.0% | High-Speed Impedance-Controlled FFC | 10.15% |
| By End-Use Industry | Industrial and Defence Electronics | 38.0% | Automotive Electronics | 9.31% |
| By Application | Display Interconnection | 44.0% | Sensor and Camera Interconnection | 9.39% |
| By Sales Channel | Authorised Component Distribution | 52.0% | Authorised Component Distribution | 8.90% |
Request a Free Sample
Fill in your details and we'll send you a free sample report.
- Sample data tables & charts
- Research methodology
Automation design-in and display links sustain demand
How does domestic automation design-in lift FFC orders?
Local machine builders and integrators specify thin jumpers when they design controllers, robot tools and operator panels that must fit tight enclosures. The federal National Robotics Strategy estimates that robotics and automation could add A$170 billion to A$600 billion a year to GDP by 2030. When the strategy was released, Industry Minister Ed Husic noted that Australia ranked 32nd for the take-up of industrial robots, which leaves room for adoption. Business R&D in electrical engineering rose from A$329 million in 2021-22 to A$604 million in 2023-24, according to the Australian Bureau of Statistics. As a result, industrial and defence electronics held a 38.0% share of 2025 value, the largest end-use group.
Why does compact display integration sustain demand?
Thin displays in instruments, kiosks, vehicles and handheld devices connect to their controller boards through FFC jumpers, so each new screen design adds a cable. Australia imported USD 42.83 million of flat panel display modules under HS 8524 in 2024, up from USD 33.71 million in 2023, according to UN Comtrade. Raspberry Pi launched its Touch Display 2 in November 2024 with a 1280 x 720 panel and two FFC cables in the box, a 15-way to 15-way and a 22-way to 15-way version. Molex lists LCD displays and infotainment systems among the main automotive uses for its FFC range. Consequently, display interconnection held a 44.0% share of 2025 value, the largest application.
Why are higher-specification signal paths raising value?
Camera, display and data links now run at speeds that need controlled impedance and shielding, which moves buyers toward higher-value cable types. Molex offers FFC jumpers with 90-ohm impedance for USB and 100-ohm impedance for HDMI, and its shielded versions use first and last pin grounding to limit interference. Elektor product listings show that the Raspberry Pi 5 uses 22-way, 0.5 mm pitch connectors for its camera and display ports, so older 15-way cables need adapters. Business R&D in electronics, sensors and digital hardware rose from A$476 million in 2021-22 to A$522 million in 2023-24, according to ABS data. As a result, high-speed impedance-controlled FFC grows at 10.15% a year, the fastest product type.
How does defense industry policy support rugged demand?
Defense programs need rugged, shielded interconnects for vehicles, sensors and autonomous systems, and local production keeps more of that work onshore. The Defence Industry Development Strategy, released in February 2024, set seven Sovereign Defence Industrial Priorities, including autonomous systems and battlespace awareness. The same release lifted defense industry grant programs to A$183.8 million and stated that the sector supports more than 100,000 Australian jobs. Rheinmetall builds Boxer combat reconnaissance vehicles at Redbank under the A$5.2 billion LAND 400 Phase 2 program, according to Queensland Treasury. In turn, shielded FFC keeps a steady place in rugged equipment, and Queensland becomes the fastest-growing state as defense vehicle output rises.
Faster signal paths and kit-based design reshape buying
Is kit-based prototyping shifting small-lot buying?
Engineers and students increasingly design around single-board computers and display kits, which shifts FFC purchases toward small lots bought online. Avnet's element14 listed the Raspberry Pi 5 for Australian buyers at launch, which put kit-based design within easy reach of local engineers. Raspberry Pi has said its Touch Display 2 will stay in production until at least January 2030, which gives designers a stable cable format for years. RS Australia lists a 76 mm, 33-circuit Molex 15020 series flat cable at about A$7.74 a unit for five to 60 units, with free delivery on orders over A$80 excluding GST. As a result, authorised component distribution grows at 8.90% a year, the fastest sales channel.
Why is electric vehicle growth raising automotive interest?
Vehicle electronics are a rising source of FFC demand, because screens, cameras and battery systems in new models use thin internal links. Australia had 22,305,347 registered motor vehicles on Jan. 31, 2025, up 2.6% in a year, according to the Bureau of Infrastructure and Transport Research Economics. Registered battery electric and fuel cell vehicles reached about 259,690, an increase of 54.6% from January 2024. The Department of Infrastructure said the New Vehicle Efficiency Standard would start on Jan. 1, 2025, with credits and penalties from July 1, 2025. Consequently, automotive electronics grows at 9.31% a year, the fastest end-use group, as repairers and installers order more replacement jumpers.
Can camera and sensor links open a design-in opening?
Machine vision and sensing create a clear opportunity for suppliers that can support camera links from prototype to production. Molex markets Premo-Flex LVDS jumpers with 15 to 80 conductors for cameras, displays and medical monitoring devices. Designers moving from development boards to MIPI camera modules often keep the same fine-pitch jumper format in production equipment. The National Robotics Strategy channels support through the National Reconstruction Fund, the Industry Growth Program and the Advanced Strategic Capabilities Accelerator. Business R&D in manufacturing engineering rose from A$864 million in 2021-22 to A$1,131 million in 2023-24, according to ABS data. Therefore, sensor and camera interconnection grows at 9.39% a year, the fastest application.
Will local stocking of custom lengths create an opening?
Contract assemblers want custom lengths and pin counts on short notice, which gives local stockists and cable assemblers an opportunity. Mouser serves customers in 223 countries and territories from facilities in the Dallas, Texas, area, so its Australian orders still depend on air freight. RS Australia stocks more than 50,000 products for next-day delivery to more than 100,000 customers in Australia and New Zealand. Amphenol Australia runs its sales, marketing and engineering center from Melbourne, and its local range includes custom cable assemblies. Short-run circuit board assembly lines value cut-to-length service over the lowest unit price. Consequently, authorised component distribution keeps the largest channel share at 52.0% of 2025 value.
Import reliance and small volumes limit local scale
How does import reliance expose buyers to supply swings?
Australia imported USD 460.27 million of fitted insulated conductors under HS 854442 in 2024, according to UN Comtrade, and China supplied USD 231.12 million of that value. The United States followed with USD 70.73 million, while exports reached only USD 65.36 million. This dependence exposes buyers to freight delays, exchange rate swings and supplier allocation, so many assemblers hold extra stock or qualify a second source for critical jumpers.
Why do small volumes limit local manufacturing?
Australian electronics output is spread across many small production runs, which makes local cable lamination hard to justify. Business R&D in manufacturing slipped from A$5,203 million in 2021-22 to A$5,047 million in 2023-24, according to the ABS. Information and communication services also replaced manufacturing as the top research objective in 2023-24. As a result, buyers rely on imported stock and accept longer lead times for nonstandard lengths and pin counts.
How do fine pitches and connector mismatches raise design risk?
Each cable must match the pitch, contact side and length of its board-mounted connector, and small errors stop a build. Molex offers off-the-shelf pitches from 0.25 mm to 1.25 mm, which widens the room for ordering mistakes. Elektor warns that Raspberry Pi 5 camera cables should not be used with displays, or the reverse. Designers therefore add checks and samples before volume orders, which slows design cycles.
Does offshore catalog competition squeeze local margins?
Global catalog houses now quote Australian customers in local currency, which narrows the margin that local stockists can charge. Mouser lists more than 6.8 million products from more than 1,200 manufacturer brands and serves local buyers from Melbourne. Under ATO guidance, goods valued at or below A$1,000 are non-taxable importations at the border. Smaller specialist suppliers therefore compete on custom work, technical advice and same-day help rather than on catalog price.
New South Wales leads as Queensland gains defense work
| State | Value, 2025 (USD million) | Share, 2025 | CAGR, 2026–2035 |
|---|---|---|---|
| New South Wales | 7.8 | 40.2% | 8.67% |
| Victoria | 5.8 | 29.9% | 8.36% |
| Queensland | 4.8 | 24.7% | 8.96% |
| Other States and Territories | 1.0 | 5.2% | 8.41% |
Why does New South Wales lead cable demand?
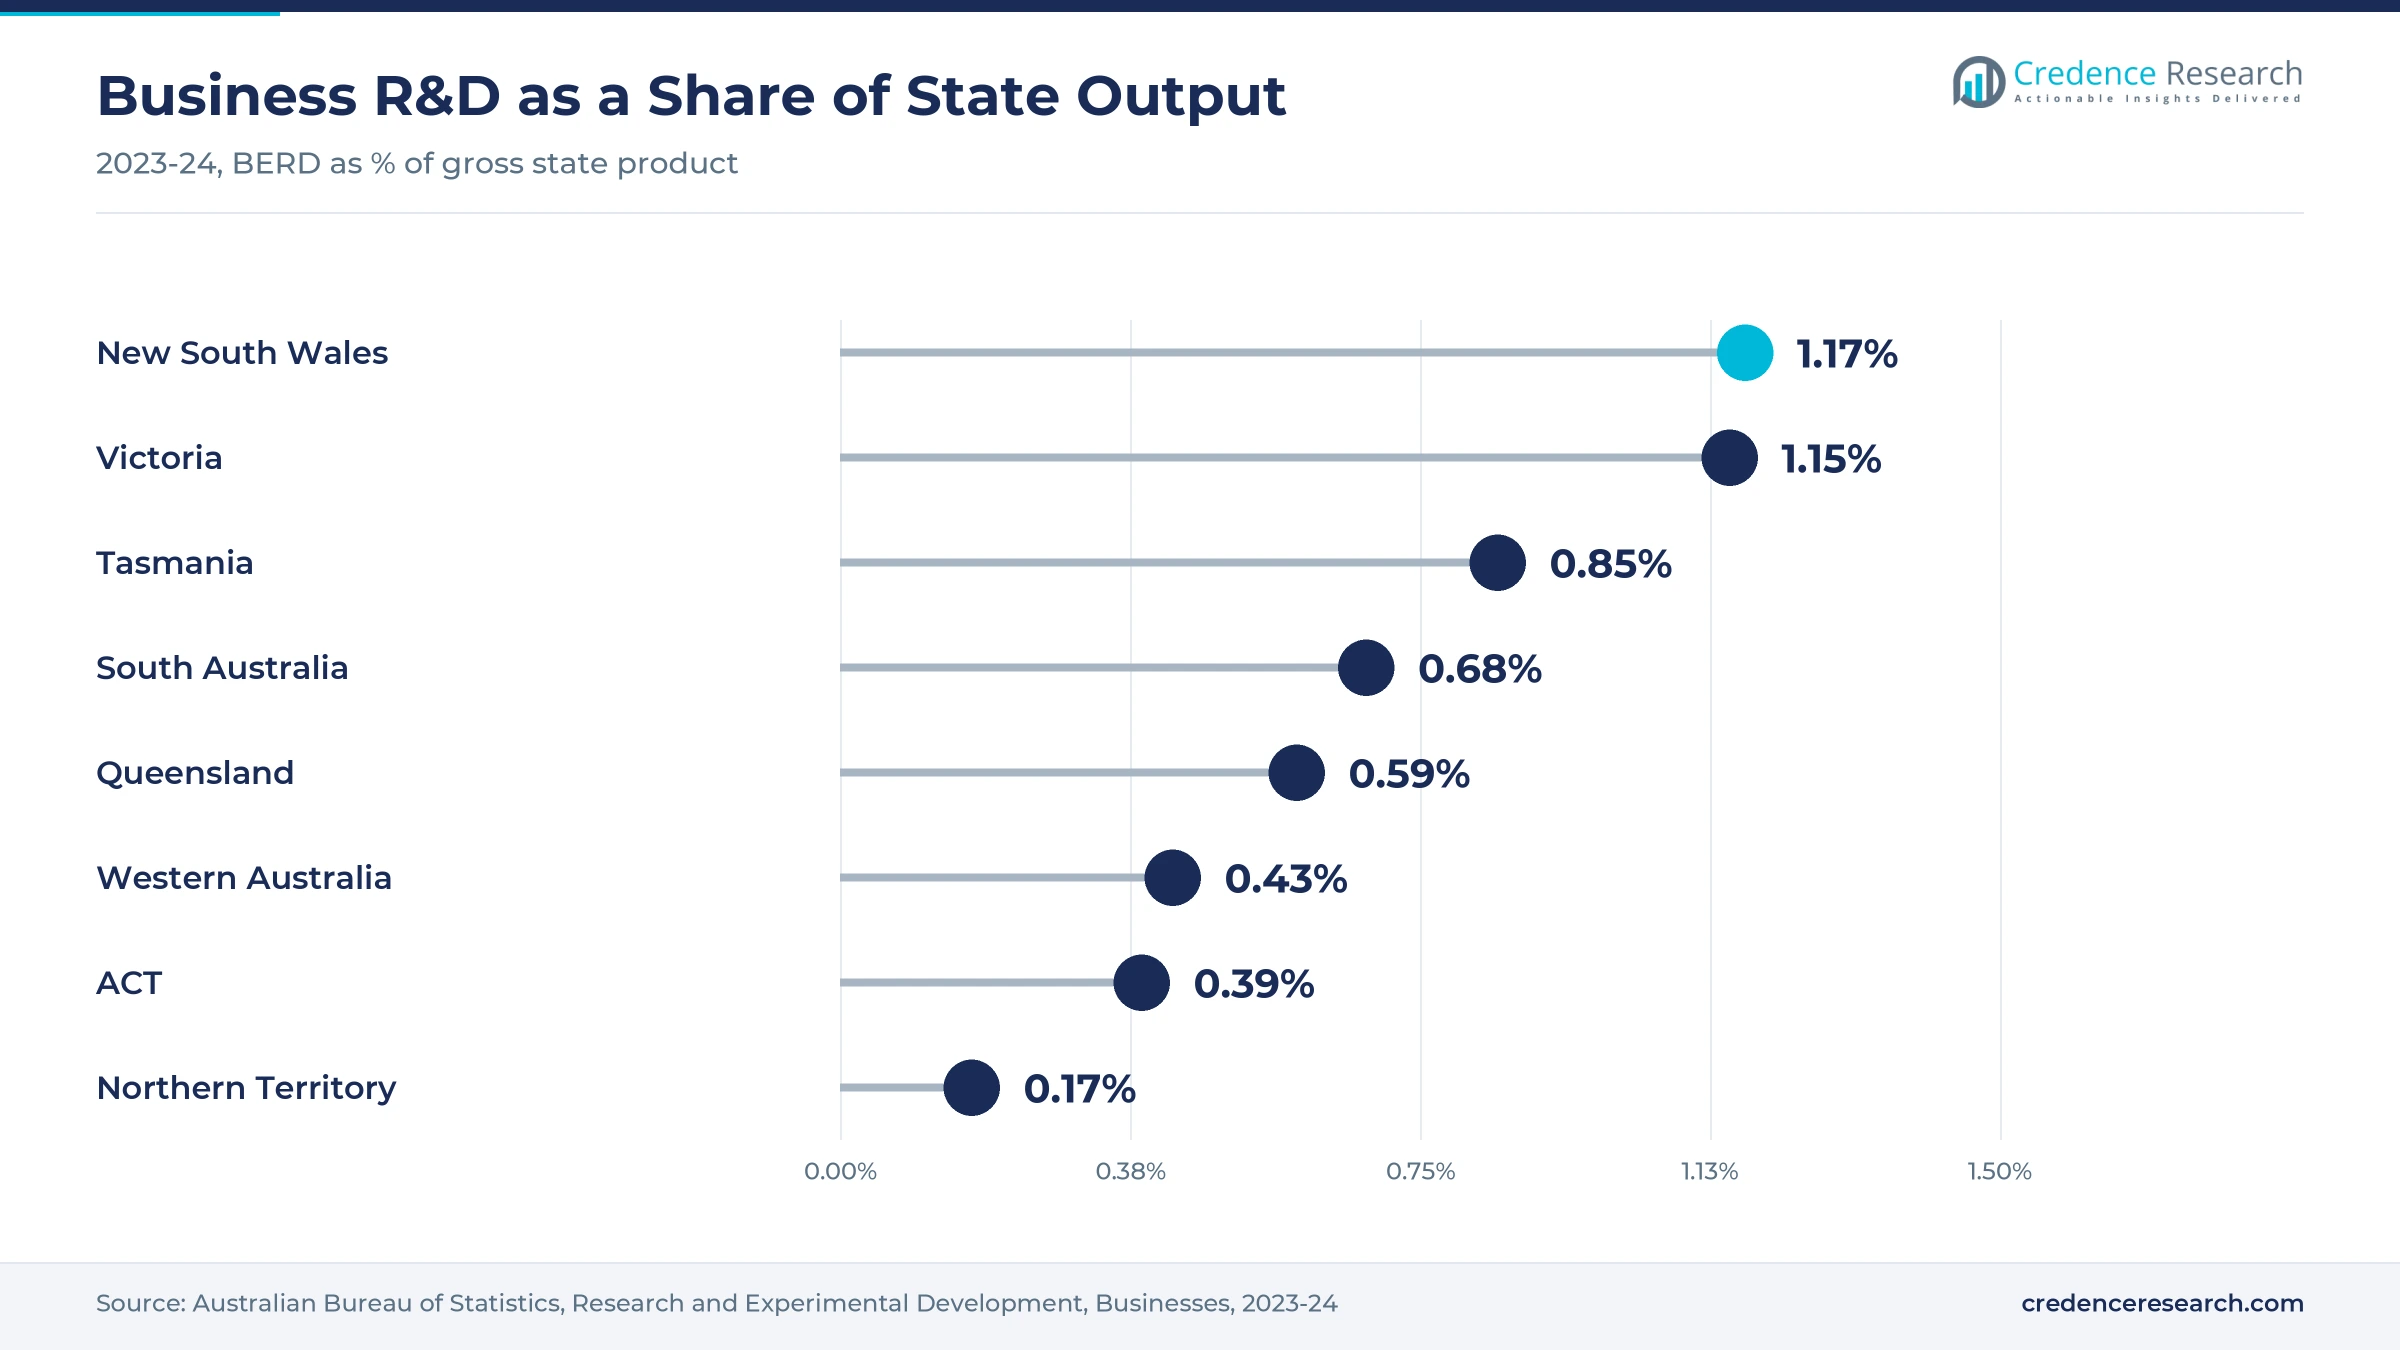
New South Wales held a 40.2% share of 2025 value and grows at 8.67% a year. The state recorded A$9,630 million of business R&D in 2023-24, or 39% of the national total, and the largest increase of any state, up A$2,130 million. Its business R&D equaled 1.17% of gross state product, the highest ratio in Australia. RS Australia operates from Smithfield in New South Wales, which gives local designers and repairers next-day access to stock.
How do Melbourne distributors support Victorian buyers?
Victoria held a 29.9% share of 2025 value and grows at 8.36% a year. The state recorded A$6,953 million of business R&D in 2023-24, or 28% of the national total, equal to 1.15% of gross state product. Mouser chose Melbourne for its customer service center in January 2024, citing the local OEM and contract manufacturing base. Amphenol Australia also runs its head office, sales and engineering work from Melbourne, close to Victorian buyers.
Why does Queensland grow fastest among the states?
Queensland held a 24.7% share of 2025 value and grows at 8.96% a year, the fastest state. Rheinmetall builds Boxer vehicles for the Australian Army at its Redbank facility, and in March 2024 the federal government confirmed an A$1 billion agreement to export at least 100 Boxer vehicles to Germany from that site. Queensland had 4,892,464 registered vehicles in January 2025, which adds steady repair demand for vehicle electronics.
How do the smaller states and territories add demand?
Other States and Territories held a 5.2% share of 2025 value and grow at 8.41% a year. South Australia recorded the largest rise in research intensity, with business R&D up 0.16 percentage points to 0.68% of gross state product. Tasmania reached 0.85%, while Western Australia stood at 0.43% and the Northern Territory at 0.17%. New South Wales, Victoria and Queensland held about 76% of registered vehicles in January 2025, which keeps demand thinner elsewhere.
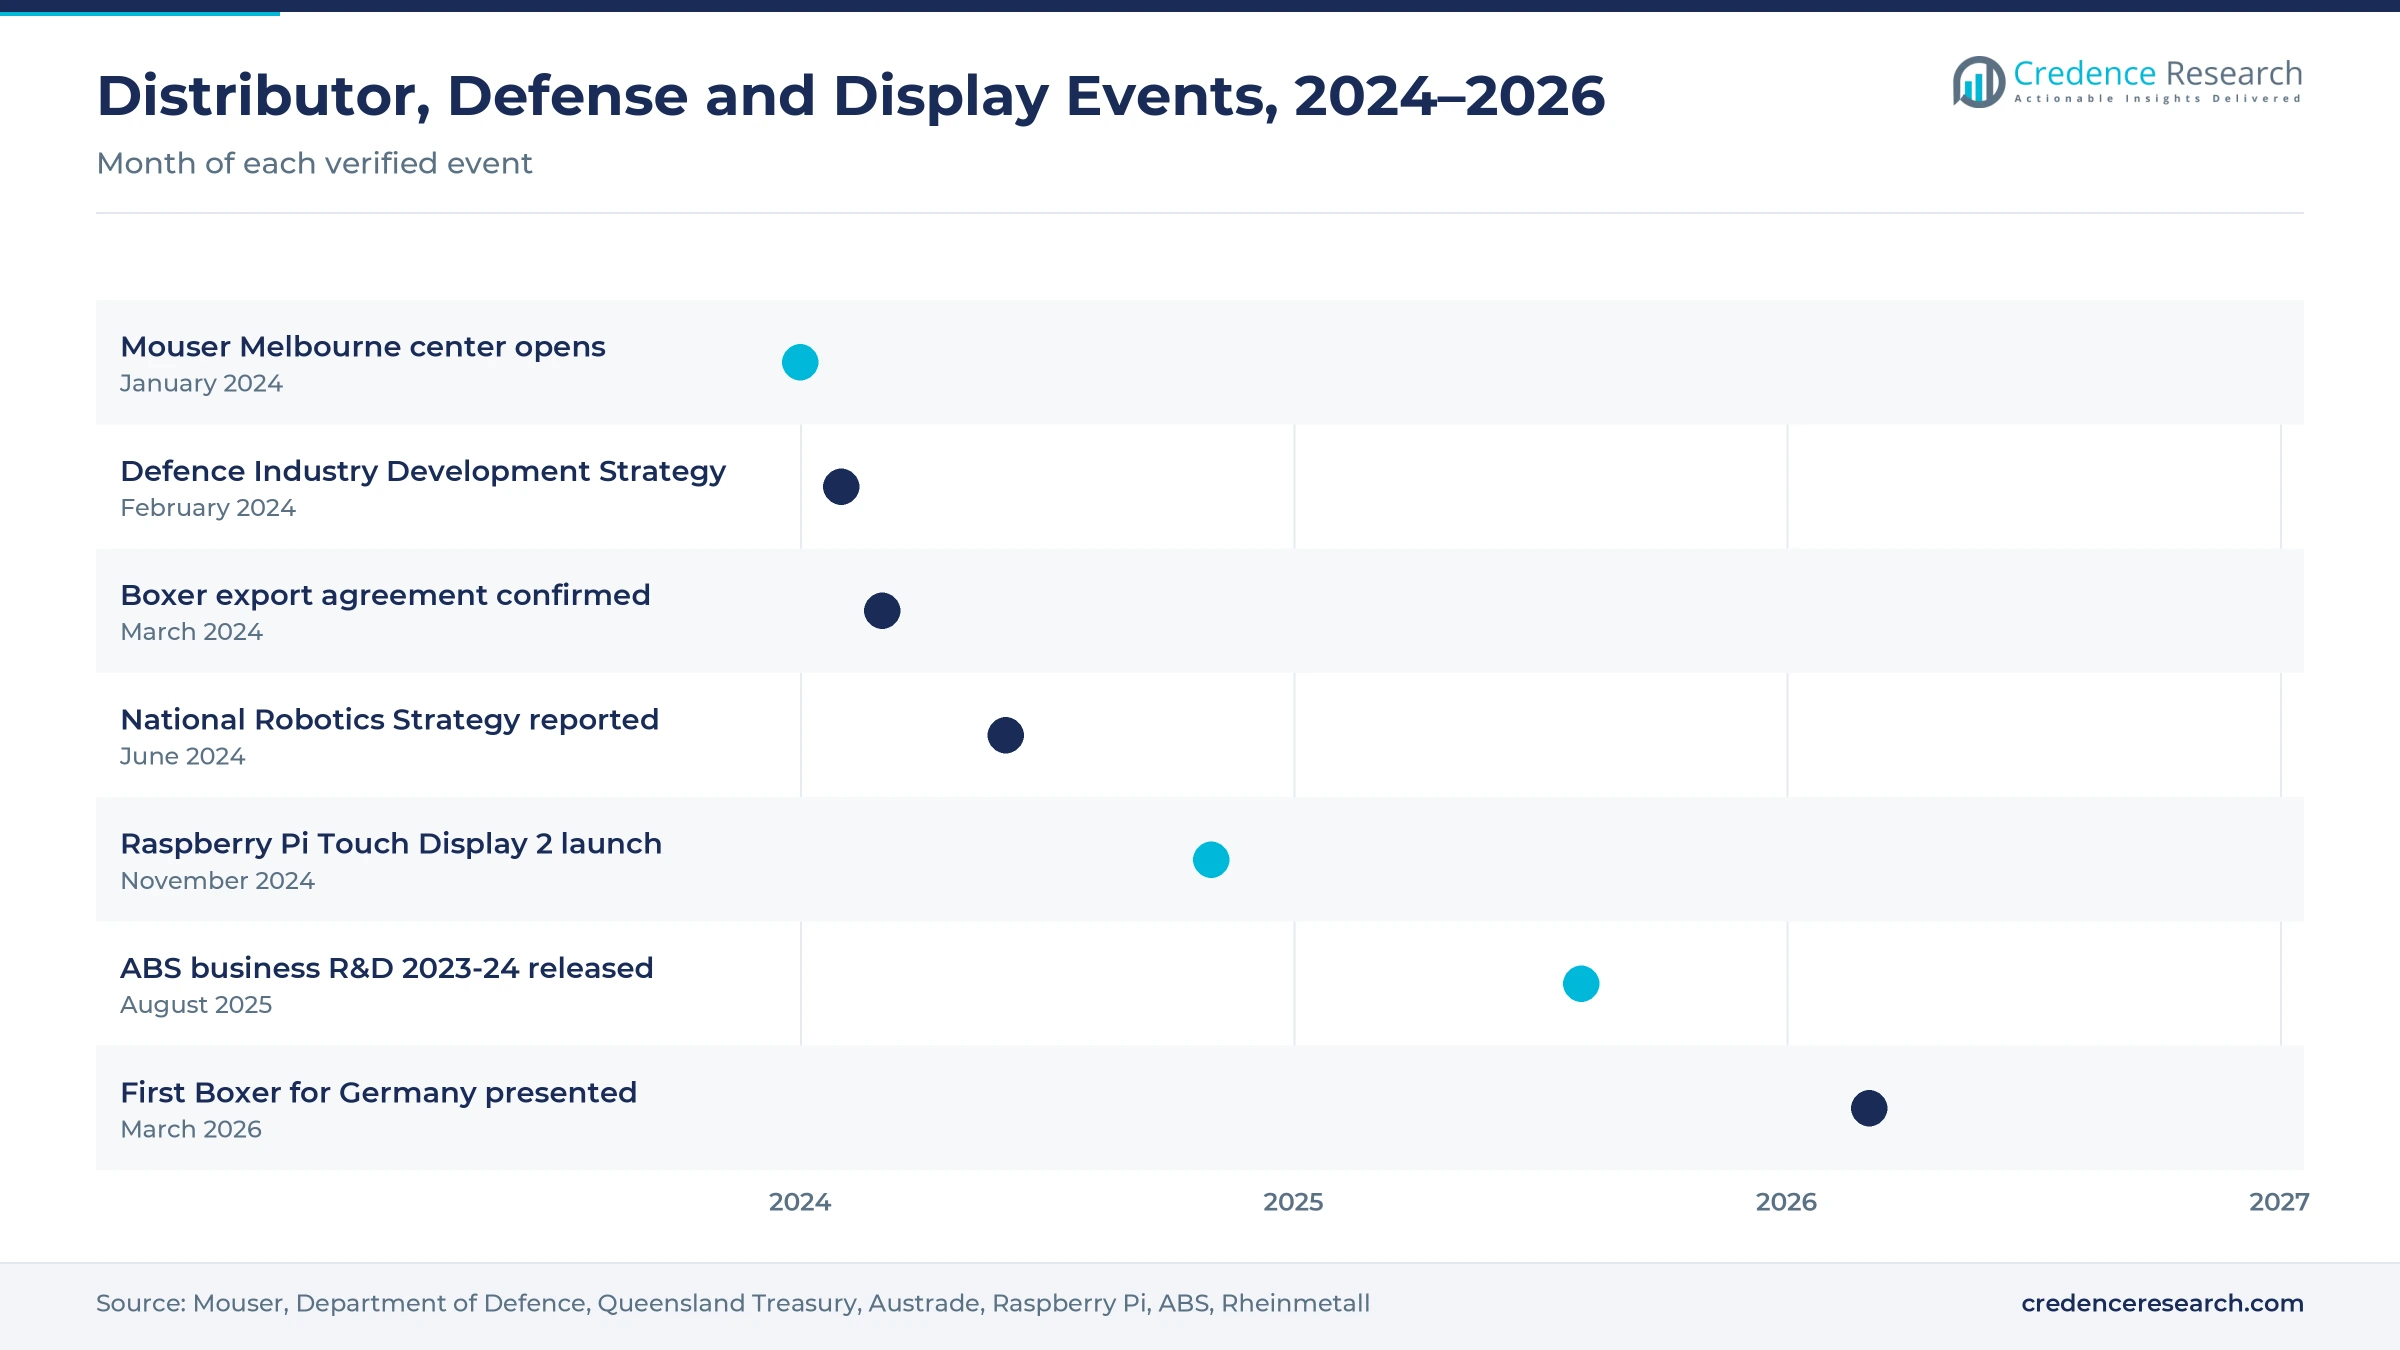
Distributor, defense and display milestones, 2024–2026
| Development | Status and market relevance |
|---|---|
| In January 2024, Mouser Electronics opened a customer service center in Melbourne, its 12th office in Asia Pacific, serving buyers in local currency. | Raises catalog competition for small-lot FFC orders |
| In February 2024, the federal government released the Defence Industry Development Strategy with seven Sovereign Defence Industrial Priorities. | Supports rugged and shielded interconnect demand |
| In August 2025, Raspberry Pi released a 5-inch Touch Display 2 that links to the board over the Display Serial Interface with an included flat-flex cable. | Adds another kit display that ships with a jumper in the box |
| In August 2025, the ABS released 2023-24 business R&D data showing A$24,410 million of spending, up 18% from 2021-22. | Confirms a larger research and design base for local buyers |
| In March 2026, Rheinmetall Defence Australia presented the first Boxer heavy weapon carrier for Germany at its Redbank facility in Queensland. | Starts export production that adds defense electronics work in Queensland |
Pitch, shielding and impedance define product choices
- Pitch selection ranges from 0.25 mm to 1.25 mm in Molex off-the-shelf ranges, and finer pitches fit more circuits into a smaller footprint.
- Impedance control sets 90-ohm or 100-ohm differential pairs for USB and HDMI links, which keeps camera and display signals clean.
- EMI shielding combines shielding with first and last pin grounding to limit interference in noisy industrial and vehicle settings.
- High-temperature insulation extends rated operation to 125 C for jumpers used in harsh temperatures or conditions.
Need a Custom Version of This Report?
Tailor the scope, geography, or segments to your exact requirements.
- Custom geography or segment scope
- Direct access to our analyst team
Catalog distributors compete on stock, range and speed
Competition is led by global catalog distributors and connector makers, because nearly all flat flexible cables sold in Australia are imported. element14 Pty Ltd, part of Avnet, serves Australian engineers and listed the Raspberry Pi 5 for the local market at launch. RS Australia stocks more than 50,000 products from its Sydney distribution base and lists Molex FFC jumpers with free delivery above A$80 excluding GST. Mouser Electronics opened a Melbourne customer service center in January 2024 and ships from Texas, while DigiKey supports engineers in Australia and New Zealand through its local storefront and digital tools. Amphenol runs Amphenol Australia from Melbourne with sales, marketing and engineering staff. Suppliers compete on stock depth, delivery speed, technical data and the ability to supply matching connectors with each cable.
Companies profiled and their roles in this market
| Company | Type | Role in the market |
|---|---|---|
| element14 Australia | Authorised catalog distributor | element14 Pty Ltd, an Avnet company, sells components and Raspberry Pi products to Australian buyers |
| RS Australia | Authorised catalog distributor | Smithfield, NSW base stocking 50,000+ products, including Molex 15020 series FFC jumpers |
| Mouser Electronics | Global catalog distributor | Melbourne customer service center opened in January 2024, local currency service |
| DigiKey | Global catalog distributor | Supports Australian and New Zealand engineers with a local storefront and digital tools |
| Amphenol | Interconnect manufacturer | Amphenol Australia head office, sales and engineering center in Melbourne |
Credence Research view on an import-led component niche
Credence Research's view is that the Australia flat flexible cables market will grow faster than general component demand, because local design work is shifting toward automation, vision and rugged equipment. Standard jumpers keep the volume, while impedance-controlled and shielded types lift the value of each design. Catalog distributors with local stock and AUD pricing hold a clear advantage over direct import for most buyers. However, reliance on Chinese supply and small production runs will keep the market import-led through 2035.
Trade data, state statistics and catalog checks used
The report uses 2025 as the base year for every value, share and growth rate. Market values come from the Credence Research model, and state growth rates, segment splits and segment growth rates are Credence Research estimates. Sources used are UN Comtrade import data, ABS business R&D statistics, BITRE vehicle statistics, federal policy releases, company announcements and distributor catalog listings, and no interviews or surveys were used.
Higher-speed links and local design steer growth to 2035
Spending is expected to reach USD 56.9 million by 2035, an 8.64% CAGR during 2026–2035, as automation, display and camera designs add more connections per product. Growth should favor impedance-controlled and shielded cables, because faster data links and noisy industrial settings need cleaner signals. Defense vehicle work in Queensland and electric vehicle repair should add steady demand, while catalog distributors keep most small-lot orders. A slowdown in business research or tighter supply from China would slow growth, whereas new local assembly programs would lift it.
Frequently Asked Questions
How big is the Australia flat flexible cables market?
Which state leads spending in Australia?
Which product type holds the largest share?
Which state grows fastest through 2035?
Which application uses the most cables?
How do Australian buyers usually purchase these cables?
Which companies compete in this market?
What are the main risks for suppliers?
Table of Content
Chapter 1 Market Segmentation
- 1.1 Segmentation Framework
- 1.1.1 Product and Service Classification
- 1.1.2 Application and End-Use Classification
- 1.1.3 Technology and Solution Classification
- 1.1.4 Customer and Distribution Channel Classification
- 1.1.5 Geographic Segmentation
- 1.1.6 Market Segment Definitions and Boundaries
- 1.2 By Product Type
- 1.2.1 Standard Unshielded FFC
- 1.2.2 Shielded Non-Impedance-Controlled FFC
- 1.2.3 High-Speed Impedance-Controlled FFC
- 1.3 By End-Use Industry
- 1.3.1 Industrial and Defence Electronics
- 1.3.2 Consumer Electronics and Computing
- 1.3.3 Automotive Electronics
- 1.3.4 Medical Electronics
- 1.4 By Application
- 1.4.1 Display Interconnection
- 1.4.2 Sensor and Camera Interconnection
- 1.4.3 Other Internal Board Interconnection
- 1.5 By Sales Channel
- 1.5.1 Authorised Component Distribution
- 1.5.2 Direct Manufacturer Procurement
- 1.5.3 Specialist and Independent Supply
- 1.6 By State
- 1.6.1 New South Wales
- 1.6.2 Victoria
- 1.6.3 Queensland
- 1.6.4 Other States and Territories
Chapter 2 Introduction
- 2.1 Report Objectives and Scope
- 2.2 Product Definition and Industry Terminology
- 2.3 Market Inclusions and Exclusions
- 2.4 Research Process
- 2.4.1 Primary Research and Expert Interviews
- 2.4.2 Secondary Research and Source Review
- 2.4.3 Top-Down and Bottom-Up Estimation
- 2.4.4 Data Triangulation and Verification
- 2.5 Market Size Measurement Basis
- 2.5.1 2025: USD 19.5 million → 2035: USD 56.9 million
- 2.6 Historical and Forecast Reference Periods
- 2.6.1 Historical Period: 2018-2025
- 2.6.2 Base Year: 2025
- 2.6.3 Forecast Period: 2025-2035
- 2.7 Research Assumptions and Limitations
Chapter 3 Executive Summary
- 3.1 Market Snapshot and Key Findings
- 3.2 Base-Year Market Size, 2025
- 3.3 Forecast Market Size, 2035
- 3.4 Revenue and Volume Growth Outlook
- 3.5 Key Demand and Supply Indicators
- 3.6 Leading Market Segments
- 3.7 Fastest-Growing Market Opportunities
- 3.8 Regional Performance Highlights
- 3.9 Technology and Industry Transformation
- 3.10 Competitive Landscape Summary
- 3.11 Analyst View and Strategic Implications
Chapter 4 Australia Flat Flexible Cables Market Trends and Developments
- 4.1 Historical Industry Development, 2018-2025
- 4.2 Recent Market Trends and Developments
- 4.3 Demand and Customer Behavior Trends
- 4.4 Technology and Product Innovation
- 4.5 Artificial Intelligence, Automation and Digitalization
- 4.6 Local Manufacturing and Supply Chain Realignment
- 4.7 Industry Partnerships, Mergers and Acquisitions
- 4.8 Sustainability and Circular Economy Developments
- 4.9 Government and Private Sector Investment Trends
- 4.10 Emerging Business Models and Commercialization
- 4.11 Industry Developments and Announcements
Chapter 5 Australia Flat Flexible Cables Market Production, Supply and Demand Analysis
- 5.1 Demand Trend and Consumption Analysis, 2018-2025
- 5.2 Demand Forecast, 2025-2035
- 5.3 Production and Output Trend, 2018-2025
- 5.4 Production and Output Forecast, 2025-2035
- 5.5 Installed Capacity and Capacity Utilization
- 5.6 Company-Wise Production Plants and Statistics
- 5.6.1 Installed Production Capacity
- 5.6.2 Actual Production
- 5.6.3 Planned Capacity and Expansion Targets
- 5.7 Supply Chain Structure and Procurement Trends
- 5.8 Supply-Demand Gap and Bottlenecks
- 5.9 Import Dependence and Sourcing Structure
- 5.10 Contract Manufacturing and Outsourcing
- 5.11 Regional Supply and Demand Concentration
Chapter 6 Australia Flat Flexible Cables Market Pricing Analysis
- 6.1 Pricing Structure and Measurement
- 6.2 Historical Pricing Trends, 2018-2025
- 6.3 Pricing Outlook, 2025-2035
- 6.4 Average Selling Price and Unit Economics
- 6.5 Pricing by Product and Market Segment
- 6.6 Geographic Pricing Differences
- 6.7 Key Input, Energy, Labor and Logistics Costs
- 6.8 Contract Pricing and Purchasing Models
- 6.9 Pricing Sensitivity and Competitive Positioning
- 6.10 Price, Margin and Profitability Implications
Chapter 7 Australia Flat Flexible Cables Market Dynamics
- 7.1 Market Growth Drivers
- 7.1.1 Demand-Side Drivers
- 7.1.2 Technology and Innovation Drivers
- 7.1.3 Infrastructure and Investment Drivers
- 7.1.4 Regulatory and Policy Drivers
- 7.2 Market Restraints
- 7.2.1 Cost and Affordability Constraints
- 7.2.2 Technology and Adoption Barriers
- 7.2.3 Supply Chain and Operational Constraints
- 7.3 Market Challenges
- 7.3.1 Competitive Pressure and Margin Erosion
- 7.3.2 Skills, Infrastructure and Implementation Gaps
- 7.4 Emerging Market Opportunities
- 7.5 Market Dynamics Impact and Time-Horizon Assessment
Chapter 8 Australia Flat Flexible Cables Value Chain Analysis
- 8.1 Industry Value Chain Overview
- 8.2 Upstream Suppliers and Critical Inputs
- 8.3 Technology and Component Providers
- 8.4 Manufacturing or Service Delivery
- 8.5 Distribution, Channel Partners and Integrators
- 8.6 Downstream Applications and End Users
- 8.7 Value Addition and Profit Pools
- 8.8 Vertical Integration and Outsourcing
- 8.9 Supplier Concentration and Risk
- 8.10 Supply Chain Localization and Resilience
Chapter 9 Australia Flat Flexible Cables Market Regulations and Policies
- 9.1 Relevant Laws, Standards and Compliance Frameworks
- 9.2 Product, Service, Safety and Quality Requirements
- 9.3 Government Policies, Incentives and Subsidies
- 9.4 Imports, Exports and Trade Barriers
- 9.5 Public Procurement and Local Content Requirements
- 9.6 Environmental and Sustainability Compliance
- 9.7 Upcoming Policy Changes and Market Implications
Chapter 10 Australia Flat Flexible Cables Market Hotspots and Opportunities
- 10.1 Market Opportunity Mapping and Growth Hotspots
- 10.2 High-Growth Applications and Customer Groups
- 10.3 Underserved Markets and White-Space Opportunities
- 10.4 Emerging Technology and Product Opportunities
- 10.5 New Capacity and Investment Hotspots
- 10.6 Market Entry and Expansion Opportunities
- 10.7 Distribution and Partnership Opportunities
- 10.8 Near-Term and Long-Term Commercial Potential
- 10.9 Opportunity Attractiveness and Execution Risks
Chapter 11 Australia Flat Flexible Cables Market Outlook, 2025-2035
- 11.1 Market Size and Analysis
- 11.1.1 Revenue (Market Measurement: 2025: USD 19.5 million → 2035: USD 56.9 million)
- 11.1.2 Market Volume and Quantity Sold
- 11.1.3 Historical Market Size, 2018-2025
- 11.1.4 Base-Year Market Size, 2025
- 11.2 Market Forecast, 2025-2035
- 11.2.1 Revenue Forecast to 2035
- 11.2.2 Volume Forecast to 2035
- 11.2.3 CAGR and Year-on-Year Growth
- 11.2.4 Incremental Revenue Opportunity
- 11.3 Forecast Assumptions and Scenario Analysis
- 11.3.1 Base-Case Forecast
- 11.3.2 Optimistic and Conservative Scenarios
- 11.3.3 Technology, Pricing and Policy Sensitivities
- 11.4 Market Attractiveness and Growth Outlook
Chapter 12 Australia Flat Flexible Cables Market Segmentation and Outlook
- 12.1 Segmentation Summary and Market Shares, 2025
- 12.2 Largest and Fastest-Growing Segments
- 12.3 By Product Type - Market Size and Forecast, 2025-2035
- 12.3.1 Segment Definition and Scope
- 12.3.2 Historical Market Size, 2018-2025
- 12.3.3 Revenue Forecast, 2025-2035
- 12.3.4 Volume Forecast, 2025-2035
- 12.3.5 Base-Year Market Share, 2025
- 12.3.6 Segment CAGR and Growth Drivers
- 12.3.7 Subsegment Market Size and Forecast
- 12.3.7.1 Standard Unshielded FFC
- 12.3.7.2 Shielded Non-Impedance-Controlled FFC
- 12.3.7.3 High-Speed Impedance-Controlled FFC
- 12.3.8 Subsegment Pricing and Adoption Trends
- 12.3.9 Leading Suppliers and Competition
- 12.3.10 Regional Demand and Opportunities
- 12.4 By End-Use Industry - Market Size and Forecast, 2025-2035
- 12.4.1 Segment Definition and Scope
- 12.4.2 Historical Market Size, 2018-2025
- 12.4.3 Revenue Forecast, 2025-2035
- 12.4.4 Volume Forecast, 2025-2035
- 12.4.5 Base-Year Market Share, 2025
- 12.4.6 Segment CAGR and Growth Drivers
- 12.4.7 Subsegment Market Size and Forecast
- 12.4.7.1 Industrial and Defence Electronics
- 12.4.7.2 Consumer Electronics and Computing
- 12.4.7.3 Automotive Electronics
- 12.4.7.4 Medical Electronics
- 12.4.8 Subsegment Pricing and Adoption Trends
- 12.4.9 Leading Suppliers and Competition
- 12.4.10 Regional Demand and Opportunities
- 12.5 By Application - Market Size and Forecast, 2025-2035
- 12.5.1 Segment Definition and Scope
- 12.5.2 Historical Market Size, 2018-2025
- 12.5.3 Revenue Forecast, 2025-2035
- 12.5.4 Volume Forecast, 2025-2035
- 12.5.5 Base-Year Market Share, 2025
- 12.5.6 Segment CAGR and Growth Drivers
- 12.5.7 Subsegment Market Size and Forecast
- 12.5.7.1 Display Interconnection
- 12.5.7.2 Sensor and Camera Interconnection
- 12.5.7.3 Other Internal Board Interconnection
- 12.5.8 Subsegment Pricing and Adoption Trends
- 12.5.9 Leading Suppliers and Competition
- 12.5.10 Regional Demand and Opportunities
- 12.6 By Sales Channel - Market Size and Forecast, 2025-2035
- 12.6.1 Segment Definition and Scope
- 12.6.2 Historical Market Size, 2018-2025
- 12.6.3 Revenue Forecast, 2025-2035
- 12.6.4 Volume Forecast, 2025-2035
- 12.6.5 Base-Year Market Share, 2025
- 12.6.6 Segment CAGR and Growth Drivers
- 12.6.7 Subsegment Market Size and Forecast
- 12.6.7.1 Authorised Component Distribution
- 12.6.7.2 Direct Manufacturer Procurement
- 12.6.7.3 Specialist and Independent Supply
- 12.6.8 Subsegment Pricing and Adoption Trends
- 12.6.9 Leading Suppliers and Competition
- 12.6.10 Regional Demand and Opportunities
- 12.7 By State - Market Size and Forecast, 2025-2035
- 12.7.1 Segment Definition and Scope
- 12.7.2 Historical Market Size, 2018-2025
- 12.7.3 Revenue Forecast, 2025-2035
- 12.7.4 Volume Forecast, 2025-2035
- 12.7.5 Base-Year Market Share, 2025
- 12.7.6 Segment CAGR and Growth Drivers
- 12.7.7 Subsegment Market Size and Forecast
- 12.7.7.1 New South Wales
- 12.7.7.2 Victoria
- 12.7.7.3 Queensland
- 12.7.7.4 Other States and Territories
- 12.7.8 Subsegment Pricing and Adoption Trends
- 12.7.9 Leading Suppliers and Competition
- 12.7.10 Regional Demand and Opportunities
- 12.8 Segment Growth Comparison
- 12.9 Segment Attractiveness and Priority Matrix
Chapter 13 Australia Flat Flexible Cables End-Use and Application Market Outlook
- 13.1 End-Use Industry and Customer Demand Structure
- 13.2 Leading Applications and Customer Groups
- 13.3 End-Use Market Size, Share and Forecast
- 13.4 Major End-Use Industry Deep Dives
- 13.4.1 Customer Requirements and Use Cases
- 13.4.2 Demand and Replacement Cycles
- 13.4.3 Technical and Regulatory Considerations
- 13.4.4 Purchasing and Procurement Models
- 13.4.5 Leading Vendors and Distribution Channels
- 13.4.6 Forecast and Commercial Opportunities
- 13.5 Emerging Applications and Cross-Segment Demand
- 13.6 End-Use Industry Investment Priorities
Chapter 14 Australia Flat Flexible Cables Geographic Market Outlook, 2025-2035
- 14.1 Domestic Market Distribution and Demand Clusters
- 14.2 State- or Province-Wise Market Size and Forecast, 2025-2035
- 14.3 City and Metropolitan Market Outlook
- 14.4 Industrial, Manufacturing and Commercial Clusters
- 14.5 Geographic Concentration of Key End Users
- 14.6 Local Pricing and Purchasing Differences
- 14.7 Domestic Production Facilities and Capacity Map
- 14.8 Local Infrastructure and Project Pipeline
- 14.9 State-Level Policy and Incentive Differences
- 14.10 Subnational Investment Hotspots and Opportunities
- 14.11 Distribution and Logistics Networks
- 14.12 Domestic Competitive Footprint
Chapter 15 Australia Flat Flexible Cables Technology, Innovation and Sustainability Outlook
- 15.1 Technology Landscape and Maturity
- 15.2 Product, Process and Service Innovation
- 15.3 AI, Automation and Digital Tools in the Industry
- 15.4 Technology Adoption and Performance Benchmarking
- 15.5 Innovation Pipeline and R&D Investment
- 15.6 Patent and Intellectual Property Trends
- 15.7 Energy Efficiency and Resource Management
- 15.8 Sustainability, Recycling and Circularity
- 15.9 Technology Roadmap, 2025-2035
- 15.10 Risks of Obsolescence and Technology Substitution
Chapter 16 Australia Flat Flexible Cables Market Key Strategic Imperatives
- 16.1 Growth and Market Entry Priorities
- 16.2 High-Return Products and Segments
- 16.3 Pricing, Profitability and Cost Optimization
- 16.4 Technology Investment and Product Differentiation
- 16.5 Supply Chain Localization and Resilience
- 16.6 Distribution and Customer Acquisition
- 16.7 Partnership, Acquisition and Capacity Strategy
- 16.8 Regional Expansion Priorities
- 16.9 Short-, Medium- and Long-Term Actions
Chapter 17 Competition Outlook
- 17.1 Industry Competition Characteristics
- 17.2 Market Structure and Concentration
- 17.3 Market Share and Competitive Positioning, 2025
- 17.4 Company-Wise Revenue and Product Benchmarking
- 17.5 Production and Service Capacity Benchmarking
- 17.6 Technology, Pricing and Differentiation
- 17.7 Regional Footprint and Distribution Strength
- 17.8 Mergers, Acquisitions and Strategic Alliances
- 17.9 New Entrants and Competitive Threats
- 17.10 Porter's Five Forces and Industry Attractiveness
- 17.11 Competitive Outlook, 2025-2035
Chapter 18 Company Profiles
- 18.1 Company Coverage and Selection Criteria
- 18.2 element14 Australia
- 18.2.1 Business Description
- 18.2.2 Company Ownership and Geographic Presence
- 18.2.3 Product and Service Portfolio
- 18.2.4 Manufacturing and Operating Footprint
- 18.2.5 Production Capacity and Expansion Plans
- 18.2.6 Financial Performance and Investment
- 18.2.7 Market Share and Competitive Position
- 18.2.8 Technology and Innovation Capabilities
- 18.2.9 Strategic Alliances or Partnerships
- 18.2.10 Recent Developments
- 18.2.11 Growth Strategy and Outlook
- 18.3 RS Australia
- 18.4 Mouser Electronics
- 18.5 DigiKey
- 18.6 Amphenol
- 18.7 Other Relevant Market Participants
Note: Every listed company is profiled on the structure shown under the first company. The company list is preliminary and may change based on research findings, market developments, data availability and client requirements.
Chapter 19 Disclaimer
- 19.1 Research and Forecast Disclaimer
- 19.2 Data Source and Estimation Limitations
Note: The depth of individual sections depends on data availability for this market. Volume, capacity, trade and other unit-based metrics are included where applicable.

