
Release testing and bioanalysis anchor regional lab demand
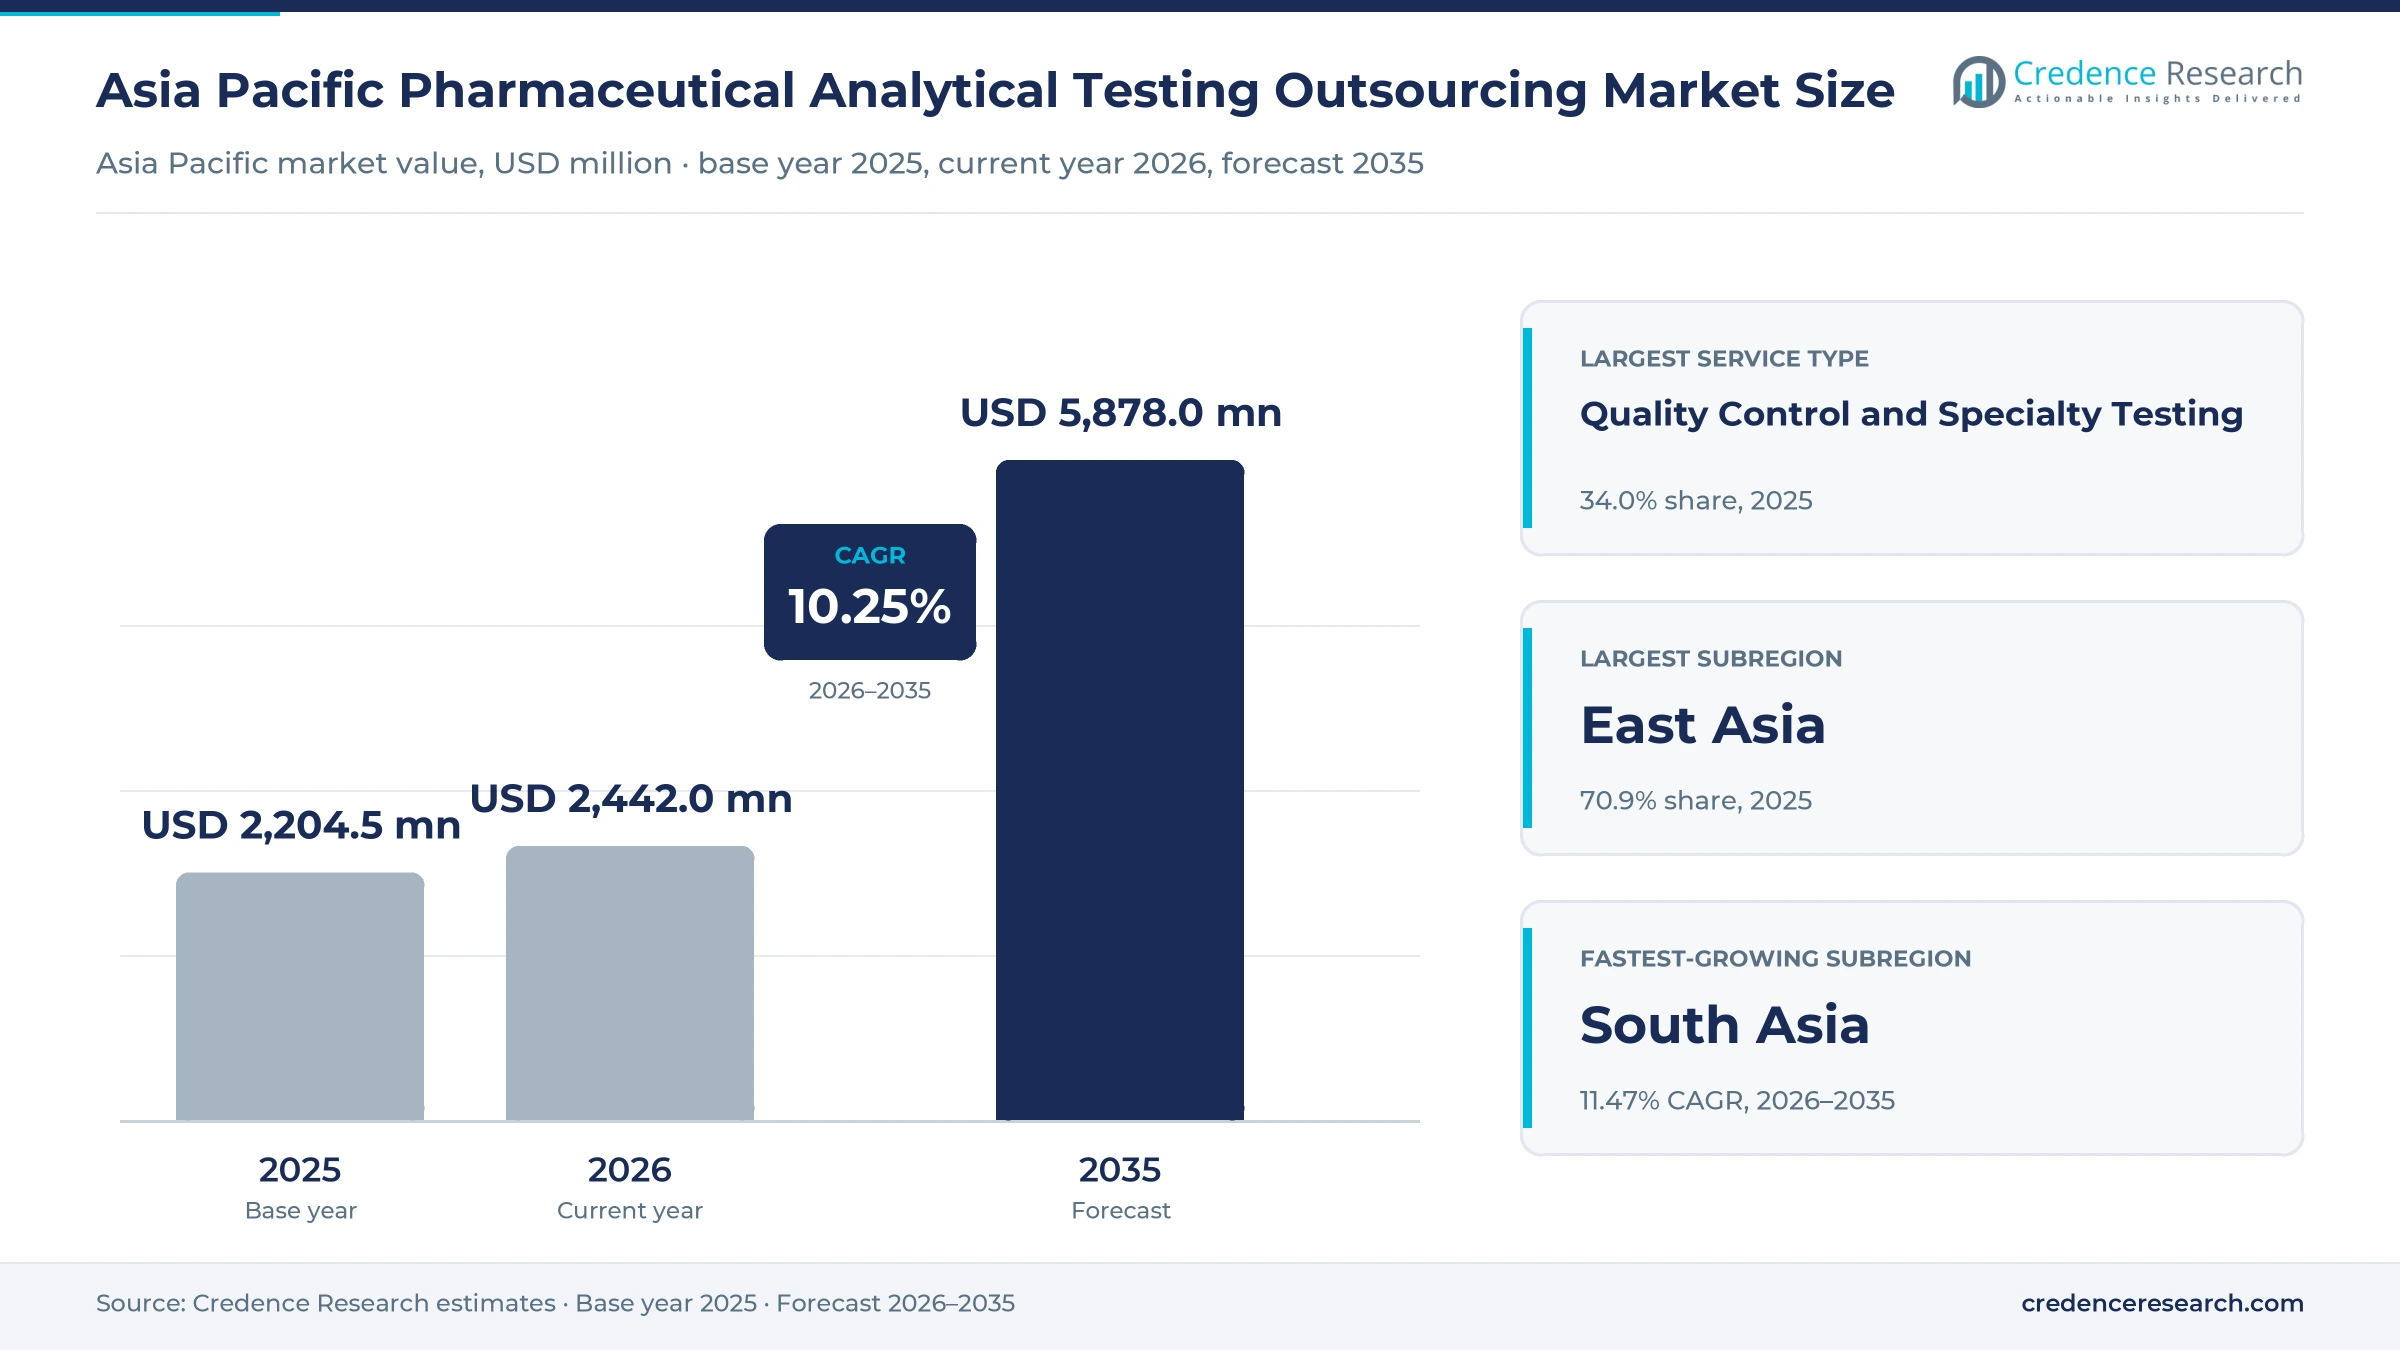
The Asia Pacific pharmaceutical analytical testing outsourcing market was valued at USD 2.20 billion in 2025 and is projected to increase from USD 2.44 billion in 2026 to USD 5.88 billion by 2035, registering a CAGR of 10.25% during 2026–2035. Demand comes from drug developers and manufacturers that send release, stability, method validation and bioanalytical work to contract laboratories in China, India, Japan, South Korea, Singapore and Australia. East Asia held the largest subregional share, 70.9% in 2025, because Chinese integrated groups and Japanese and Korean sponsors place the most testing volume in the region. South Asia is the fastest-growing subregion at 11.47% a year, as Indian generic exporters and biologics developers add outsourced quality work. Regulation is also changing how methods are built, because the ICH Q14 guideline on analytical procedure development came into effect in the European Union in June 2024 and China's drug regulator asked applicants to follow the same principles.
Which testing services and buyers are counted?
The estimate measures fees paid to independent and contract laboratories for bioanalytical testing, stability testing, method development and validation, and quality control and specialty testing of drug substances and drug products in the Asia-Pacific region. Buyers purchase this work per test, per project or through capacity retainers, either through direct sponsor contracts, manufacturing partner referrals or competitive tenders.
The estimate excludes testing that sponsors and manufacturers run in their own quality laboratories, clinical diagnostics, medical device testing and preclinical safety studies. The value chain runs from instrument and reagent makers through contract laboratories to drug regulators in China, Japan, South Korea, India, Singapore and Australia that review the resulting data.
Asia Pacific Pharmaceutical Analytical Testing Outsourcing Market Insights
- The Asia Pacific pharmaceutical analytical testing outsourcing market was valued at USD 2.20 billion in 2025 and is projected to reach USD 5.88 billion by 2035, registering a CAGR of 10.25% during 2026–2035.
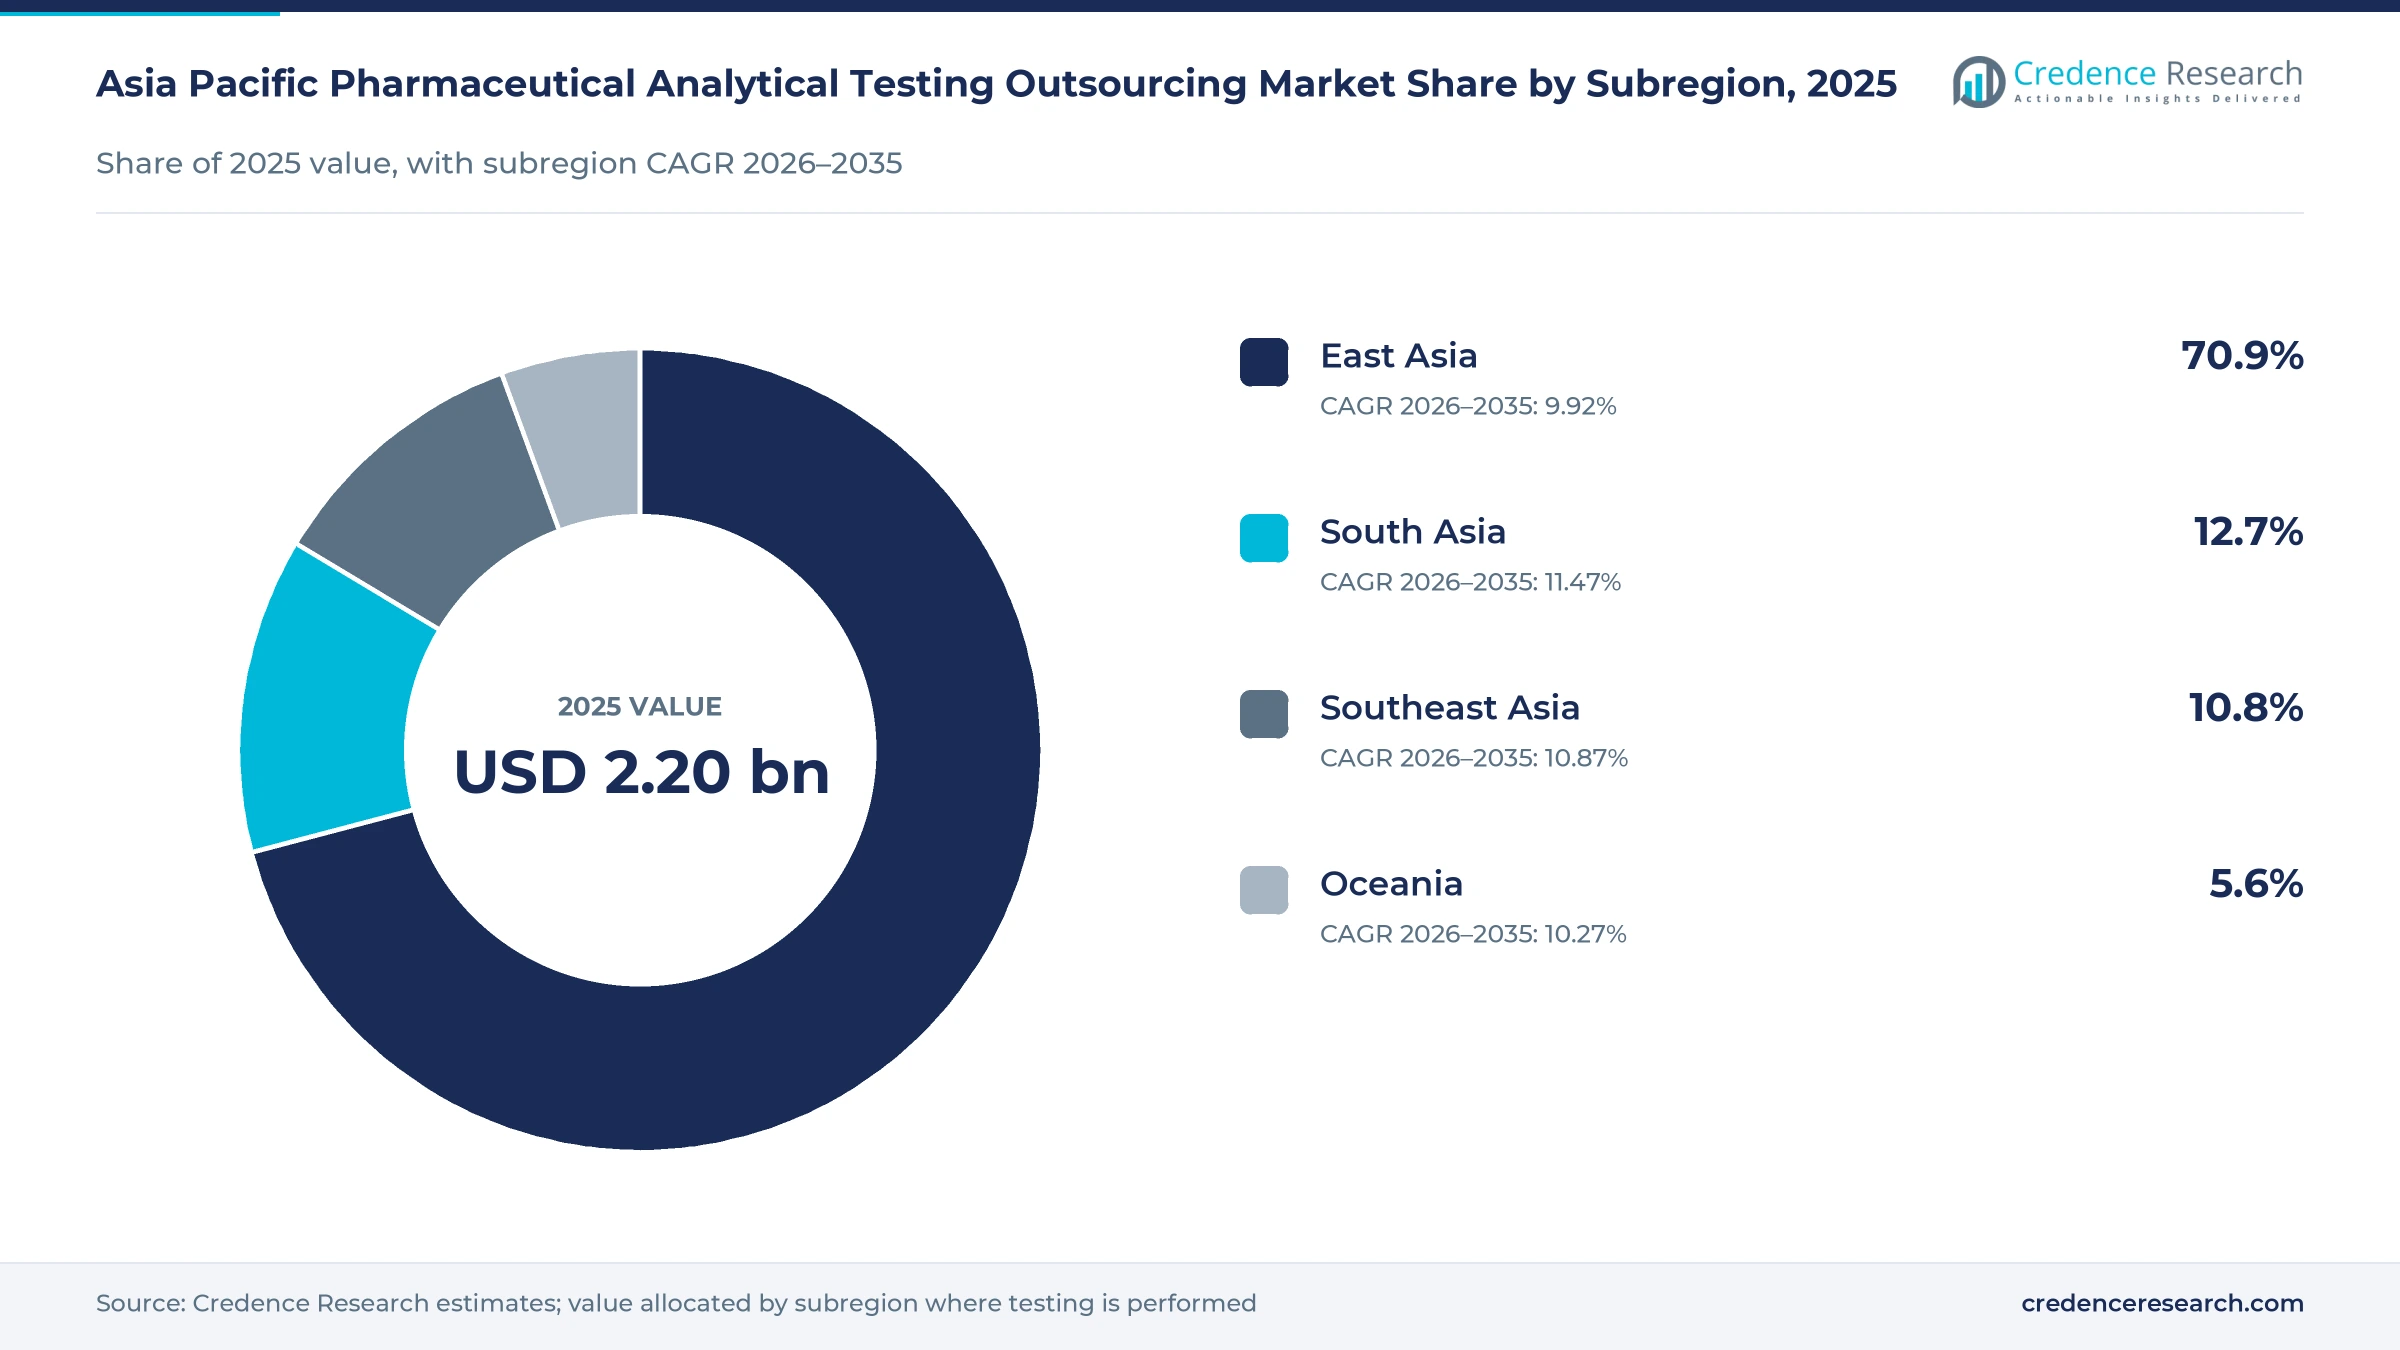
- East Asia held a 70.9% share of 2025 value, because Chinese integrated laboratory groups and Japanese and Korean sponsors place the most testing volume in the region.
- Quality control and specialty testing led service demand with a 34.0% share of 2025 value, because every commercial batch needs release testing before shipment.
- The ICH released a consolidated draft Q1 stability guideline on April 17, 2025, merging five earlier stability guidelines into one document for consultation.
- The BIOSECURE Act became U.S. law on Dec. 18, 2025, which pushes Western sponsors to qualify second testing suppliers across the region.
Quality control leads while bioanalysis grows fastest
Why does quality control lead service demand?
Based on service type, the market is categorized into bioanalytical testing, stability testing, method development and validation, and quality control and specialty testing. Quality Control and Specialty Testing led with a 34.0% share of 2025 value, because release, impurity and elemental testing repeat with every commercial batch. Bioanalytical Testing grows fastest at 10.88% a year, as antibody, conjugate and nucleic acid programs need specialized assays in clinical studies.
How do drug makers and biologics developers divide demand?
Based on customer type, the market is categorized into pharmaceutical companies, biopharmaceutical companies, contract manufacturing organizations and academic and government research buyers. Pharmaceutical Companies led with a 44.0% share of 2025 value, because generic and branded manufacturers outsource large recurring release workloads. Biopharmaceutical Companies grow fastest at 10.97% a year, as biotech developers rarely build full quality laboratories.
Why does commercial quality control lead application demand?
Based on application, the market is categorized into early development, clinical development, registration support and commercial quality control. Commercial Quality Control led with a 35.0% share of 2025 value, because marketed products need release and ongoing stability testing for their entire life. Clinical Development grows fastest at 10.71% a year, as faster trial reviews in China bring more candidates into human studies.
How do buyers choose between lab service models?
Based on operating model, the market is categorized into transactional laboratory services, managed testing programs and dedicated outsourced teams. Transactional Laboratory Services led with a 55.0% share of 2025 value, because many buyers still send individual tests when internal capacity runs short. Dedicated Outsourced Teams grow fastest at 10.82% a year, as sponsors place full method lifecycles with one provider.
| Segment Group | Leading Sub-segment | Share, 2025 | Fastest-growing Sub-segment | CAGR, 2026–2035 |
|---|---|---|---|---|
| By Service Type | Quality Control and Specialty Testing | 34.0% | Bioanalytical Testing | 10.88% |
| By Customer Type | Pharmaceutical Companies | 44.0% | Biopharmaceutical Companies | 10.97% |
| By Application | Commercial Quality Control | 35.0% | Clinical Development | 10.71% |
| By Operating Model | Transactional Laboratory Services | 55.0% | Dedicated Outsourced Teams | 10.82% |
Request a Free Sample
Fill in your details and we'll send you a free sample report.
- Sample data tables & charts
- Research methodology
Lifecycle methods, complex molecules and recurring QC
How do new ICH method rules lift outsourced method work?
New ICH method rules require sponsors to design, validate and maintain analytical procedures with more formal risk assessment, which sends more method work to contract laboratories. ICH regulators adopted the Q14 guideline on Nov. 1, 2023, and the European Medicines Agency set June 14, 2024, as its date of effect. The guideline introduces the analytical target profile and an enhanced approach with multivariate experiments and defined operating ranges. China's drug regulator published an announcement on May 28, 2024, asking applicants to follow the Q2(R2) and Q14 principles, the ECA Academy reported. As a result, method development and validation gains a growing part of service demand, because many sponsors lack enhanced method expertise.
Why do complex molecules need specialist bioanalysis labs?
Antibodies, conjugates, peptides and nucleic acid drugs require ligand-binding and mass spectrometry assays that most sponsors cannot run in house, so their pipelines feed outside laboratories. China's drug regulator adopted the ICH M10 question-and-answer documents on bioanalytical method validation for studies starting from July 29, 2023. WuXi AppTec reported in March 2026 that its testing unit holds a leading position in nucleic acids, conjugates, multispecific antibodies and peptides. Pharmaron lists LC-MS/MS, high-resolution mass spectrometry, immunoassays, flow cytometry, PCR and accelerator mass spectrometry across its bioanalytical network. Syngene International also announced on Oct. 25, 2025, a Bengaluru bioconjugation suite with integrated analytical and bioanalytical laboratories. In turn, bioanalytical testing grows fastest among service types at 10.88% a year.
Why do stability and release duties keep recurring?
Every marketed product needs release testing and ongoing stability data for as long as it is sold, which gives laboratories a steady base of repeat work. The ICH released a consolidated draft Q1 stability guideline on April 17, 2025, merging five guidelines into one 108-page document, RAPS reported. The draft adds a new annex for advanced therapy products and a section on statistical evaluation. India's drug exports passed USD 30 billion in fiscal 2024-25, up more than 9%, News On AIR reported in April 2025. Eurofins runs ICH stability programs and release testing from a cGMP laboratory in Bengaluru. Consequently, commercial quality control holds a 35.0% share of 2025 application value.
How does revised Schedule M push Indian work outside?
Revised Indian manufacturing rules require small plants to upgrade their quality systems, yet many units cannot afford to build full quality laboratories in time. The revised Schedule M deadline for micro and small firms passed on Dec. 31, 2025, and risk-based inspections were set to start in January 2026, Business Standard reported. The same report said about 1,700 of roughly 6,500 affected units, or 26%, had filed upgrade plans. About 2,000 small units already hold WHO-GMP certification, which shows how wide the compliance gap remains. Intertek offers stability, nitrosamine and elemental impurity testing from an ISO/IEC 17025-accredited laboratory in Mumbai. As a result, South Asia becomes the fastest-growing subregion over the forecast period.
Faster trial reviews and supplier diversification
Shift toward faster clinical entry in China
Sponsors now need validated methods and stability data earlier, because Chinese trial applications move through review much faster than before. China's drug regulator approved 48 first-in-class innovative drugs in 2024, up from 40 in 2023 and 21 in 2022, according to its annual drug review report. The National Medical Products Administration then issued Announcement No. 86 on Sept. 9, 2025, setting a 30-working-day review for eligible innovative drug trial applications. Tigermed reported in March 2026 that its laboratories had passed more than 180 NMPA and more than 70 FDA inspections. In turn, clinical development grows fastest among applications at 10.71% a year.
Rising supplier diversification after the BIOSECURE Act
Western sponsors increasingly want a second qualified laboratory outside a single market, which spreads testing work across more countries. The BIOSECURE Act was signed into U.S. law on Dec. 18, 2025, and the White House budget office must publish a full list of covered companies by Dec. 18, 2026, Latham & Watkins reported. WuXi AppTec reported 741 quality audits and inspections with no critical findings in 2025, which shows how closely sponsors now audit Chinese providers. Lambda Therapeutic Research has developed more than 1,100 validated bioanalytical methods in Ahmedabad, according to a March 2026 company rating note. As a result, Indian laboratories win second-supplier programs, often bundled with regional clinical research services for the same sponsor.

Oceania early-phase bioanalysis offers an opening
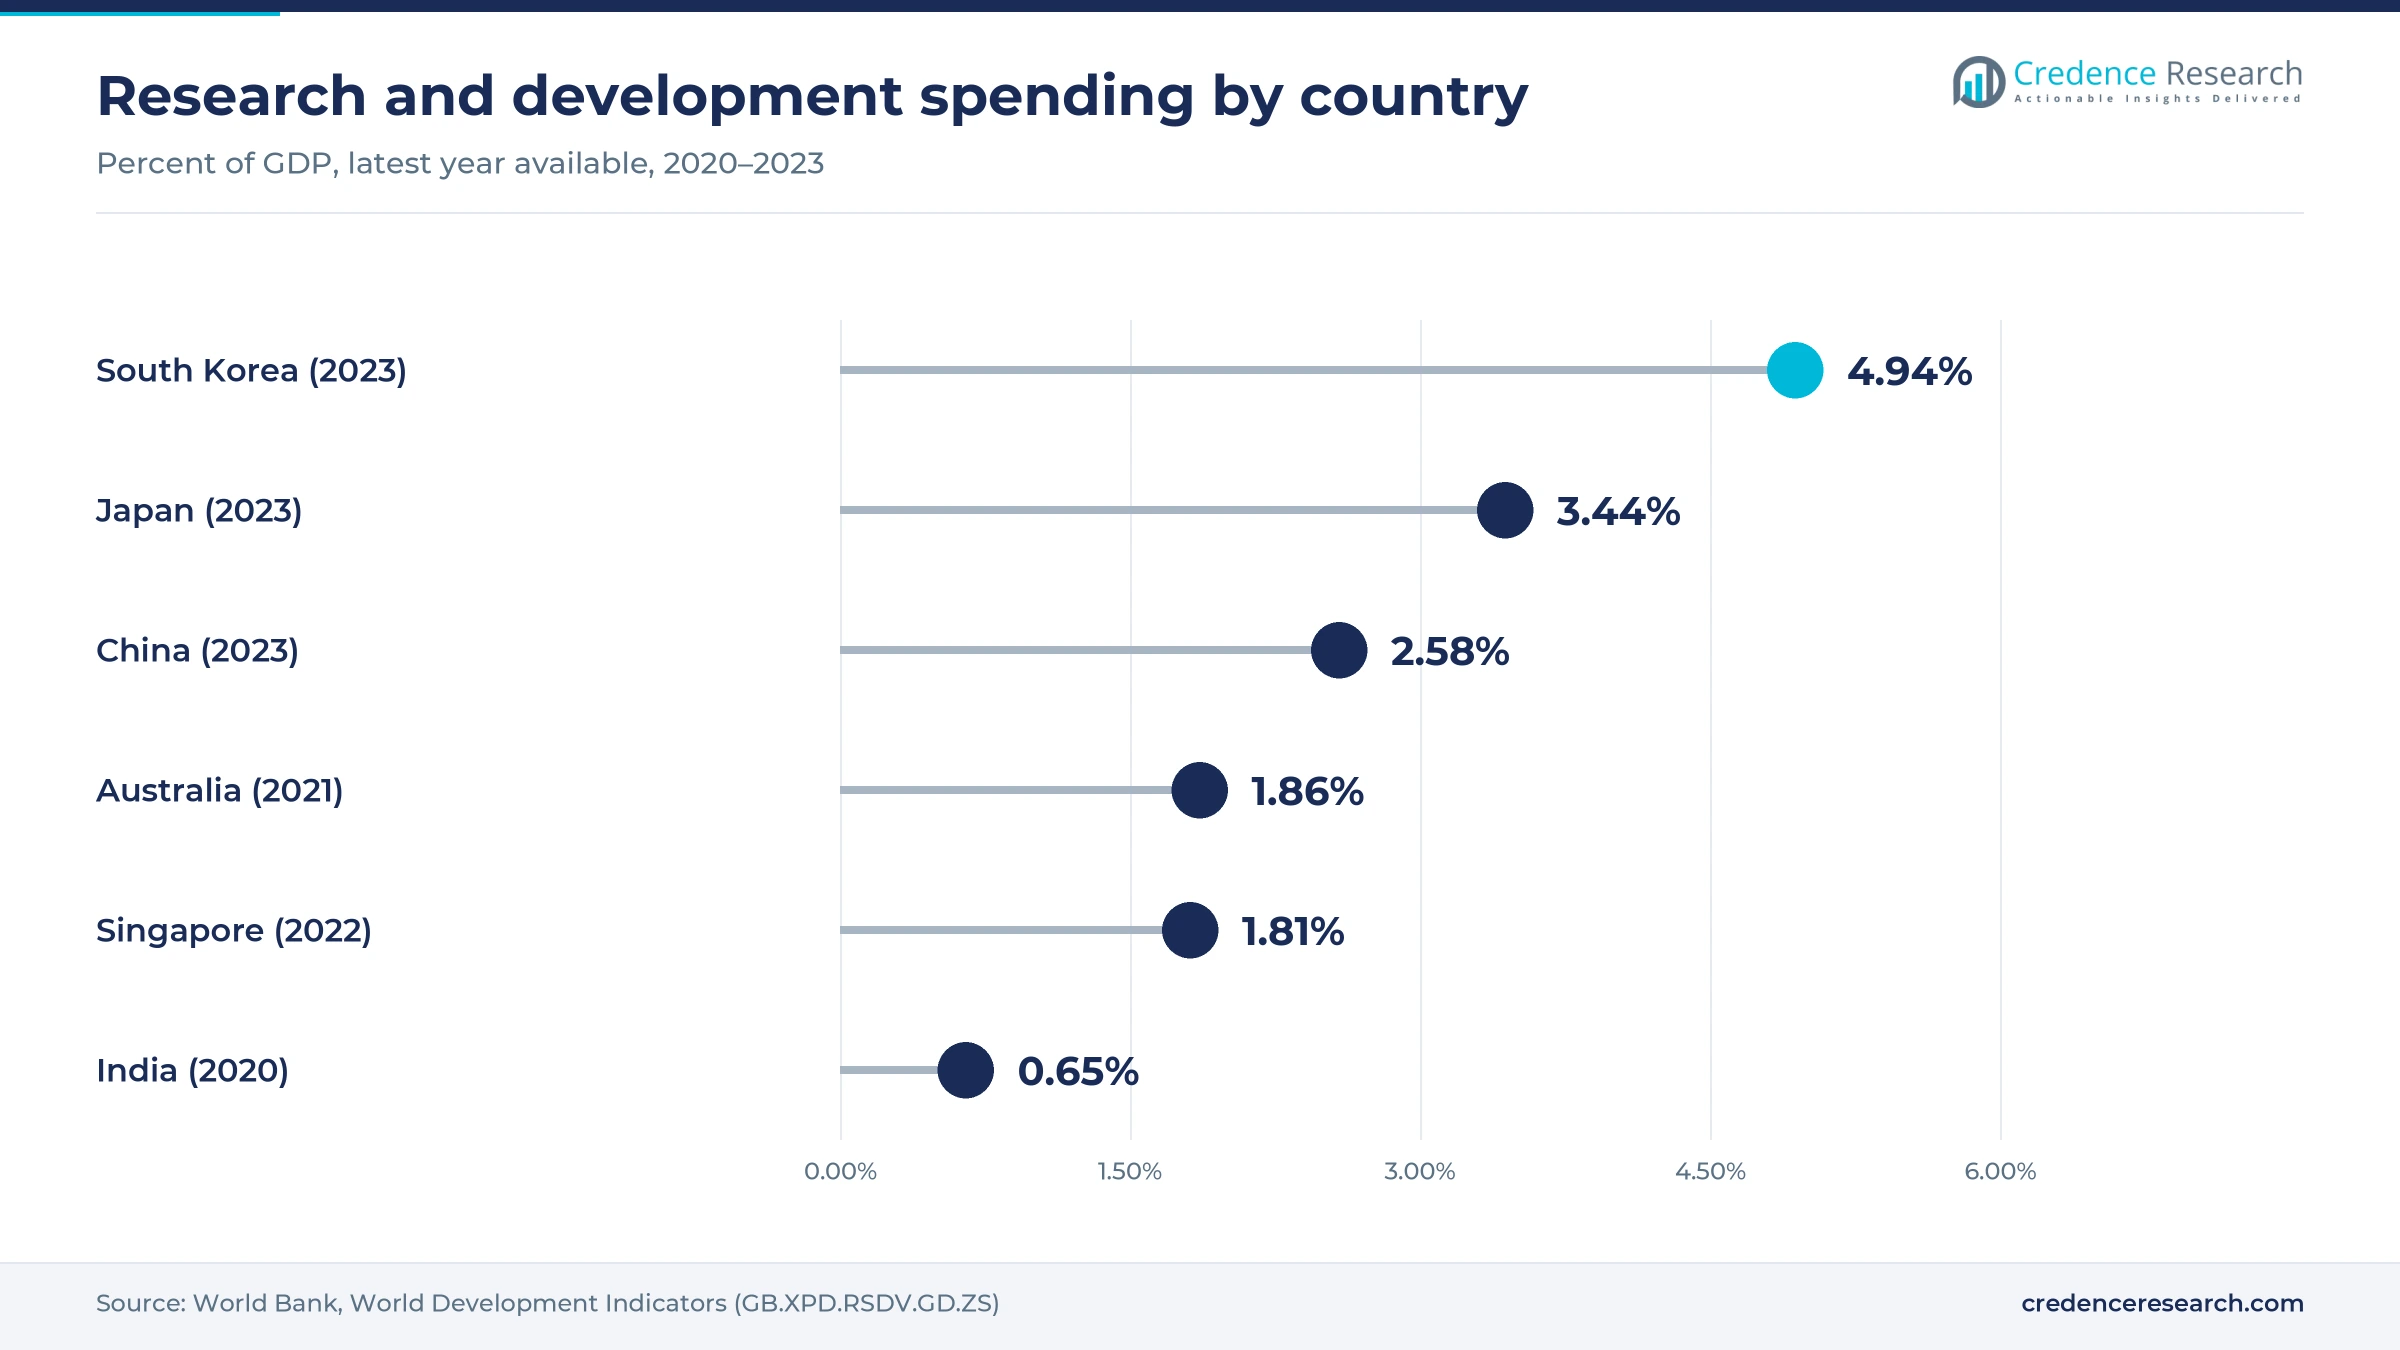
Australia attracts many first-in-human studies, and each one needs fast, regulated sample analysis close to the trial site. SGS formed a strategic partnership on Dec. 20, 2023, with Agilex Biolabs, described as Australia's largest regulated bioanalytical laboratory. Smaller Australian companies can claim a refundable research tax offset at the company tax rate plus an 18.5% premium, according to the Australian Taxation Office. Australia spent 1.86% of GDP on research and development in 2021, according to World Bank data. In turn, Oceania holds a 5.6% share of 2025 value, and its laboratories win bioanalysis linked to preclinical contract research programs.
Southeast Asia biologics plants open a quality opening
New antibody and conjugate plants in Singapore will need release, stability and characterization work once commercial production starts. AstraZeneca announced on May 20, 2024, a USD 1.5 billion antibody-drug conjugate plant in Singapore, with operational readiness targeted from 2029, according to the Economic Development Board. Novartis broke ground on March 15, 2024, on a USD 256 million expansion of its Singapore antibody site, creating about 100 skilled jobs. Singapore also spent 1.81% of GDP on research and development in 2022, according to World Bank data. As a result, Southeast Asia grows at 10.87% a year as biologics contract manufacturing expands.
Talent, pricing and audit pressure weigh on laboratories
Skilled analyst shortages slow capacity growth
Mass spectrometry, ligand-binding and method validation work needs scientists with years of regulated experience, and such analysts are scarce across the region. Smaller laboratories feel this most, since larger groups recruit their trained staff with better pay and career paths. Longer hiring cycles then delay new service lines and extend turnaround times for sponsors. Providers respond with in-house training academies, automation of routine assays and closer links with universities.
Price competition squeezes routine testing margins
Many laboratories in China and India offer similar release and stability tests, which keeps prices for routine work under steady pressure. Buyers that run competitive tenders often award routine work on price, which leaves little room for investment. Smaller providers without specialist services are most exposed to these discounts. Laboratories respond by moving toward bioanalysis, impurity work and managed programs, where technical demands support better pricing and longer contracts.
Data integrity audits raise compliance costs
Sponsors and regulators now review electronic records, audit trails and instrument controls closely, which adds cost for every laboratory they audit. A single serious finding can stop a laboratory from receiving new work for months. Mid-sized providers carry the heaviest relative burden, since they must fund validated software and quality staff with smaller revenues. Many invest in laboratory information systems and regular third-party audits to show their records meet international standards.
Guideline transitions add method rework
The new ICH Q14, Q2(R2) and revised Q1 texts change how methods and stability programs are designed, so many older methods need rework. Sponsors must decide which older methods to revalidate and how to file the changes in each country. Laboratories that serve several regulators face the most work, since adoption dates differ across the region. Providers reduce this burden through gap assessments, template protocols and staged revalidation plans.
Chinese lab scale keeps East Asia ahead as India gains
| Subregion | Value, 2025 (USD billion) | Share, 2025 | CAGR, 2026–2035 |
|---|---|---|---|
| East Asia | 1.56 | 70.9% | 9.92% |
| South Asia | 0.28 | 12.7% | 11.47% |
| Southeast Asia | 0.24 | 10.8% | 10.87% |
| Oceania | 0.12 | 5.6% | 10.27% |
East Asia leads on integrated laboratory scale
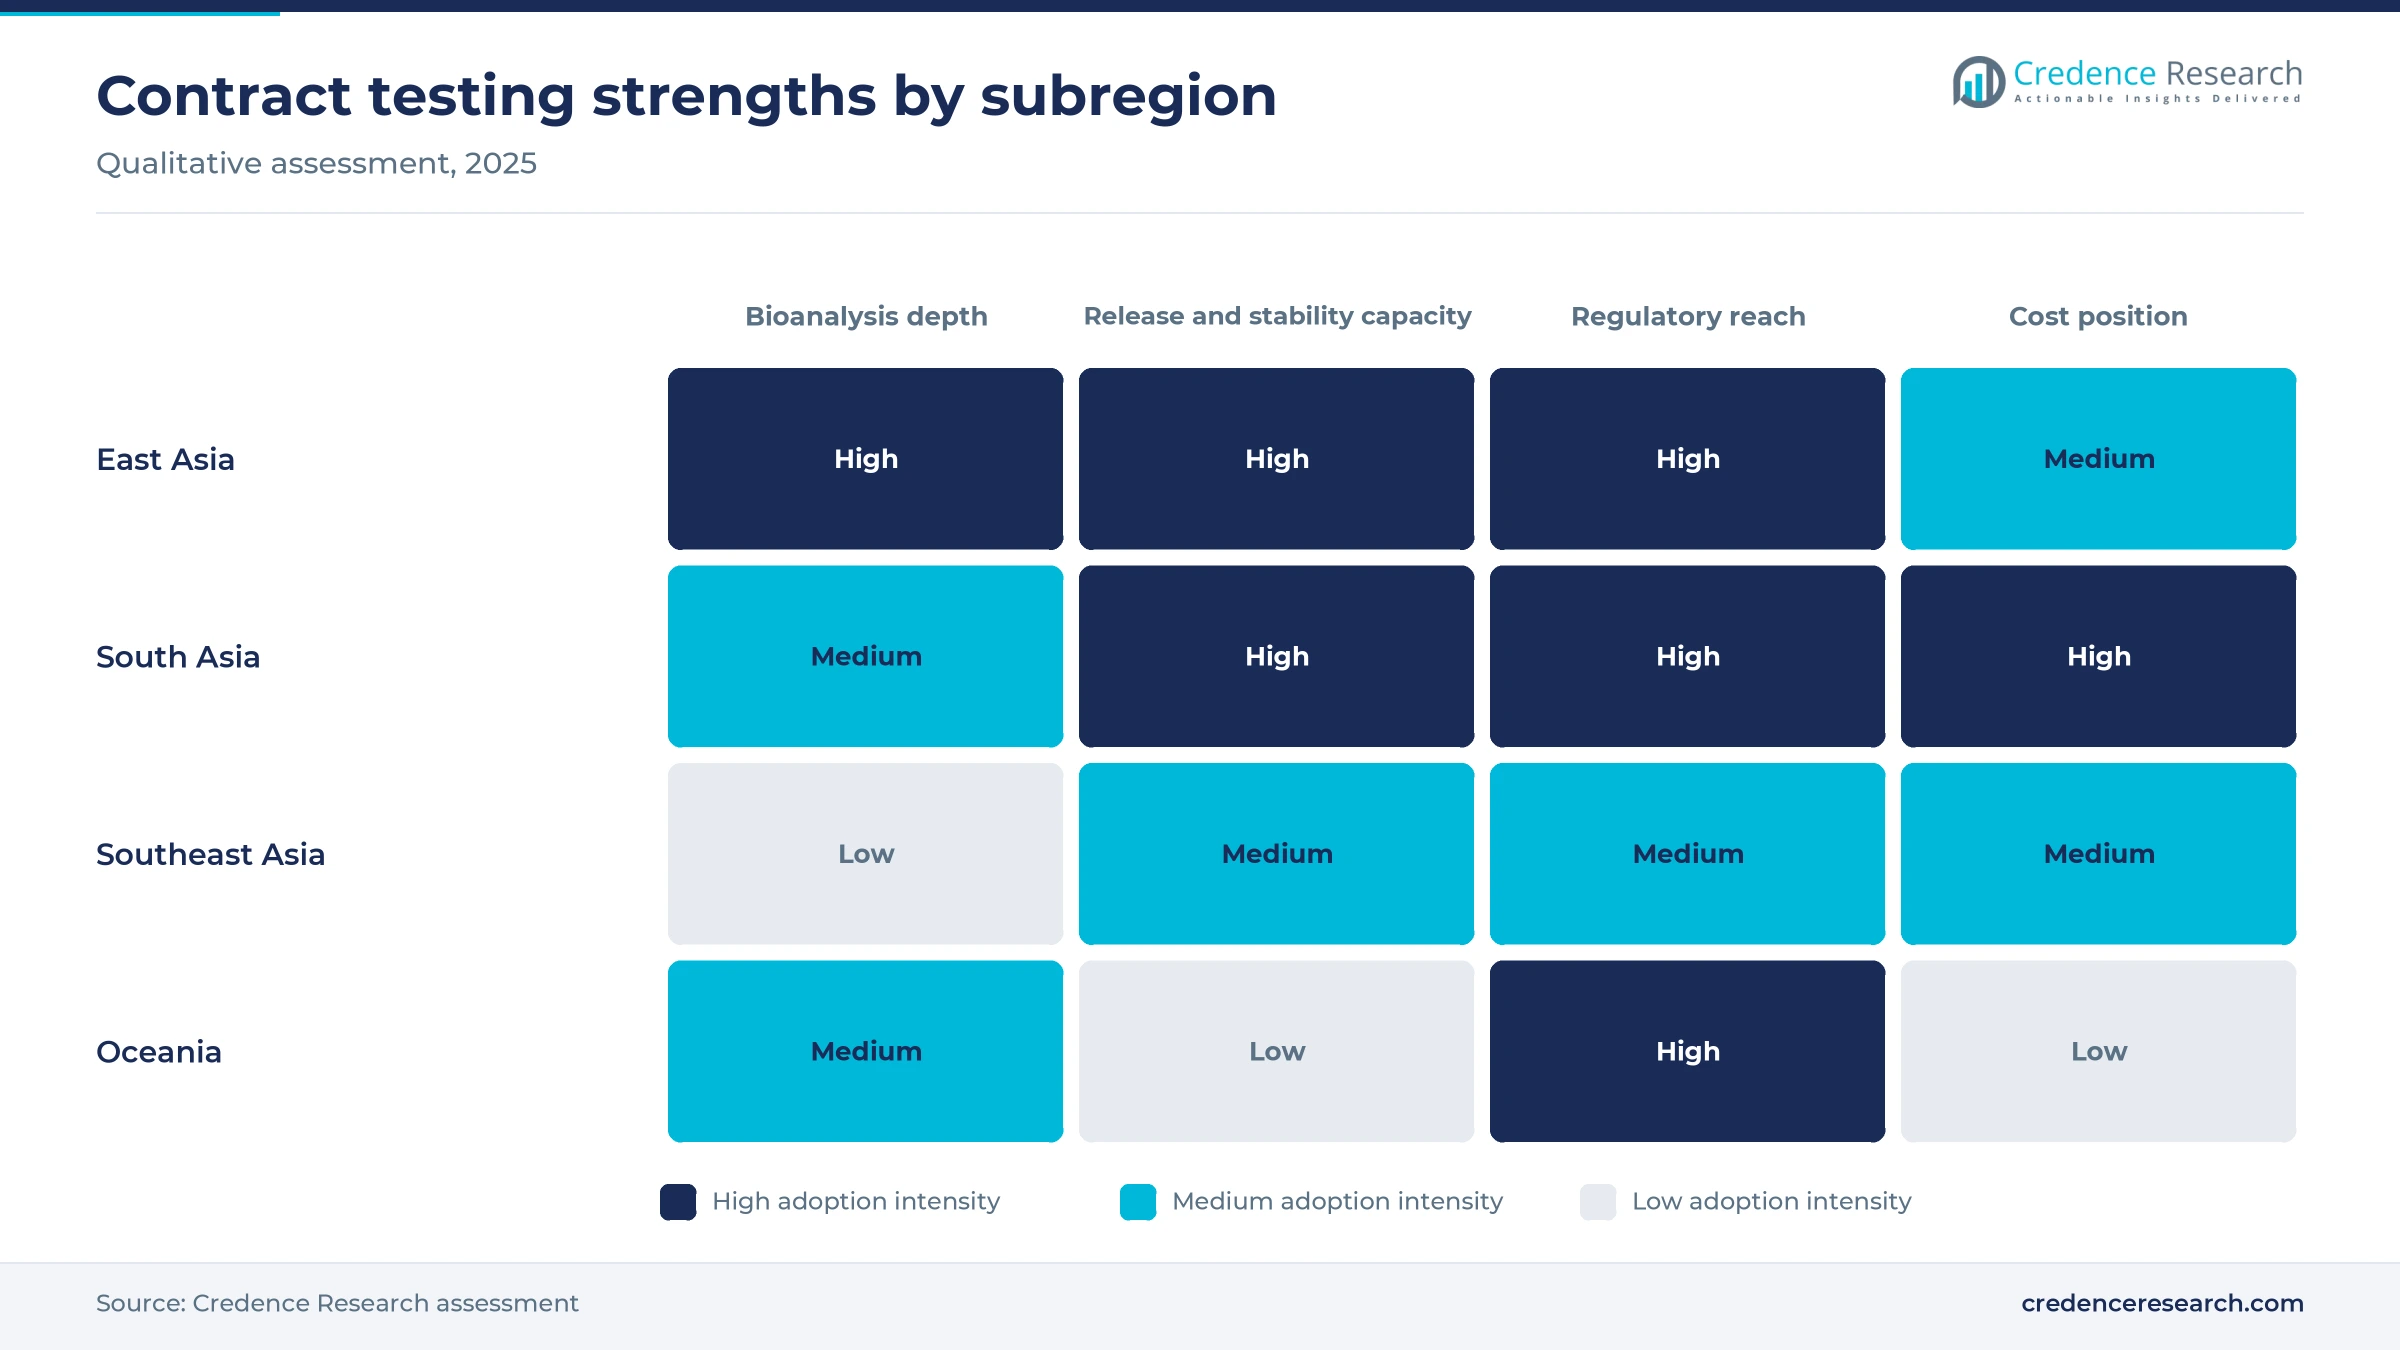
East Asia held 70.9% of 2025 value and grows at 9.92% a year, because China, Japan and South Korea combine large integrated laboratory groups with strong domestic drug pipelines. WuXi AppTec reported in March 2026 that its Suzhou and Shanghai testing facilities passed multiple FDA, OECD, NMPA and PMDA inspections. South Korea spent 4.94% of GDP on research and development in 2023, the highest ratio among the countries covered, according to World Bank data. However, U.S. policy risk pushes some Western sponsors to split programs with laboratories elsewhere.
South Asia grows fastest on export quality work
South Asia held 12.7% of 2025 value and grows at 11.47% a year, the fastest rate among the subregions, because Indian exporters and biologics developers need more release, stability and bioanalytical testing. Lambda Therapeutic Research runs a bioanalytical laboratory in Ahmedabad with approvals from the FDA, ANVISA and WHO. Eurofins and Intertek operate cGMP testing laboratories in Bengaluru and Mumbai. As a result, demand also links to contract drug manufacturing in India, which needs routine release work.
Southeast Asia grows with Singapore biologics sites
Southeast Asia held 10.8% of 2025 value and grows at 10.87% a year, because Singapore attracts large antibody and conjugate production plants that need commercial quality testing. AstraZeneca plans a USD 1.5 billion conjugate plant there, and Novartis is expanding its antibody site. Other Southeast Asian markets add generic production that relies on outsourced release testing. However, local specialist bioanalysis capacity remains thinner than in East Asia, so some samples still travel abroad.
Oceania adds regulated early-phase bioanalysis
Oceania held 5.6% of 2025 value and grows at 10.27% a year, because Australia hosts many early-phase trials that need regulated bioanalysis. SGS strengthened its regional presence through its partnership with Agilex Biolabs in December 2023. Research tax offsets help smaller biotech companies fund outsourced laboratory work. However, higher labor costs keep routine release testing more competitive in South and East Asia.
Guideline, regulatory and capacity moves, 2024–2026
| Development | Status and market relevance |
|---|---|
| In May 2024, China's National Medical Products Administration asked applicants to follow ICH Q2(R2) and Q14 analytical procedure principles. | In force; moves method development toward the enhanced approach |
| In April 2025, the ICH released a consolidated draft Q1 stability guideline merging five earlier stability guidelines. | Draft under consultation; will reshape stability study design |
| In September 2025, China's National Medical Products Administration issued Announcement No. 86 on 30-working-day trial reviews. | In force; pulls method validation and stability work forward |
| In October 2025, Syngene International announced a Bengaluru bioconjugation suite with integrated analytical and bioanalytical laboratories. | Under construction; supports conjugate testing in India |
| In March 2026, Tigermed reported that its laboratories had passed more than 180 NMPA and more than 70 FDA inspections. | Completed; supports acceptance of its laboratory data |
LC-MS, enhanced method design and digital data tools
- High-resolution mass spectrometry measures drugs, metabolites and impurities at very low levels, which supports bioanalysis of peptides and nucleic acids.
- Enhanced method design applies risk assessment and multivariate experiments under ICH Q14, which lets laboratories define wider operating ranges for each method.
- Software for metabolite identification speeds spectral interpretation, and WuXi AppTec reported an 83% efficiency gain for nucleic acids and peptides.
- Information security systems protect sponsor data, and WuXi AppTec reported ISO/IEC 27001 certification at 20 main sites in China.
Need a Custom Version of This Report?
Tailor the scope, geography, or segments to your exact requirements.
- Custom geography or segment scope
- Direct access to our analyst team
Chinese integrated groups face Indian and global labs
Competition centers on regulatory inspection records, specialist assay depth, turnaround time and the ability to run full method lifecycles for a sponsor. WuXi AppTec competes as an integrated group with testing facilities in Suzhou and Shanghai and strength in nucleic acids, conjugates and peptides. Pharmaron runs a bioanalytical network across GLP, GCP and non-GLP work. Tigermed competes through its Frontage and Teddy laboratory operations, while Syngene International adds integrated analytical work to its biologics campus in Bengaluru. Global groups compete through local laboratories, with Eurofins in Bengaluru, Intertek in Mumbai and SGS in Australia through its Agilex Biolabs partnership. Lambda Therapeutic Research serves generic bioequivalence and bioanalytical programs from its laboratory in Ahmedabad. Providers increasingly win work through audit records and data security rather than price alone.
Laboratory groups serving regional sponsors and their roles
| Company | Type | Role in the market |
|---|---|---|
| WuXi AppTec | Integrated CRO | Testing and DMPK services from Suzhou and Shanghai facilities inspected by FDA, NMPA and PMDA |
| Pharmaron | Integrated CRO | Small and large molecule bioanalysis using LC-MS/MS, immunoassays, PCR and AMS |
| Tigermed | Clinical CRO | Laboratory services through Frontage and Teddy laboratory operations in China |
| Syngene International | Integrated CRDMO | Analytical and bioanalytical work linked to its Bengaluru biologics campus |
| Eurofins Scientific | Testing network | Method validation, stability and release testing from a cGMP laboratory in Bengaluru |
| Intertek | Testing network | Impurity, stability and extractables testing from an accredited laboratory in Mumbai |
| SGS | Testing network | Regulated bioanalysis in Australia through its Agilex Biolabs partnership |
| Lambda Therapeutic Research | Clinical and bioanalytical CRO | Bioanalytical laboratory in Ahmedabad with more than 1,100 validated methods |
Credence Research view on regional lab outsourcing
Credence Research's view is that outsourced laboratory testing in the region will keep growing faster than drug production, because complex molecules, new method guidelines and stricter manufacturing rules all add testing work. East Asia will remain the largest location for this work, yet its share will ease slightly as sponsors qualify second suppliers in India, Singapore and Australia. Providers with clean inspection records, specialist bioanalysis and managed program offers will win the most valuable contracts. Routine release testing will stay price sensitive, so growth will favor specialist assays and long-term programs.
How the regional testing services estimate was built
The report on regional drug testing services uses 2025 as the base year and forecasts values for 2026 through 2035 from the Credence Research market model. Subregional, service, customer, application and operating model splits are Credence Research estimates based on laboratory capacity, drug production, pipelines and public company disclosures. Inputs include ICH and regulator documents from the EMA and NMPA, World Bank research spending data, government trade data, Singapore Economic Development Board releases and company filings and releases. The report does not rely on interviews or surveys, and every dated fact cited comes from a public source.
Biologics pipelines and quality rules carry demand to 2035
The market is projected to reach USD 5.88 billion by 2035, growing at a 10.25% CAGR during 2026–2035. Commercial quality control will keep the largest share of work, while bioanalysis grows fastest as antibody, conjugate and nucleic acid pipelines advance. South Asia will gain share through export testing and stricter manufacturing rules, and East Asia will keep its lead through scale. The new ICH method and stability guidelines will add revalidation and lifecycle work, which will favor providers that sell managed programs.
Frequently Asked Questions
How big is the Asia Pacific pharmaceutical analytical testing outsourcing market?
Which subregion leads regional drug testing outsourcing?
Which subregion grows fastest in regional drug testing outsourcing?
Which service type leads demand for outsourced drug testing?
How does ICH Q14 affect outsourced method development in Asia Pacific?
How does the BIOSECURE Act affect testing outsourcing in the region?
Why is bioanalytical testing growing fastest?
Which companies are active in the Asia Pacific drug testing outsourcing market?
Table of Content
Chapter 1 Market Segmentation
- 1.1 Segmentation Framework
- 1.1.1 Product and Service Classification
- 1.1.2 Application and End-Use Classification
- 1.1.3 Technology and Solution Classification
- 1.1.4 Customer and Distribution Channel Classification
- 1.1.5 Geographic Segmentation
- 1.1.6 Market Segment Definitions and Boundaries
- 1.2 By Service Type
- 1.2.1 Quality Control and Specialty Testing
- 1.2.2 Bioanalytical Testing
- 1.2.3 Method Development and Validation
- 1.2.4 Stability Testing
- 1.3 By Customer Type
- 1.3.1 Pharmaceutical Companies
- 1.3.2 Biopharmaceutical Companies
- 1.3.3 Contract Manufacturing Organizations
- 1.3.4 Academic and Government Research Buyers
- 1.4 By Application
- 1.4.1 Early Development
- 1.4.2 Clinical Development
- 1.4.3 Registration Support
- 1.4.4 Commercial Quality Control
- 1.5 By Operating Model
- 1.5.1 Transactional Laboratory Services
- 1.5.2 Managed Testing Programs
- 1.5.3 Dedicated Outsourced Teams
- 1.6 By Subregion
- 1.6.1 East Asia
- 1.6.2 South Asia
- 1.6.3 Southeast Asia
- 1.6.4 Oceania
Chapter 2 Introduction
- 2.1 Report Objectives and Scope
- 2.2 Product Definition and Industry Terminology
- 2.3 Market Inclusions and Exclusions
- 2.4 Research Process
- 2.4.1 Primary Research and Expert Interviews
- 2.4.2 Secondary Research and Source Review
- 2.4.3 Top-Down and Bottom-Up Estimation
- 2.4.4 Data Triangulation and Verification
- 2.5 Market Size Measurement Basis
- 2.5.1 2025: USD 2.20 billion → 2035: USD 5.88 billion
- 2.6 Historical and Forecast Reference Periods
- 2.6.1 Historical Period: 2018-2025
- 2.6.2 Base Year: 2025
- 2.6.3 Forecast Period: 2025-2035
- 2.7 Research Assumptions and Limitations
Chapter 3 Executive Summary
- 3.1 Market Snapshot and Key Findings
- 3.2 Base-Year Market Size, 2025
- 3.3 Forecast Market Size, 2035
- 3.4 Revenue and Volume Growth Outlook
- 3.5 Key Demand and Supply Indicators
- 3.6 Leading Market Segments
- 3.7 Fastest-Growing Market Opportunities
- 3.8 Regional Performance Highlights
- 3.9 Technology and Industry Transformation
- 3.10 Competitive Landscape Summary
- 3.11 Analyst View and Strategic Implications
Chapter 4 Asia Pacific Pharmaceutical Analytical Testing Outsourcing Market Trends and Developments
- 4.1 Historical Industry Development, 2018-2025
- 4.2 Recent Market Trends and Developments
- 4.3 Demand and Customer Behavior Trends
- 4.4 Technology and Product Innovation
- 4.5 Artificial Intelligence, Automation and Digitalization
- 4.6 Local Manufacturing and Supply Chain Realignment
- 4.7 Industry Partnerships, Mergers and Acquisitions
- 4.8 Sustainability and Circular Economy Developments
- 4.9 Government and Private Sector Investment Trends
- 4.10 Emerging Business Models and Commercialization
- 4.11 Industry Developments and Announcements
Chapter 5 Asia Pacific Pharmaceutical Analytical Testing Outsourcing Market Supply and Demand Analysis
- 5.1 Demand Trend and Consumption Analysis, 2018-2025
- 5.2 Demand Forecast, 2025-2035
- 5.3 Supply Chain Structure and Procurement Trends
- 5.4 Supply-Demand Gap and Bottlenecks
- 5.5 Import Dependence and Sourcing Structure
- 5.6 Regional Supply and Demand Concentration
Chapter 6 Asia Pacific Pharmaceutical Analytical Testing Outsourcing Market Pricing Analysis
- 6.1 Pricing Structure and Measurement
- 6.2 Historical Pricing Trends, 2018-2025
- 6.3 Pricing Outlook, 2025-2035
- 6.4 Pricing by Product and Market Segment
- 6.5 Geographic Pricing Differences
- 6.6 Key Input, Energy, Labor and Logistics Costs
- 6.7 Contract Pricing and Purchasing Models
- 6.8 Pricing Sensitivity and Competitive Positioning
- 6.9 Price, Margin and Profitability Implications
Chapter 7 Asia Pacific Pharmaceutical Analytical Testing Outsourcing Market Dynamics
- 7.1 Market Growth Drivers
- 7.1.1 Demand-Side Drivers
- 7.1.2 Technology and Innovation Drivers
- 7.1.3 Infrastructure and Investment Drivers
- 7.1.4 Regulatory and Policy Drivers
- 7.2 Market Restraints
- 7.2.1 Cost and Affordability Constraints
- 7.2.2 Technology and Adoption Barriers
- 7.2.3 Supply Chain and Operational Constraints
- 7.3 Market Challenges
- 7.3.1 Competitive Pressure and Margin Erosion
- 7.3.2 Skills, Infrastructure and Implementation Gaps
- 7.4 Emerging Market Opportunities
- 7.5 Market Dynamics Impact and Time-Horizon Assessment
Chapter 8 Asia Pacific Pharmaceutical Analytical Testing Outsourcing Value Chain Analysis
- 8.1 Industry Value Chain Overview
- 8.2 Upstream Suppliers and Critical Inputs
- 8.3 Technology and Component Providers
- 8.4 Manufacturing or Service Delivery
- 8.5 Distribution, Channel Partners and Integrators
- 8.6 Downstream Applications and End Users
- 8.7 Value Addition and Profit Pools
- 8.8 Vertical Integration and Outsourcing
- 8.9 Supplier Concentration and Risk
- 8.10 Supply Chain Localization and Resilience
Chapter 9 Asia Pacific Pharmaceutical Analytical Testing Outsourcing Market Regulations and Policies
- 9.1 Relevant Laws, Standards and Compliance Frameworks
- 9.2 Product, Service, Safety and Quality Requirements
- 9.3 Government Policies, Incentives and Subsidies
- 9.4 Imports, Exports and Trade Barriers
- 9.5 Public Procurement and Local Content Requirements
- 9.6 Data Protection, AI and Cybersecurity Compliance
- 9.7 Upcoming Policy Changes and Market Implications
Chapter 10 Asia Pacific Pharmaceutical Analytical Testing Outsourcing Market Hotspots and Opportunities
- 10.1 Market Opportunity Mapping and Growth Hotspots
- 10.2 High-Growth Applications and Customer Groups
- 10.3 Underserved Markets and White-Space Opportunities
- 10.4 Emerging Technology and Product Opportunities
- 10.5 New Capacity and Investment Hotspots
- 10.6 Market Entry and Expansion Opportunities
- 10.7 Distribution and Partnership Opportunities
- 10.8 Near-Term and Long-Term Commercial Potential
- 10.9 Opportunity Attractiveness and Execution Risks
Chapter 11 Asia Pacific Pharmaceutical Analytical Testing Outsourcing Market Outlook, 2025-2035
- 11.1 Market Size and Analysis
- 11.1.1 Revenue (Market Measurement: 2025: USD 2.20 billion → 2035: USD 5.88 billion)
- 11.1.2 Historical Market Size, 2018-2025
- 11.1.3 Base-Year Market Size, 2025
- 11.2 Market Forecast, 2025-2035
- 11.2.1 Revenue Forecast to 2035
- 11.2.2 CAGR and Year-on-Year Growth
- 11.2.3 Incremental Revenue Opportunity
- 11.3 Forecast Assumptions and Scenario Analysis
- 11.3.1 Base-Case Forecast
- 11.3.2 Optimistic and Conservative Scenarios
- 11.3.3 Technology, Pricing and Policy Sensitivities
- 11.4 Market Attractiveness and Growth Outlook
Chapter 12 Asia Pacific Pharmaceutical Analytical Testing Outsourcing Market Segmentation and Outlook
- 12.1 Segmentation Summary and Market Shares, 2025
- 12.2 Largest and Fastest-Growing Segments
- 12.3 By Service Type - Market Size and Forecast, 2025-2035
- 12.3.1 Segment Definition and Scope
- 12.3.2 Historical Market Size, 2018-2025
- 12.3.3 Revenue Forecast, 2025-2035
- 12.3.4 Base-Year Market Share, 2025
- 12.3.5 Segment CAGR and Growth Drivers
- 12.3.6 Subsegment Market Size and Forecast
- 12.3.6.1 Quality Control and Specialty Testing
- 12.3.6.2 Bioanalytical Testing
- 12.3.6.3 Method Development and Validation
- 12.3.6.4 Stability Testing
- 12.3.7 Subsegment Pricing and Adoption Trends
- 12.3.8 Leading Suppliers and Competition
- 12.3.9 Regional Demand and Opportunities
- 12.4 By Customer Type - Market Size and Forecast, 2025-2035
- 12.4.1 Segment Definition and Scope
- 12.4.2 Historical Market Size, 2018-2025
- 12.4.3 Revenue Forecast, 2025-2035
- 12.4.4 Base-Year Market Share, 2025
- 12.4.5 Segment CAGR and Growth Drivers
- 12.4.6 Subsegment Market Size and Forecast
- 12.4.6.1 Pharmaceutical Companies
- 12.4.6.2 Biopharmaceutical Companies
- 12.4.6.3 Contract Manufacturing Organizations
- 12.4.6.4 Academic and Government Research Buyers
- 12.4.7 Subsegment Pricing and Adoption Trends
- 12.4.8 Leading Suppliers and Competition
- 12.4.9 Regional Demand and Opportunities
- 12.5 By Application - Market Size and Forecast, 2025-2035
- 12.5.1 Segment Definition and Scope
- 12.5.2 Historical Market Size, 2018-2025
- 12.5.3 Revenue Forecast, 2025-2035
- 12.5.4 Base-Year Market Share, 2025
- 12.5.5 Segment CAGR and Growth Drivers
- 12.5.6 Subsegment Market Size and Forecast
- 12.5.6.1 Early Development
- 12.5.6.2 Clinical Development
- 12.5.6.3 Registration Support
- 12.5.6.4 Commercial Quality Control
- 12.5.7 Subsegment Pricing and Adoption Trends
- 12.5.8 Leading Suppliers and Competition
- 12.5.9 Regional Demand and Opportunities
- 12.6 By Operating Model - Market Size and Forecast, 2025-2035
- 12.6.1 Segment Definition and Scope
- 12.6.2 Historical Market Size, 2018-2025
- 12.6.3 Revenue Forecast, 2025-2035
- 12.6.4 Base-Year Market Share, 2025
- 12.6.5 Segment CAGR and Growth Drivers
- 12.6.6 Subsegment Market Size and Forecast
- 12.6.6.1 Transactional Laboratory Services
- 12.6.6.2 Managed Testing Programs
- 12.6.6.3 Dedicated Outsourced Teams
- 12.6.7 Subsegment Pricing and Adoption Trends
- 12.6.8 Leading Suppliers and Competition
- 12.6.9 Regional Demand and Opportunities
- 12.7 By Subregion - Market Size and Forecast, 2025-2035
- 12.7.1 Segment Definition and Scope
- 12.7.2 Historical Market Size, 2018-2025
- 12.7.3 Revenue Forecast, 2025-2035
- 12.7.4 Base-Year Market Share, 2025
- 12.7.5 Segment CAGR and Growth Drivers
- 12.7.6 Subsegment Market Size and Forecast
- 12.7.6.1 East Asia
- 12.7.6.2 South Asia
- 12.7.6.3 Southeast Asia
- 12.7.6.4 Oceania
- 12.7.7 Subsegment Pricing and Adoption Trends
- 12.7.8 Leading Suppliers and Competition
- 12.7.9 Regional Demand and Opportunities
- 12.8 Segment Growth Comparison
- 12.9 Segment Attractiveness and Priority Matrix
Chapter 13 Asia Pacific Pharmaceutical Analytical Testing Outsourcing End-Use and Application Market Outlook
- 13.1 End-Use Industry and Customer Demand Structure
- 13.2 Leading Applications and Customer Groups
- 13.3 End-Use Market Size, Share and Forecast
- 13.4 Major End-Use Industry Deep Dives
- 13.4.1 Customer Requirements and Use Cases
- 13.4.2 Demand and Replacement Cycles
- 13.4.3 Technical and Regulatory Considerations
- 13.4.4 Purchasing and Procurement Models
- 13.4.5 Leading Vendors and Distribution Channels
- 13.4.6 Forecast and Commercial Opportunities
- 13.5 Emerging Applications and Cross-Segment Demand
- 13.6 End-Use Industry Investment Priorities
Chapter 14 Asia Pacific Pharmaceutical Analytical Testing Outsourcing Geographic Market Outlook, 2025-2035
- 14.1 Regional Market Size and Country-Level Shares, 2025
- 14.2 Country Market Size Comparison, 2025
- 14.3 Country Market Forecasts, 2025-2035
- 14.4 Subregional Industrial and Demand Clusters
- 14.5 Intra-Regional Pricing and Cost Differences
- 14.6 Cross-Border Trade and Supply Networks
- 14.7 Regional Supply and Demand Balances
- 14.8 Country Opportunity Comparison and Prioritization
Note: Every listed country is covered on the structure shown under the first country.
Chapter 15 Asia Pacific Pharmaceutical Analytical Testing Outsourcing Technology, Innovation and Sustainability Outlook
- 15.1 Technology Landscape and Maturity
- 15.2 Product, Process and Service Innovation
- 15.3 AI, Automation and Digital Tools in the Industry
- 15.4 Technology Adoption and Performance Benchmarking
- 15.5 Innovation Pipeline and R&D Investment
- 15.6 Energy Efficiency and Resource Management
- 15.7 Sustainability, Recycling and Circularity
- 15.8 Technology Roadmap, 2025-2035
- 15.9 Risks of Obsolescence and Technology Substitution
Chapter 16 Asia Pacific Pharmaceutical Analytical Testing Outsourcing Market Key Strategic Imperatives
- 16.1 Growth and Market Entry Priorities
- 16.2 High-Return Products and Segments
- 16.3 Pricing, Profitability and Cost Optimization
- 16.4 Technology Investment and Product Differentiation
- 16.5 Supply Chain Localization and Resilience
- 16.6 Distribution and Customer Acquisition
- 16.7 Partnership, Acquisition and Capacity Strategy
- 16.8 Regional Expansion Priorities
- 16.9 Short-, Medium- and Long-Term Actions
Chapter 17 Competition Outlook
- 17.1 Industry Competition Characteristics
- 17.2 Market Structure and Concentration
- 17.3 Market Share and Competitive Positioning, 2025
- 17.4 Company-Wise Revenue and Product Benchmarking
- 17.5 Production and Service Capacity Benchmarking
- 17.6 Technology, Pricing and Differentiation
- 17.7 Regional Footprint and Distribution Strength
- 17.8 Mergers, Acquisitions and Strategic Alliances
- 17.9 New Entrants and Competitive Threats
- 17.10 Porter's Five Forces and Industry Attractiveness
- 17.11 Competitive Outlook, 2025-2035
Chapter 18 Company Profiles
- 18.1 Company Coverage and Selection Criteria
- 18.2 WuXi AppTec
- 18.2.1 Business Description
- 18.2.2 Company Ownership and Geographic Presence
- 18.2.3 Product and Service Portfolio
- 18.2.4 Manufacturing and Operating Footprint
- 18.2.5 Financial Performance and Investment
- 18.2.6 Market Share and Competitive Position
- 18.2.7 Technology and Innovation Capabilities
- 18.2.8 Strategic Alliances or Partnerships
- 18.2.9 Recent Developments
- 18.2.10 Growth Strategy and Outlook
- 18.3 Pharmaron
- 18.4 Eurofins Scientific
- 18.5 Syngene International
- 18.6 SGS
- 18.7 Tigermed
- 18.8 Charles River Laboratories
- 18.9 Intertek
- 18.10 VIMTA Labs
- 18.11 Lambda Therapeutic Research
- 18.12 Other Relevant Market Participants
Note: Every listed company is profiled on the structure shown under the first company. The company list is preliminary and may change based on research findings, market developments, data availability and client requirements.
Chapter 19 Disclaimer
- 19.1 Research and Forecast Disclaimer
- 19.2 Data Source and Estimation Limitations
Note: The depth of individual sections depends on data availability for this market. Volume, capacity, trade and other unit-based metrics are included where applicable.

