Theranostics move isotope spending beyond diagnostic scans
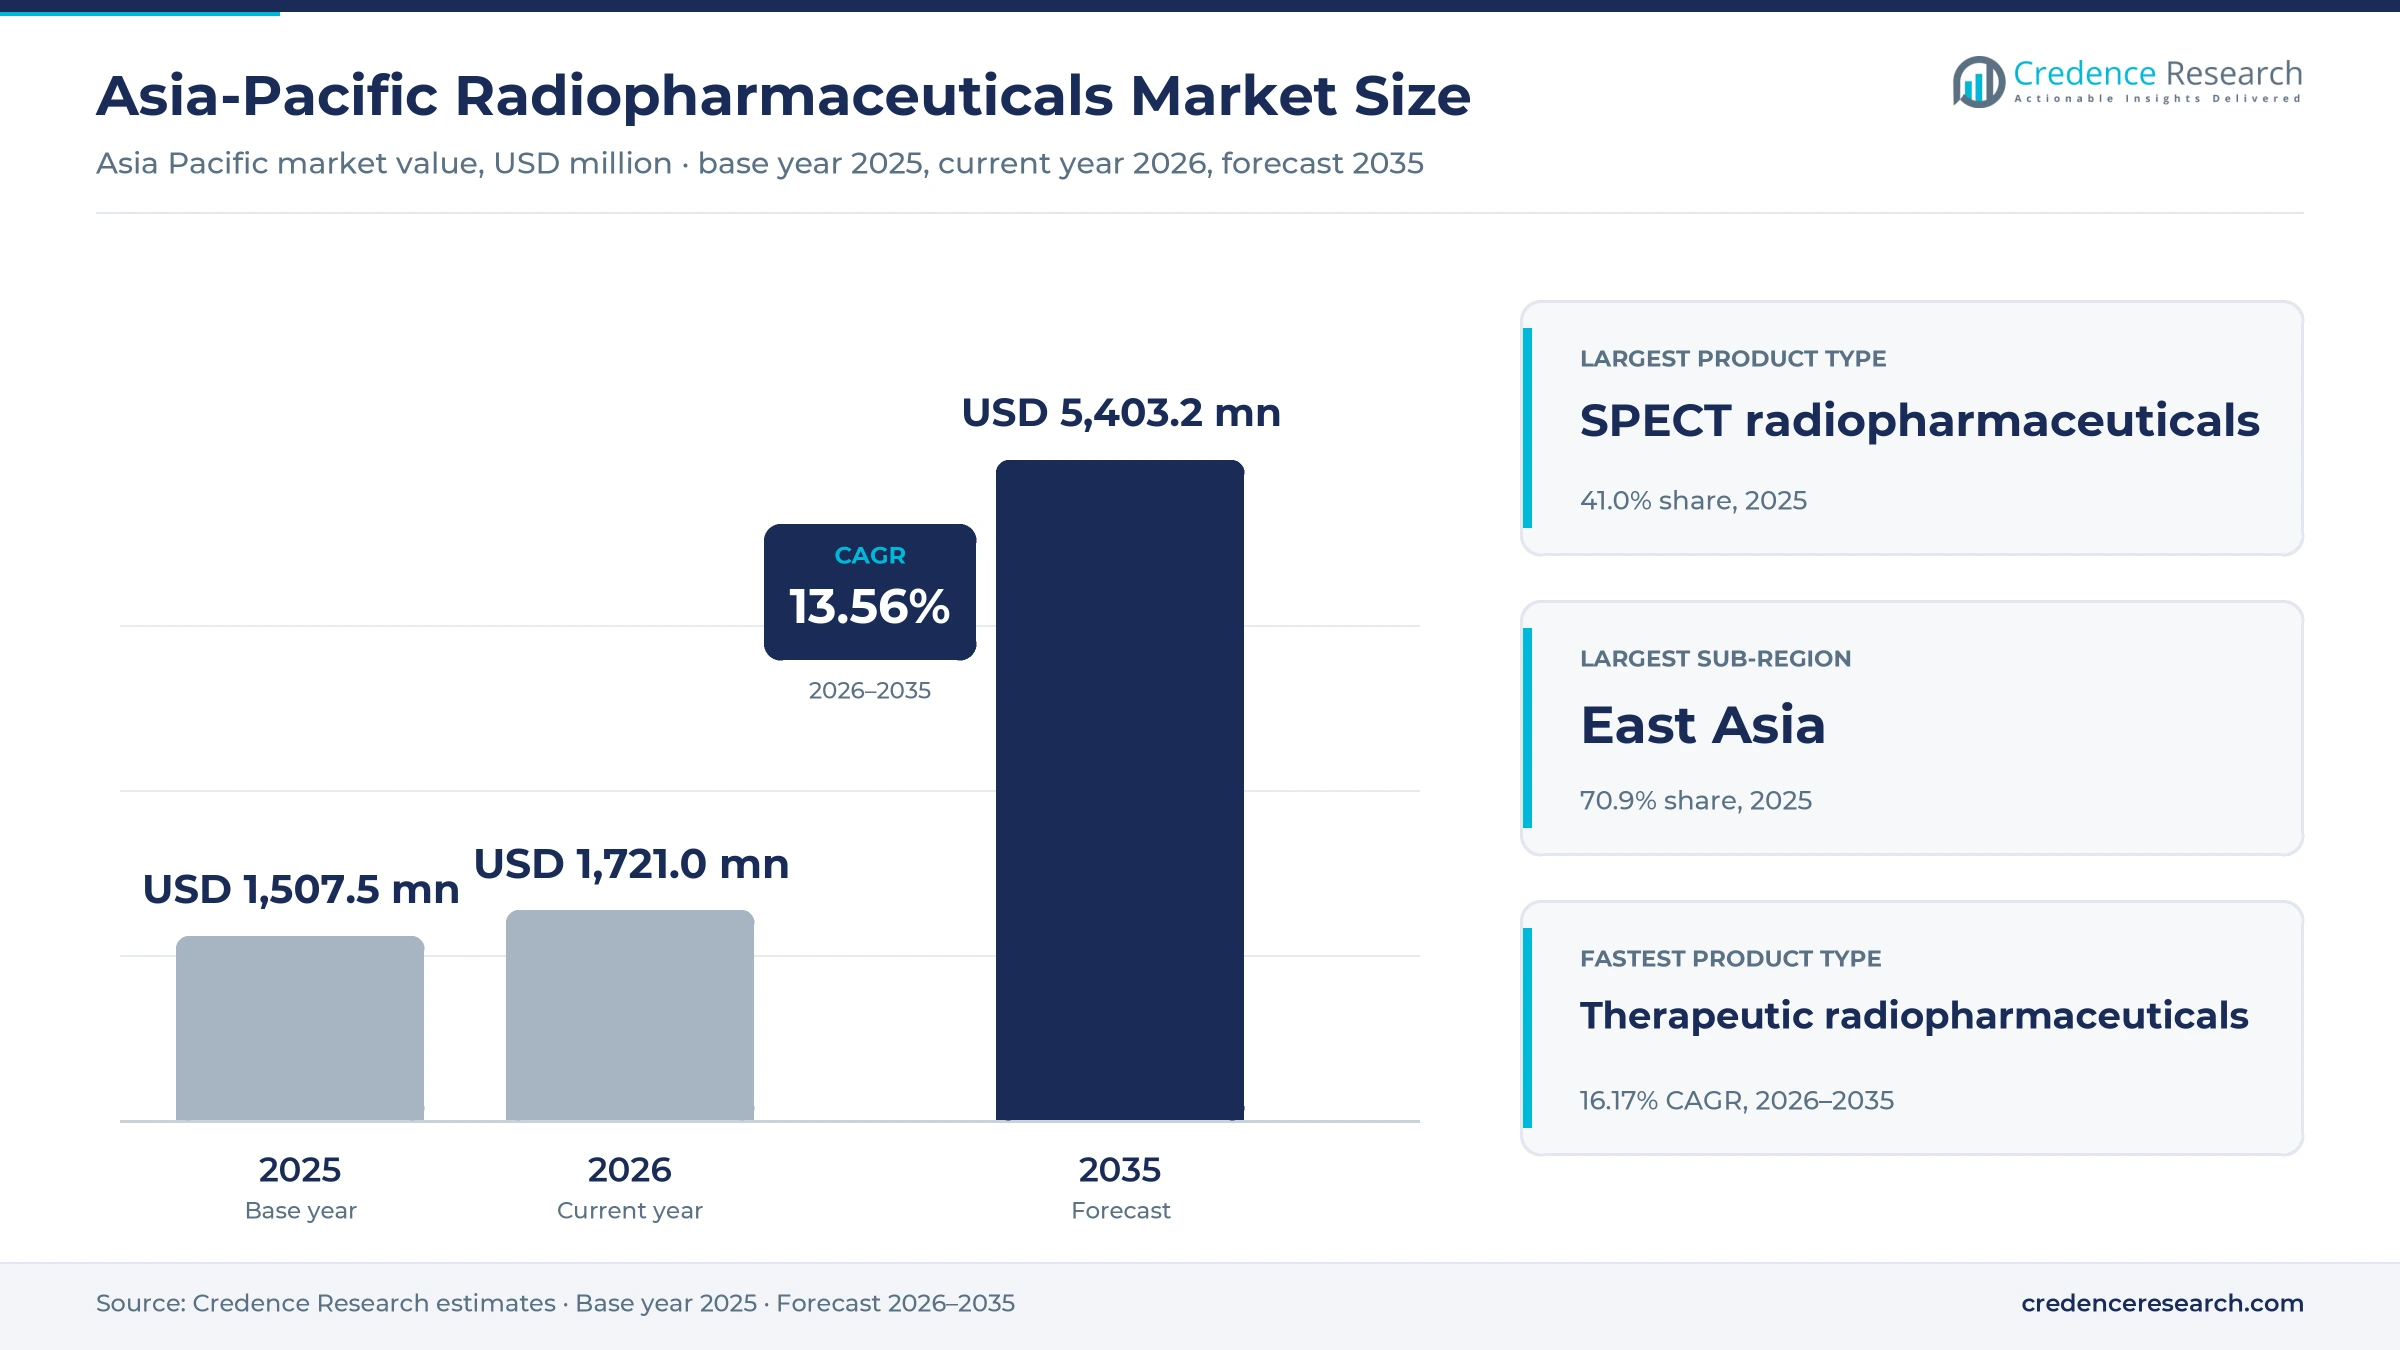
The Asia-Pacific radiopharmaceuticals market was valued at USD 1.51 billion in 2025 and is projected to increase from USD 1.72 billion in 2026 to USD 5.40 billion by 2035, registering a CAGR of 13.56% during 2026–2035. Demand comes from hospitals and imaging centers that buy technetium-99m generators, fluorine-18 PET tracers and lutetium-177 or radium-223 therapies for cancer, heart and brain disease. East Asia held the largest sub-regional share, 70.9% in 2025, because China, Japan and South Korea run the region's largest networks of PET and SPECT cameras and pay for most scans through public insurance. South Asia is the fastest-growing sub-region at 15.08% a year, as India adds PET-CT capacity and domestic lutetium-177 supply from a low base. The approval of the first prostate cancer radioligand therapy in Japan in September 2025 and in China in November 2025 has also moved spending toward high-value therapeutic doses.
Which products and buyers are counted?
The estimate measures spending on radioactive drugs used to diagnose and treat disease across Asia Pacific. It covers SPECT agents such as technetium-99m kits and generators, PET tracers such as fluorine-18 FDG and gallium-68 PSMA kits, therapeutic agents such as iodine-131, radium-223 and lutetium-177 compounds, and specialty diagnostic preparations such as carbon-14 breath tests. Values are measured at the price paid by hospitals, imaging centers and insurers for finished doses.
The estimate excludes PET and SPECT cameras, cyclotrons sold as equipment, industrial and research isotopes, and physician or scan fees. The value chain runs from research reactors, cyclotrons and generator plants through manufacturers, licensed distributors and radiopharmacies to nuclear medicine departments in East Asia, South Asia, Southeast Asia and Oceania.
Asia-Pacific Radiopharmaceuticals Market Insights
- The Asia-Pacific radiopharmaceuticals market was valued at USD 1.51 billion in 2025 and is projected to reach USD 5.40 billion by 2035, registering a CAGR of 13.56% during 2026–2035.
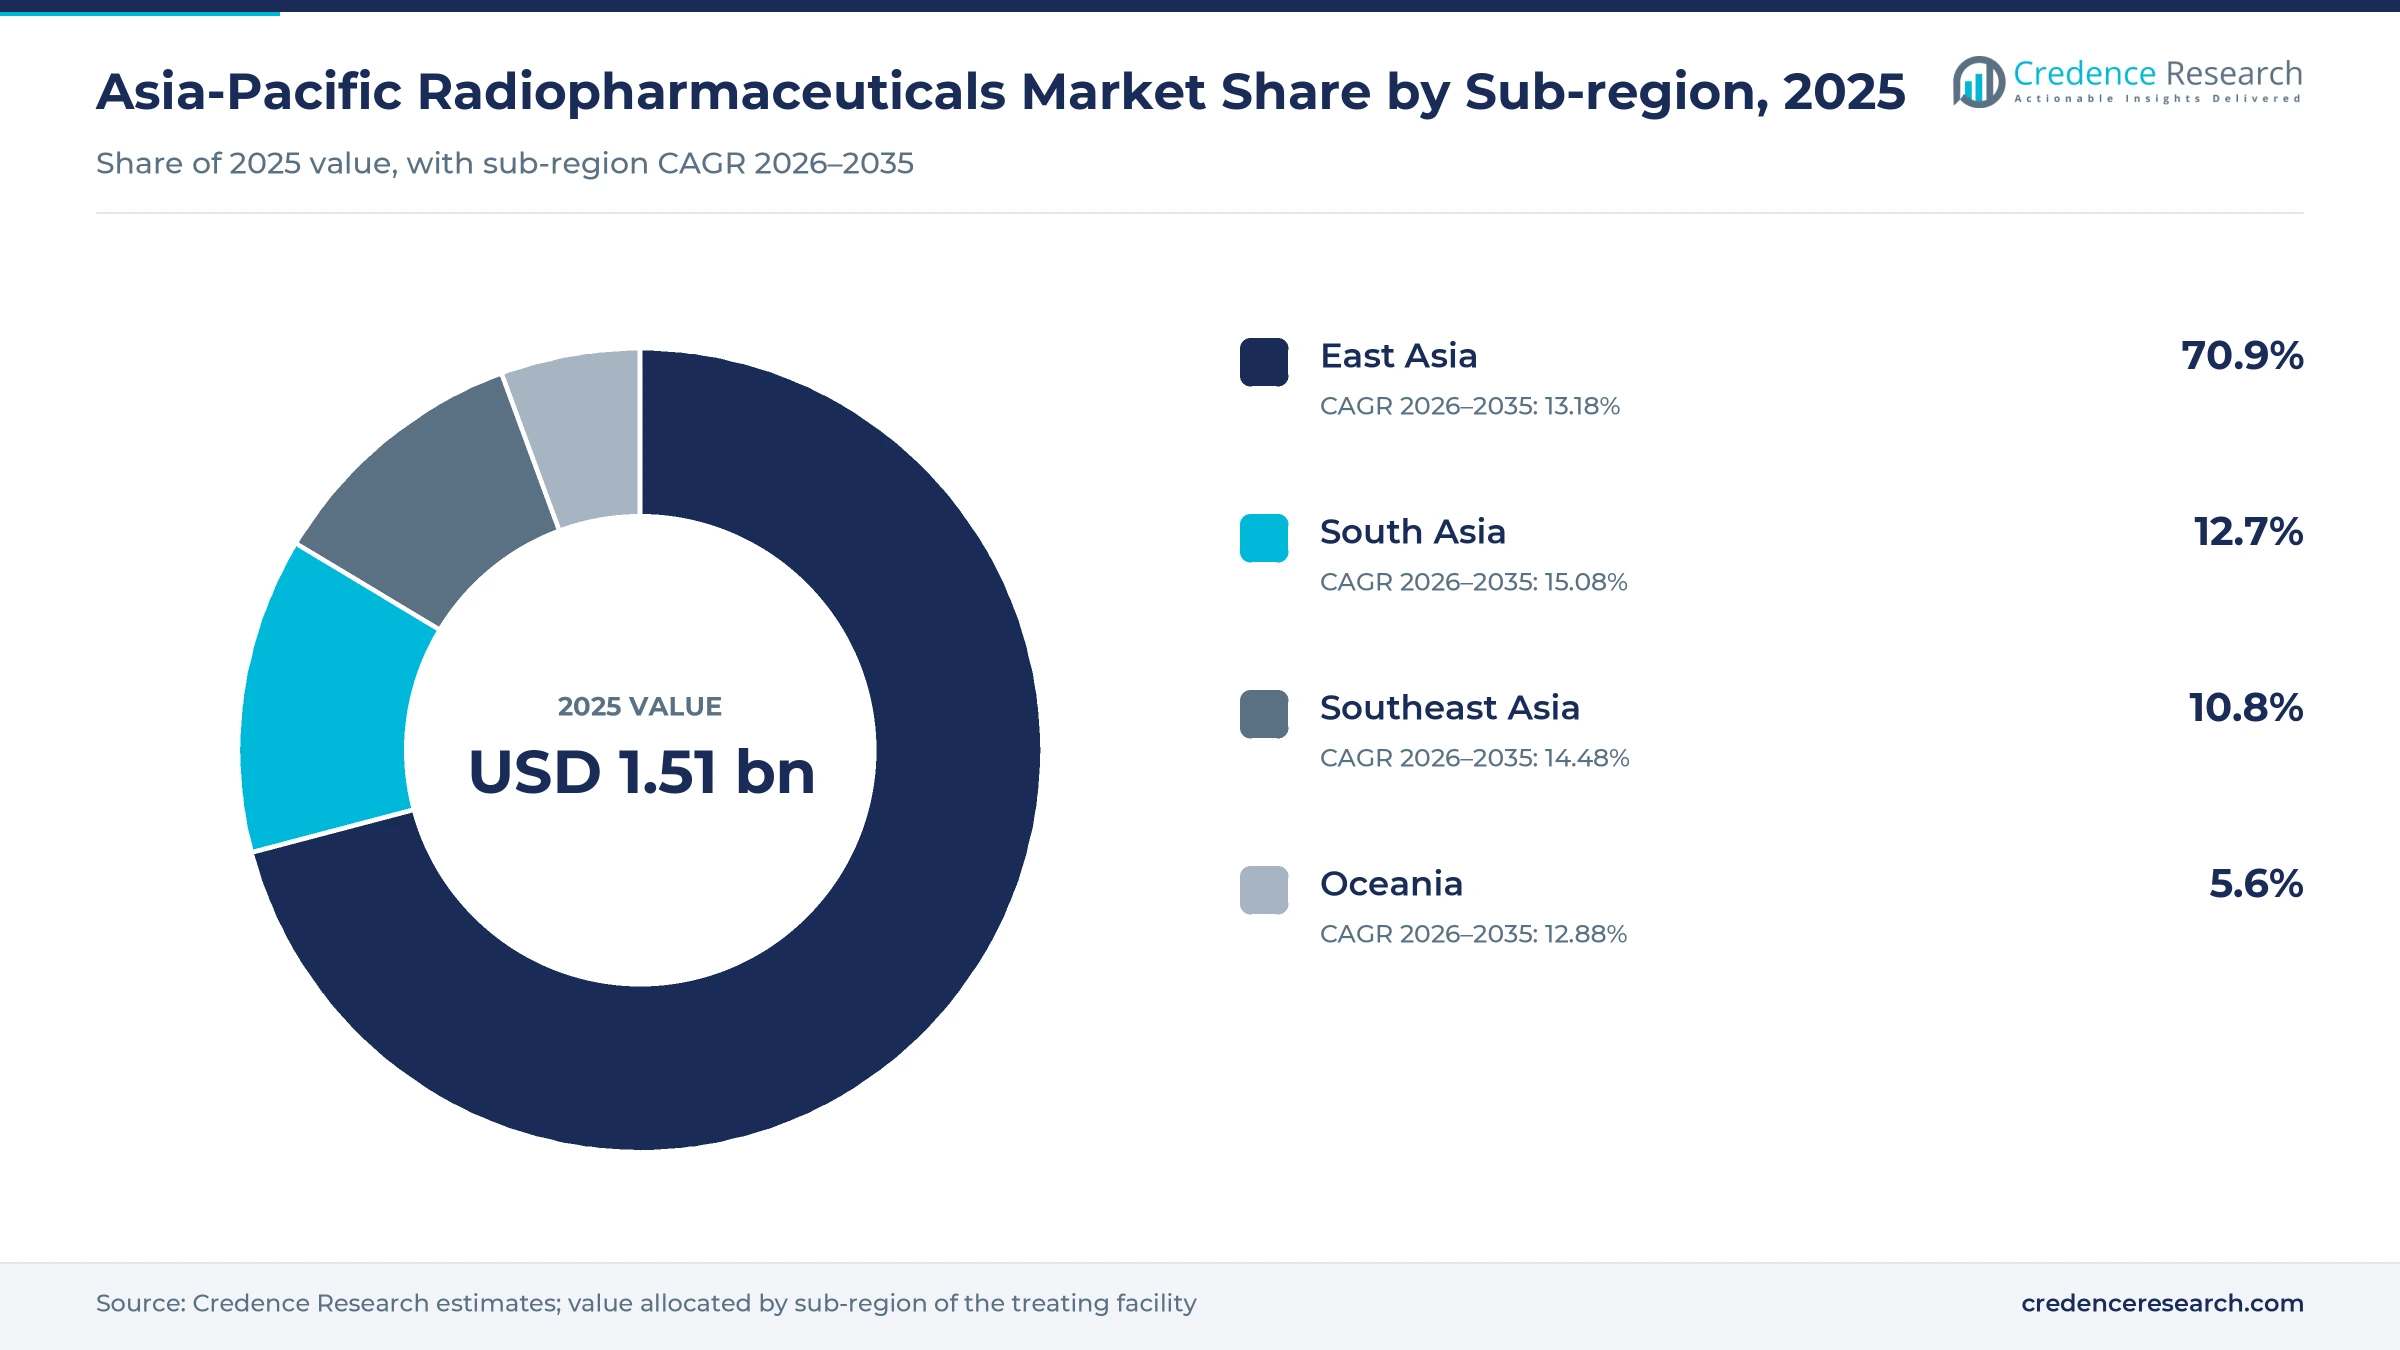
- East Asia held a 70.9% share of 2025 value, because China, Japan and South Korea run the largest PET and SPECT networks in the region.
- SPECT radiopharmaceuticals led product types with a 41.0% share of 2025 value, as technetium-99m scans remain the routine workhorse of nuclear medicine.
- Japan approved the lutetium-177 prostate cancer therapy Pluvicto in September 2025, and China approved it in November 2025 as its first radioligand therapy.
- GE HealthCare took full ownership of Nihon Medi-Physics in March 2025, while Novartis builds radioligand plants at Sasayama in Japan and Haiyan in China.
Therapeutic doses grow fastest while SPECT still leads
Why do therapeutic radiopharmaceuticals grow fastest?
Based on product type, the market is categorized into SPECT Radiopharmaceuticals, PET Radiopharmaceuticals, Therapeutic Radiopharmaceuticals and Specialty Diagnostic Preparations. SPECT Radiopharmaceuticals led with a 41.0% share of 2025 value, because single-photon scans still dominate routine imaging. China recorded 2,716,806 single-photon examinations in 2023 against 1,381,758 PET scans, according to the Chinese Society of Nuclear Medicine survey published in February 2025. Therapeutic Radiopharmaceuticals grow fastest at 16.17% a year, as Japan approved Pluvicto on Sept. 19, 2025, and China approved it in November 2025 as its first radioligand therapy, according to Novartis and City News Service.
How does generator-derived technetium keep the largest share?
Based on technology, the market is categorized into Generator-Derived Production, Cyclotron-Derived Production and Direct Reactor-Derived Production. Generator-Derived Production led with a 50.0% share of 2025 value, because technetium-99m from molybdenum-99 generators is used in an estimated 80% to 85% of nuclear medicine procedures, according to the OECD Nuclear Energy Agency in October 2025. Direct Reactor-Derived Production grows fastest at 15.72% a year, as CNNC reported commercial lutetium-177 production at Qinshan in July 2025 with annual capacity above 10,000 curies, according to Nuclear Engineering International.
Where does neurology add new imaging demand?
Based on disease area, the market is categorized into Oncology, Cardiology, Neurology and Non-Oncologic Systemic Disorders. Oncology led with a 60.0% share of 2025 value, because tumor imaging accounted for 93.78% of China's PET and PET/CT examinations in 2023, and prostate cancer radioligand therapy now adds treatment value. Neurology grows fastest at 15.96% a year, as Japan's Central Social Insurance Medical Council approved coverage on Nov. 22, 2023, for a PET imaging device and spinal fluid tests that select patients for the Alzheimer's drug Leqembi, according to Pharma Japan.
How do radiopharmacy networks reach hospitals without a cyclotron?
Based on channel, the market is categorized into Direct Manufacturer Supply, Licensed Distributor Supply and Radiopharmacy Network Supply. Direct Manufacturer Supply led with a 44.0% share of 2025 value, because short half-lives favor producers that ship straight to hospitals, and ANSTO alone supplies roughly 75% to 80% of the nuclear medicine used in Australia, according to World Nuclear News in October 2023. Radiopharmacy Network Supply grows fastest at 14.83% a year, as China had 148 cyclotrons in 140 institutions in 2023 while 697 institutions used positron drugs, according to the Chinese Society of Nuclear Medicine, so most PET sites buy unit doses from regional radiopharmacies.
| Segment Group | Leading Sub-segment | Share, 2025 | Fastest-growing Sub-segment | CAGR, 2026–2035 |
|---|---|---|---|---|
| By Product Type | SPECT Radiopharmaceuticals | 41.0% | Therapeutic Radiopharmaceuticals | 16.17% |
| By Technology | Generator-Derived Production | 50.0% | Direct Reactor-Derived Production | 15.72% |
| By Disease Area | Oncology | 60.0% | Neurology | 15.96% |
| By Channel | Direct Manufacturer Supply | 44.0% | Radiopharmacy Network Supply | 14.83% |
Request a Free Sample
Fill in your details and we'll send you a free sample report.
- Sample data tables & charts
- Research methodology
Approvals, scanners and isotope plants lift dose volumes
How does theranostic treatment access widen the patient pool?
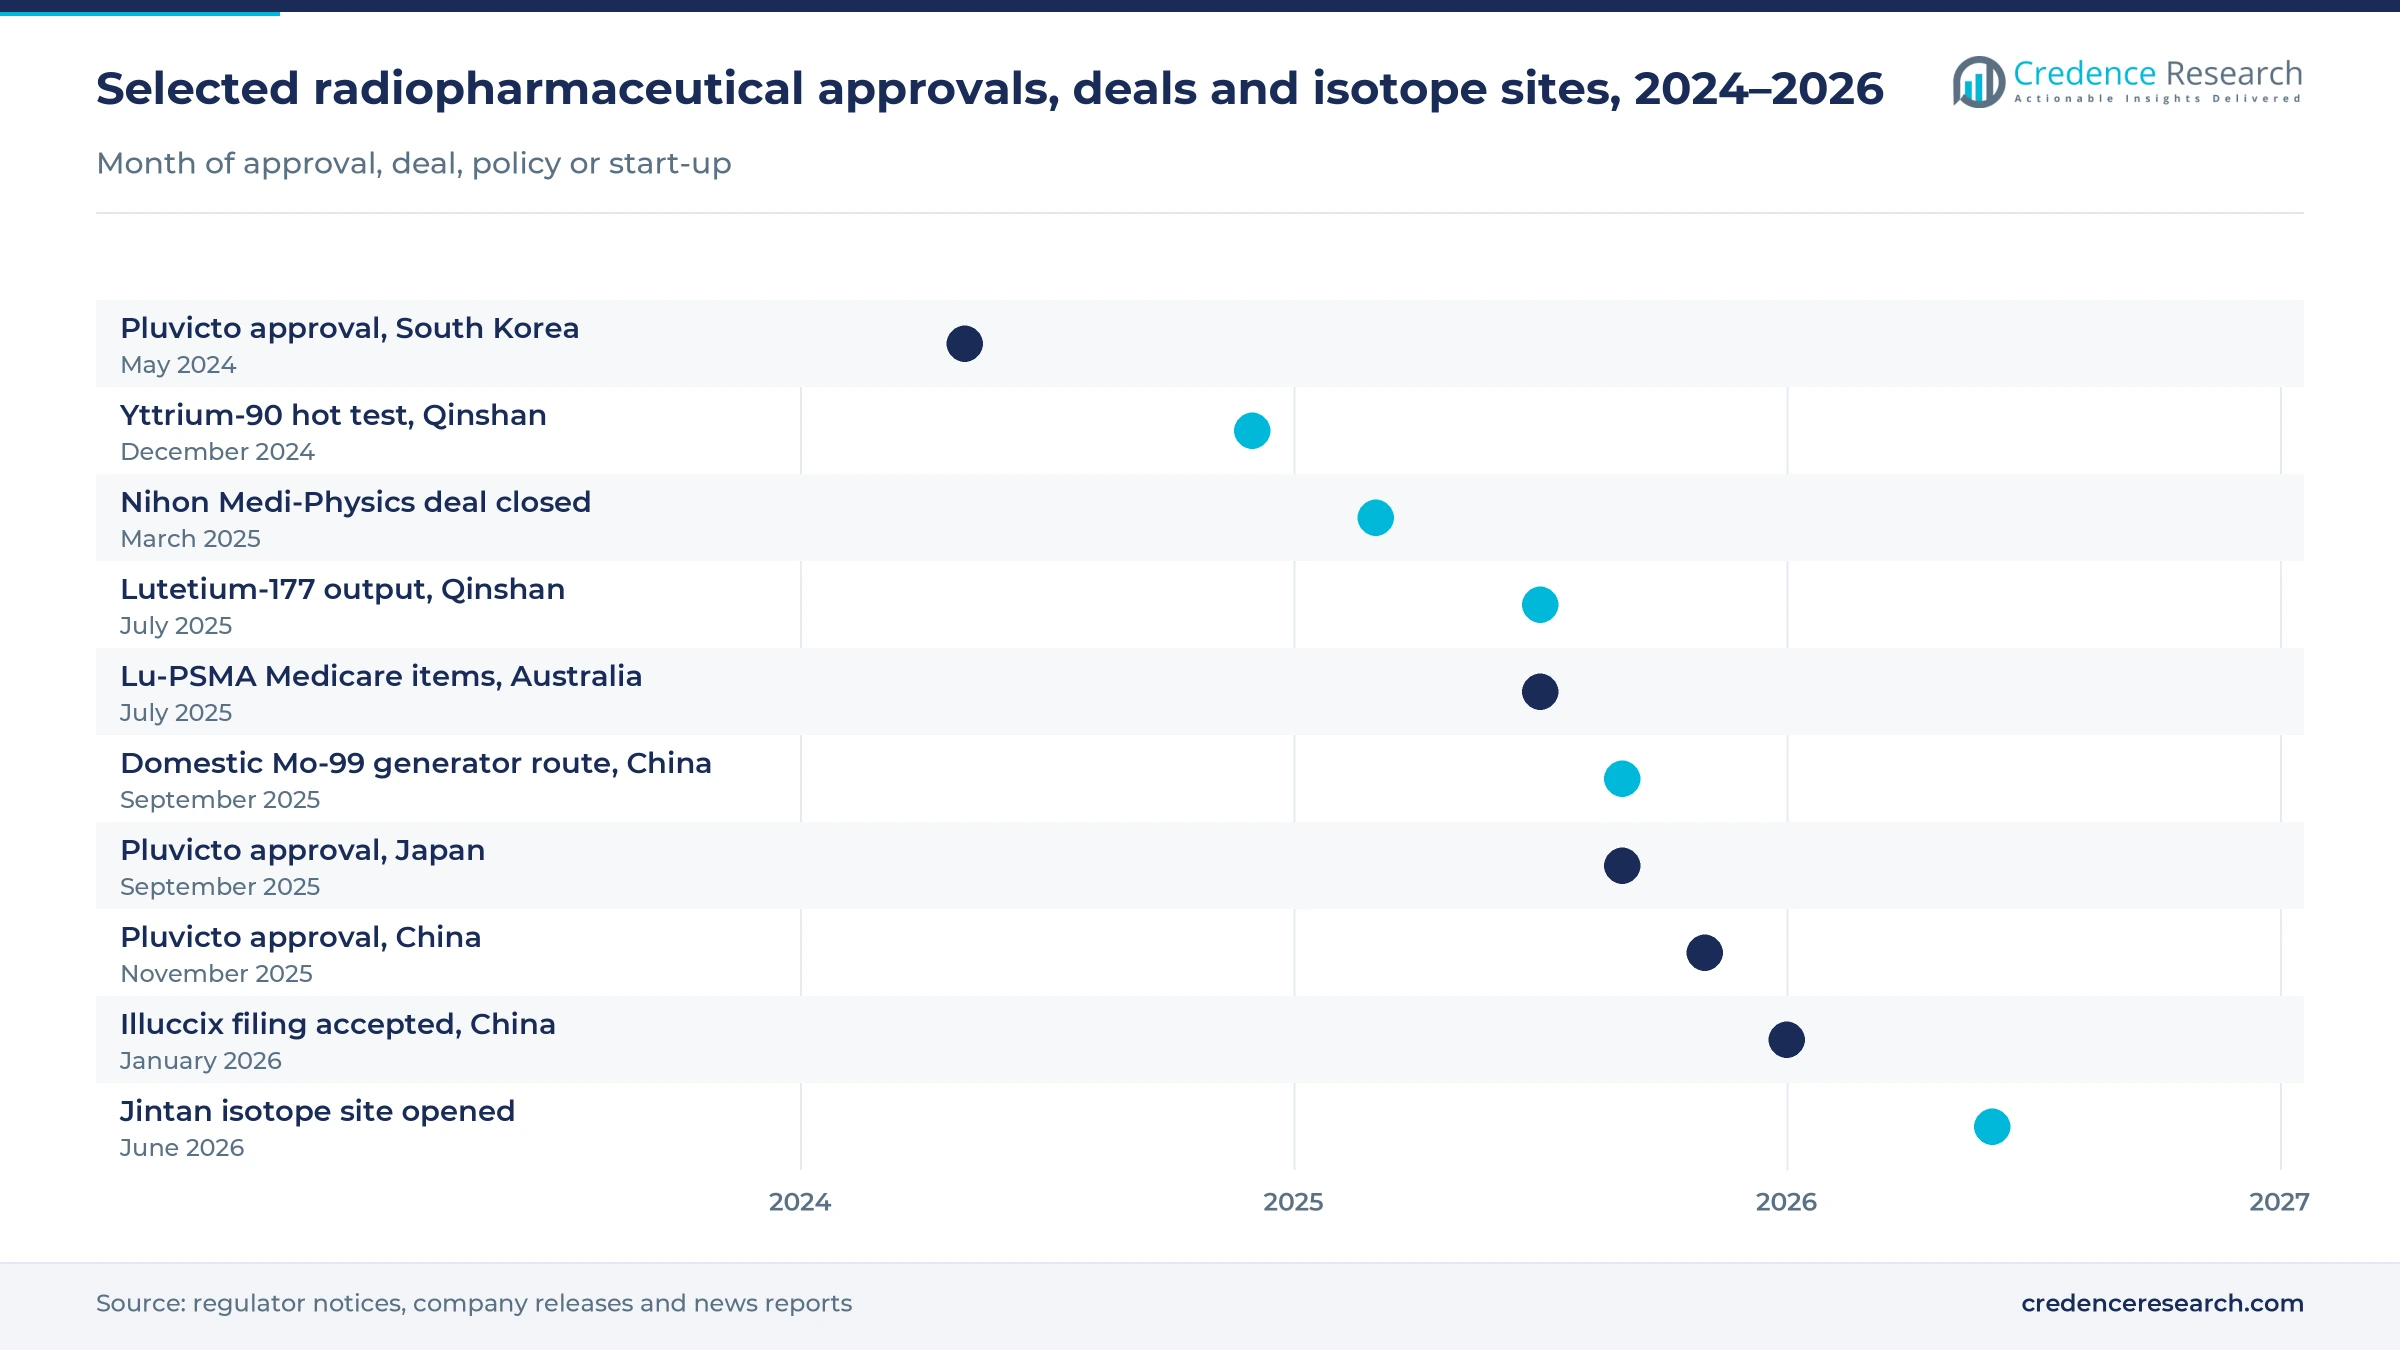
Regulators across East Asia cleared the first lutetium-177 prostate cancer therapy within 18 months, which opened a new class of high-value doses. South Korea's Ministry of Food and Drug Safety approved Pluvicto as an orphan drug on May 29, 2024, according to Daily Pharm. Japan approved it on Sept. 19, 2025, together with the Locametz PSMA imaging kit and a germanium-68 to gallium-68 generator, according to Novartis Japan, which put new prostate cancer diagnoses at about 95,000 a year. China followed in November 2025, and Shanghai Pudong Hospital gave its first dose in early 2026 at roughly 60% to 70% of Western prices, according to City News Service. As a result, therapeutic radiopharmaceuticals grow at 16.17% a year.
Why does diagnostic network expansion lift daily dose orders?
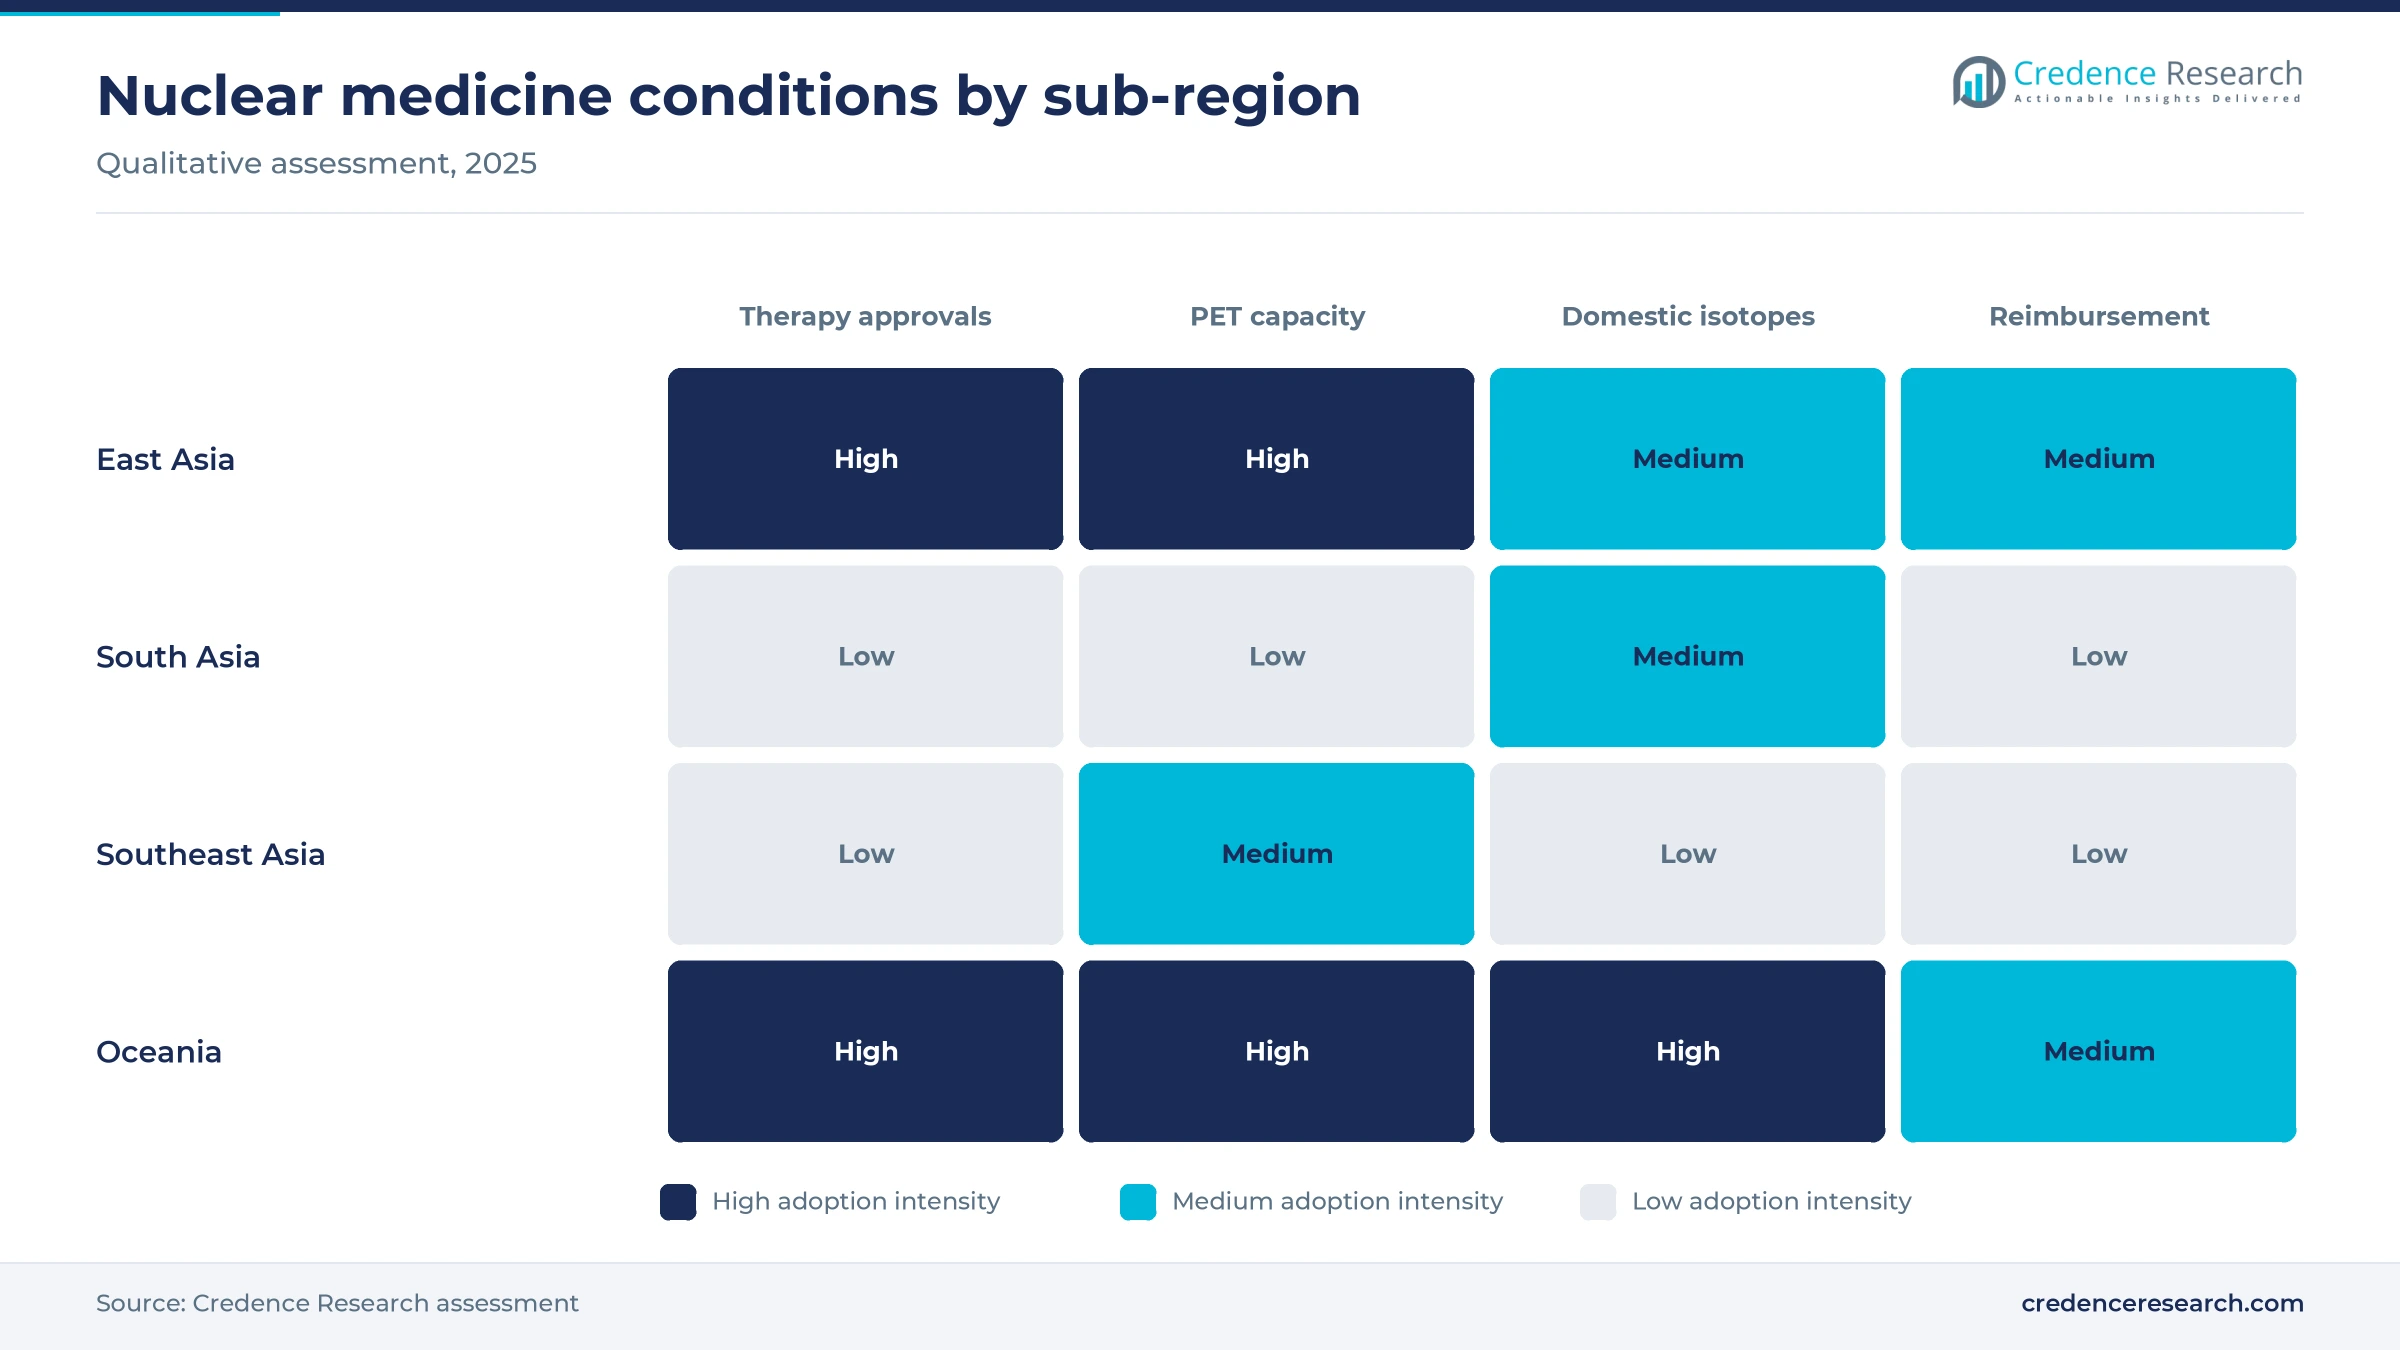
PET and SPECT capacity is expanding fastest in China and India, which widens the base of hospitals that order diagnostic doses every day. China counted 772 positron imaging units in 2023, up 80.8% from 427 in 2019, and PET examinations rose 62.6%, according to the Chinese Society of Nuclear Medicine. India had 442 nuclear medicine centers, 359 PET-CT scanners and 24 medical cyclotrons in 2023, according to the Indian Journal of Nuclear Medicine. In Malaysia, Precious Medical Group committed RM500 million to a Johor cancer center with PET-CT and a planned on-site cyclotron, according to BioSpectrum Asia in November 2025. In turn, PET radiopharmaceuticals gain volume as new PET-CT scanners reach secondary cities.
How are integrated supplier platforms changing the region?
Large suppliers are buying or building integrated manufacturing and distribution platforms, which shortens the path from isotope to patient. GE HealthCare completed the purchase of the remaining 50% of Nihon Medi-Physics from Sumitomo Chemical in March 2025, taking full control of a Japanese SPECT and PET tracer maker, according to Business Wire. Novartis said it is investing about USD 100 million in a radioligand plant at Sasayama in Japan, targeted for fiscal 2026, and Fierce Pharma reported more than 600 million yuan for its plant at Haiyan in Zhejiang. China Isotope & Radiation Corporation also signed a commercial agreement in January 2026 to distribute Pluvicto in mainland China, according to FLCube. As a result, direct manufacturer supply keeps 44.0% of 2025 value.
How does isotope self-sufficiency policy lift local output?
Governments are funding domestic isotope production to cut dependence on a few foreign reactors, which secures supply for local drug makers. China's eight-agency medical isotope plan of June 2021 noted that technetium-99m was entirely imported and only about 5% of lutetium-177 came from domestic output, according to Yicai. CNNC then reported a fully domestic reactor route for molybdenum-99 generators in September 2025, with average generator activity raised from 1.5 Ci to 4.5 Ci, according to China Daily. Japan's Atomic Energy Commission set a target in May 2022 to produce about 30% of domestic molybdenum-99 demand by the end of fiscal 2027. In turn, direct reactor-derived production grows at 15.72% a year across the medical isotope supply chain.
PET companions and new isotope sources reshape supply
How are companion PET kits shifting the launch model?
Theranostic pairs are emerging as the standard launch model, because each therapy needs a matching PET scan to select patients. Japan approved Pluvicto in September 2025 alongside the Locametz kit and the Galliapharm generator that makes gallium-68 on site. Telix and Grand Pharma announced on Jan. 20, 2026, that China's drug evaluation center had accepted their Illuccix gallium-68 PSMA-11 kit application, after a Chinese Phase 3 study showed a 94.8% positive predictive value, according to Telix. Telix also cited more than 134,000 Chinese men diagnosed with prostate cancer in 2022. In turn, theranostic agent pairs lift gallium-68 PET volumes alongside lutetium-177 therapy.
Why are alpha emitters and new isotopes shifting supply to Asia?
Production of therapy isotopes is shifting from European reactors toward new Asian sites. Hong Kong's Asia Advanced Isotope Technology plans an actinium-225 plant worth about HK$600 million at Tai Po InnoPark, with output from 2027, according to Caixin in October 2025. Eckert & Ziegler and DongCheng Pharma opened their joint Jintan site in Changzhou in June 2026, starting with germanium-68 in early 2027 and planning actinium-225 in a second phase, according to Eckert & Ziegler. CNNC also completed a yttrium-90 hot test at Qinshan on Dec. 14, 2024, according to World Nuclear News. As a result, Asian drug makers gain local sources for alpha and beta therapies.
Can India's scanner gap open room for new suppliers?
India offers the largest capacity gap in the region, because its scanner density remains far below North Asian levels. The Indian Journal of Nuclear Medicine estimated in October 2023 that India needs about 1,000 more PET-CT scanners over 10 years to reach 1.0 per million people, against about 4.0 per million in Japan. Minister Jitendra Singh told the Lok Sabha on July 30, 2025, that more than 500 nuclear medicine facilities operate across government and private sectors. The government has also acknowledged a 10% to 15% shortfall in isotopes such as lutetium-177, with a new public-private reactor expected only by 2035, according to Lokmat Times. As a result, South Asia is the fastest-growing sub-region in the forecast.
Is there an opening in earlier prostate cancer therapy in Australia?
Wider funding of lutetium-177 PSMA therapy in Australia could open a much larger patient group. Medicare items for the therapy took effect in July 2025 but cover only patients who have had taxane chemotherapy, according to The Limbic in June 2026. Novartis has applied to the Medical Services Advisory Committee to extend funding to taxane-naive patients, and the application published by MSAC estimates about 4,000 men with metastatic castration-resistant disease and 1,200 treated patients in the first full year. Telix's Illuccix has held TGA approval since November 2021, so PSMA PET selection is already in place. In turn, care for castration-resistant prostate cancer moves toward earlier radioligand use, which supports Oceania growth of 12.88% a year.
Reactor outages, staff gaps and therapy rooms limit use
How exposed is generator supply to reactor outages?
Molybdenum-99 still comes from a small group of aging reactors, which exposes generator users to sudden shortages. Six research reactors supply about 95% of global molybdenum-99, and the HFR research reactor shut down unexpectedly in October 2024, worsening shortages, according to the OECD Nuclear Energy Agency. South Korea still imports molybdenum-99 while its KRW 765 billion Kijang reactor awaits full operation in 2027, according to World Nuclear News. Hospitals respond by rescheduling scans and holding backup supply contracts.
Why do staff shortages slow the use of new cameras?
Shortages of trained staff limit how fast new cameras and therapies can be used, because every dose needs licensed handling. In the Chinese Society of Nuclear Medicine's 2024 national survey, 66% of departments cited a shortage of specialists and 59% cited regional economic limits, even though staff numbers rose 24.6% from 2019 to 15,677. In turn, new scanners in smaller Chinese cities can run below capacity for years. Professional societies and suppliers respond with training programs and shared regional dose services.
What limits inpatient radionuclide treatment in Japan?
Shielded rooms for high-dose therapy are scarce, which delays radioligand and radioiodine treatment. Japan had only 160 radionuclide therapy admission rooms in 2022, up from 157 five years earlier, and targeted radionuclide therapy fell 17.7% over that period, according to the ninth nationwide survey. Japan's Atomic Energy Commission recorded an average wait of 3.8 months for radioisotope treatment in 2018 in its May 2022 action plan. Hospitals respond by moving suitable patients to outpatient dosing where rules allow it.
Why do reimbursement gaps hold back costly therapy doses?
Partial or missing reimbursement keeps many eligible patients from new therapies, which slows the uptake of costly doses. Pluvicto remained a non-reimbursed treatment in South Korea in December 2025, about 19 months after its May 2024 approval, according to Asia Economy. In China, Pluvicto was not yet on the national reimbursement list in January 2026, when FLCube reported that listing talks could follow in 2026. As a result, self-paying patients carry much of the cost. Companies respond with reimbursement filings, patient support schemes and price agreements with insurers.
East Asia leads while South Asia grows fastest
| Sub-region | Value, 2025 (USD billion) | Share, 2025 | CAGR, 2026–2035 |
|---|---|---|---|
| East Asia | 1.07 | 70.9% | 13.18% |
| South Asia | 0.19 | 12.7% | 15.08% |
| Southeast Asia | 0.16 | 10.8% | 14.48% |
| Oceania | 0.08 | 5.6% | 12.88% |
Why does East Asia hold the largest share?
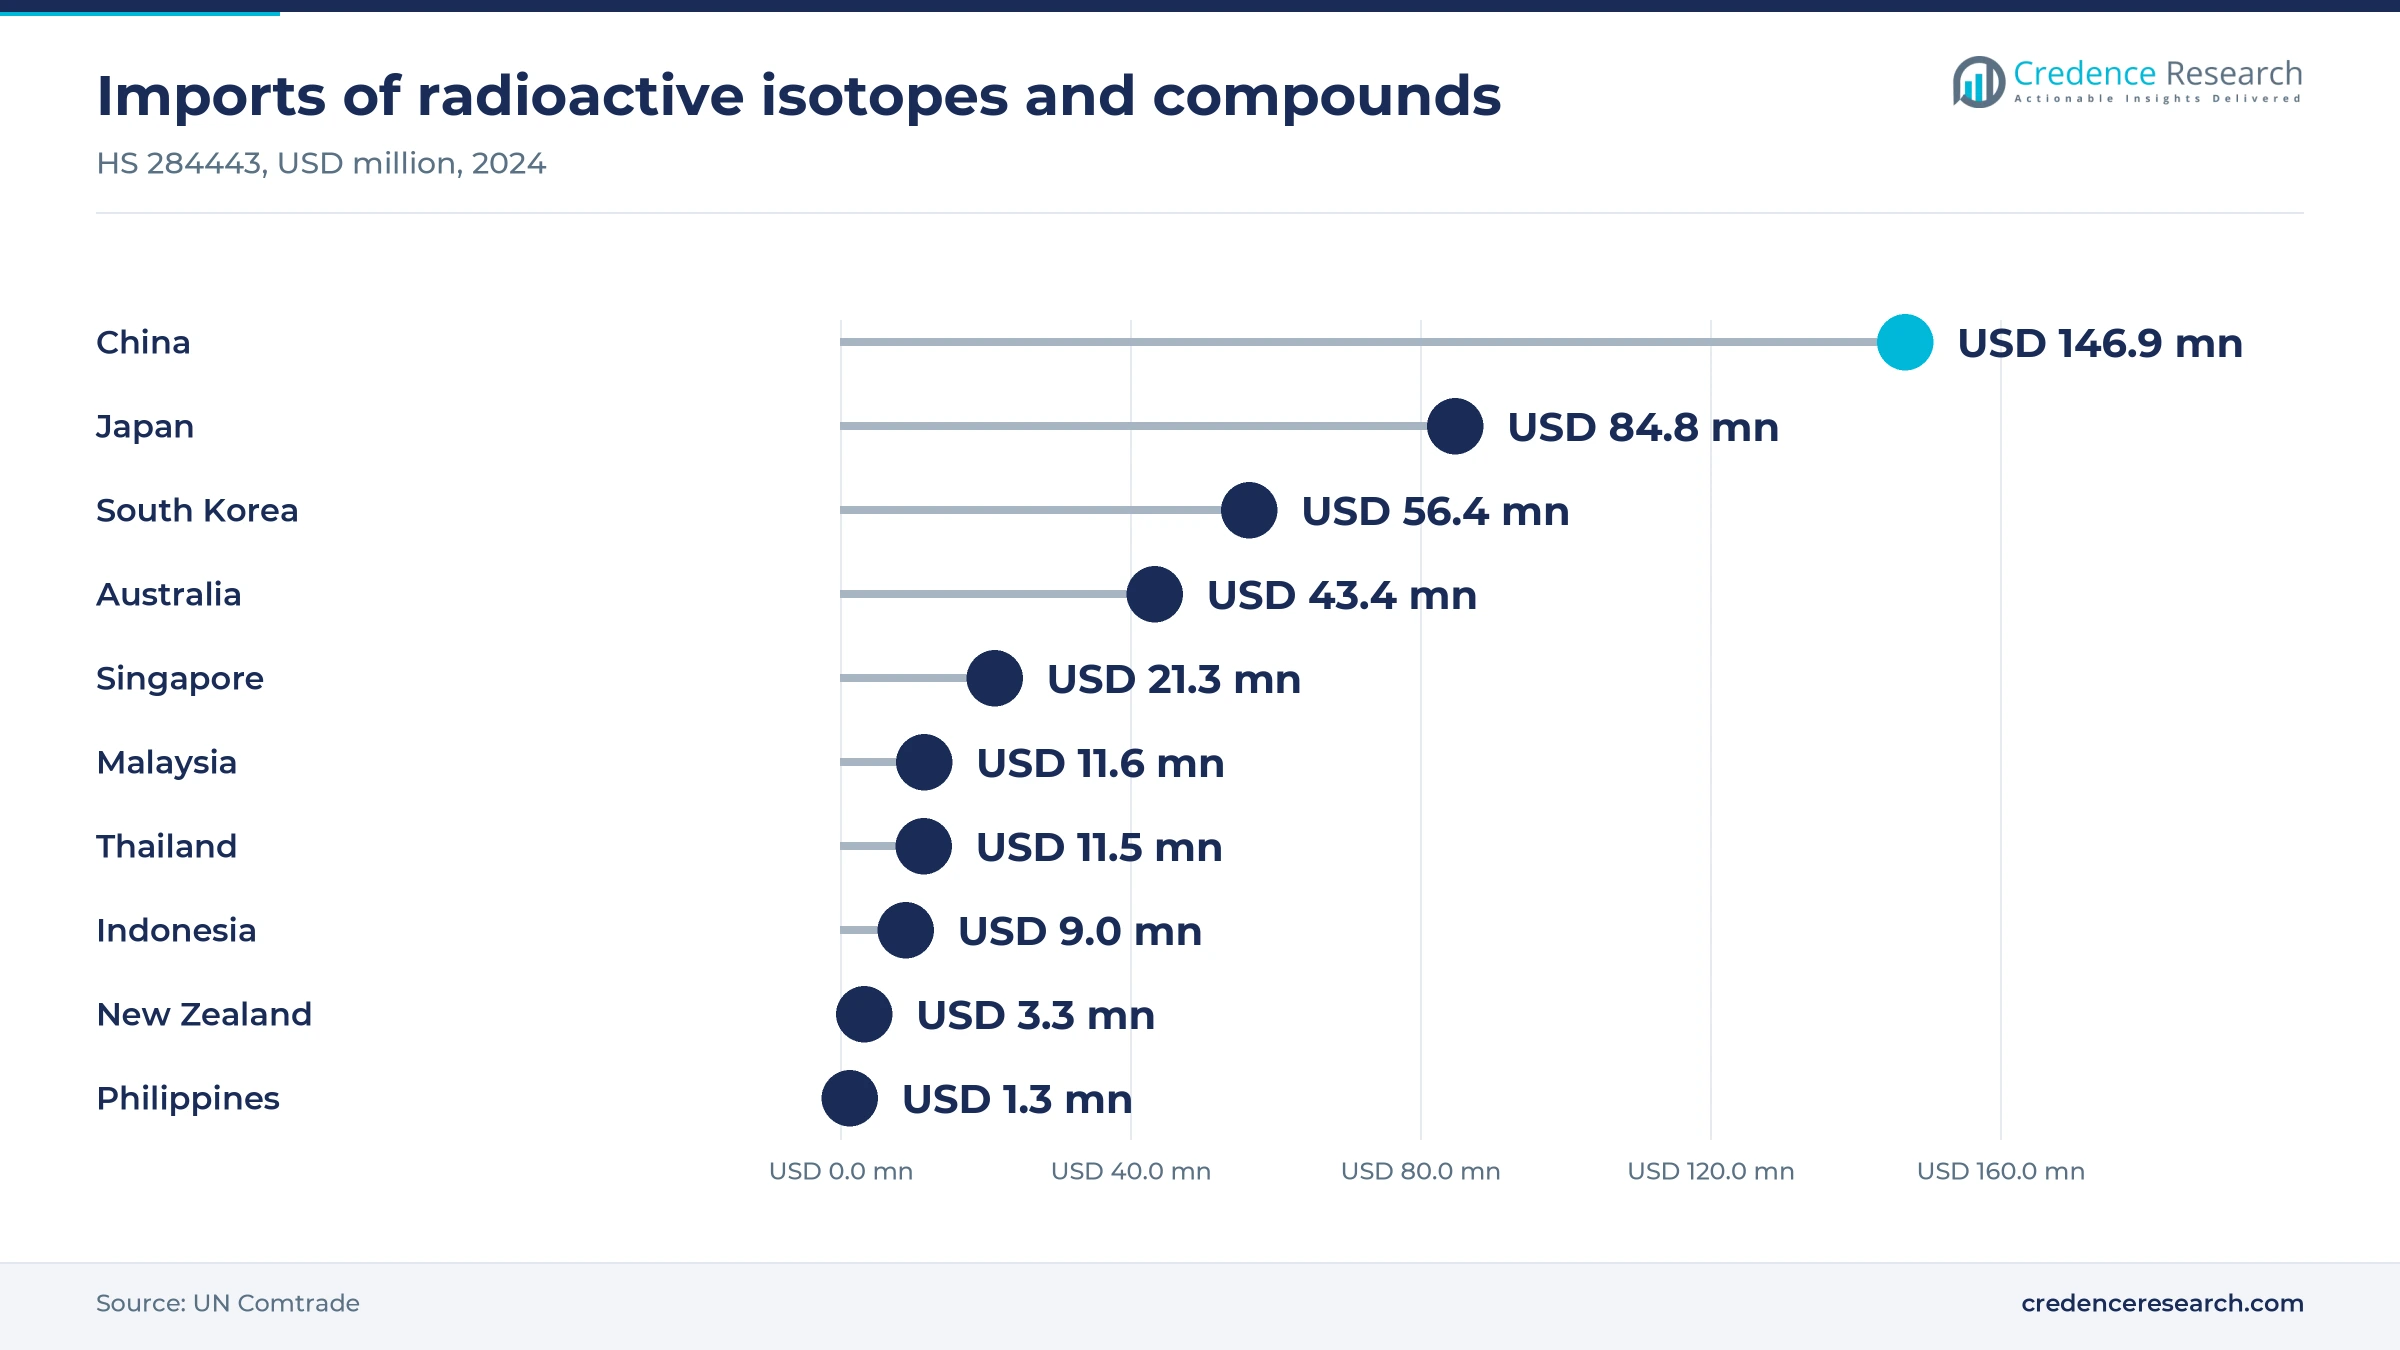
East Asia held 70.9% of 2025 value and grows at 13.18% a year. China ran 1,237 nuclear medicine departments and 148 cyclotrons in 2023, while Japan performed about 1.11 million single-photon studies in 2022. South Korea approved Pluvicto in May 2024, and Japan and China followed in 2025. China also imported USD 146.9 million of radioactive isotopes and compounds in 2024, according to UN Comtrade. However, Japanese PET studies fell 1.5% over five years, which slows growth relative to China.
Why is South Asia growing fastest?
South Asia held 12.7% of 2025 value and grows at 15.08% a year, the fastest rate in the region. India had 359 PET-CT scanners and 24 cyclotrons in 2023, according to the Indian Journal of Nuclear Medicine, and BRIT supplies lutetium-177 PSMA and DOTATATE that made these treatments affordable for many patients. The Tata Memorial research unit in Navi Mumbai opened 41 hot beds in 2023. However, many larger Indian centers still depend on imported lutetium-177, and a new isotope reactor is not expected before 2035.
How is Southeast Asia building local supply?
Southeast Asia held 10.8% of 2025 value and grows at 14.48% a year. Singapore imported USD 21.3 million of radioactive isotopes and compounds in 2024, Malaysia USD 11.6 million and Thailand USD 11.5 million, according to UN Comtrade. Bio Farma began supplying FloDeg, which it calls Indonesia's first domestically produced radiopharmaceutical, from its Cikarang cyclotron in June 2025. Malaysia's Precious Medical Group plans an on-site cyclotron at its Johor cancer center, which would add on-site isotope production for cancer imaging and therapy in Johor.
What shapes demand in Oceania?
Oceania held 5.6% of 2025 value and grows at 12.88% a year. ANSTO supplies most of Australia's nuclear medicine from Lucas Heights and shipped about 12,000 potential technetium-99m doses a week in 2020. Australia imported USD 43.4 million of radioactive isotopes and compounds in 2024, according to UN Comtrade. However, Medicare funding for lutetium-177 PSMA therapy still excludes taxane-naive patients, which keeps growth below the Asian sub-regions.
Approvals, acquisitions and isotope sites since 2025
| Development | Status and market relevance |
|---|---|
| In March 2025, GE HealthCare completed its purchase of the remaining 50% of Nihon Medi-Physics from Sumitomo Chemical. | Full control of a leading Japanese SPECT and PET tracer maker |
| In July 2025, CNNC reported commercial lutetium-177 production at Qinshan with annual capacity above 10,000 curies. | Domestic beta-emitter supply for Chinese therapy makers |
| In September 2025, Japan approved Novartis's Pluvicto with the Locametz kit and the Galliapharm generator. | First radioligand therapy for metastatic prostate cancer in Japan |
| In January 2026, China's drug evaluation center accepted Telix's Illuccix application filed with Grand Pharma. | First Telix product filing in China |
| In June 2026, Eckert & Ziegler and DongCheng Pharma opened their joint isotope site in Jintan, Changzhou. | Germanium-68 output planned from early 2027, actinium-225 later |
Generators, cyclotrons and reactors set the dose mix
- Molybdenum-99 generators deliver technetium-99m on site for bone, heart and kidney scans, which keeps SPECT imaging cheap and widely available.
- Medical cyclotrons produce fluorine-18 and other short-lived PET isotopes near hospitals, while cyclotron installations in China rose to 148 by 2023.
- Research and power reactors irradiate targets for iodine-131, lutetium-177 and molybdenum-99, and Qinshan now produces lutetium-177 and has tested yttrium-90 targets.
- PSMA and SSTR ligands carry the same targeting molecule into gallium-68 imaging kits and lutetium-177 therapy doses, which links diagnosis and treatment.
Need a Custom Version of This Report?
Tailor the scope, geography, or segments to your exact requirements.
- Custom geography or segment scope
- Direct access to our analyst team
Global originators partner with state isotope producers
Competition across Asia Pacific combines global originators with state-backed isotope producers and regional distributors. Novartis leads in radioligand therapy, with Pluvicto approved in South Korea, Japan and China and plants under way at Sasayama and Haiyan. GE HealthCare owns Nihon Medi-Physics outright since March 2025, which gives it a broad Japanese SPECT and PET portfolio. Bayer's radium-223 therapy Xofigo has been approved in China since August 2020. Telix holds TGA approval for Illuccix and filed in China with Grand Pharma in January 2026. China Isotope & Radiation Corporation holds a commercial agreement for Pluvicto in mainland China, while DongCheng Pharma builds an isotope site with Eckert & Ziegler. ANSTO and BRIT supply domestic isotopes in Australia and India. Fujifilm sold the FUJIFILM Toyama Chemical radiopharmaceutical business to PeptiDream in 2022, so companies now compete on isotope access, approvals and delivery networks.
Isotope producers, originators and distributors active in the region
| Company | Type | Role in the market |
|---|---|---|
| Novartis | Originator | Pluvicto approved in South Korea in 2024 and in Japan and China in 2025, plants at Sasayama and Haiyan |
| GE HealthCare | Diagnostics supplier | Full owner of Nihon Medi-Physics since March 2025 |
| Nihon Medi-Physics | Diagnostics supplier | Japanese maker of SPECT and PET tracers for neurology, cardiology and oncology |
| China Isotope & Radiation Corporation | Isotope producer and distributor | Commercial agreement to distribute Pluvicto in mainland China, January 2026 |
| Bayer | Originator | Radium-223 therapy Xofigo approved in China in August 2020 |
| Telix Pharmaceuticals | Theranostics developer | Illuccix approved by the TGA in 2021, China application accepted in January 2026 |
| Dongcheng Pharmaceutical | Isotope and drug developer | Joint Jintan isotope site with Eckert & Ziegler opened in June 2026 |
| ANSTO | Public isotope producer | Supplies roughly 75% to 80% of nuclear medicine used in Australia |
| Board of Radiation & Isotope Technology | Public isotope supplier | Supplies lutetium-177 PSMA and DOTATATE to Indian centers |
Therapy access, not scan counts, sets the growth pace
Credence Research's view is that spending on Asia-Pacific radiopharmaceuticals will grow quickly because therapy doses, not scan counts, now drive value. Therapeutic radiopharmaceuticals grow fastest after Pluvicto approvals in South Korea, Japan and China, while SPECT agents keep the largest volume base. East Asia keeps the largest share, and South Asia grows fastest as India adds PET-CT scanners and lutetium-177 supply. However, reactor outages, therapy room limits and reimbursement gaps could slow uptake. Suppliers that control isotope sources and delivery networks should gain share.
Imaging surveys, approvals and trade data feed the model
The report on radioactive diagnostic and therapy drugs uses 2025 as the base year on a calendar basis, and market values come from the Credence Research model. That model combines published national nuclear medicine surveys, regulator approvals, reimbursement decisions, trade data and company information on plants and launches. The sub-regional shares, segment splits and growth rates are Credence Research estimates. Sources used are official statistics, regulator and government notices, scientific journals, company releases and news reports, and no interviews or primary surveys were conducted.
Therapeutic doses carry regional growth to 2035
Spending on Asia-Pacific radiopharmaceuticals is expected to reach USD 5.40 billion by 2035, a 13.56% CAGR during 2026–2035, as more patients receive lutetium-177 and other targeted therapies. Growth should be strongest in South Asia and Southeast Asia, where PET-CT and cyclotron capacity is still being built. East Asia will keep the largest share because of its camera base and insurance coverage. Domestic isotope output in China, Japan, South Korea and India, plus new actinium-225 sites, will shape supply, while reactor reliability and reimbursement will set the pace of therapy uptake.
Frequently Asked Questions
How big is the Asia-Pacific radiopharmaceuticals market?
Which sub-region leads regional radiopharmaceutical sales?
Which sub-region grows fastest?
Which product type grows fastest?
Which production technology leads?
When did Japan approve Pluvicto?
How is China building domestic isotope supply?
Which companies are active in the regional market?
Table of Content
Chapter 1 Market Segmentation
- 1.1 Segmentation Framework
- 1.1.1 Product and Service Classification
- 1.1.2 Application and End-Use Classification
- 1.1.3 Technology and Solution Classification
- 1.1.4 Customer and Distribution Channel Classification
- 1.1.5 Geographic Segmentation
- 1.1.6 Market Segment Definitions and Boundaries
- 1.2 By Product Type
- 1.2.1 SPECT Radiopharmaceuticals
- 1.2.2 PET Radiopharmaceuticals
- 1.2.3 Therapeutic Radiopharmaceuticals
- 1.2.4 Specialty Diagnostic Preparations
- 1.3 By Technology
- 1.3.1 Generator-Derived Production
- 1.3.2 Cyclotron-Derived Production
- 1.3.3 Direct Reactor-Derived Production
- 1.4 By Disease Area
- 1.4.1 Oncology
- 1.4.2 Cardiology
- 1.4.3 Neurology
- 1.4.4 Non-Oncologic Systemic Disorders
- 1.5 By Channel
- 1.5.1 Direct Manufacturer Supply
- 1.5.2 Licensed Distributor Supply
- 1.5.3 Radiopharmacy Network Supply
- 1.6 By Sub-region
- 1.6.1 East Asia
- 1.6.2 South Asia
- 1.6.3 Southeast Asia
- 1.6.4 Oceania
Chapter 2 Introduction
- 2.1 Report Objectives and Scope
- 2.2 Product Definition and Industry Terminology
- 2.3 Market Inclusions and Exclusions
- 2.4 Research Process
- 2.4.1 Primary Research and Expert Interviews
- 2.4.2 Secondary Research and Source Review
- 2.4.3 Top-Down and Bottom-Up Estimation
- 2.4.4 Data Triangulation and Verification
- 2.5 Market Size Measurement Basis
- 2.5.1 2025: USD 1.51 billion → 2035: USD 5.40 billion
- 2.6 Historical and Forecast Reference Periods
- 2.6.1 Historical Period: 2018-2025
- 2.6.2 Base Year: 2025
- 2.6.3 Forecast Period: 2025-2035
- 2.7 Research Assumptions and Limitations
Chapter 3 Executive Summary
- 3.1 Market Snapshot and Key Findings
- 3.2 Base-Year Market Size, 2025
- 3.3 Forecast Market Size, 2035
- 3.4 Revenue and Volume Growth Outlook
- 3.5 Key Demand and Supply Indicators
- 3.6 Leading Market Segments
- 3.7 Fastest-Growing Market Opportunities
- 3.8 Regional Performance Highlights
- 3.9 Technology and Industry Transformation
- 3.10 Competitive Landscape Summary
- 3.11 Analyst View and Strategic Implications
Chapter 4 Asia-Pacific Radiopharmaceuticals Market Trends and Developments
- 4.1 Historical Industry Development, 2018-2025
- 4.2 Recent Market Trends and Developments
- 4.3 Demand and Customer Behavior Trends
- 4.4 Technology and Product Innovation
- 4.5 Artificial Intelligence, Automation and Digitalization
- 4.6 Local Manufacturing and Supply Chain Realignment
- 4.7 Industry Partnerships, Mergers and Acquisitions
- 4.8 Sustainability and Circular Economy Developments
- 4.9 Government and Private Sector Investment Trends
- 4.10 Emerging Business Models and Commercialization
- 4.11 Industry Developments and Announcements
Chapter 5 Asia-Pacific Radiopharmaceuticals Market Production, Supply and Demand Analysis
- 5.1 Demand Trend and Consumption Analysis, 2018-2025
- 5.2 Demand Forecast, 2025-2035
- 5.3 Production and Output Trend, 2018-2025
- 5.4 Production and Output Forecast, 2025-2035
- 5.5 Installed Capacity and Capacity Utilization
- 5.6 Company-Wise Production Plants and Statistics
- 5.6.1 Installed Production Capacity
- 5.6.2 Actual Production
- 5.6.3 Planned Capacity and Expansion Targets
- 5.7 Supply Chain Structure and Procurement Trends
- 5.8 Supply-Demand Gap and Bottlenecks
- 5.9 Import Dependence and Sourcing Structure
- 5.10 Contract Manufacturing and Outsourcing
- 5.11 Regional Supply and Demand Concentration
Chapter 6 Asia-Pacific Radiopharmaceuticals Market Pricing Analysis
- 6.1 Pricing Structure and Measurement
- 6.2 Historical Pricing Trends, 2018-2025
- 6.3 Pricing Outlook, 2025-2035
- 6.4 Average Selling Price and Unit Economics
- 6.5 Pricing by Product and Market Segment
- 6.6 Geographic Pricing Differences
- 6.7 Key Input, Energy, Labor and Logistics Costs
- 6.8 Contract Pricing and Purchasing Models
- 6.9 Pricing Sensitivity and Competitive Positioning
- 6.10 Price, Margin and Profitability Implications
Chapter 7 Asia-Pacific Radiopharmaceuticals Market Dynamics
- 7.1 Market Growth Drivers
- 7.1.1 Demand-Side Drivers
- 7.1.2 Technology and Innovation Drivers
- 7.1.3 Infrastructure and Investment Drivers
- 7.1.4 Regulatory and Policy Drivers
- 7.2 Market Restraints
- 7.2.1 Cost and Affordability Constraints
- 7.2.2 Technology and Adoption Barriers
- 7.2.3 Supply Chain and Operational Constraints
- 7.3 Market Challenges
- 7.3.1 Competitive Pressure and Margin Erosion
- 7.3.2 Skills, Infrastructure and Implementation Gaps
- 7.4 Emerging Market Opportunities
- 7.5 Market Dynamics Impact and Time-Horizon Assessment
Chapter 8 Asia-Pacific Radiopharmaceuticals Value Chain Analysis
- 8.1 Industry Value Chain Overview
- 8.2 Upstream Suppliers and Critical Inputs
- 8.3 Technology and Component Providers
- 8.4 Manufacturing or Service Delivery
- 8.5 Distribution, Channel Partners and Integrators
- 8.6 Downstream Applications and End Users
- 8.7 Value Addition and Profit Pools
- 8.8 Vertical Integration and Outsourcing
- 8.9 Supplier Concentration and Risk
- 8.10 Supply Chain Localization and Resilience
Chapter 9 Asia-Pacific Radiopharmaceuticals Market Regulations and Policies
- 9.1 Relevant Laws, Standards and Compliance Frameworks
- 9.2 Product, Service, Safety and Quality Requirements
- 9.3 Government Policies, Incentives and Subsidies
- 9.4 Imports, Exports and Trade Barriers
- 9.5 Public Procurement and Local Content Requirements
- 9.6 Environmental and Sustainability Compliance
- 9.7 Upcoming Policy Changes and Market Implications
Chapter 10 Asia-Pacific Radiopharmaceuticals Market Hotspots and Opportunities
- 10.1 Market Opportunity Mapping and Growth Hotspots
- 10.2 High-Growth Applications and Customer Groups
- 10.3 Underserved Markets and White-Space Opportunities
- 10.4 Emerging Technology and Product Opportunities
- 10.5 New Capacity and Investment Hotspots
- 10.6 Market Entry and Expansion Opportunities
- 10.7 Distribution and Partnership Opportunities
- 10.8 Near-Term and Long-Term Commercial Potential
- 10.9 Opportunity Attractiveness and Execution Risks
Chapter 11 Asia-Pacific Radiopharmaceuticals Market Outlook, 2025-2035
- 11.1 Market Size and Analysis
- 11.1.1 Revenue (Market Measurement: 2025: USD 1.51 billion → 2035: USD 5.40 billion)
- 11.1.2 Market Volume and Quantity Sold
- 11.1.3 Historical Market Size, 2018-2025
- 11.1.4 Base-Year Market Size, 2025
- 11.2 Market Forecast, 2025-2035
- 11.2.1 Revenue Forecast to 2035
- 11.2.2 Volume Forecast to 2035
- 11.2.3 CAGR and Year-on-Year Growth
- 11.2.4 Incremental Revenue Opportunity
- 11.3 Forecast Assumptions and Scenario Analysis
- 11.3.1 Base-Case Forecast
- 11.3.2 Optimistic and Conservative Scenarios
- 11.3.3 Technology, Pricing and Policy Sensitivities
- 11.4 Market Attractiveness and Growth Outlook
Chapter 12 Asia-Pacific Radiopharmaceuticals Market Segmentation and Outlook
- 12.1 Segmentation Summary and Market Shares, 2025
- 12.2 Largest and Fastest-Growing Segments
- 12.3 By Product Type - Market Size and Forecast, 2025-2035
- 12.3.1 Segment Definition and Scope
- 12.3.2 Historical Market Size, 2018-2025
- 12.3.3 Revenue Forecast, 2025-2035
- 12.3.4 Volume Forecast, 2025-2035
- 12.3.5 Base-Year Market Share, 2025
- 12.3.6 Segment CAGR and Growth Drivers
- 12.3.7 Subsegment Market Size and Forecast
- 12.3.7.1 SPECT Radiopharmaceuticals
- 12.3.7.2 PET Radiopharmaceuticals
- 12.3.7.3 Therapeutic Radiopharmaceuticals
- 12.3.7.4 Specialty Diagnostic Preparations
- 12.3.8 Subsegment Pricing and Adoption Trends
- 12.3.9 Leading Suppliers and Competition
- 12.3.10 Regional Demand and Opportunities
- 12.4 By Technology - Market Size and Forecast, 2025-2035
- 12.4.1 Segment Definition and Scope
- 12.4.2 Historical Market Size, 2018-2025
- 12.4.3 Revenue Forecast, 2025-2035
- 12.4.4 Volume Forecast, 2025-2035
- 12.4.5 Base-Year Market Share, 2025
- 12.4.6 Segment CAGR and Growth Drivers
- 12.4.7 Subsegment Market Size and Forecast
- 12.4.7.1 Generator-Derived Production
- 12.4.7.2 Cyclotron-Derived Production
- 12.4.7.3 Direct Reactor-Derived Production
- 12.4.8 Subsegment Pricing and Adoption Trends
- 12.4.9 Leading Suppliers and Competition
- 12.4.10 Regional Demand and Opportunities
- 12.5 By Disease Area - Market Size and Forecast, 2025-2035
- 12.5.1 Segment Definition and Scope
- 12.5.2 Historical Market Size, 2018-2025
- 12.5.3 Revenue Forecast, 2025-2035
- 12.5.4 Volume Forecast, 2025-2035
- 12.5.5 Base-Year Market Share, 2025
- 12.5.6 Segment CAGR and Growth Drivers
- 12.5.7 Subsegment Market Size and Forecast
- 12.5.7.1 Oncology
- 12.5.7.2 Cardiology
- 12.5.7.3 Neurology
- 12.5.7.4 Non-Oncologic Systemic Disorders
- 12.5.8 Subsegment Pricing and Adoption Trends
- 12.5.9 Leading Suppliers and Competition
- 12.5.10 Regional Demand and Opportunities
- 12.6 By Channel - Market Size and Forecast, 2025-2035
- 12.6.1 Segment Definition and Scope
- 12.6.2 Historical Market Size, 2018-2025
- 12.6.3 Revenue Forecast, 2025-2035
- 12.6.4 Volume Forecast, 2025-2035
- 12.6.5 Base-Year Market Share, 2025
- 12.6.6 Segment CAGR and Growth Drivers
- 12.6.7 Subsegment Market Size and Forecast
- 12.6.7.1 Direct Manufacturer Supply
- 12.6.7.2 Licensed Distributor Supply
- 12.6.7.3 Radiopharmacy Network Supply
- 12.6.8 Subsegment Pricing and Adoption Trends
- 12.6.9 Leading Suppliers and Competition
- 12.6.10 Regional Demand and Opportunities
- 12.7 By Sub-region - Market Size and Forecast, 2025-2035
- 12.7.1 Segment Definition and Scope
- 12.7.2 Historical Market Size, 2018-2025
- 12.7.3 Revenue Forecast, 2025-2035
- 12.7.4 Volume Forecast, 2025-2035
- 12.7.5 Base-Year Market Share, 2025
- 12.7.6 Segment CAGR and Growth Drivers
- 12.7.7 Subsegment Market Size and Forecast
- 12.7.7.1 East Asia
- 12.7.7.2 South Asia
- 12.7.7.3 Southeast Asia
- 12.7.7.4 Oceania
- 12.7.8 Subsegment Pricing and Adoption Trends
- 12.7.9 Leading Suppliers and Competition
- 12.7.10 Regional Demand and Opportunities
- 12.8 Segment Growth Comparison
- 12.9 Segment Attractiveness and Priority Matrix
Chapter 13 Asia-Pacific Radiopharmaceuticals Geographic Market Outlook, 2025-2035
- 13.1 Regional Market Size and Country-Level Shares, 2025
- 13.2 Country Market Size Comparison, 2025
- 13.3 Country Market Forecasts, 2025-2035
- 13.4 Subregional Industrial and Demand Clusters
- 13.5 Intra-Regional Pricing and Cost Differences
- 13.6 Cross-Border Trade and Supply Networks
- 13.7 Regional Supply and Demand Balances
- 13.8 Country Opportunity Comparison and Prioritization
Note: Every listed country is covered on the structure shown under the first country.
Chapter 14 Asia-Pacific Radiopharmaceuticals Technology, Innovation and Sustainability Outlook
- 14.1 Technology Landscape and Maturity
- 14.2 Product, Process and Service Innovation
- 14.3 AI, Automation and Digital Tools in the Industry
- 14.4 Technology Adoption and Performance Benchmarking
- 14.5 Innovation Pipeline and R&D Investment
- 14.6 Patent and Intellectual Property Trends
- 14.7 Energy Efficiency and Resource Management
- 14.8 Sustainability, Recycling and Circularity
- 14.9 Technology Roadmap, 2025-2035
- 14.10 Risks of Obsolescence and Technology Substitution
Chapter 15 Asia-Pacific Radiopharmaceuticals Market Key Strategic Imperatives
- 15.1 Growth and Market Entry Priorities
- 15.2 High-Return Products and Segments
- 15.3 Pricing, Profitability and Cost Optimization
- 15.4 Technology Investment and Product Differentiation
- 15.5 Supply Chain Localization and Resilience
- 15.6 Distribution and Customer Acquisition
- 15.7 Partnership, Acquisition and Capacity Strategy
- 15.8 Regional Expansion Priorities
- 15.9 Short-, Medium- and Long-Term Actions
Chapter 16 Competition Outlook
- 16.1 Industry Competition Characteristics
- 16.2 Market Structure and Concentration
- 16.3 Market Share and Competitive Positioning, 2025
- 16.4 Company-Wise Revenue and Product Benchmarking
- 16.5 Production and Service Capacity Benchmarking
- 16.6 Technology, Pricing and Differentiation
- 16.7 Regional Footprint and Distribution Strength
- 16.8 Mergers, Acquisitions and Strategic Alliances
- 16.9 New Entrants and Competitive Threats
- 16.10 Porter's Five Forces and Industry Attractiveness
- 16.11 Competitive Outlook, 2025-2035
Chapter 17 Company Profiles
- 17.1 Company Coverage and Selection Criteria
- 17.2 China Isotope & Radiation Corporation
- 17.2.1 Business Description
- 17.2.2 Company Ownership and Geographic Presence
- 17.2.3 Product and Service Portfolio
- 17.2.4 Manufacturing and Operating Footprint
- 17.2.5 Production Capacity and Expansion Plans
- 17.2.6 Financial Performance and Investment
- 17.2.7 Market Share and Competitive Position
- 17.2.8 Technology and Innovation Capabilities
- 17.2.9 Strategic Alliances or Partnerships
- 17.2.10 Recent Developments
- 17.2.11 Growth Strategy and Outlook
- 17.3 GE HealthCare
- 17.4 Nihon Medi-Physics
- 17.5 Novartis
- 17.6 Bayer
- 17.7 Telix Pharmaceuticals
- 17.8 ANSTO
- 17.9 FUJIFILM Toyama Chemical
- 17.10 Dongcheng Pharmaceutical
- 17.11 Board of Radiation & Isotope Technology
- 17.12 Other Relevant Market Participants
Note: Every listed company is profiled on the structure shown under the first company. The company list is preliminary and may change based on research findings, market developments, data availability and client requirements.
Chapter 18 Disclaimer
- 18.1 Research and Forecast Disclaimer
- 18.2 Data Source and Estimation Limitations
Note: The depth of individual sections depends on data availability for this market. Volume, capacity, trade and other unit-based metrics are included where applicable.