
Factory-built homes move from Japan into public programs
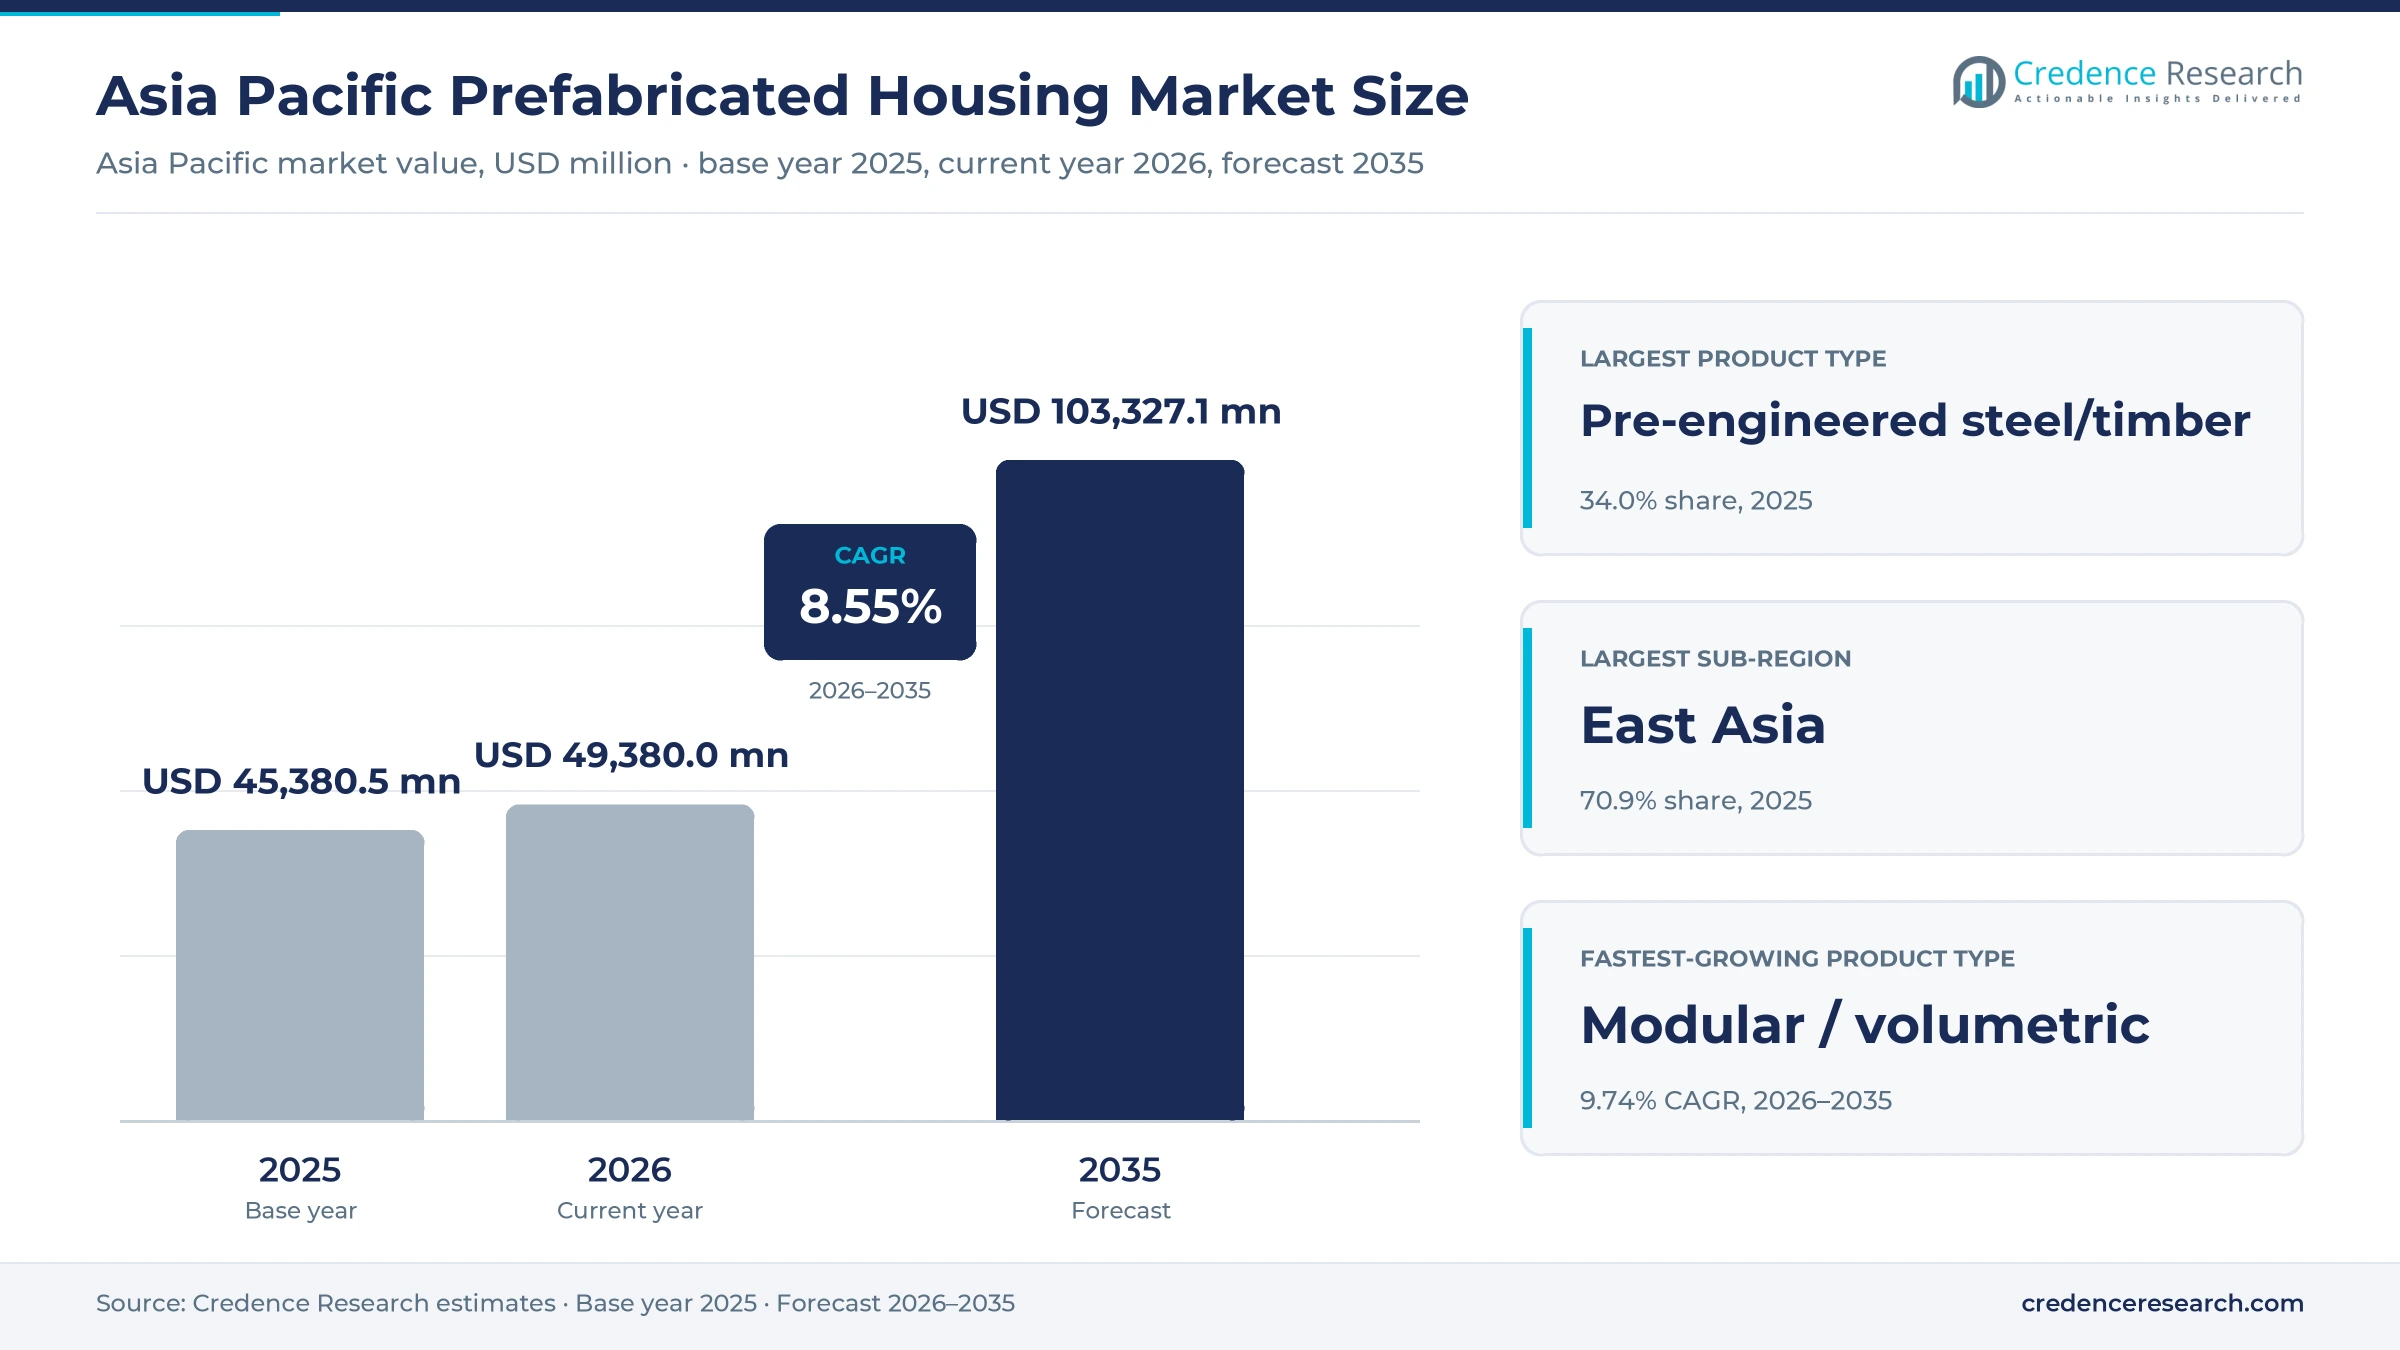
The Asia Pacific prefabricated housing market was valued at USD 45.38 billion in 2025 and is projected to increase from USD 49.38 billion in 2026 to USD 103.33 billion by 2035, registering a CAGR of 8.55% during 2026–2035. Demand comes from private homebuyers who order factory-built detached homes, from governments that need public flats delivered quickly, and from developers short of site labor. East Asia held the largest sub-regional share, 70.9% in 2025, because Japan has a mature industry of housebuilders that make steel and timber homes in their own plants, and China uses precast concrete at scale. South Asia is the fastest-growing sub-region at 10.33% a year, as India funds new urban homes and rewards projects that use innovative construction methods. Buyers are also moving toward volumetric units, which leave the factory with finishes, wiring and fittings already in place and cut weeks from site schedules.
What counts as factory-built housing in this region?
The estimate measures the value of homes and dwelling units whose main structure is made off site in the Asia Pacific region. It covers volumetric modules, panelized wall and floor systems, pre-engineered steel and timber frames, and precast concrete structures used in private homes, public rental flats and worker or student housing. Values include factory supply, delivery and installation, and design and build contracts sold to homebuyers, developers and public agencies.
The estimate excludes land, conventional site-built homes, temporary site offices and non-residential buildings. The value chain runs from steel, timber and cement suppliers through factories run by housebuilders, module makers and precasters to installers, developers, public housing agencies and individual buyers across East Asia, South Asia, Southeast Asia and Oceania.
Asia Pacific Prefabricated Housing Market Insights
- The Asia Pacific prefabricated housing market was valued at USD 45.38 billion in 2025 and is projected to reach USD 103.33 billion by 2035, registering a CAGR of 8.55% during 2026–2035.
- East Asia held a 70.9% share of 2025 value, because Japan started 93,082 prefabricated homes in 2024 and China builds a large share of new floor area from precast parts.
- Pre-engineered steel and timber systems led product demand with a 34.0% share of 2025 value, because the largest Japanese housebuilders sell steel-frame and timber detached homes.
- Hong Kong planned about 30,000 Light Public Housing units, with about 9,500 due in 2025 and about 20,300 in 2026 and 2027, giving factory suppliers a large public pipeline.
- Sekisui Chemical resolved on Sept. 10, 2026, to buy 51% of Queensland builder Ausbuild, bringing Japanese factory housing into the Australian private market.
Steel and timber systems lead while volumetric units gain
Why do volumetric units outgrow steel-frame homes?
Based on product type, the market is categorized into modular / volumetric, panelised systems, pre-engineered steel/timber and precast concrete. Pre-engineered Steel/Timber led with a 34.0% share of 2025 value, because Japanese housebuilders sell steel-frame and timber homes in large numbers. Modular / Volumetric grows fastest at 9.74% a year, as public agencies order finished units that cut site time.
How do public programs change the application mix?
Based on application, the market is categorized into private housing, government / social housing, and student / worker accommodation. Private Housing led with a 68.0% share of 2025 value, because detached homes ordered by families in Japan still account for most factory output. Government / Social Housing grows fastest at 9.43% a year, as Hong Kong, India and Australian states procure public homes at scale.
Why do buyers shift toward supply and install contracts?
Based on operating model, the market is categorized into factory supply only, supply and install, and integrated design and build. Integrated Design and Build led with a 52.0% share of 2025 value, because Japanese housebuilders design, make and erect each home themselves. Supply and Install grows fastest at 8.96% a year, as agencies hire module makers to deliver and set units on prepared sites.
How fast are public tenders gaining channel share?
Based on sales channel, the market is categorized into authorised dealer networks, direct project contracts, public procurement tenders and direct homebuyer sales. Direct Homebuyer Sales led with a 38.0% share of 2025 value, because Japanese firms sell through their own show homes and sales staff. Public Procurement Tenders grow fastest at 9.40% a year, as housing agencies buy in large batches.
| Segment Group | Leading Sub-segment | Share, 2025 | Fastest-growing Sub-segment | CAGR, 2026–2035 |
|---|---|---|---|---|
| By Product Type | Pre-engineered Steel/Timber | 34.0% | Modular / Volumetric | 9.74% |
| By Application | Private Housing | 68.0% | Government / Social Housing | 9.43% |
| By Operating Model | Integrated Design and Build | 52.0% | Supply and Install | 8.96% |
| By Sales Channel | Direct Homebuyer Sales | 38.0% | Public Procurement Tenders | 9.40% |
Request a Free Sample
Fill in your details and we'll send you a free sample report.
- Sample data tables & charts
- Research methodology
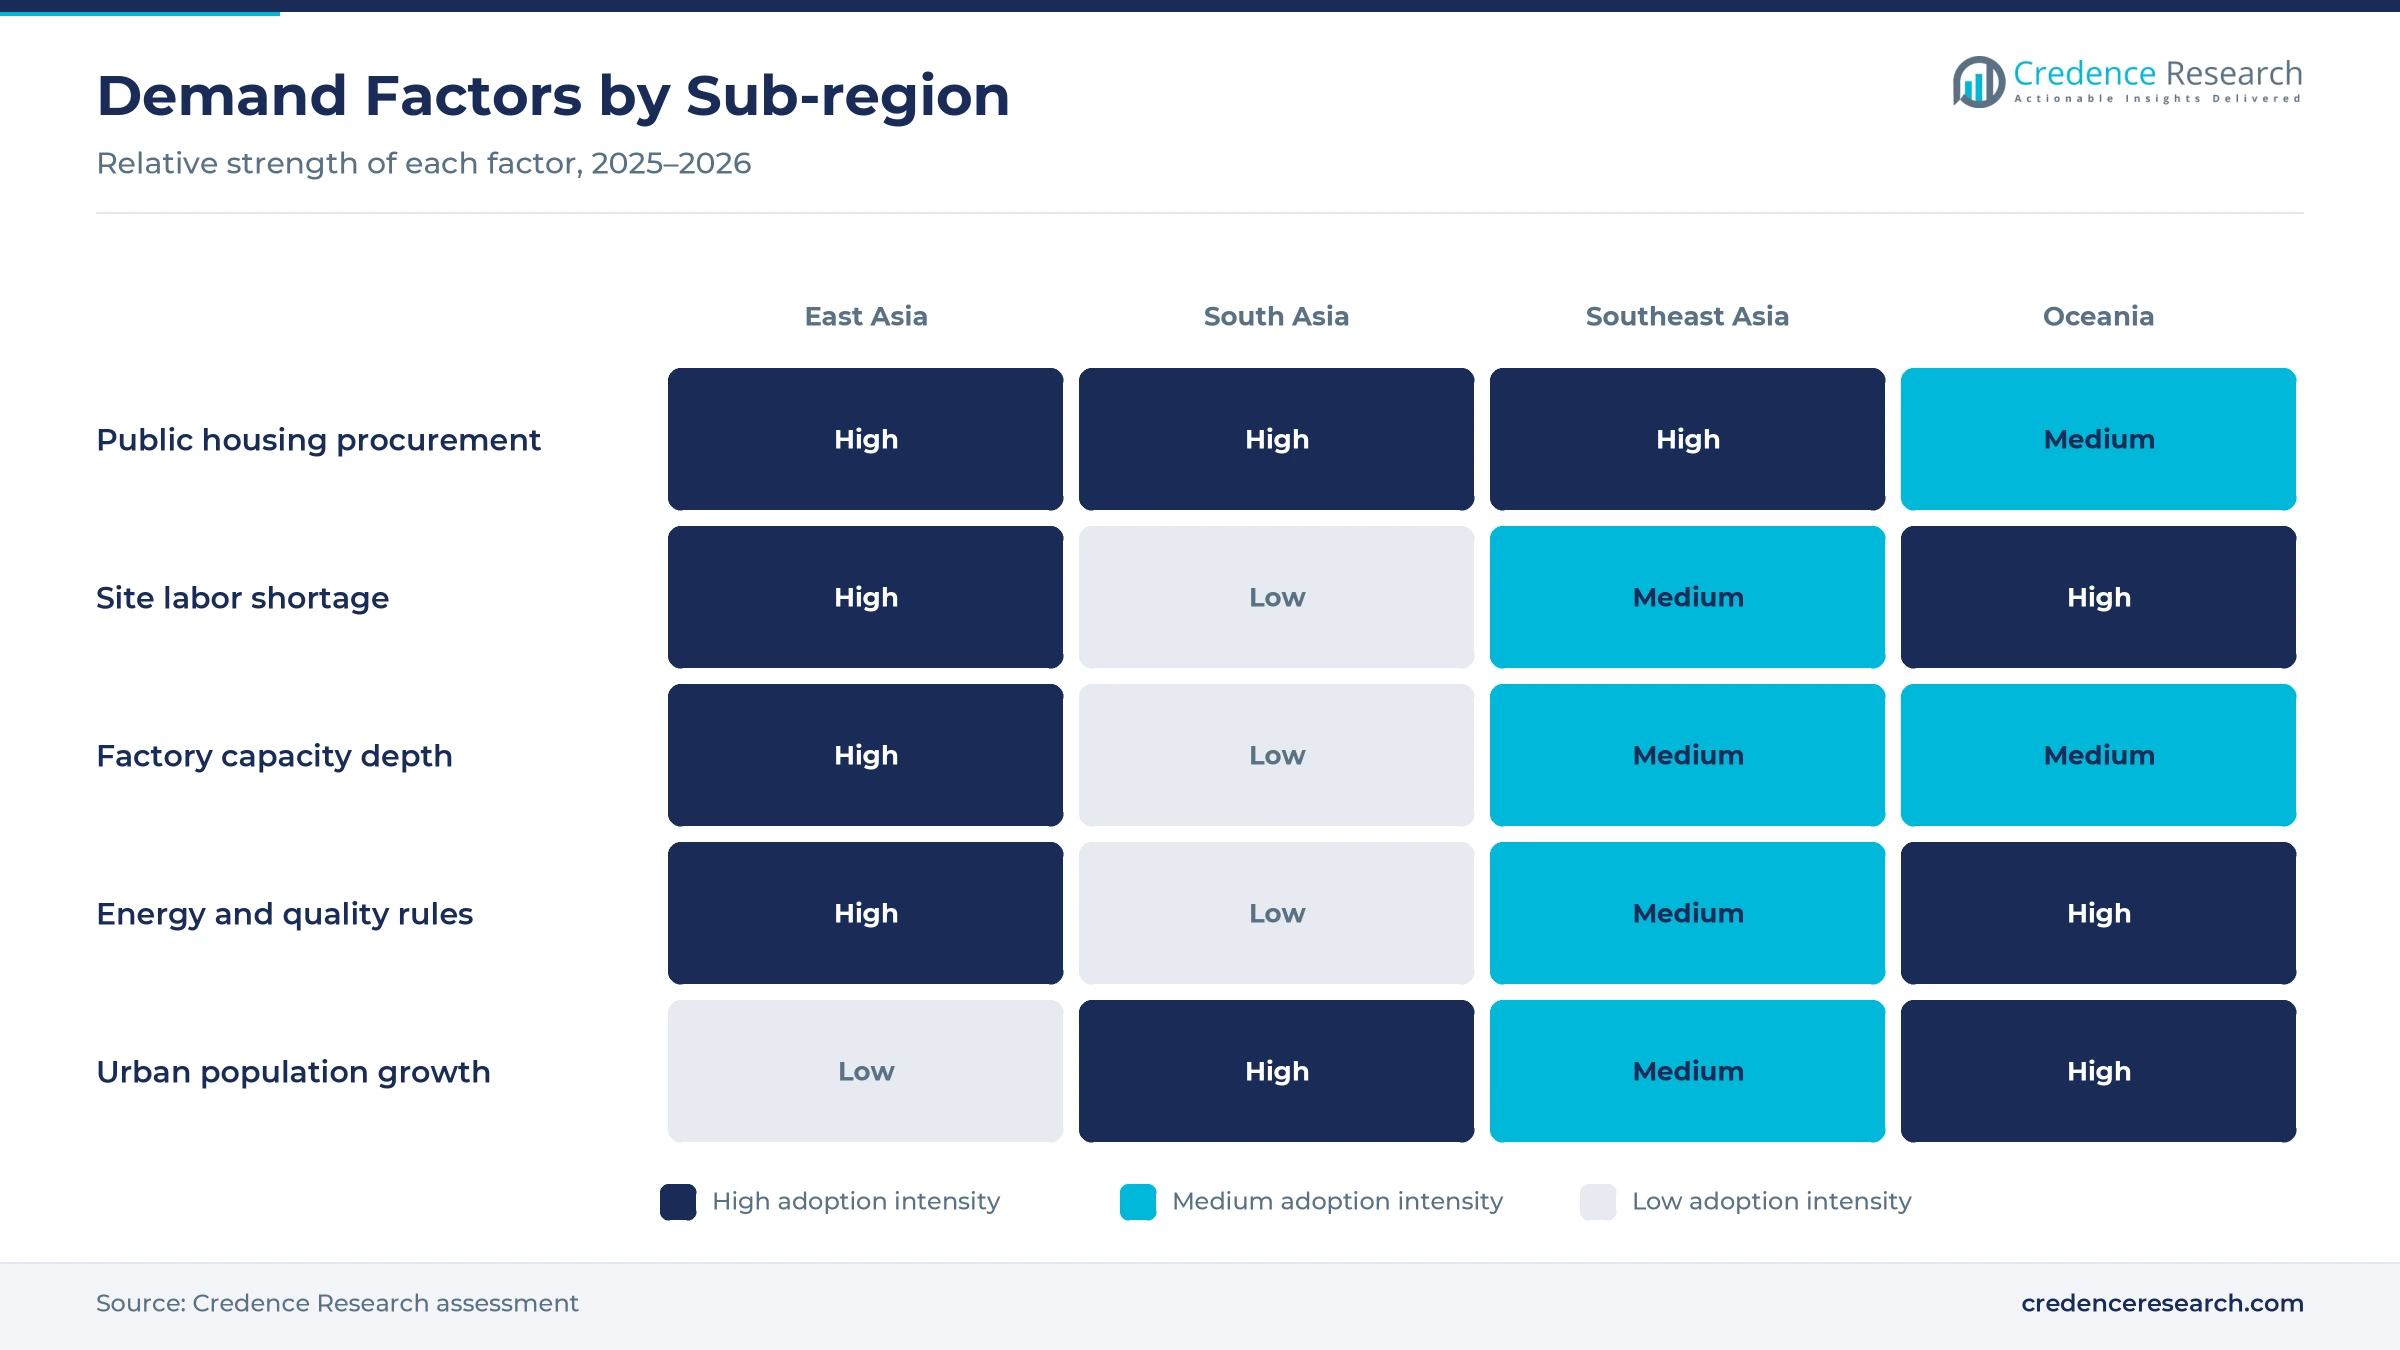
Housing targets, site labor gaps and energy rules lift use
How does housing program procurement lift factory orders?
Governments across the region now buy homes in batches large enough to keep factories busy for years. Hong Kong planned about 30,000 Light Public Housing units across 13 projects, with about 9,500 due in 2025 and about 20,300 in 2026 and 2027, according to a Housing Bureau paper to the Legislative Council. That paper put returned tender prices about 15% below approved funding, which shows that the approach controls cost. In India, the cabinet approved PMAY-Urban 2.0 on Aug. 10, 2024, for 1 crore urban homes over five years, according to the Press Information Bureau. Queensland also ordered 600 more modular homes through partners and QBuild. As a result, government and social housing grows at 9.43% a year.
Why does construction productivity pressure favor factories?
Site labor is scarce and ageing in the largest markets, so builders move work into plants where fewer people produce more homes. Sekisui House had about 590 in-house crafters on April 1, 2025, and plans to reach 1,000 by April 2033, according to its company presentation. Singapore's Housing and Development Board set a target to use prefabricated prefinished volumetric construction in 35% of its projects by 2019 and to fit factory-made bathrooms in all new launches. The Queensland government said that on-site work for a modular home can take about three months, compared with about a year for many traditional builds. In turn, modular construction gains share in public housing programs across the region.
How do stricter energy rules favor factory-built homes?
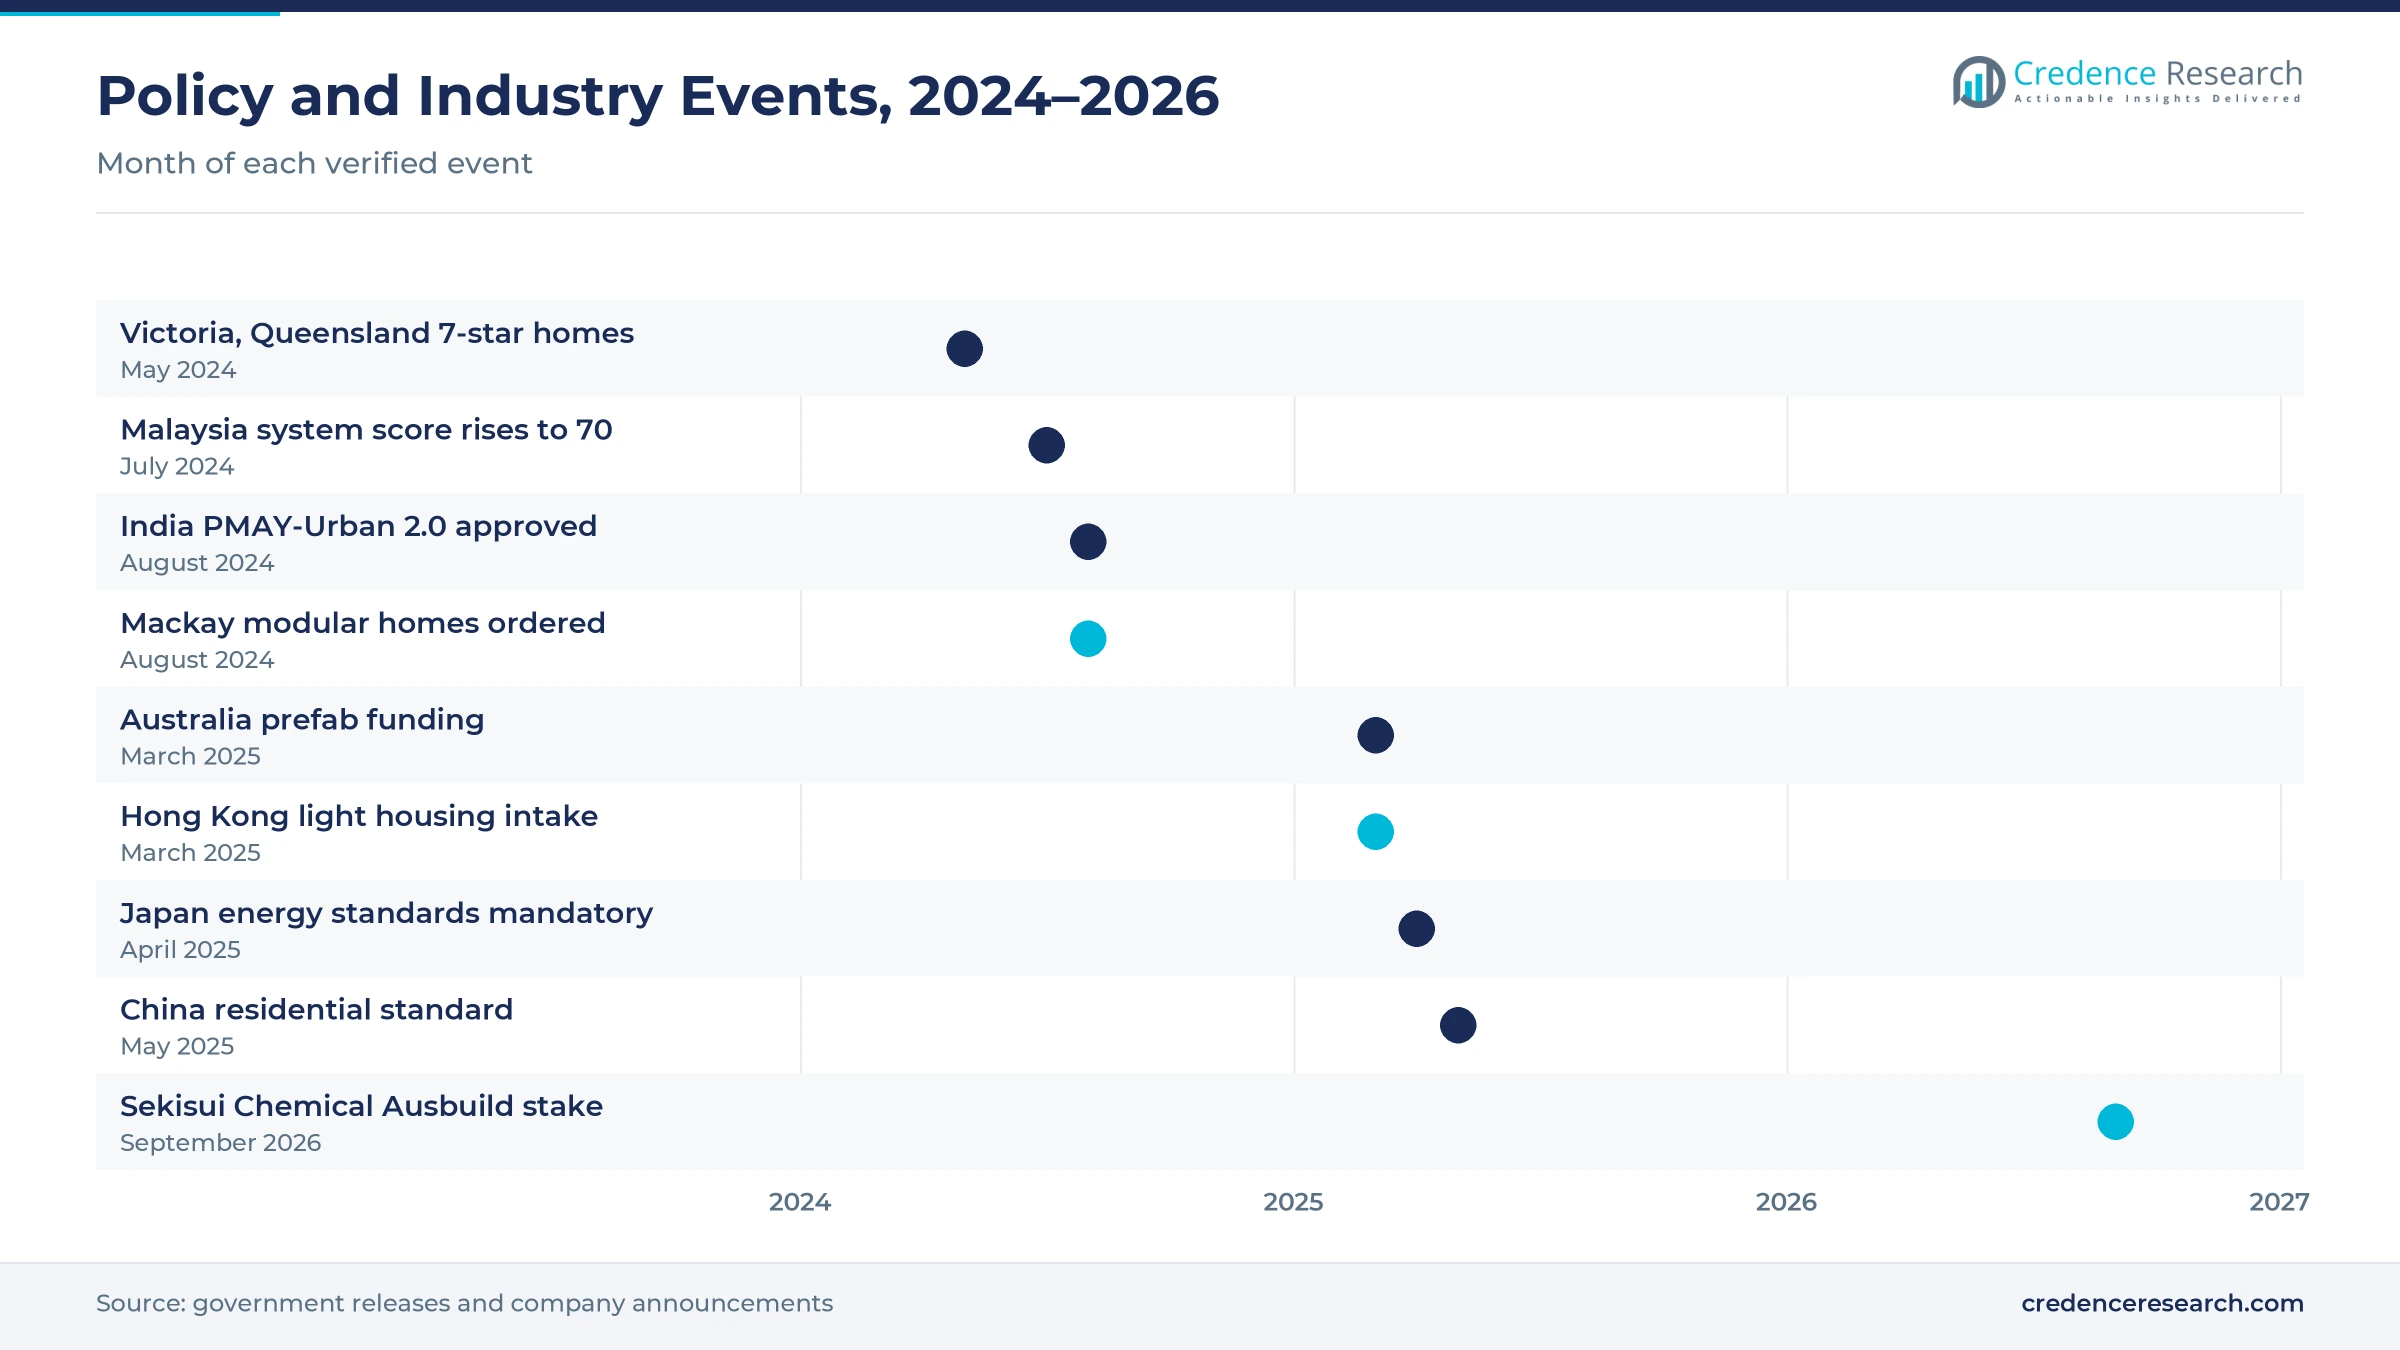
New energy and quality rules lift demand for factory production, because they are easier to meet in a plant where insulation, airtightness and finishes are checked on a line. Japan made energy conservation standards mandatory for all new homes from April 2025 and plans net zero energy levels for new buildings from fiscal 2030, according to the Energy Conservation Center, Japan. China's housing ministry set new residential standards from May 1, 2025, which require elevators in buildings of four or more floors. Australia also raised the minimum NatHERS rating to seven stars, which Victoria and Queensland adopted on May 1, 2024. As a result, steel and timber systems keep a 34.0% share of 2025 value.
Why do supply targets in Oceania widen the buyer base?
Australian and New Zealand governments now treat factory-built homes as one route to large supply targets. The National Cabinet agreed to build 1.2 million well-located homes over five years from July 1, 2024, according to the Australian Treasury. The federal government committed AUD 54 million to prefab and modular housing in March 2025, including AUD 4.7 million for a voluntary national certification process, according to Australian Broker. New Zealand runs BuiltReady, a voluntary scheme that certifies modular component manufacturers against its building code, according to the building ministry. As a result, Oceania grows at 9.83% a year, the second-fastest sub-regional rate.
Volumetric public flats and Japanese capital reach Oceania
Why is the shift to volumetric public flats accelerating?
Housing agencies now order complete room modules rather than frames, because finished units shorten the time between tender and move-in. Hong Kong received about 20,900 applications for Light Public Housing between June 2024 and March 24, 2025, and tenants began moving into the Yau Pok Road site on March 28, 2025. Modscape made 48 modules for QBuild low-rise social housing in 12 weeks at its Queensland plant, within a program of 122 dwellings across 45 locations. Homes Victoria also trucked seven modular homes about four hours from Ravenhall to Nhill in December 2025 under its Big Housing Build. As a result, modular / volumetric units grow at 9.74% a year, the fastest product rate.
How is the rise of Japanese capital reshaping Oceania?
Japanese housebuilders are taking their factory methods into Australia, where land supply and demand are both rising. Sekisui Chemical resolved on Sept. 10, 2026, to buy 51% of Ausbuild, a Brisbane builder that has completed more than 10,000 homes, according to The Good Builder. Sekisui Chemical said it has supplied more than 68,000 industrialised houses in Japan and aims to grow modular townhouses in Australia within about three years. Daiwa House Industry runs condominium, rental and land businesses in Oceania, including the Box Hill project, according to its group website. As a result, integrated design and build contracts, in which one firm designs, makes and erects each home, keep a 52.0% share of 2025 value.
Where is the next opening in South Asian urban housing?
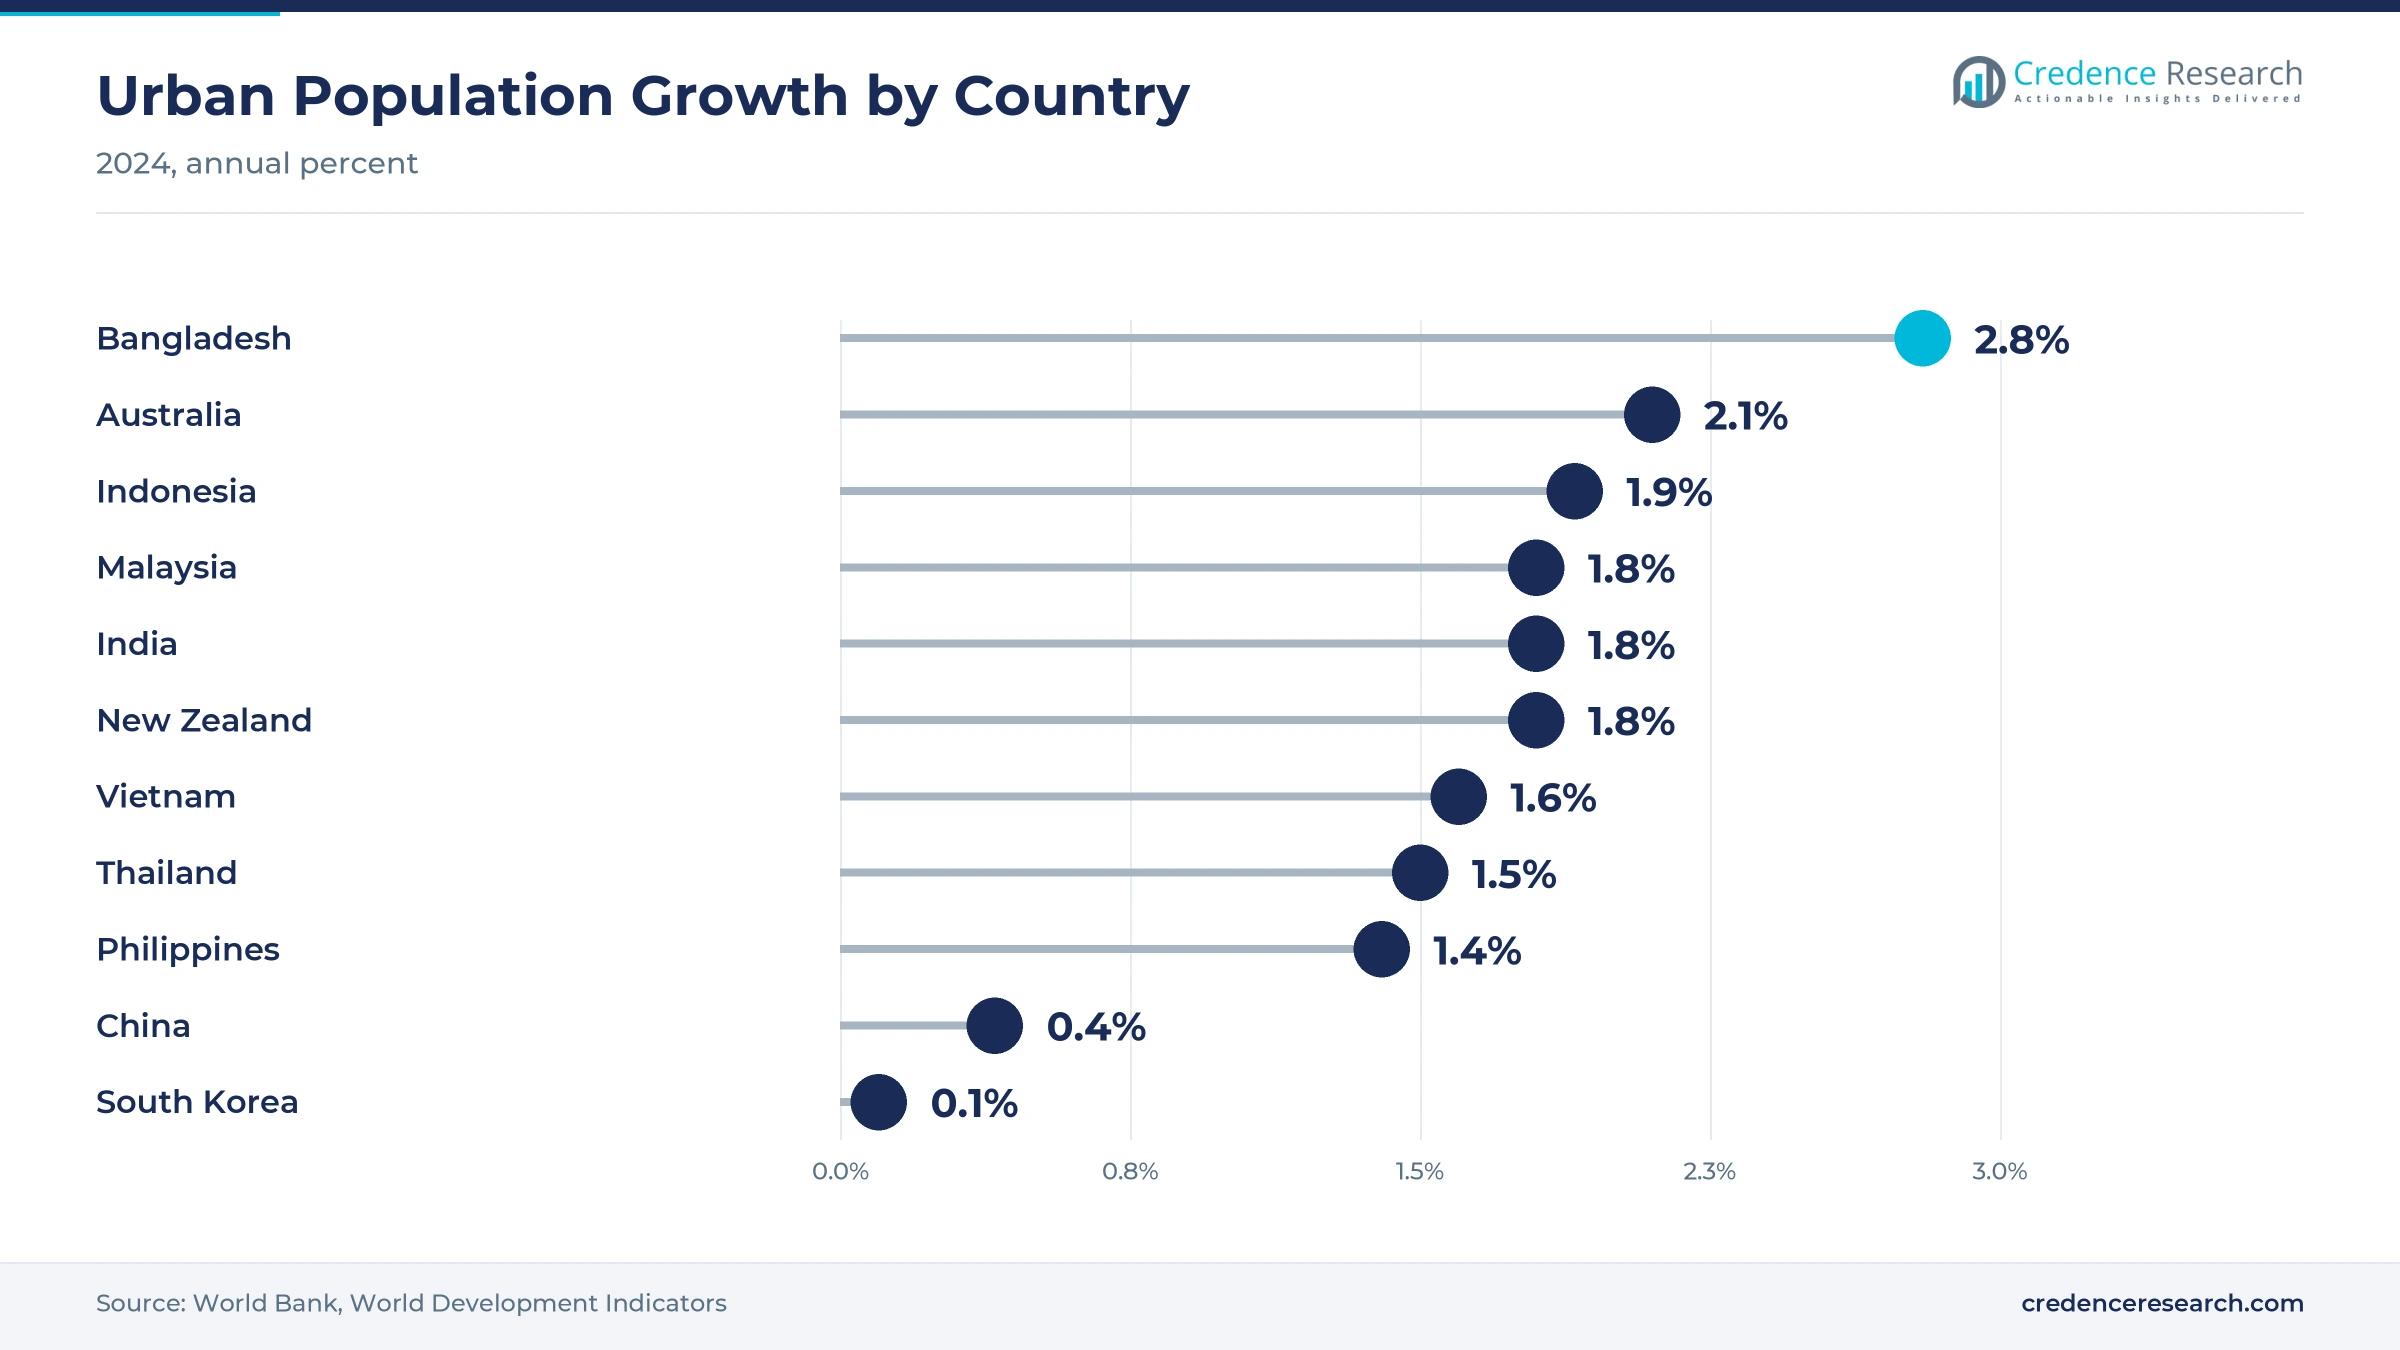
India offers the largest untapped demand, because its urban programs pay extra for innovative construction. PMAY-Urban 2.0 carries an investment of 10 lakh crore rupees and government assistance of 2.30 lakh crore rupees. The scheme pays a Technology Innovation Grant of 1,000 rupees per square meter for partnership projects and 3,000 rupees per square meter for rental housing that uses innovative technologies. A Technology and Innovation Sub-Mission also guides states toward modern and green construction methods. Urban population grew 1.8% in India and 2.8% in Bangladesh in 2024, according to the World Bank. As a result, South Asia becomes the fastest-growing sub-region in the forecast.
Is Malaysian factory policy an opening for Southeast Asia?
Southeast Asian governments are raising the share of factory content they require, which opens room for module and panel makers. Malaysia raised the minimum Industrialised Building System score for plan approval from 50 to 70 under a circular that took effect on July 10, 2024, according to The Edge Malaysia. The same report put system use on government projects at 91.5% in 2022 and listed Gamuda plants able to make 10,000 homes a year. Singapore launched 19,723 Build-To-Order flats in 2025 and plans about 55,000 flats from 2025 to 2027, according to its Housing and Development Board. As a result, Southeast Asia grows at 9.53% a year.
Cost premiums, approvals and weak starts slow adoption
How do cost premiums deter private developers?
Factory methods often cost more than site building until plants run at high volume. The Edge Malaysia reported that system costs are generally 5% to 15% above traditional methods in that market. As a result, private developers outside public programs adopt slowly and ask for incentives such as higher plot ratios. Producers respond with standard designs, longer order books and public contracts that keep lines running. Wider use of shared module sizes across agencies would also narrow the gap over time.
Why do approval and finance gaps slow modular homes?
Banks, insurers and local councils were built around site construction, so they often treat modules as unfamiliar assets. Australia funded a voluntary national certification process because separate state approvals slow offsite projects. In turn, buyers face longer approvals and fewer loan products than for site-built homes. Agencies respond with national schemes such as BuiltReady in New Zealand, while lenders and industry groups develop finance products designed for homes delivered in modules.
How do falling Japanese housing starts hit the core market?
Japan is the largest single source of factory-built homes, yet its new housing starts keep falling as the population shrinks. Prefabricated starts fell 10% in 2024, faster than the 3.3% fall in all starts. Timber Online reported that second-quarter 2025 starts were the lowest since records began in 2005. As a result, East Asia grows below the regional rate, and Japanese firms shift capital to Australia and rental projects. These firms also push higher energy specifications to keep the value per home rising in Japan.
Why do transport limits cap module size and reach?
Volumetric units must travel by road from the plant, so width limits and distance set the size of each module. Sarawak had 13 system suppliers and none in Miri, which made the Malaysian score target hard to meet there. As a result, remote sites pay more for freight and cranes than city projects. Makers respond with regional plants, flat-pack panels and hybrid designs that ship parts rather than whole rooms. Some producers also set up temporary plants near large public sites to cut freight distance.
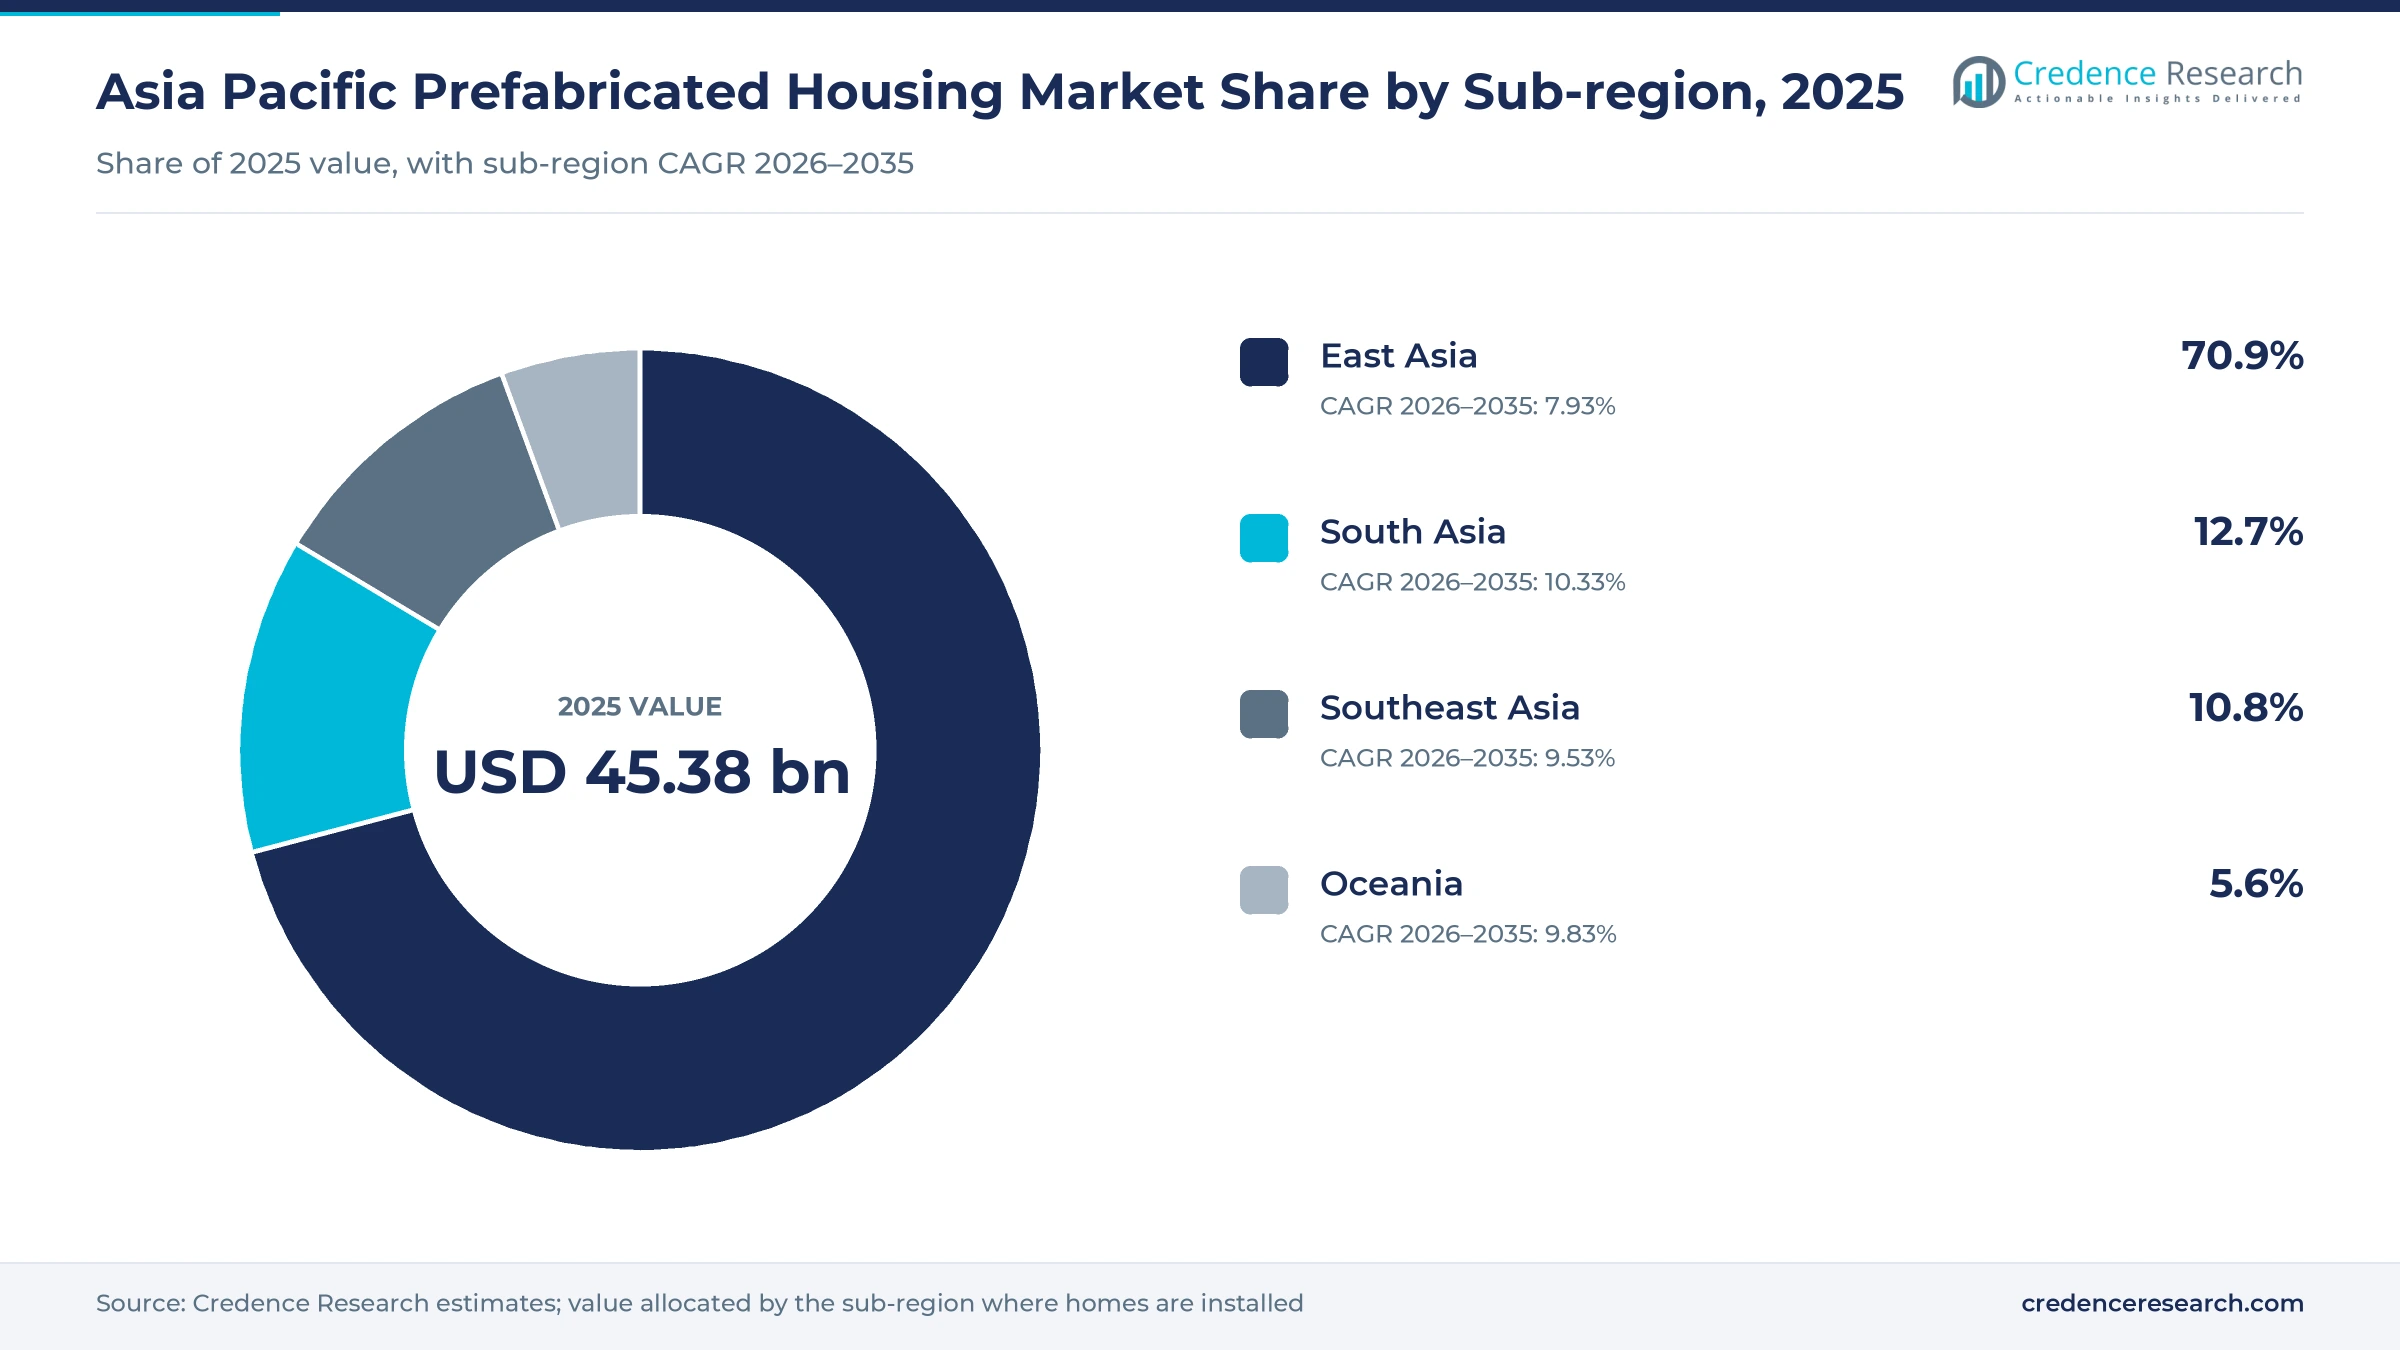
East Asia holds most value while South Asia grows fastest
| Sub-region | Value, 2025 (USD billion) | Share, 2025 | CAGR, 2026–2035 |
|---|---|---|---|
| East Asia | 32.17 | 70.9% | 7.93% |
| South Asia | 5.76 | 12.7% | 10.33% |
| Southeast Asia | 4.90 | 10.8% | 9.53% |
| Oceania | 2.54 | 5.6% | 9.83% |
Why does East Asia hold most regional value?
East Asia held a 70.9% share of 2025 value and grows at 7.93% a year, because Japan and China host the deepest factory housing industries in the region. Japan started 93,082 prefabricated homes in 2024 out of 792,195 new homes, according to the Ministry of Land, Infrastructure, Transport and Tourism. China started 740 million square meters of prefabricated floor area in 2021, or 24.5% of all newly started building area, according to the People's Daily, and Hong Kong adds Light Public Housing.
How does South Asia become the fastest-growing sub-region?
South Asia held a 12.7% share of 2025 value and grows fastest at 10.33% a year, because India is starting a five-year program for 1 crore urban homes. The program rewards projects that use innovative technologies with grants per square meter, which favors precast and panel systems. Bangladesh also had the fastest urban population growth among the countries tracked in 2024, which adds long-term demand for low-cost homes.
What drives factory housing in Southeast Asia?
Southeast Asia held a 10.8% share of 2025 value and grows at 9.53% a year, because Singapore and Malaysia require high factory content in public and large private projects. Singapore's housing board relies on volumetric and bathroom modules, and Malaysia lifted its minimum system score to 70 in 2024. Urban growth of 1.9% in Indonesia and 1.6% in Vietnam in 2024 adds a later wave of demand.
Why does Oceania grow faster than its share suggests?
Oceania held a 5.6% share of 2025 value and grows at 9.83% a year, because Australian governments pair a 1.2 million home target with funding for offsite methods. Fleetwood and Ausco built 27 modular homes for Mackay in Queensland, and Modscape runs plants in Victoria and Queensland. Sekisui Chemical's Ausbuild deal also brings Japanese factory housing into the private market in South East Queensland.
Public orders and housebuilder deals, 2024 to 2026
| Development | Status and market relevance |
|---|---|
| In August 2024, Queensland announced 27 modular homes for Mackay, built by Fleetwood and Ausco in their state factories. | Shows state social housing orders reaching regional module makers |
| In March 2025, Hong Kong began tenant intake at the Yau Pok Road Light Public Housing site. | Marks the first occupied project in the 30,000-unit program |
| In March 2025, Australia committed AUD 54 million to prefab and modular housing, including national certification. | Funds state programs and faster approvals for offsite homes |
| In December 2025, Homes Victoria delivered seven modular homes built in Ravenhall to Nhill. | Extends factory-built social homes into regional Victoria |
| In September 2026, Sekisui Chemical resolved to acquire 51% of Brisbane builder Ausbuild. | Brings Japanese factory housing into Australian private homes |
Steel frames, volumetric units and factory finishing
- Light steel frames are cut and assembled in plants and bolted on site, which suits the detached homes Japanese housebuilders sell.
- Volumetric room units leave the factory with walls, wiring and finishes in place, which cuts on-site work to weeks for public flats.
- Precast concrete panels are cast in molds and lifted into place, which suits high-rise flats in China, Singapore and Malaysia.
- Engineered timber such as cross-laminated timber panels lowers weight and embodied carbon, which helps low-rise homes meet new energy rules.
Need a Custom Version of This Report?
Tailor the scope, geography, or segments to your exact requirements.
- Custom geography or segment scope
- Direct access to our analyst team
Japanese housebuilders face module makers and precasters
Competition combines Japanese housebuilders that make homes in their own plants with module makers in Australia and precast and modular producers in China. Sekisui House has built more than 2.7 million homes including overseas projects. Toyota Housing, Misawa Homes and Panasonic Homes have been group companies of Prime Life Technologies, set up by Panasonic and Toyota, since January 2020. Sekisui Chemical brings its unit housing to Queensland through Ausbuild. In Australia, Fleetwood and Ausco build modular social homes in Queensland factories, and Modscape has delivered over 600 projects. Changsha Broad Homes sells volumetric BOX Modul units and rural homes in China. Firms compete on delivery speed, energy performance and access to public tenders, while large panelized building systems contracts favor makers with spare factory capacity.
Which housebuilders and module makers lead the region?
| Company | Type | Role in the market |
|---|---|---|
| Sekisui House | Housebuilder | Over 2.7 million homes built; expanding in-house crafters in Japan |
| Daiwa House Industry | Housebuilder and developer | Condominiums in China; residential land and rental projects in Oceania |
| Sekisui Chemical | Unit housing maker | Over 68,000 industrialised houses in Japan; buying 51% of Ausbuild |
| Panasonic Homes | Housebuilder | Prime Life Technologies group company since January 2020 |
| Toyota Housing Corporation | Housebuilder | Prime Life Technologies group company; ZEH-level insulation as standard |
| Misawa Homes | Housebuilder | Prime Life Technologies group company in Japanese detached homes |
| Changsha Broad Homes Industrial Group | Modular maker | BOX Modul units delivered to over 16 Chinese provinces |
| Fleetwood Australia | Module maker | Modular social homes for Mackay from Queensland factory |
| Ausco Modular | Module maker | Modular social homes for Mackay from Queensland factory |
| Modscape | Module maker | Over 600 projects; 48 QBuild modules made in 12 weeks |
Credence Research view on factory-built regional homes
Credence Research's view is that Asia Pacific demand for factory-built homes will more than double by 2035 because public housing programs, site labor gaps and tighter energy rules all favor work done in plants. Steel and timber systems remain the largest product type, while volumetric units grow fastest. East Asia keeps most regional value, but weak Japanese starts hold its growth below the regional rate. South Asia and Oceania gain share as India and Australia fund new homes at scale. Producers that pair public tender access with flexible factory capacity should gain share fastest.
How the regional factory-built home estimate was built
The report uses 2025 as the base year on a calendar basis, and market values come from the Credence Research model. That model combines housing start statistics, public housing program data, urban population indicators and product information disclosed by companies. The 2025 sub-regional shares come from the client data, while segment splits and growth rates are Credence Research estimates. Sources used are official statistics, government releases, company releases, news reports and company websites, and no interviews or surveys were used.
Public programs and volumetric units carry growth to 2035
The Asia Pacific prefabricated housing market is expected to reach USD 103.33 billion by 2035, an 8.55% CAGR during 2026–2035, as public programs and labor shortages push more homes into factories. Growth should stay strong through 2028 while Hong Kong, India and Australian states deliver large public housing batches. After that, private volumetric townhouses and energy-efficient detached homes will carry more growth. Faster approval reform in Australia and India would raise this outlook, while a deeper fall in Japanese starts would lower it. Producers with public contracts and regional plants are expected to gain the most.
Frequently Asked Questions
How big is the Asia Pacific prefabricated housing market?
Which product type leads regional demand?
Which sub-region leads the regional market?
Why does government and social housing grow fastest?
How do energy rules affect factory-built homes?
Which operating model leads the market?
Who are the leading companies in the region?
What are the main challenges for buyers?
Table of Content
Chapter 1 Market Segmentation
- 1.1 Segmentation Framework
- 1.1.1 Product and Service Classification
- 1.1.2 Application and End-Use Classification
- 1.1.3 Technology and Solution Classification
- 1.1.4 Customer and Distribution Channel Classification
- 1.1.5 Geographic Segmentation
- 1.1.6 Market Segment Definitions and Boundaries
- 1.2 By Product Type
- 1.2.1 Pre-engineered Steel/Timber
- 1.2.2 Precast Concrete
- 1.2.3 Modular / Volumetric
- 1.2.4 Panelised Systems
- 1.3 By Application
- 1.3.1 Private Housing
- 1.3.2 Government / Social Housing
- 1.3.3 Student / Worker Accommodation
- 1.4 By Operating Model
- 1.4.1 Integrated Design and Build
- 1.4.2 Supply and Install
- 1.4.3 Factory Supply Only
- 1.5 By Sales Channel
- 1.5.1 Direct Homebuyer Sales
- 1.5.2 Direct Project Contracts
- 1.5.3 Public Procurement Tenders
- 1.5.4 Authorised Dealer Networks
- 1.6 By Sub-region
- 1.6.1 East Asia
- 1.6.2 South Asia
- 1.6.3 Southeast Asia
- 1.6.4 Oceania
Chapter 2 Introduction
- 2.1 Report Objectives and Scope
- 2.2 Product Definition and Industry Terminology
- 2.3 Market Inclusions and Exclusions
- 2.4 Research Process
- 2.4.1 Primary Research and Expert Interviews
- 2.4.2 Secondary Research and Source Review
- 2.4.3 Top-Down and Bottom-Up Estimation
- 2.4.4 Data Triangulation and Verification
- 2.5 Market Size Measurement Basis
- 2.5.1 2025: USD 45.38 billion → 2035: USD 103.33 billion
- 2.6 Historical and Forecast Reference Periods
- 2.6.1 Historical Period: 2018-2025
- 2.6.2 Base Year: 2025
- 2.6.3 Forecast Period: 2025-2035
- 2.7 Research Assumptions and Limitations
Chapter 3 Executive Summary
- 3.1 Market Snapshot and Key Findings
- 3.2 Base-Year Market Size, 2025
- 3.3 Forecast Market Size, 2035
- 3.4 Revenue and Volume Growth Outlook
- 3.5 Key Demand and Supply Indicators
- 3.6 Leading Market Segments
- 3.7 Fastest-Growing Market Opportunities
- 3.8 Regional Performance Highlights
- 3.9 Technology and Industry Transformation
- 3.10 Competitive Landscape Summary
- 3.11 Analyst View and Strategic Implications
Chapter 4 Asia Pacific Prefabricated Housing Market Trends and Developments
- 4.1 Historical Industry Development, 2018-2025
- 4.2 Recent Market Trends and Developments
- 4.3 Demand and Customer Behavior Trends
- 4.4 Technology and Product Innovation
- 4.5 Artificial Intelligence, Automation and Digitalization
- 4.6 Local Manufacturing and Supply Chain Realignment
- 4.7 Industry Partnerships, Mergers and Acquisitions
- 4.8 Sustainability and Circular Economy Developments
- 4.9 Government and Private Sector Investment Trends
- 4.10 Emerging Business Models and Commercialization
- 4.11 Industry Developments and Announcements
Chapter 5 Asia Pacific Prefabricated Housing Market Production, Supply and Demand Analysis
- 5.1 Demand Trend and Consumption Analysis, 2018-2025
- 5.2 Demand Forecast, 2025-2035
- 5.3 Production and Output Trend, 2018-2025
- 5.4 Production and Output Forecast, 2025-2035
- 5.5 Installed Capacity and Capacity Utilization
- 5.6 Company-Wise Production Plants and Statistics
- 5.6.1 Installed Production Capacity
- 5.6.2 Actual Production
- 5.6.3 Planned Capacity and Expansion Targets
- 5.7 Supply Chain Structure and Procurement Trends
- 5.8 Supply-Demand Gap and Bottlenecks
- 5.9 Import Dependence and Sourcing Structure
- 5.10 Contract Manufacturing and Outsourcing
- 5.11 Regional Supply and Demand Concentration
Chapter 6 Asia Pacific Prefabricated Housing Market Pricing Analysis
- 6.1 Pricing Structure and Measurement
- 6.2 Historical Pricing Trends, 2018-2025
- 6.3 Pricing Outlook, 2025-2035
- 6.4 Average Selling Price and Unit Economics
- 6.5 Pricing by Product and Market Segment
- 6.6 Geographic Pricing Differences
- 6.7 Key Input, Energy, Labor and Logistics Costs
- 6.8 Contract Pricing and Purchasing Models
- 6.9 Pricing Sensitivity and Competitive Positioning
- 6.10 Price, Margin and Profitability Implications
Chapter 7 Asia Pacific Prefabricated Housing Market Dynamics
- 7.1 Market Growth Drivers
- 7.1.1 Demand-Side Drivers
- 7.1.2 Technology and Innovation Drivers
- 7.1.3 Infrastructure and Investment Drivers
- 7.1.4 Regulatory and Policy Drivers
- 7.2 Market Restraints
- 7.2.1 Cost and Affordability Constraints
- 7.2.2 Technology and Adoption Barriers
- 7.2.3 Supply Chain and Operational Constraints
- 7.3 Market Challenges
- 7.3.1 Competitive Pressure and Margin Erosion
- 7.3.2 Skills, Infrastructure and Implementation Gaps
- 7.4 Emerging Market Opportunities
- 7.5 Market Dynamics Impact and Time-Horizon Assessment
Chapter 8 Asia Pacific Prefabricated Housing Value Chain Analysis
- 8.1 Industry Value Chain Overview
- 8.2 Upstream Suppliers and Critical Inputs
- 8.3 Technology and Component Providers
- 8.4 Manufacturing or Service Delivery
- 8.5 Distribution, Channel Partners and Integrators
- 8.6 Downstream Applications and End Users
- 8.7 Value Addition and Profit Pools
- 8.8 Vertical Integration and Outsourcing
- 8.9 Supplier Concentration and Risk
- 8.10 Supply Chain Localization and Resilience
Chapter 9 Asia Pacific Prefabricated Housing Market Regulations and Policies
- 9.1 Relevant Laws, Standards and Compliance Frameworks
- 9.2 Product, Service, Safety and Quality Requirements
- 9.3 Government Policies, Incentives and Subsidies
- 9.4 Imports, Exports and Trade Barriers
- 9.5 Public Procurement and Local Content Requirements
- 9.6 Environmental and Sustainability Compliance
- 9.7 Upcoming Policy Changes and Market Implications
Chapter 10 Asia Pacific Prefabricated Housing Market Hotspots and Opportunities
- 10.1 Market Opportunity Mapping and Growth Hotspots
- 10.2 High-Growth Applications and Customer Groups
- 10.3 Underserved Markets and White-Space Opportunities
- 10.4 Emerging Technology and Product Opportunities
- 10.5 New Capacity and Investment Hotspots
- 10.6 Market Entry and Expansion Opportunities
- 10.7 Distribution and Partnership Opportunities
- 10.8 Near-Term and Long-Term Commercial Potential
- 10.9 Opportunity Attractiveness and Execution Risks
Chapter 11 Asia Pacific Prefabricated Housing Market Outlook, 2025-2035
- 11.1 Market Size and Analysis
- 11.1.1 Revenue (Market Measurement: 2025: USD 45.38 billion → 2035: USD 103.33 billion)
- 11.1.2 Market Volume and Quantity Sold
- 11.1.3 Historical Market Size, 2018-2025
- 11.1.4 Base-Year Market Size, 2025
- 11.2 Market Forecast, 2025-2035
- 11.2.1 Revenue Forecast to 2035
- 11.2.2 Volume Forecast to 2035
- 11.2.3 CAGR and Year-on-Year Growth
- 11.2.4 Incremental Revenue Opportunity
- 11.3 Forecast Assumptions and Scenario Analysis
- 11.3.1 Base-Case Forecast
- 11.3.2 Optimistic and Conservative Scenarios
- 11.3.3 Technology, Pricing and Policy Sensitivities
- 11.4 Market Attractiveness and Growth Outlook
Chapter 12 Asia Pacific Prefabricated Housing Market Segmentation and Outlook
- 12.1 Segmentation Summary and Market Shares, 2025
- 12.2 Largest and Fastest-Growing Segments
- 12.3 By Product Type - Market Size and Forecast, 2025-2035
- 12.3.1 Segment Definition and Scope
- 12.3.2 Historical Market Size, 2018-2025
- 12.3.3 Revenue Forecast, 2025-2035
- 12.3.4 Volume Forecast, 2025-2035
- 12.3.5 Base-Year Market Share, 2025
- 12.3.6 Segment CAGR and Growth Drivers
- 12.3.7 Subsegment Market Size and Forecast
- 12.3.7.1 Pre-engineered Steel/Timber
- 12.3.7.2 Precast Concrete
- 12.3.7.3 Modular / Volumetric
- 12.3.7.4 Panelised Systems
- 12.3.8 Subsegment Pricing and Adoption Trends
- 12.3.9 Leading Suppliers and Competition
- 12.3.10 Regional Demand and Opportunities
- 12.4 By Application - Market Size and Forecast, 2025-2035
- 12.4.1 Segment Definition and Scope
- 12.4.2 Historical Market Size, 2018-2025
- 12.4.3 Revenue Forecast, 2025-2035
- 12.4.4 Volume Forecast, 2025-2035
- 12.4.5 Base-Year Market Share, 2025
- 12.4.6 Segment CAGR and Growth Drivers
- 12.4.7 Subsegment Market Size and Forecast
- 12.4.7.1 Private Housing
- 12.4.7.2 Government / Social Housing
- 12.4.7.3 Student / Worker Accommodation
- 12.4.8 Subsegment Pricing and Adoption Trends
- 12.4.9 Leading Suppliers and Competition
- 12.4.10 Regional Demand and Opportunities
- 12.5 By Operating Model - Market Size and Forecast, 2025-2035
- 12.5.1 Segment Definition and Scope
- 12.5.2 Historical Market Size, 2018-2025
- 12.5.3 Revenue Forecast, 2025-2035
- 12.5.4 Volume Forecast, 2025-2035
- 12.5.5 Base-Year Market Share, 2025
- 12.5.6 Segment CAGR and Growth Drivers
- 12.5.7 Subsegment Market Size and Forecast
- 12.5.7.1 Integrated Design and Build
- 12.5.7.2 Supply and Install
- 12.5.7.3 Factory Supply Only
- 12.5.8 Subsegment Pricing and Adoption Trends
- 12.5.9 Leading Suppliers and Competition
- 12.5.10 Regional Demand and Opportunities
- 12.6 By Sales Channel - Market Size and Forecast, 2025-2035
- 12.6.1 Segment Definition and Scope
- 12.6.2 Historical Market Size, 2018-2025
- 12.6.3 Revenue Forecast, 2025-2035
- 12.6.4 Volume Forecast, 2025-2035
- 12.6.5 Base-Year Market Share, 2025
- 12.6.6 Segment CAGR and Growth Drivers
- 12.6.7 Subsegment Market Size and Forecast
- 12.6.7.1 Direct Homebuyer Sales
- 12.6.7.2 Direct Project Contracts
- 12.6.7.3 Public Procurement Tenders
- 12.6.7.4 Authorised Dealer Networks
- 12.6.8 Subsegment Pricing and Adoption Trends
- 12.6.9 Leading Suppliers and Competition
- 12.6.10 Regional Demand and Opportunities
- 12.7 By Sub-region - Market Size and Forecast, 2025-2035
- 12.7.1 Segment Definition and Scope
- 12.7.2 Historical Market Size, 2018-2025
- 12.7.3 Revenue Forecast, 2025-2035
- 12.7.4 Volume Forecast, 2025-2035
- 12.7.5 Base-Year Market Share, 2025
- 12.7.6 Segment CAGR and Growth Drivers
- 12.7.7 Subsegment Market Size and Forecast
- 12.7.7.1 East Asia
- 12.7.7.2 South Asia
- 12.7.7.3 Southeast Asia
- 12.7.7.4 Oceania
- 12.7.8 Subsegment Pricing and Adoption Trends
- 12.7.9 Leading Suppliers and Competition
- 12.7.10 Regional Demand and Opportunities
- 12.8 Segment Growth Comparison
- 12.9 Segment Attractiveness and Priority Matrix
Chapter 13 Asia Pacific Prefabricated Housing End-Use and Application Market Outlook
- 13.1 End-Use Industry and Customer Demand Structure
- 13.2 Leading Applications and Customer Groups
- 13.3 End-Use Market Size, Share and Forecast
- 13.4 Major End-Use Industry Deep Dives
- 13.4.1 Customer Requirements and Use Cases
- 13.4.2 Demand and Replacement Cycles
- 13.4.3 Technical and Regulatory Considerations
- 13.4.4 Purchasing and Procurement Models
- 13.4.5 Leading Vendors and Distribution Channels
- 13.4.6 Forecast and Commercial Opportunities
- 13.5 Emerging Applications and Cross-Segment Demand
- 13.6 End-Use Industry Investment Priorities
Chapter 14 Asia Pacific Prefabricated Housing Geographic Market Outlook, 2025-2035
- 14.1 Regional Market Size and Country-Level Shares, 2025
- 14.2 Country Market Size Comparison, 2025
- 14.3 Country Market Forecasts, 2025-2035
- 14.4 Subregional Industrial and Demand Clusters
- 14.5 Intra-Regional Pricing and Cost Differences
- 14.6 Cross-Border Trade and Supply Networks
- 14.7 Regional Supply and Demand Balances
- 14.8 Country Opportunity Comparison and Prioritization
Note: Every listed country is covered on the structure shown under the first country.
Chapter 15 Asia Pacific Prefabricated Housing Technology, Innovation and Sustainability Outlook
- 15.1 Technology Landscape and Maturity
- 15.2 Product, Process and Service Innovation
- 15.3 AI, Automation and Digital Tools in the Industry
- 15.4 Technology Adoption and Performance Benchmarking
- 15.5 Innovation Pipeline and R&D Investment
- 15.6 Patent and Intellectual Property Trends
- 15.7 Energy Efficiency and Resource Management
- 15.8 Sustainability, Recycling and Circularity
- 15.9 Technology Roadmap, 2025-2035
- 15.10 Risks of Obsolescence and Technology Substitution
Chapter 16 Asia Pacific Prefabricated Housing Market Key Strategic Imperatives
- 16.1 Growth and Market Entry Priorities
- 16.2 High-Return Products and Segments
- 16.3 Pricing, Profitability and Cost Optimization
- 16.4 Technology Investment and Product Differentiation
- 16.5 Supply Chain Localization and Resilience
- 16.6 Distribution and Customer Acquisition
- 16.7 Partnership, Acquisition and Capacity Strategy
- 16.8 Regional Expansion Priorities
- 16.9 Short-, Medium- and Long-Term Actions
Chapter 17 Competition Outlook
- 17.1 Industry Competition Characteristics
- 17.2 Market Structure and Concentration
- 17.3 Market Share and Competitive Positioning, 2025
- 17.4 Company-Wise Revenue and Product Benchmarking
- 17.5 Production and Service Capacity Benchmarking
- 17.6 Technology, Pricing and Differentiation
- 17.7 Regional Footprint and Distribution Strength
- 17.8 Mergers, Acquisitions and Strategic Alliances
- 17.9 New Entrants and Competitive Threats
- 17.10 Porter's Five Forces and Industry Attractiveness
- 17.11 Competitive Outlook, 2025-2035
Chapter 18 Company Profiles
- 18.1 Company Coverage and Selection Criteria
- 18.2 Sekisui House
- 18.2.1 Business Description
- 18.2.2 Company Ownership and Geographic Presence
- 18.2.3 Product and Service Portfolio
- 18.2.4 Manufacturing and Operating Footprint
- 18.2.5 Production Capacity and Expansion Plans
- 18.2.6 Financial Performance and Investment
- 18.2.7 Market Share and Competitive Position
- 18.2.8 Technology and Innovation Capabilities
- 18.2.9 Strategic Alliances or Partnerships
- 18.2.10 Recent Developments
- 18.2.11 Growth Strategy and Outlook
- 18.3 Daiwa House Industry
- 18.4 Sekisui Chemical
- 18.5 Panasonic Homes
- 18.6 Toyota Housing Corporation
- 18.7 Misawa Homes
- 18.8 Changsha Broad Homes Industrial Group
- 18.9 Fleetwood Australia
- 18.10 Ausco Modular
- 18.11 Modscape
- 18.12 Other Relevant Market Participants
Note: Every listed company is profiled on the structure shown under the first company. The company list is preliminary and may change based on research findings, market developments, data availability and client requirements.
Chapter 19 Disclaimer
- 19.1 Research and Forecast Disclaimer
- 19.2 Data Source and Estimation Limitations
Note: The depth of individual sections depends on data availability for this market. Volume, capacity, trade and other unit-based metrics are included where applicable.

