
Housing starts and envelope rules set joint-sealing demand
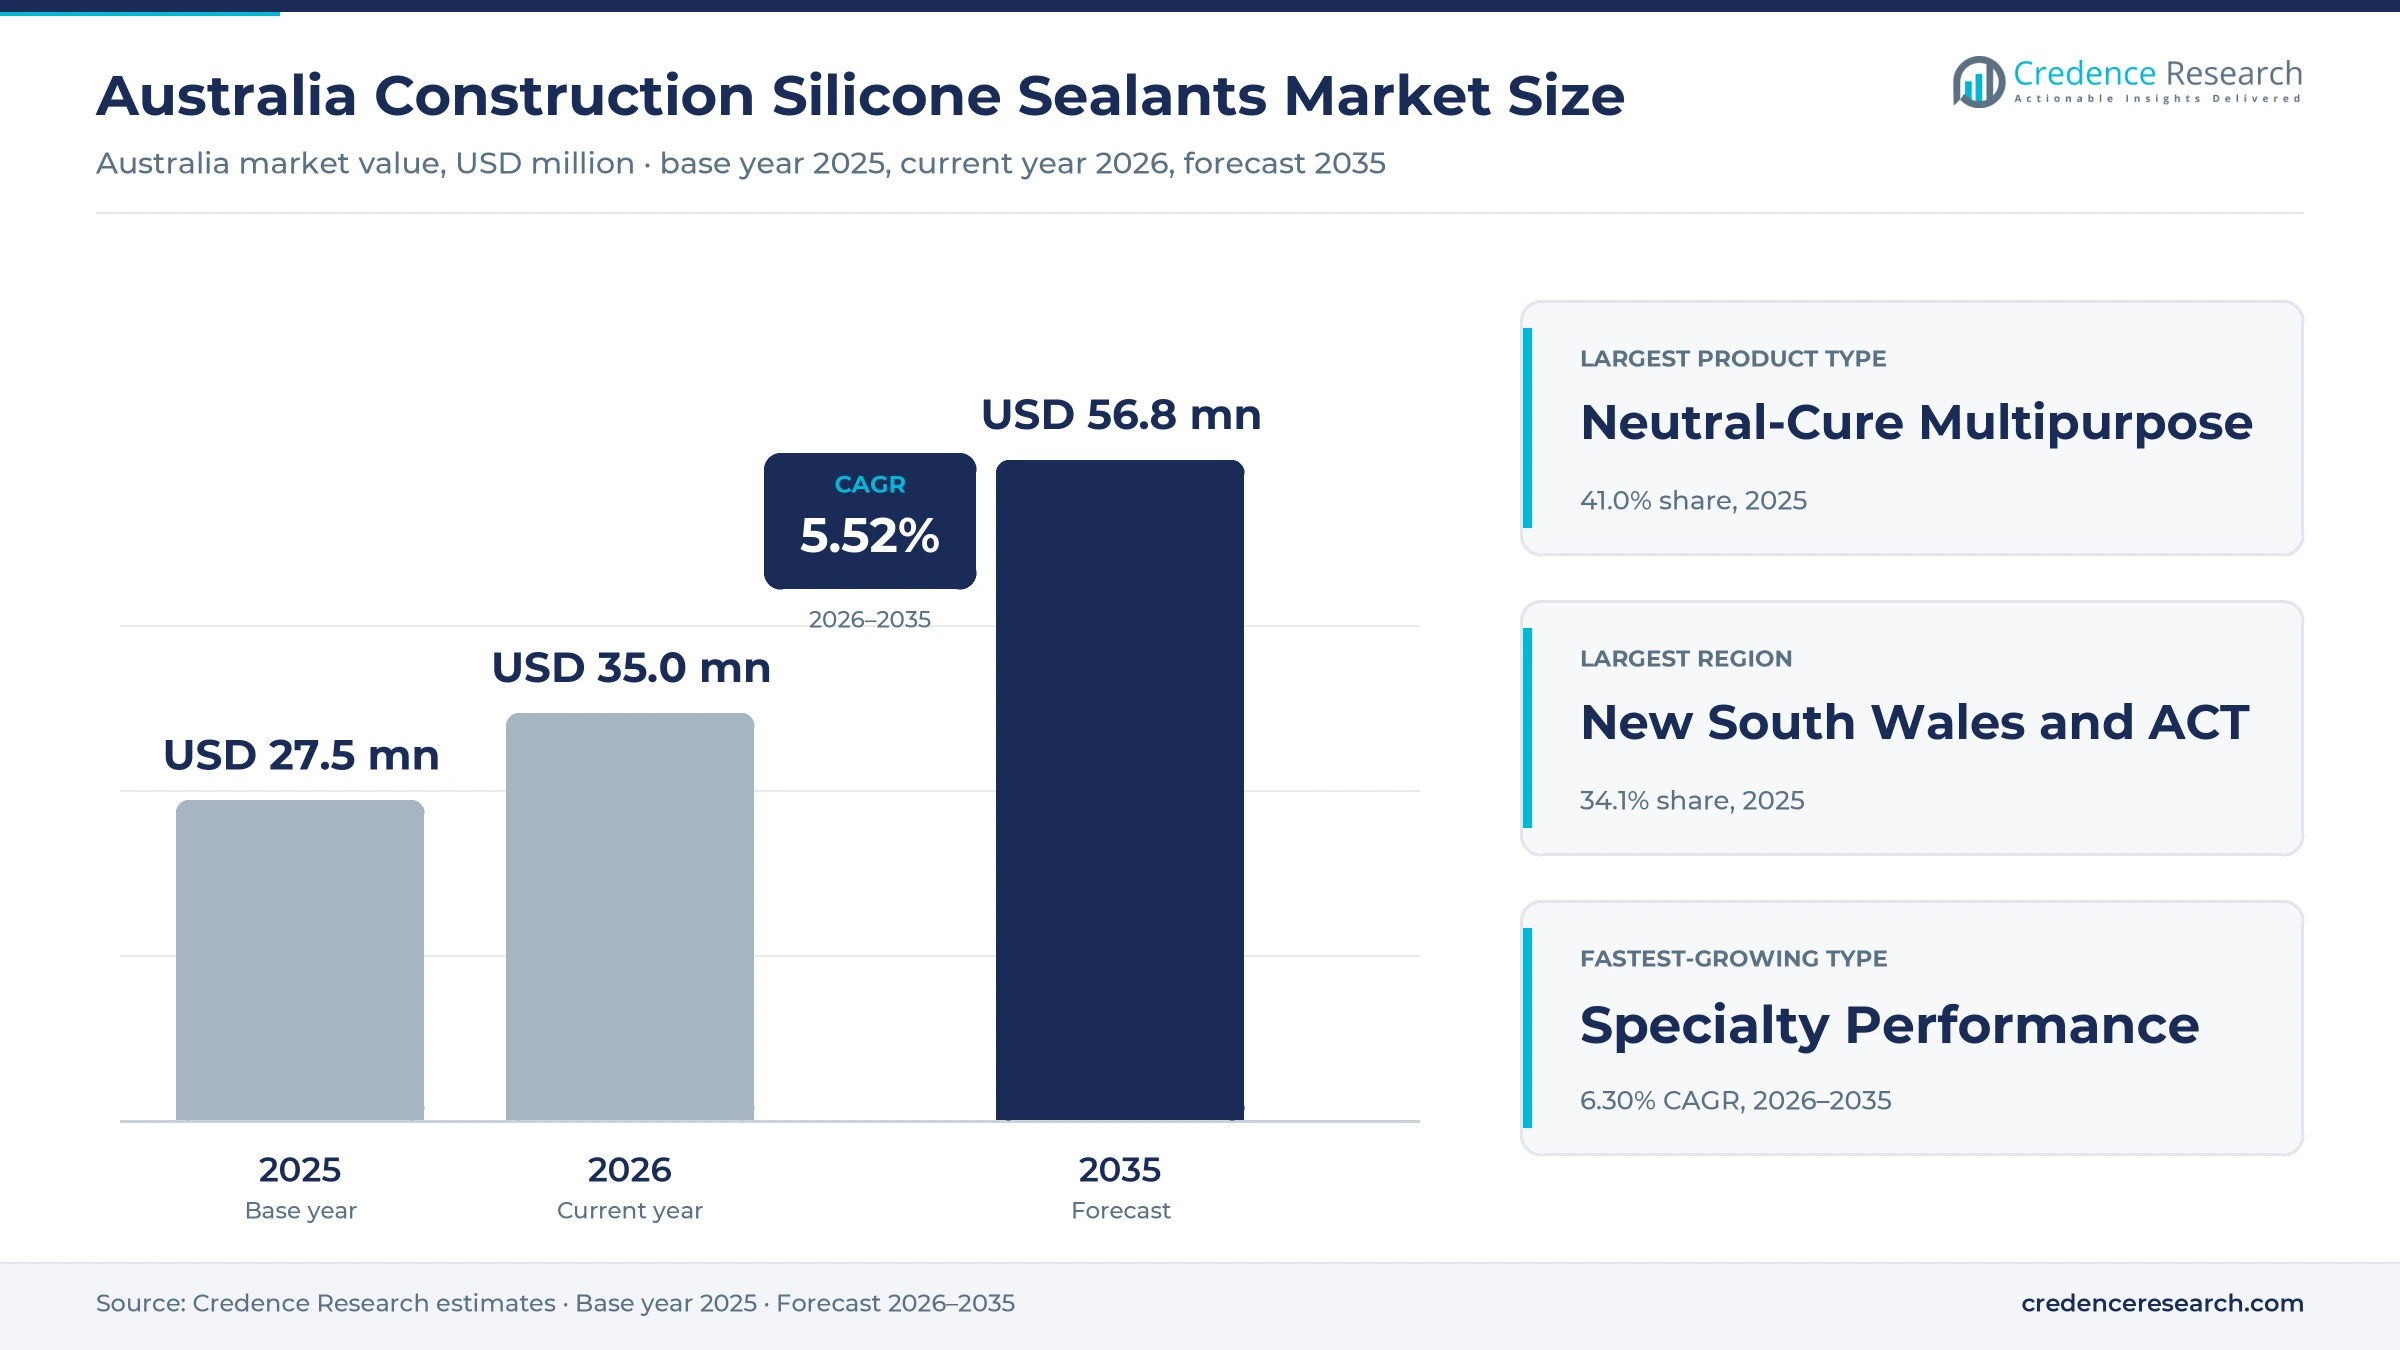
The Australia construction silicone sealants market was valued at USD 27.5 million in 2025 and is projected to increase from USD 35.0 million in 2026 to USD 56.8 million by 2035, registering a CAGR of 5.52% during 2026–2035. Demand comes from builders, glaziers, window fabricators, roofers, plumbers, tilers and maintenance contractors that seal joints in new homes, apartments, commercial buildings and public assets. New South Wales and ACT held the largest regional share, 34.1% in 2025, because Sydney combines the largest stock of apartments and commercial towers with heavy renovation work. Queensland is the fastest-growing region at 5.97% a year, as dwelling starts rise and venue construction for the Brisbane 2032 Games begins. At the same time, the residential building code stays fixed at its 2022 edition until mid-2029, which keeps the 7-star thermal rule and the updated wet-area waterproofing standard in place for every new home.
Which silicone joint sealants does the estimate cover?
The estimate measures the value of one-component and two-component silicone sealants sold for use in Australian buildings and civil assets. It counts neutral-cure and acetoxy multipurpose grades, sanitary grades for showers, baths and kitchens, and specialty grades for structural glazing, high-movement facade joints and roof work, whether builders buy them on projects, through trade outlets or in hardware stores.
The estimate excludes polyurethane, hybrid polymer and acrylic sealants, silicone roof coatings and industrial, automotive and electronic uses. The value chain runs from silicone polymer suppliers and local or overseas formulators through glazing, roofing and building-supply distributors to the contractors and homeowners that apply the cartridges and sausages on site.
Australia Construction Silicone Sealants Market Insights
- The Australia construction silicone sealants market was valued at USD 27.5 million in 2025 and is projected to reach USD 56.8 million by 2035, registering a CAGR of 5.52% during 2026–2035.
- New South Wales and ACT held a 34.1% share of 2025 value, because Sydney holds the largest stock of apartments and glazed commercial buildings.
- Neutral-cure multipurpose sealants led with a 41.0% share of 2025 value, because trade users prefer one low-odor grade that adheres to glass, metal and masonry.
- Australia commenced 52,201 dwellings in the June quarter of 2026 in seasonally adjusted terms, up 7.0% on the March quarter, according to official building activity data.
- Specialty performance sealants grow fastest at 6.30% a year during 2026–2035, as structural glazing and high-movement facade joints need tested, specification grades.
Neutral-cure grades lead while specialty grades grow fastest
Why do neutral-cure multipurpose grades lead?
Based on product type, the market is categorized into neutral-cure multipurpose sealants, acetoxy multipurpose sealants, sanitary sealants and specialty performance sealants. Neutral-cure multipurpose sealants led with a 41.0% share of 2025 value, because they bond to metal, masonry and glass without the acid odor of acetoxy grades. Specialty performance sealants grow fastest at 6.30% a year, as glazing and facade contractors buy tested structural and high-movement grades.
How does facade and window work anchor demand?
Based on application, the market is categorized into facade and fenestration sealing, roofing and weatherproofing, wet-area sealing and building and civil joints. Façade and fenestration sealing led with 36.0% of 2025 value, because every window, door and curtain-wall frame needs a perimeter seal. Building and civil joints grow fastest at 6.00% a year, as public buildings, transport stations and venues add expansion and movement joints.
Why do residential buildings use the most sealant?
Based on end user, the market is categorized into residential buildings, commercial and industrial buildings, and public buildings and civil assets. Residential buildings led with a 58.0% share of 2025 value, because new homes and renovations need sealant in windows, bathrooms, kitchens and roofs. Public buildings and civil assets grow fastest at 6.10% a year, as state venue, hospital and transport budgets lift public building work.
How do specialist trade outlets reach installers?
Based on distribution channel, the market is categorized into direct project supply, specialist trade distribution and hardware retail. Specialist trade distribution led with a 46.0% share of 2025 value, because glaziers, roofers and plumbers buy through glazing, roofing and plumbing suppliers. Direct project supply grows fastest at 5.91% a year, as facade contractors order specification grades directly for large commercial and public projects.
| Segment Group | Leading Sub-segment | Share, 2025 | Fastest-growing Sub-segment | CAGR, 2026–2035 |
|---|---|---|---|---|
| By Product Type | Neutral-cure multipurpose sealants | 41.0% | Specialty performance sealants | 6.30% |
| By Application | Façade and fenestration sealing | 36.0% | Building and civil joints | 6.00% |
| By End User | Residential buildings | 58.0% | Public buildings and civil assets | 6.10% |
| By Distribution Channel | Specialist trade distribution | 46.0% | Direct project supply | 5.91% |
Request a Free Sample
Fill in your details and we'll send you a free sample report.
- Sample data tables & charts
- Research methodology
Dwelling starts, envelope rules and wet-area work lift use
How does housing delivery lift installation demand?
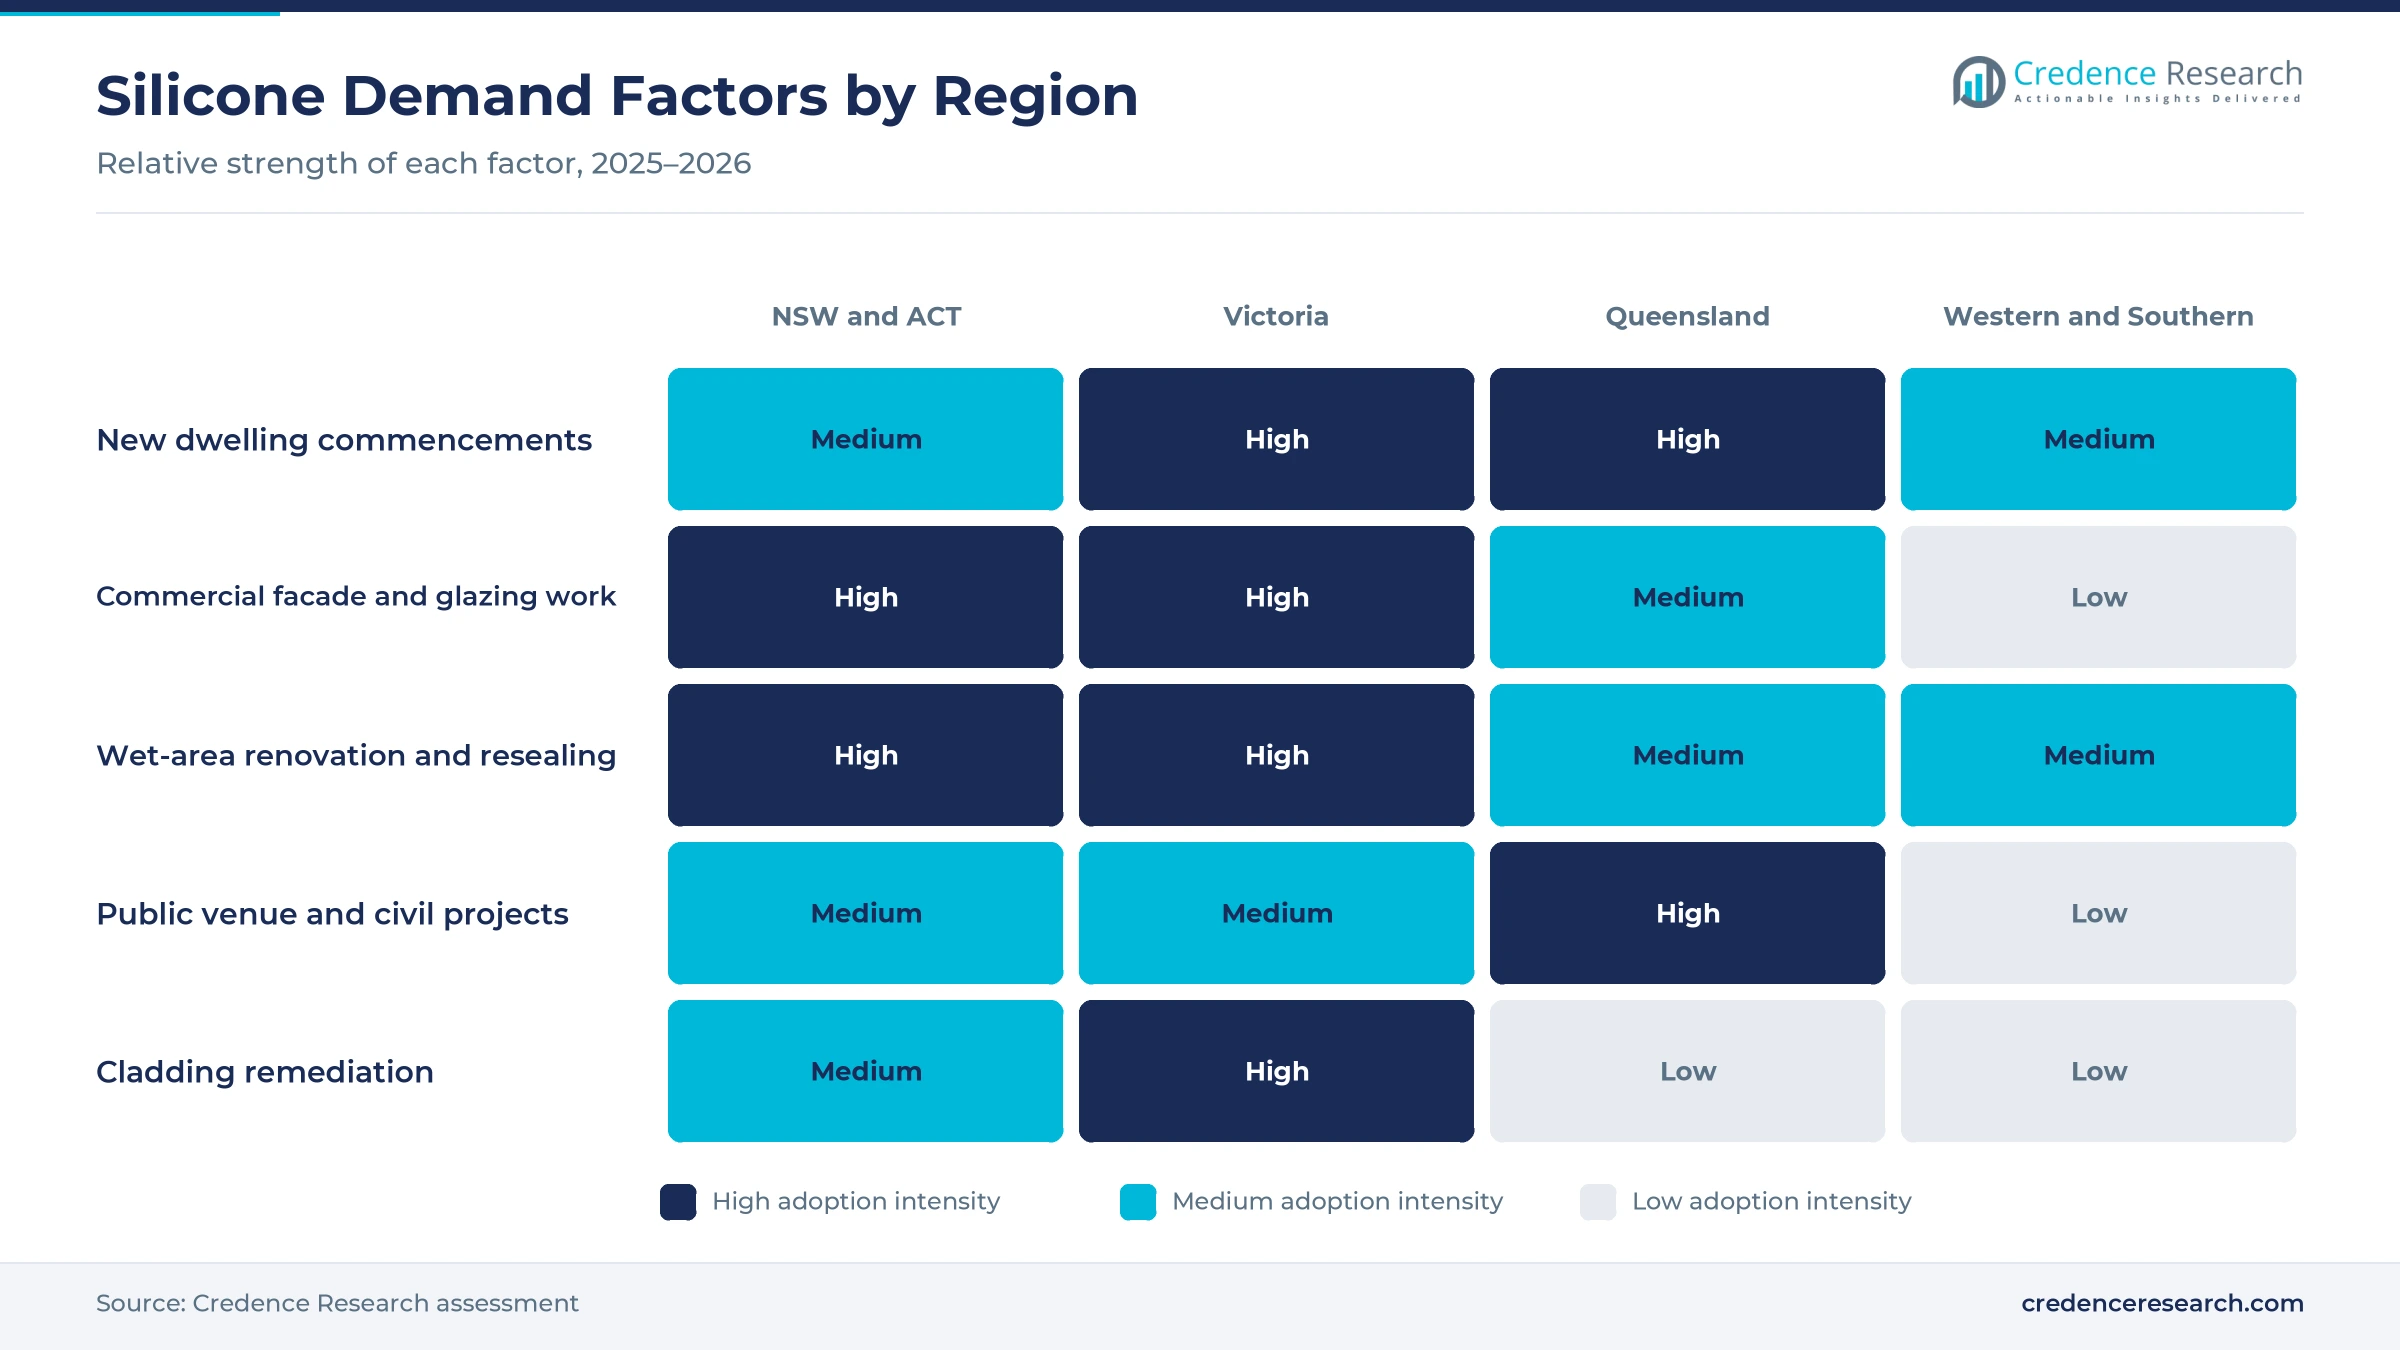
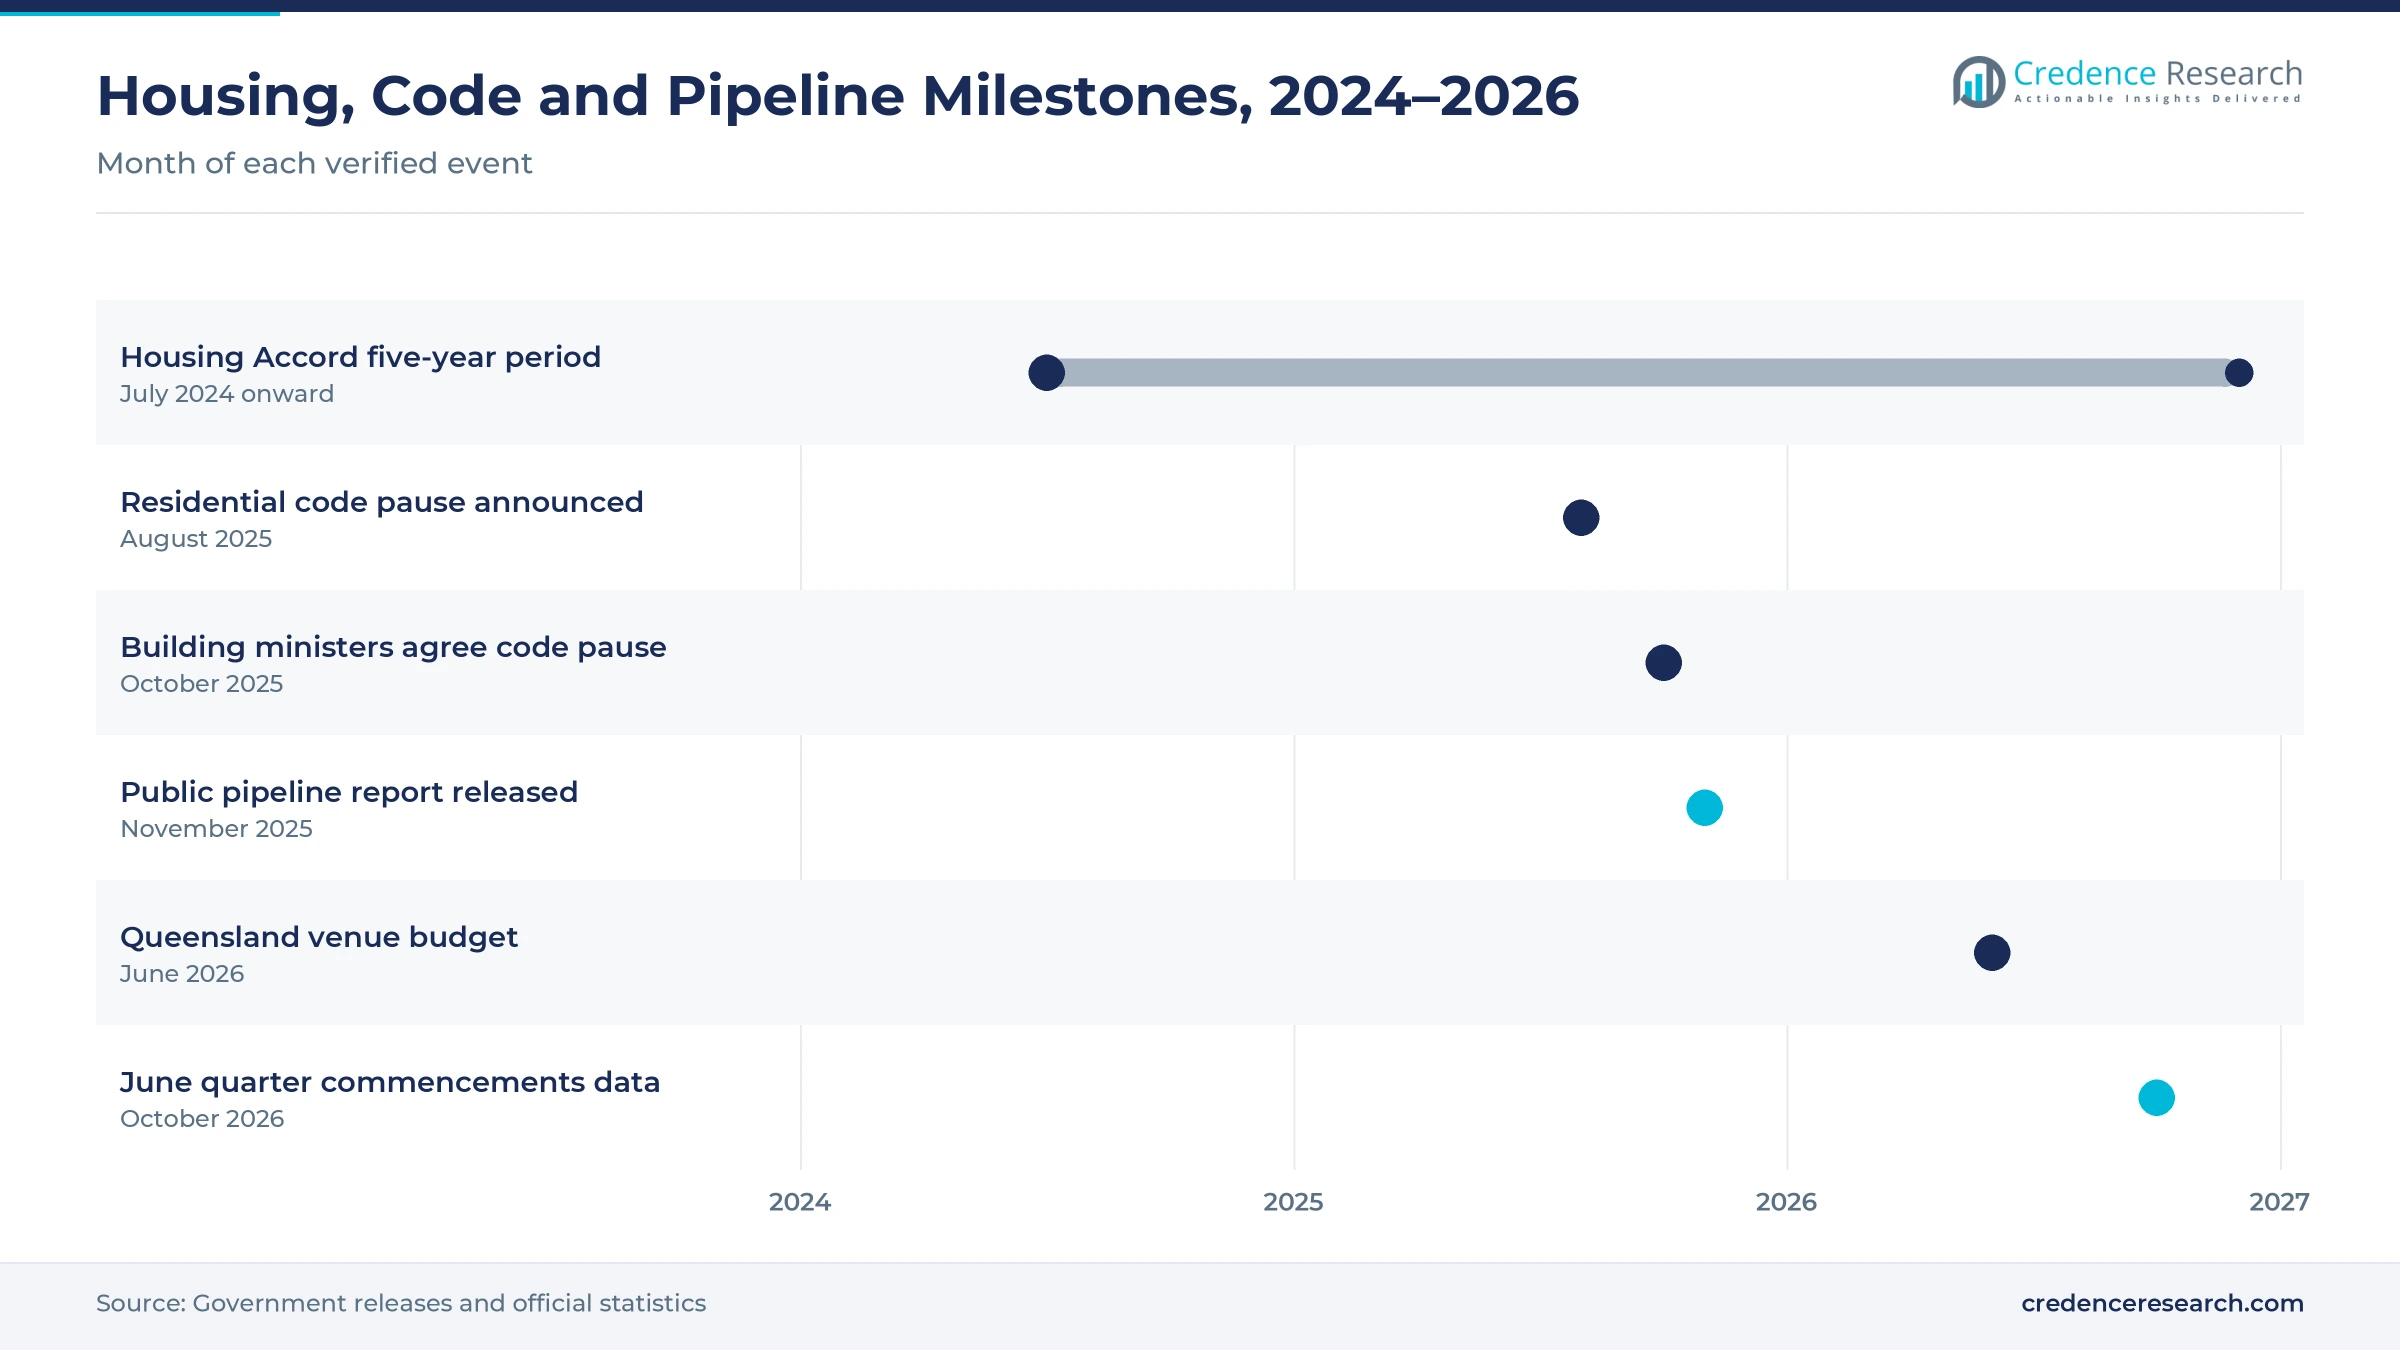
Every new dwelling needs silicone around windows, doors, showers, benchtops and roof flashings, so housing starts translate quickly into cartridge sales. The Australian Bureau of Statistics reported 52,201 dwelling commencements in the June quarter of 2026, up 7.0% in seasonally adjusted terms. Private house commencements rose to 31,707 in that quarter from 28,403 in the March quarter. The National Housing Accord, an agreement between governments, targets 1.2 million new homes over five years from July 1, 2024, according to the Treasury. Population growth of 1.53% in 2025, shown in World Bank data, keeps that housing need high. As a result, residential buildings hold 58.0% of 2025 value.
Why do building-envelope rules raise sealing quality?
Tighter thermal and moisture rules make joints around windows and cladding a performance item rather than a finishing touch. The Australian Building Codes Board says NCC 2022 lifts minimum thermal performance of new homes to the equivalent of seven stars and adds a whole-of-home energy budget. The same changes improve condensation management and add vapor permeance rules for some wall and roof materials. Building ministers reached an agreement in October 2025 to keep residential homes on NCC 2022 until mid-2029, Master Builders NSW reported, after the federal government announced the pause in August 2025. In turn, facade and fenestration sealing leads with 36.0% of 2025 value, because airtight window and door perimeters depend on durable silicone joints.
How does wet-area replacement keep sanitary demand steady?
Bathrooms, laundries and kitchens need resealing every few years, and failed joints are a common cause of water damage in apartments. A Building Commission NSW survey of 642 strata managers found waterproofing defects in 42% of buildings, the most common serious defect. NCC 2022 references the 2021 edition of AS 3740 for domestic wet areas, the Australian Building Codes Board says. The value of residential alterations and additions approved was A$1.28 billion in August 2026, according to the Australian Bureau of Statistics. As a result, sanitary sealants such as Selleys Wet Area Silicone, a neutral-cure grade with a 25-year guarantee against peeling or cracking, sell steadily through renovation cycles.
Why does the public building pipeline add joint volume?
Hospitals, schools, stations and stadiums use long runs of expansion, movement and glazing joints, which lifts demand for tested silicone grades. Infrastructure Australia announced on Nov. 13, 2025 that the five-year major public infrastructure pipeline would reach A$242 billion, with building projects rising to A$77 billion. The Queensland government set an A$7.1 billion funding provision for Brisbane 2032 venues and committed A$417 million in its 2026–27 budget, announced on June 23, 2026. Works are starting at Brisbane Stadium at Victoria Park, the same statement said. In turn, public buildings and civil assets grow at 6.10% a year, the fastest end user, as these venue, health and transport projects reach their facade and fit-out stages.
Neutral-cure trade grades, local supply and remediation
How is the shift to neutral-cure trade grades changing ranges?
Trade buyers are moving from acetic, vinegar-odor silicone to neutral-cure grades that are safer on metals, masonry and coated glass. Fuller Australia sells its All Purpose Silicone at Mitre 10 as a 100% neutral-cure sealant with 25% joint movement capability, listed at A$15.60 online. Selleys describes its Wet Area Silicone as neutral cure and low VOC for bathrooms, kitchens and laundries. Soudal lists bathroom and kitchen, all purpose, roof and gutter, and glass and glazing silicones in the same retail chain. As a result, neutral-cure multipurpose sealants lead with 41.0% of 2025 value, while acetoxy grades lose share in exterior and metal-contact work.
Why is the rise of local formulation and supply notable?
Australian manufacturing and stocked local warehouses give suppliers faster delivery and products tuned for harsh sun and heat. Bostik says its Thomastown plant in Victoria has been its base since 1958, and it also runs a manufacturing plant and training academy at Kings Park in New South Wales. The Australian Made register lists 8 Fuller Australia products from Dandenong South, including Ultra Clear Roofing Sealant. A BRANZ appraisal of Selleys sealants for exterior weatherproofing, issued in April 2023 and updated in April 2026, names a holder address at Padstow in Sydney. In turn, local makers compete strongly in roofing, where adhesion to metal sheeting and resistance to ultraviolet light decide product choice, alongside roof coatings for full-roof restoration.
Can cladding remediation open facade resealing work?
Replacing combustible cladding on apartment buildings creates new panel joints, window perimeters and penetrations that need sealing to modern standards. Cladding Safety Victoria says it has resolved cladding risk on more than 1,400 buildings, including over 1,290 private residential apartment buildings. Of 450 high-risk buildings funded for cladding replacement, more than 400 are already complete, the agency said in its 2025–26 work program. Bostik lists 5CLM, a clear neutral-cure silicone for facade cladding and expansion joints with plus 100% and minus 50% movement capability. As a result, specialty performance sealants grow at 6.30% a year as owners corporations fund envelope repairs.
Is there an opening in tested structural glazing grades?
Commercial towers and mid-rise apartments use more bonded glass, which raises demand for sealants that carry load and keep their properties for decades. Bostik markets V60 for two-sided structural glazing on buildings up to four stories and V70 for two- and four-sided glazing on high-rise work. The company says its glazing silicones are rated to Australian Standards for glass assembly in construction. Bostik also lists V4, a low-modulus neutral-cure silicone for metal and masonry in contact with glass, for window and facade frames. Building Commission NSW reported in December 2023 that 53% of surveyed apartment buildings had serious common property defects. In turn, direct project supply grows at 5.91% a year, as facade contractors order specification grades for named projects.
Volatile approvals, labor gaps and application defects weigh
How does volatile commercial approval flow hurt planning?
Commercial and public building approvals swing sharply from month to month, which makes stock planning hard for facade suppliers. The value of non-residential building approved fell 44.8% to about A$5.5 billion in August 2026, the Australian Bureau of Statistics reported. As a result, specification grades can sit in warehouses when large projects slip. Suppliers respond with shorter production runs and closer links to facade contractors, although smaller distributors still carry most of the inventory risk.
Why do labor shortages slow sealing work?
Sealing is one of the last trades on site, so delays in earlier trades push joint work later and compress schedules. Infrastructure Australia estimated the industry is about 141,000 workers short of what the public pipeline requires. In turn, rushed application raises the risk of poor surface preparation and early joint failure. Manufacturers respond with training academies, simpler one-component products and clear tooling guidance, but skilled glaziers and waterproofers remain scarce in fast-growing outer suburbs.
How do application defects create liability risk?
Sealant failures often appear years after handover as leaks, mold or cracked joints, which exposes builders and suppliers to defect claims. As a result, waterproofing remained the most common serious defect in the Building Commission NSW survey of apartment buildings. Builders respond by asking for compatible primers, documented movement ratings and product guarantees. Suppliers without technical support teams find it harder to win specification work, because certifiers and strata buyers now ask who stands behind each joint.
Why does price pressure squeeze value grades?
Value grades compete mainly on shelf price in hardware chains, which leaves little room for margin or brand investment. In turn, imported private-label cartridges pressure local brands in general-purpose acetoxy and neutral-cure lines. Silicone polymer costs also follow global feedstock prices, which suppliers cannot fully pass on during promotional periods. Manufacturers respond by moving trade buyers toward premium wet-area and roofing grades that carry guarantees, although price-led sales still dominate homeowner purchases.
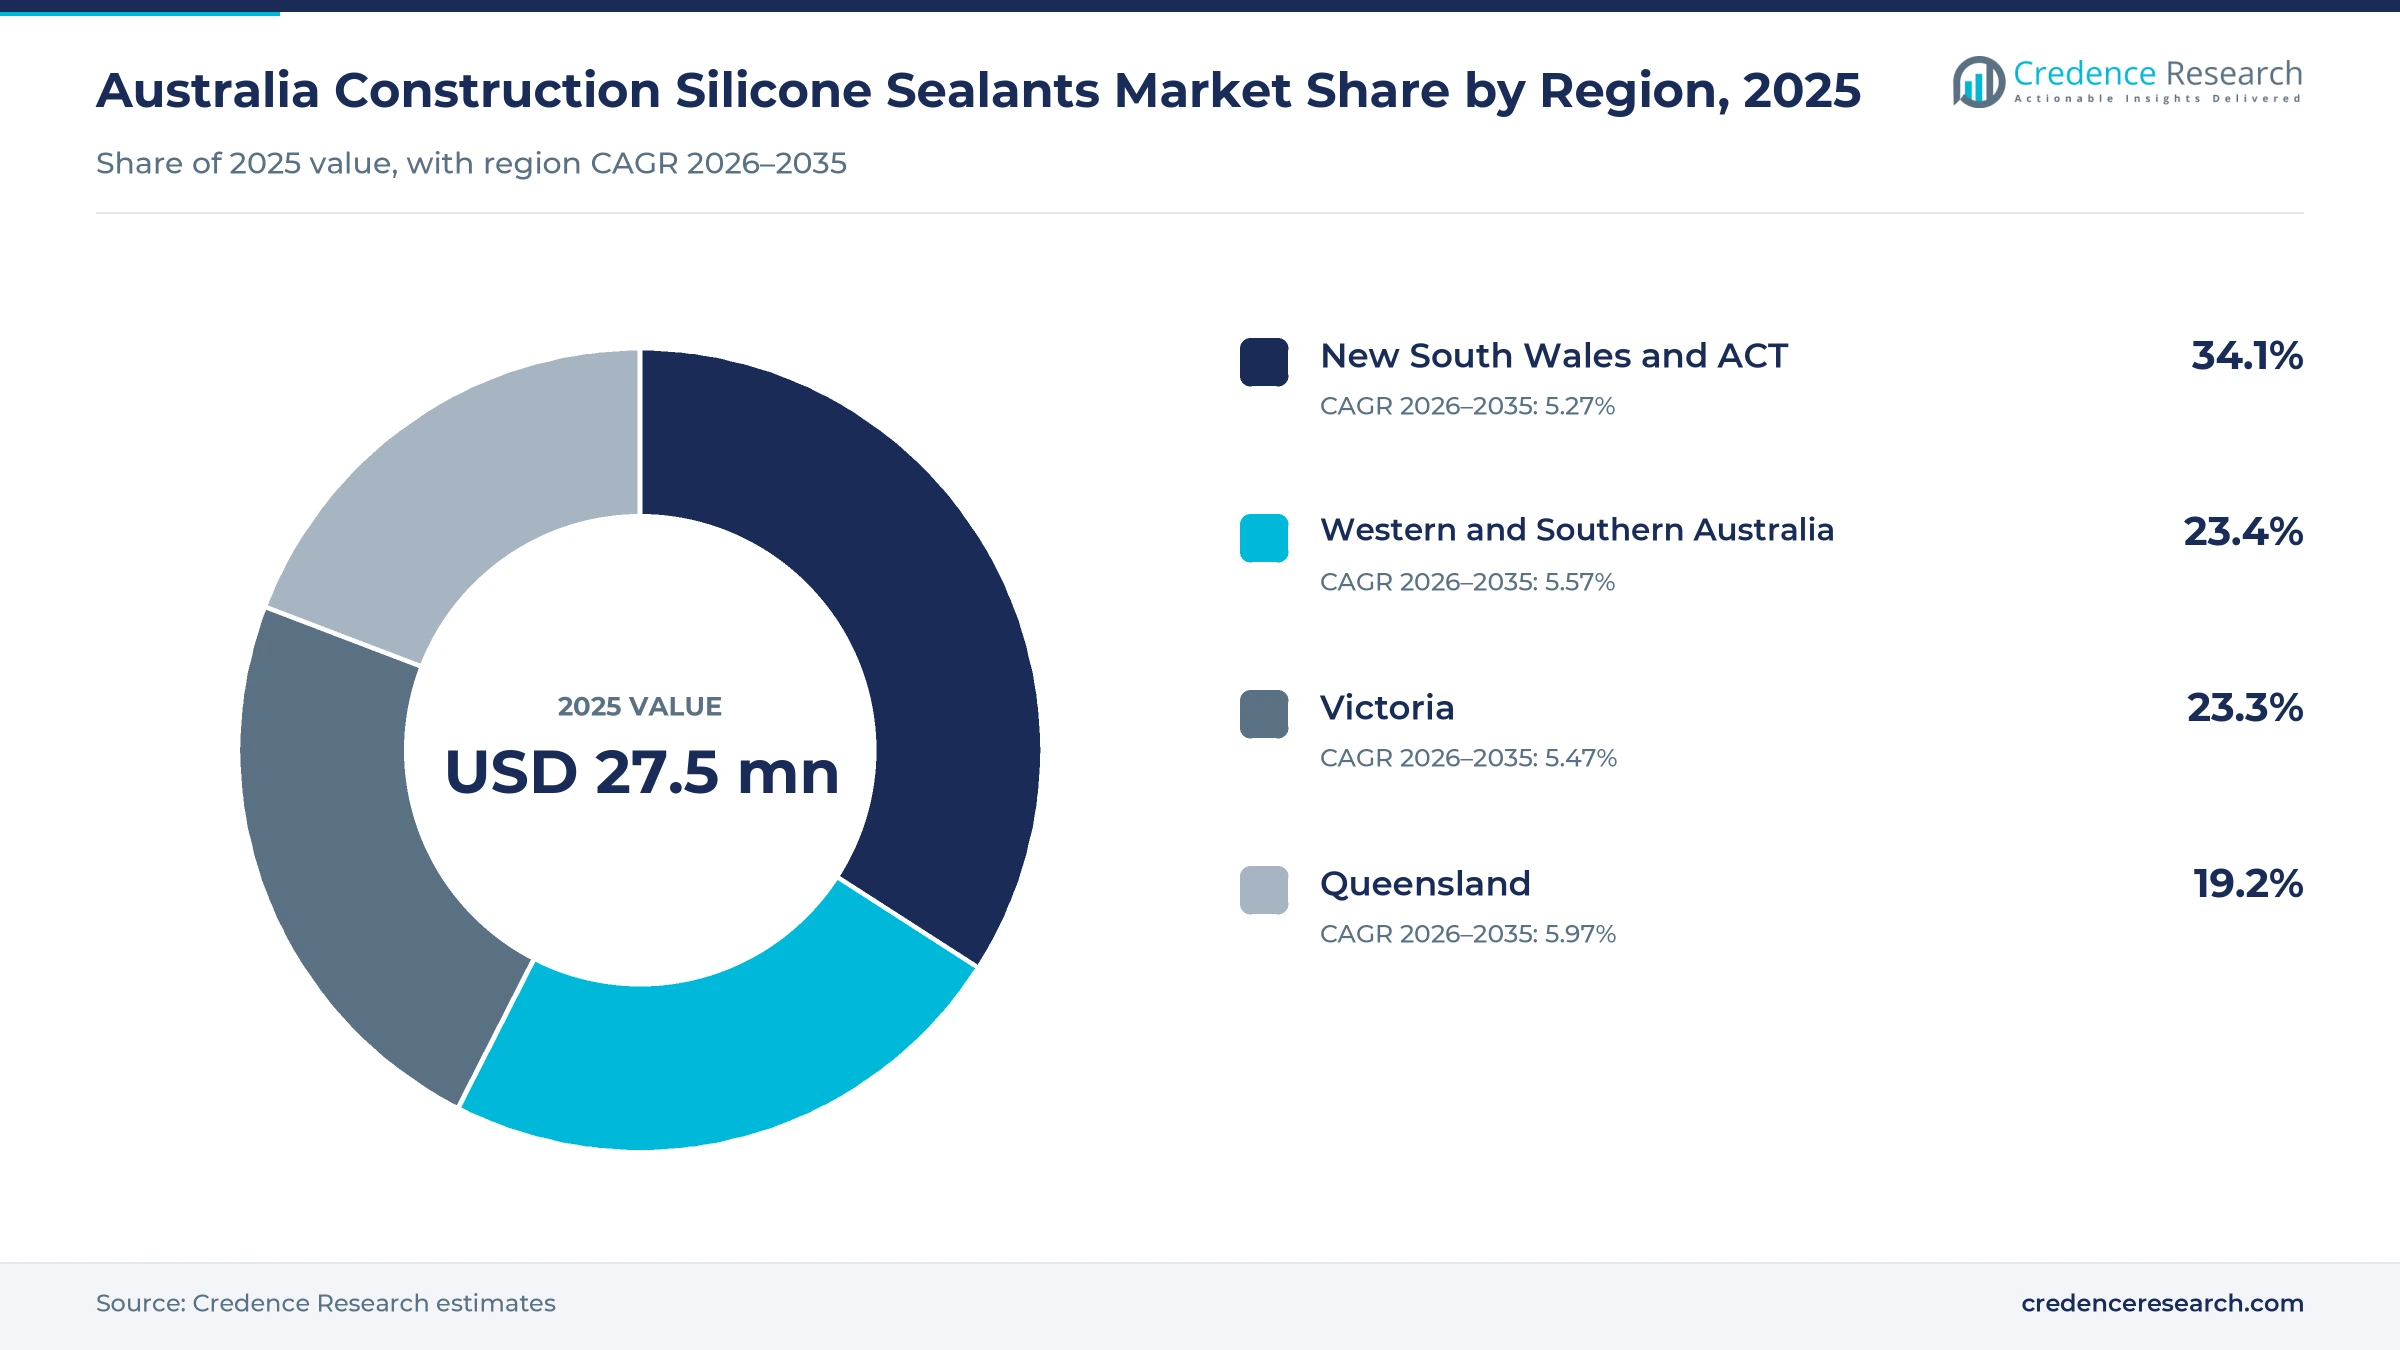
New South Wales and ACT leads as Queensland grows fastest
| Region | Value, 2025 (USD million) | Share, 2025 | CAGR, 2026–2035 |
|---|---|---|---|
| New South Wales and ACT | 9.4 | 34.1% | 5.27% |
| Western and Southern Australia | 6.4 | 23.4% | 5.57% |
| Victoria | 6.4 | 23.3% | 5.47% |
| Queensland | 5.3 | 19.2% | 5.97% |
New South Wales and ACT lead on apartment and tower stock
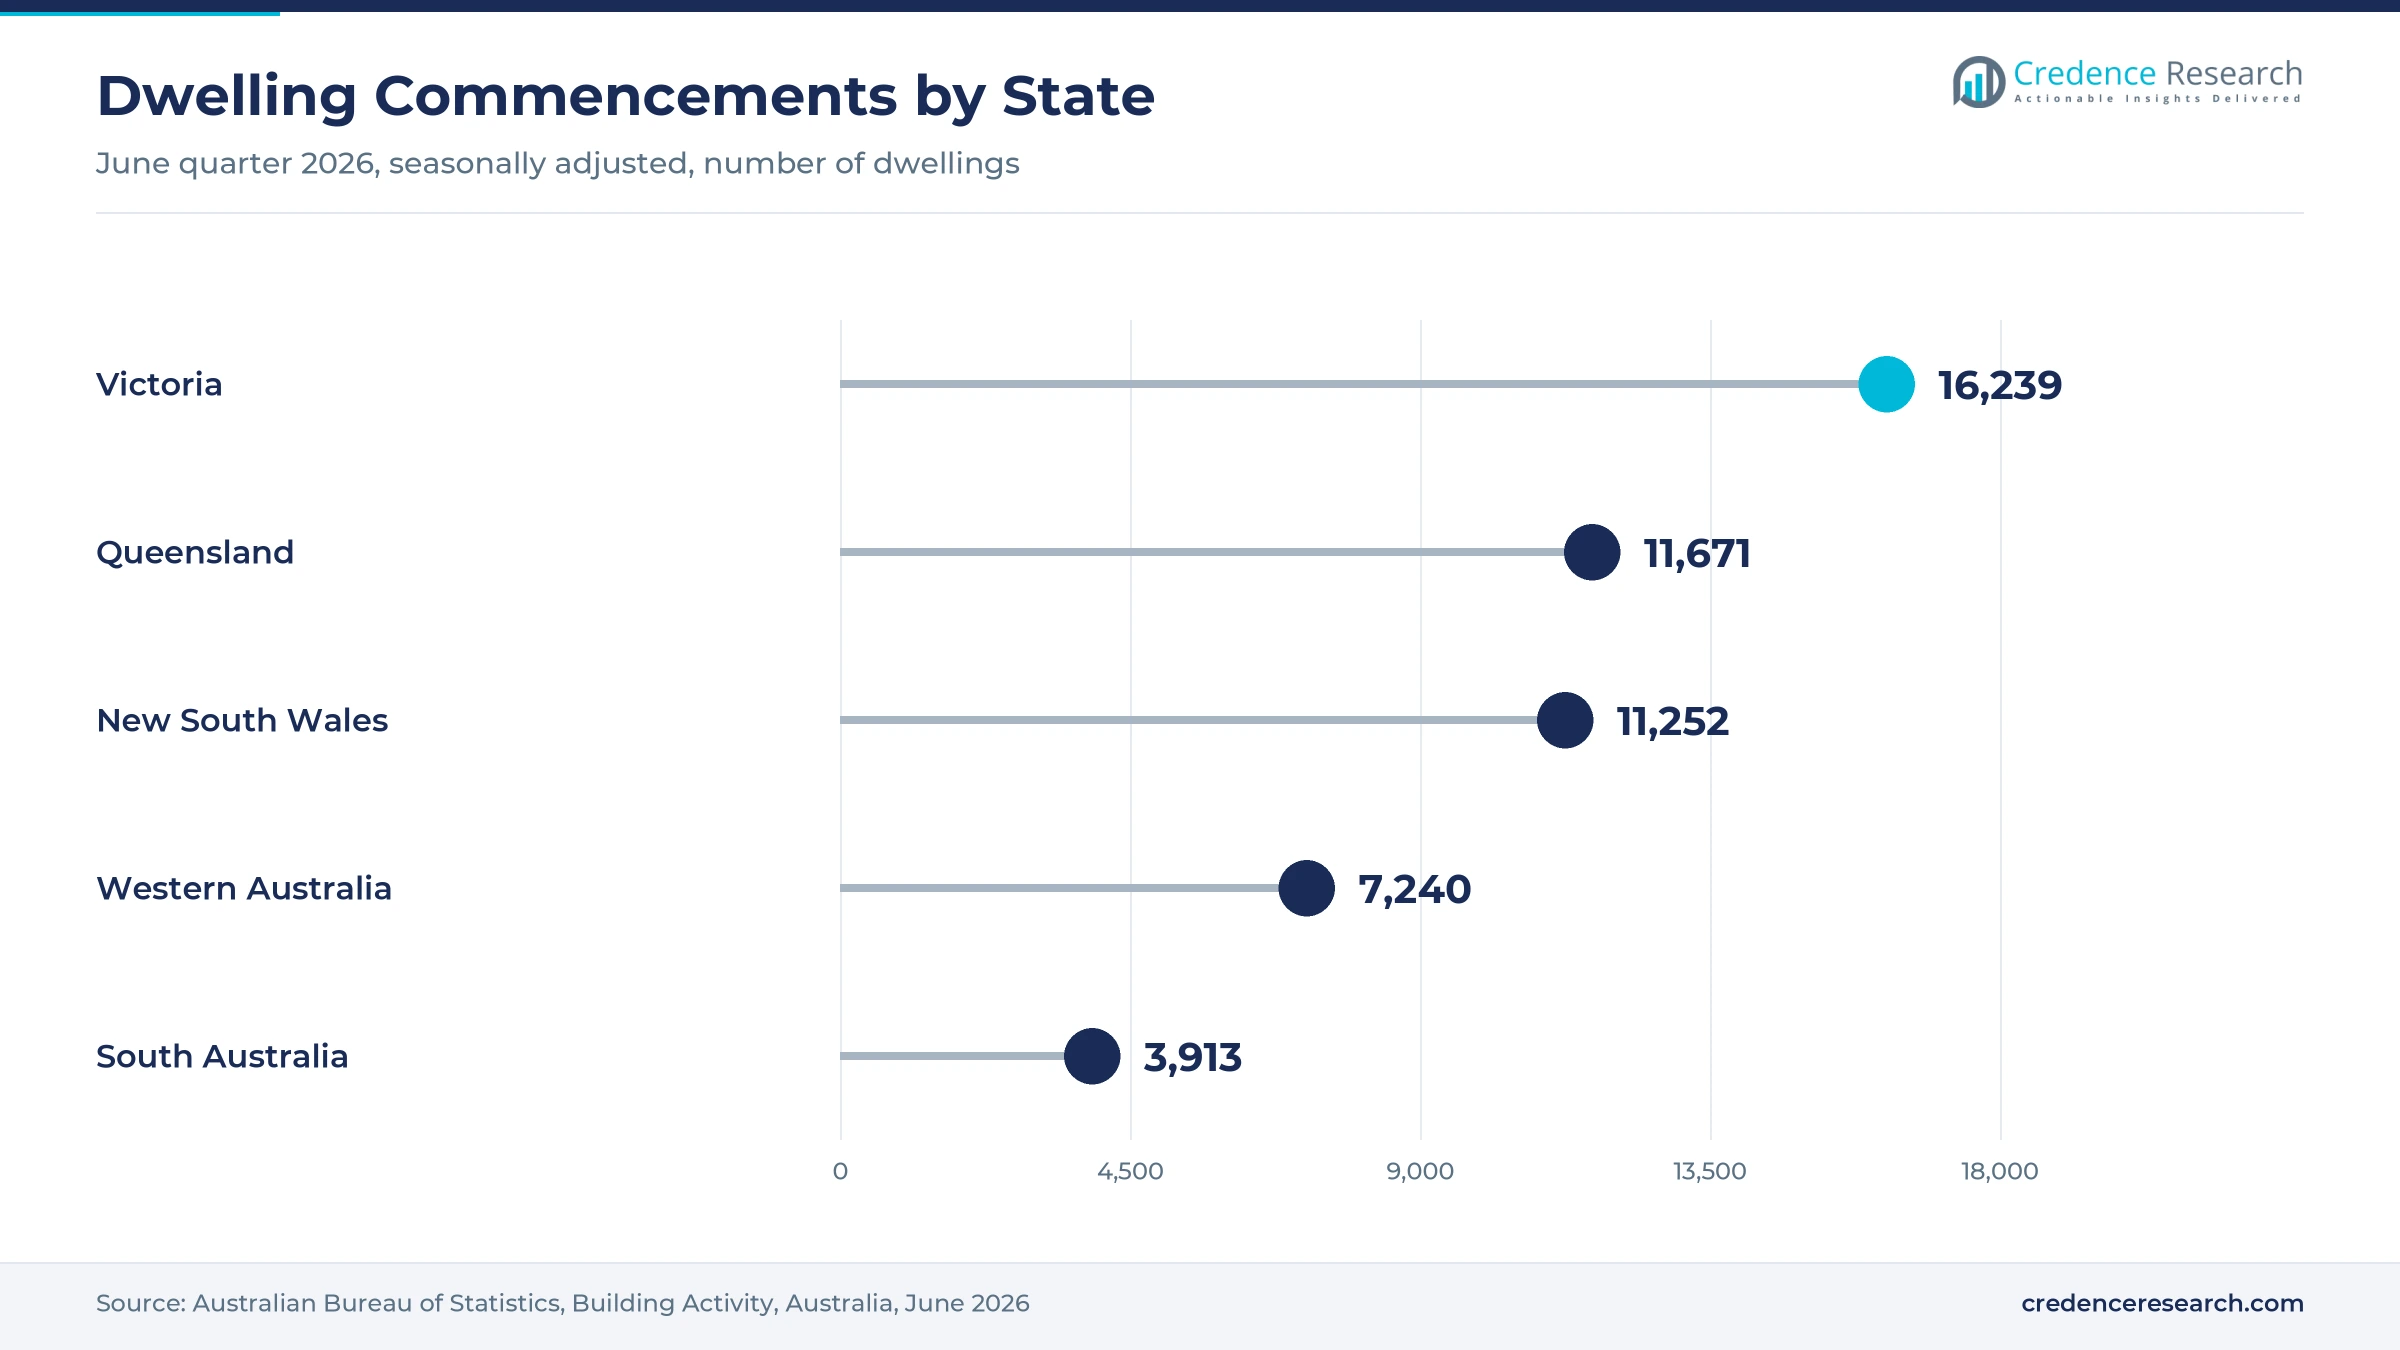
New South Wales and ACT held a 34.1% share of 2025 value and grows at 5.27% a year, because Sydney holds the largest apartment and commercial tower stock. New South Wales commenced 11,252 dwellings in the June quarter of 2026, according to the Australian Bureau of Statistics. Bostik runs manufacturing at Kings Park, which shortens supply to western Sydney builders. As a result, facade resealing and wet-area repairs in older strata buildings add to new-build demand.
Western and Southern Australia gains from house building
Western and Southern Australia held a 23.4% share of 2025 value and grows at 5.57% a year, because detached house building is rising in Perth and Adelaide. Western Australia commenced 7,240 dwellings in the June quarter of 2026, up from 5,872 a year earlier, while South Australia commenced 3,913. In this report, the zone covers Western Australia, South Australia, Tasmania and the Northern Territory, where detached houses take most sealant volume.
Why is Victoria a supply and housing center?
Victoria held a 23.3% share of 2025 value and grows at 5.47% a year, because it led the states with 16,239 dwelling commencements in the June quarter of 2026. Bostik's Thomastown plant and Fuller Australia's Dandenong South operations make Melbourne the main local production base. More than 400 high-risk buildings funded for cladding replacement are already complete in Victoria. In turn, Victoria combines high housing volume with steady facade resealing work on remediated apartments.
How does Queensland become the fastest-growing region?
Queensland held a 19.2% share of 2025 value and grows fastest at 5.97% a year, because housing and public building activity are both rising. The state commenced 11,671 dwellings in the June quarter of 2026, up from 9,550 a year earlier. Its government announced in June 2026 an A$7.1 billion provision for Brisbane 2032 venues, including works at Brisbane Stadium at Victoria Park. As a result, Queensland adds the most new demand for facade, roofing and movement-joint grades.
Code pause, housing target and public pipeline milestones
| Development | Status and market relevance |
|---|---|
| In July 2024, the five-year National Housing Accord period for 1.2 million new homes began. | Sets the housing delivery target that drives residential sealant use through mid-2029 |
| In October 2025, building ministers agreed to pause non-essential residential code changes until mid-2029. | Keeps NCC 2022 envelope and wet-area rules stable for product specification |
| In November 2025, Infrastructure Australia put the five-year public pipeline at A$242 billion. | Lifts the building project pipeline to A$77 billion for public construction |
| In June 2026, the Queensland government committed A$417 million to Brisbane 2032 venues. | Starts venue works within an A$7.1 billion funding provision |
| In October 2026, official data showed 52,201 dwelling commencements in the June quarter. | Confirms a 7.0% quarterly rise in new housing work |
Cure chemistry, movement class and mold resistance
- Alkoxy and oxime cure systems release alcohol or oxime instead of acetic acid, which avoids corrosion on metals and coated glass in window and facade joints.
- Movement class ratings show how far a joint can stretch and compress, which decides whether a grade suits cladding, expansion joints or interior gaps.
- Fungicide packages resist mold growth in showers, baths and laundries, which extends the time before wet-area joints need replacing.
- Two-component silicone systems cure through the full joint depth at a set rate, which suits factory structural glazing and large curtain-wall units.
Need a Custom Version of This Report?
Tailor the scope, geography, or segments to your exact requirements.
- Custom geography or segment scope
- Direct access to our analyst team
Local makers and imported brands compete on trade reach
Competition combines Australian manufacturers with long trade histories and imported brands that compete through hardware chains and specialist distributors. Bostik says Thomastown has been its home since 1958, and it runs a second manufacturing plant with a training academy at Kings Park. Fuller Australia supplies FulaSeal and all purpose silicones from Dandenong South through trade and hardware outlets. Selleys, a trading name of DuluxGroup, competes strongly in wet-area silicones with guarantees against peeling and cracking. Soudal Australia, based at Glendenning in western Sydney, sells bathroom, roofing and glazing silicones through hardware chains. Sika also sells Sikasil 670, a fire-rated silicone, through the same hardware channel for penetration and joint work. Suppliers win specification work through technical support, tested movement ratings and links with structural adhesives used on the same facade projects.
Which suppliers lead trade and project silicone supply?
| Company | Type | Role in the market |
|---|---|---|
| Fuller Australia | Local manufacturer | Supplies FulaSeal and neutral-cure all purpose silicones from Dandenong South |
| Bostik Australia | Local manufacturer | Makes sealants at Thomastown and Kings Park, with V60 and V70 glazing grades |
| Selleys | Consumer and trade brand | Sells neutral-cure Wet Area Silicone for bathrooms, kitchens and laundries |
| Soudal Australia | Imported brand supplier | Sells bathroom, roofing and glazing silicones from Glendenning |
| Sika Australia | Global construction chemicals supplier | Sells Sikasil 670 fire-rated silicone through hardware retail |
Credence Research view on Australian joint-sealing demand
Credence Research's view is that Australian construction silicone demand will grow steadily because housing delivery, stable envelope rules and wet-area renovation all need durable sealed joints. Neutral-cure multipurpose grades remain the largest product type, while specialty performance grades grow fastest as glazing and cladding work demands tested products. Queensland gains most from rising starts and venue projects for the Brisbane 2032 Games. Suppliers that combine local stock, technical support and guaranteed wet-area and facade grades should win the most trade loyalty and project specifications by 2035.
How the national joint-sealant estimate was built
The report uses 2025 as the base year on a calendar basis, and market values come from the Credence Research model. That model combines official dwelling commencement and approval statistics, population data, building code guidance, public infrastructure pipeline reports and company product information. Segment splits, regional shares and regional growth rates are Credence Research estimates. Sources used are government and regulator pages, statistical releases, company websites and trade media, and no interviews or surveys were used.
Housing delivery and envelope work drive growth to 2035
The Australia construction silicone sealants market is expected to reach USD 56.8 million by 2035, a 5.52% CAGR during 2026–2035, as builders deliver more homes and owners keep resealing facades and wet areas. Growth should be strongest in specialty performance grades, public buildings and Queensland, because tested glazing and movement-joint products gain most from new venue, health and transport work. Volatile commercial approvals, labor shortages and price pressure in value grades could slow some sales, while local manufacturing and stable code rules should support steady specification.
Frequently Asked Questions
How big is the Australia construction silicone sealants market?
Which product type leads construction silicone spending?
Which region leads the market?
How does housing construction support demand?
How do building code rules affect silicone use?
Why do wet-area sealants sell steadily?
Who are the leading companies in the market?
What are the main challenges for suppliers?
Table of Content
Chapter 1 Market Segmentation
- 1.1 Segmentation Framework
- 1.1.1 Product and Service Classification
- 1.1.2 Application and End-Use Classification
- 1.1.3 Technology and Solution Classification
- 1.1.4 Customer and Distribution Channel Classification
- 1.1.5 Geographic Segmentation
- 1.1.6 Market Segment Definitions and Boundaries
- 1.2 By Product Type
- 1.2.1 Neutral-cure multipurpose sealants
- 1.2.2 Acetoxy multipurpose sealants
- 1.2.3 Sanitary sealants
- 1.2.4 Specialty performance sealants
- 1.3 By Application
- 1.3.1 Façade and fenestration sealing
- 1.3.2 Roofing and weatherproofing
- 1.3.3 Wet-area sealing
- 1.3.4 Building and civil joints
- 1.4 By End User
- 1.4.1 Residential buildings
- 1.4.2 Commercial and industrial buildings
- 1.4.3 Public buildings and civil assets
Chapter 2 Introduction
- 2.1 Report Objectives and Scope
- 2.2 Product Definition and Industry Terminology
- 2.3 Market Inclusions and Exclusions
- 2.4 Research Process
- 2.4.1 Primary Research and Expert Interviews
- 2.4.2 Secondary Research and Source Review
- 2.4.3 Top-Down and Bottom-Up Estimation
- 2.4.4 Data Triangulation and Verification
- 2.5 Market Size Measurement Basis
- 2.5.1 2025: USD 27.5 million → 2035: USD 56.8 million
- 2.6 Historical and Forecast Reference Periods
- 2.6.1 Historical Period: 2018-2025
- 2.6.2 Base Year: 2025
- 2.6.3 Forecast Period: 2025-2035
- 2.7 Research Assumptions and Limitations
Chapter 3 Executive Summary
- 3.1 Market Snapshot and Key Findings
- 3.2 Base-Year Market Size, 2025
- 3.3 Forecast Market Size, 2035
- 3.4 Revenue and Volume Growth Outlook
- 3.5 Key Demand and Supply Indicators
- 3.6 Leading Market Segments
- 3.7 Fastest-Growing Market Opportunities
- 3.8 Regional Performance Highlights
- 3.9 Technology and Industry Transformation
- 3.10 Competitive Landscape Summary
- 3.11 Analyst View and Strategic Implications
Chapter 4 Australia Construction Silicone Sealants Market Trends and Developments
- 4.1 Historical Industry Development, 2018-2025
- 4.2 Recent Market Trends and Developments
- 4.3 Demand and Customer Behavior Trends
- 4.4 Technology and Product Innovation
- 4.5 Artificial Intelligence, Automation and Digitalization
- 4.6 Local Manufacturing and Supply Chain Realignment
- 4.7 Industry Partnerships, Mergers and Acquisitions
- 4.8 Sustainability and Circular Economy Developments
- 4.9 Government and Private Sector Investment Trends
- 4.10 Emerging Business Models and Commercialization
- 4.11 Industry Developments and Announcements
Chapter 5 Australia Construction Silicone Sealants Market Production, Supply and Demand Analysis
- 5.1 Demand Trend and Consumption Analysis, 2018-2025
- 5.2 Demand Forecast, 2025-2035
- 5.3 Production and Output Trend, 2018-2025
- 5.4 Production and Output Forecast, 2025-2035
- 5.5 Installed Capacity and Capacity Utilization
- 5.6 Company-Wise Production Plants and Statistics
- 5.6.1 Installed Production Capacity
- 5.6.2 Actual Production
- 5.6.3 Planned Capacity and Expansion Targets
- 5.7 Supply Chain Structure and Procurement Trends
- 5.8 Supply-Demand Gap and Bottlenecks
- 5.9 Import Dependence and Sourcing Structure
- 5.10 Contract Manufacturing and Outsourcing
- 5.11 Regional Supply and Demand Concentration
Chapter 6 Australia Construction Silicone Sealants Market Pricing Analysis
- 6.1 Pricing Structure and Measurement
- 6.2 Historical Pricing Trends, 2018-2025
- 6.3 Pricing Outlook, 2025-2035
- 6.4 Average Selling Price and Unit Economics
- 6.5 Pricing by Product and Market Segment
- 6.6 Geographic Pricing Differences
- 6.7 Key Input, Energy, Labor and Logistics Costs
- 6.8 Contract Pricing and Purchasing Models
- 6.9 Pricing Sensitivity and Competitive Positioning
- 6.10 Price, Margin and Profitability Implications
Chapter 7 Australia Construction Silicone Sealants Market Dynamics
- 7.1 Market Growth Drivers
- 7.1.1 Demand-Side Drivers
- 7.1.2 Technology and Innovation Drivers
- 7.1.3 Infrastructure and Investment Drivers
- 7.1.4 Regulatory and Policy Drivers
- 7.2 Market Restraints
- 7.2.1 Cost and Affordability Constraints
- 7.2.2 Technology and Adoption Barriers
- 7.2.3 Supply Chain and Operational Constraints
- 7.3 Market Challenges
- 7.3.1 Competitive Pressure and Margin Erosion
- 7.3.2 Skills, Infrastructure and Implementation Gaps
- 7.4 Emerging Market Opportunities
- 7.5 Market Dynamics Impact and Time-Horizon Assessment
Chapter 8 Australia Construction Silicone Sealants Value Chain Analysis
- 8.1 Industry Value Chain Overview
- 8.2 Upstream Suppliers and Critical Inputs
- 8.3 Technology and Component Providers
- 8.4 Manufacturing or Service Delivery
- 8.5 Distribution, Channel Partners and Integrators
- 8.6 Downstream Applications and End Users
- 8.7 Value Addition and Profit Pools
- 8.8 Vertical Integration and Outsourcing
- 8.9 Supplier Concentration and Risk
- 8.10 Supply Chain Localization and Resilience
Chapter 9 Australia Construction Silicone Sealants Market Regulations and Policies
- 9.1 Relevant Laws, Standards and Compliance Frameworks
- 9.2 Product, Service, Safety and Quality Requirements
- 9.3 Government Policies, Incentives and Subsidies
- 9.4 Imports, Exports and Trade Barriers
- 9.5 Public Procurement and Local Content Requirements
- 9.6 Environmental and Sustainability Compliance
- 9.7 Upcoming Policy Changes and Market Implications
Chapter 10 Australia Construction Silicone Sealants Market Hotspots and Opportunities
- 10.1 Market Opportunity Mapping and Growth Hotspots
- 10.2 High-Growth Applications and Customer Groups
- 10.3 Underserved Markets and White-Space Opportunities
- 10.4 Emerging Technology and Product Opportunities
- 10.5 New Capacity and Investment Hotspots
- 10.6 Market Entry and Expansion Opportunities
- 10.7 Distribution and Partnership Opportunities
- 10.8 Near-Term and Long-Term Commercial Potential
- 10.9 Opportunity Attractiveness and Execution Risks
Chapter 11 Australia Construction Silicone Sealants Market Outlook, 2025-2035
- 11.1 Market Size and Analysis
- 11.1.1 Revenue (Market Measurement: 2025: USD 27.5 million → 2035: USD 56.8 million)
- 11.1.2 Market Volume and Quantity Sold
- 11.1.3 Historical Market Size, 2018-2025
- 11.1.4 Base-Year Market Size, 2025
- 11.2 Market Forecast, 2025-2035
- 11.2.1 Revenue Forecast to 2035
- 11.2.2 Volume Forecast to 2035
- 11.2.3 CAGR and Year-on-Year Growth
- 11.2.4 Incremental Revenue Opportunity
- 11.3 Forecast Assumptions and Scenario Analysis
- 11.3.1 Base-Case Forecast
- 11.3.2 Optimistic and Conservative Scenarios
- 11.3.3 Technology, Pricing and Policy Sensitivities
- 11.4 Market Attractiveness and Growth Outlook
Chapter 12 Australia Construction Silicone Sealants Market Segmentation and Outlook
- 12.1 Segmentation Summary and Market Shares, 2025
- 12.2 Largest and Fastest-Growing Segments
- 12.3 By Product Type - Market Size and Forecast, 2025-2035
- 12.3.1 Segment Definition and Scope
- 12.3.2 Historical Market Size, 2018-2025
- 12.3.3 Revenue Forecast, 2025-2035
- 12.3.4 Volume Forecast, 2025-2035
- 12.3.5 Base-Year Market Share, 2025
- 12.3.6 Segment CAGR and Growth Drivers
- 12.3.7 Subsegment Market Size and Forecast
- 12.3.7.1 Neutral-cure multipurpose sealants
- 12.3.7.2 Acetoxy multipurpose sealants
- 12.3.7.3 Sanitary sealants
- 12.3.7.4 Specialty performance sealants
- 12.3.8 Subsegment Pricing and Adoption Trends
- 12.3.9 Leading Suppliers and Competition
- 12.3.10 Regional Demand and Opportunities
- 12.4 By Application - Market Size and Forecast, 2025-2035
- 12.4.1 Segment Definition and Scope
- 12.4.2 Historical Market Size, 2018-2025
- 12.4.3 Revenue Forecast, 2025-2035
- 12.4.4 Volume Forecast, 2025-2035
- 12.4.5 Base-Year Market Share, 2025
- 12.4.6 Segment CAGR and Growth Drivers
- 12.4.7 Subsegment Market Size and Forecast
- 12.4.7.1 Façade and fenestration sealing
- 12.4.7.2 Roofing and weatherproofing
- 12.4.7.3 Wet-area sealing
- 12.4.7.4 Building and civil joints
- 12.4.8 Subsegment Pricing and Adoption Trends
- 12.4.9 Leading Suppliers and Competition
- 12.4.10 Regional Demand and Opportunities
- 12.5 By End User - Market Size and Forecast, 2025-2035
- 12.5.1 Segment Definition and Scope
- 12.5.2 Historical Market Size, 2018-2025
- 12.5.3 Revenue Forecast, 2025-2035
- 12.5.4 Volume Forecast, 2025-2035
- 12.5.5 Base-Year Market Share, 2025
- 12.5.6 Segment CAGR and Growth Drivers
- 12.5.7 Subsegment Market Size and Forecast
- 12.5.7.1 Residential buildings
- 12.5.7.2 Commercial and industrial buildings
- 12.5.7.3 Public buildings and civil assets
- 12.5.8 Subsegment Pricing and Adoption Trends
- 12.5.9 Leading Suppliers and Competition
- 12.5.10 Regional Demand and Opportunities
- 12.6 Segment Growth Comparison
- 12.7 Segment Attractiveness and Priority Matrix
Chapter 13 Australia Construction Silicone Sealants End-Use and Application Market Outlook
- 13.1 End-Use Industry and Customer Demand Structure
- 13.2 Leading Applications and Customer Groups
- 13.3 End-Use Market Size, Share and Forecast
- 13.4 Major End-Use Industry Deep Dives
- 13.4.1 Customer Requirements and Use Cases
- 13.4.2 Demand and Replacement Cycles
- 13.4.3 Technical and Regulatory Considerations
- 13.4.4 Purchasing and Procurement Models
- 13.4.5 Leading Vendors and Distribution Channels
- 13.4.6 Forecast and Commercial Opportunities
- 13.5 Emerging Applications and Cross-Segment Demand
- 13.6 End-Use Industry Investment Priorities
Chapter 14 Australia Construction Silicone Sealants Geographic Market Outlook, 2025-2035
- 14.1 Domestic Market Distribution and Demand Clusters
- 14.2 State- or Province-Wise Market Size and Forecast, 2025-2035
- 14.3 City and Metropolitan Market Outlook
- 14.4 Industrial, Manufacturing and Commercial Clusters
- 14.5 Geographic Concentration of Key End Users
- 14.6 Local Pricing and Purchasing Differences
- 14.7 Domestic Production Facilities and Capacity Map
- 14.8 Local Infrastructure and Project Pipeline
- 14.9 State-Level Policy and Incentive Differences
- 14.10 Subnational Investment Hotspots and Opportunities
- 14.11 Distribution and Logistics Networks
- 14.12 Domestic Competitive Footprint
Chapter 15 Australia Construction Silicone Sealants Technology, Innovation and Sustainability Outlook
- 15.1 Technology Landscape and Maturity
- 15.2 Product, Process and Service Innovation
- 15.3 AI, Automation and Digital Tools in the Industry
- 15.4 Technology Adoption and Performance Benchmarking
- 15.5 Innovation Pipeline and R&D Investment
- 15.6 Patent and Intellectual Property Trends
- 15.7 Energy Efficiency and Resource Management
- 15.8 Sustainability, Recycling and Circularity
- 15.9 Technology Roadmap, 2025-2035
- 15.10 Risks of Obsolescence and Technology Substitution
Chapter 16 Australia Construction Silicone Sealants Market Key Strategic Imperatives
- 16.1 Growth and Market Entry Priorities
- 16.2 High-Return Products and Segments
- 16.3 Pricing, Profitability and Cost Optimization
- 16.4 Technology Investment and Product Differentiation
- 16.5 Supply Chain Localization and Resilience
- 16.6 Distribution and Customer Acquisition
- 16.7 Partnership, Acquisition and Capacity Strategy
- 16.8 Regional Expansion Priorities
- 16.9 Short-, Medium- and Long-Term Actions
Chapter 17 Competition Outlook
- 17.1 Industry Competition Characteristics
- 17.2 Market Structure and Concentration
- 17.3 Market Share and Competitive Positioning, 2025
- 17.4 Company-Wise Revenue and Product Benchmarking
- 17.5 Production and Service Capacity Benchmarking
- 17.6 Technology, Pricing and Differentiation
- 17.7 Regional Footprint and Distribution Strength
- 17.8 Mergers, Acquisitions and Strategic Alliances
- 17.9 New Entrants and Competitive Threats
- 17.10 Porter's Five Forces and Industry Attractiveness
- 17.11 Competitive Outlook, 2025-2035
Chapter 18 Company Profiles
- 18.1 Company Coverage and Selection Criteria
- 18.2 Fuller Australia
- 18.2.1 Business Description
- 18.2.2 Company Ownership and Geographic Presence
- 18.2.3 Product and Service Portfolio
- 18.2.4 Manufacturing and Operating Footprint
- 18.2.5 Production Capacity and Expansion Plans
- 18.2.6 Financial Performance and Investment
- 18.2.7 Market Share and Competitive Position
- 18.2.8 Technology and Innovation Capabilities
- 18.2.9 Strategic Alliances or Partnerships
- 18.2.10 Recent Developments
- 18.2.11 Growth Strategy and Outlook
- 18.3 Bostik Australia
- 18.4 Selleys
- 18.5 Soudal Australia
- 18.6 Sika Australia
- 18.7 Other Relevant Market Participants
Note: Every listed company is profiled on the structure shown under the first company. The company list is preliminary and may change based on research findings, market developments, data availability and client requirements.
Chapter 19 Disclaimer
- 19.1 Research and Forecast Disclaimer
- 19.2 Data Source and Estimation Limitations
Note: The depth of individual sections depends on data availability for this market. Volume, capacity, trade and other unit-based metrics are included where applicable.

