
Replacement cycles and refrigerant rules set rooftop demand
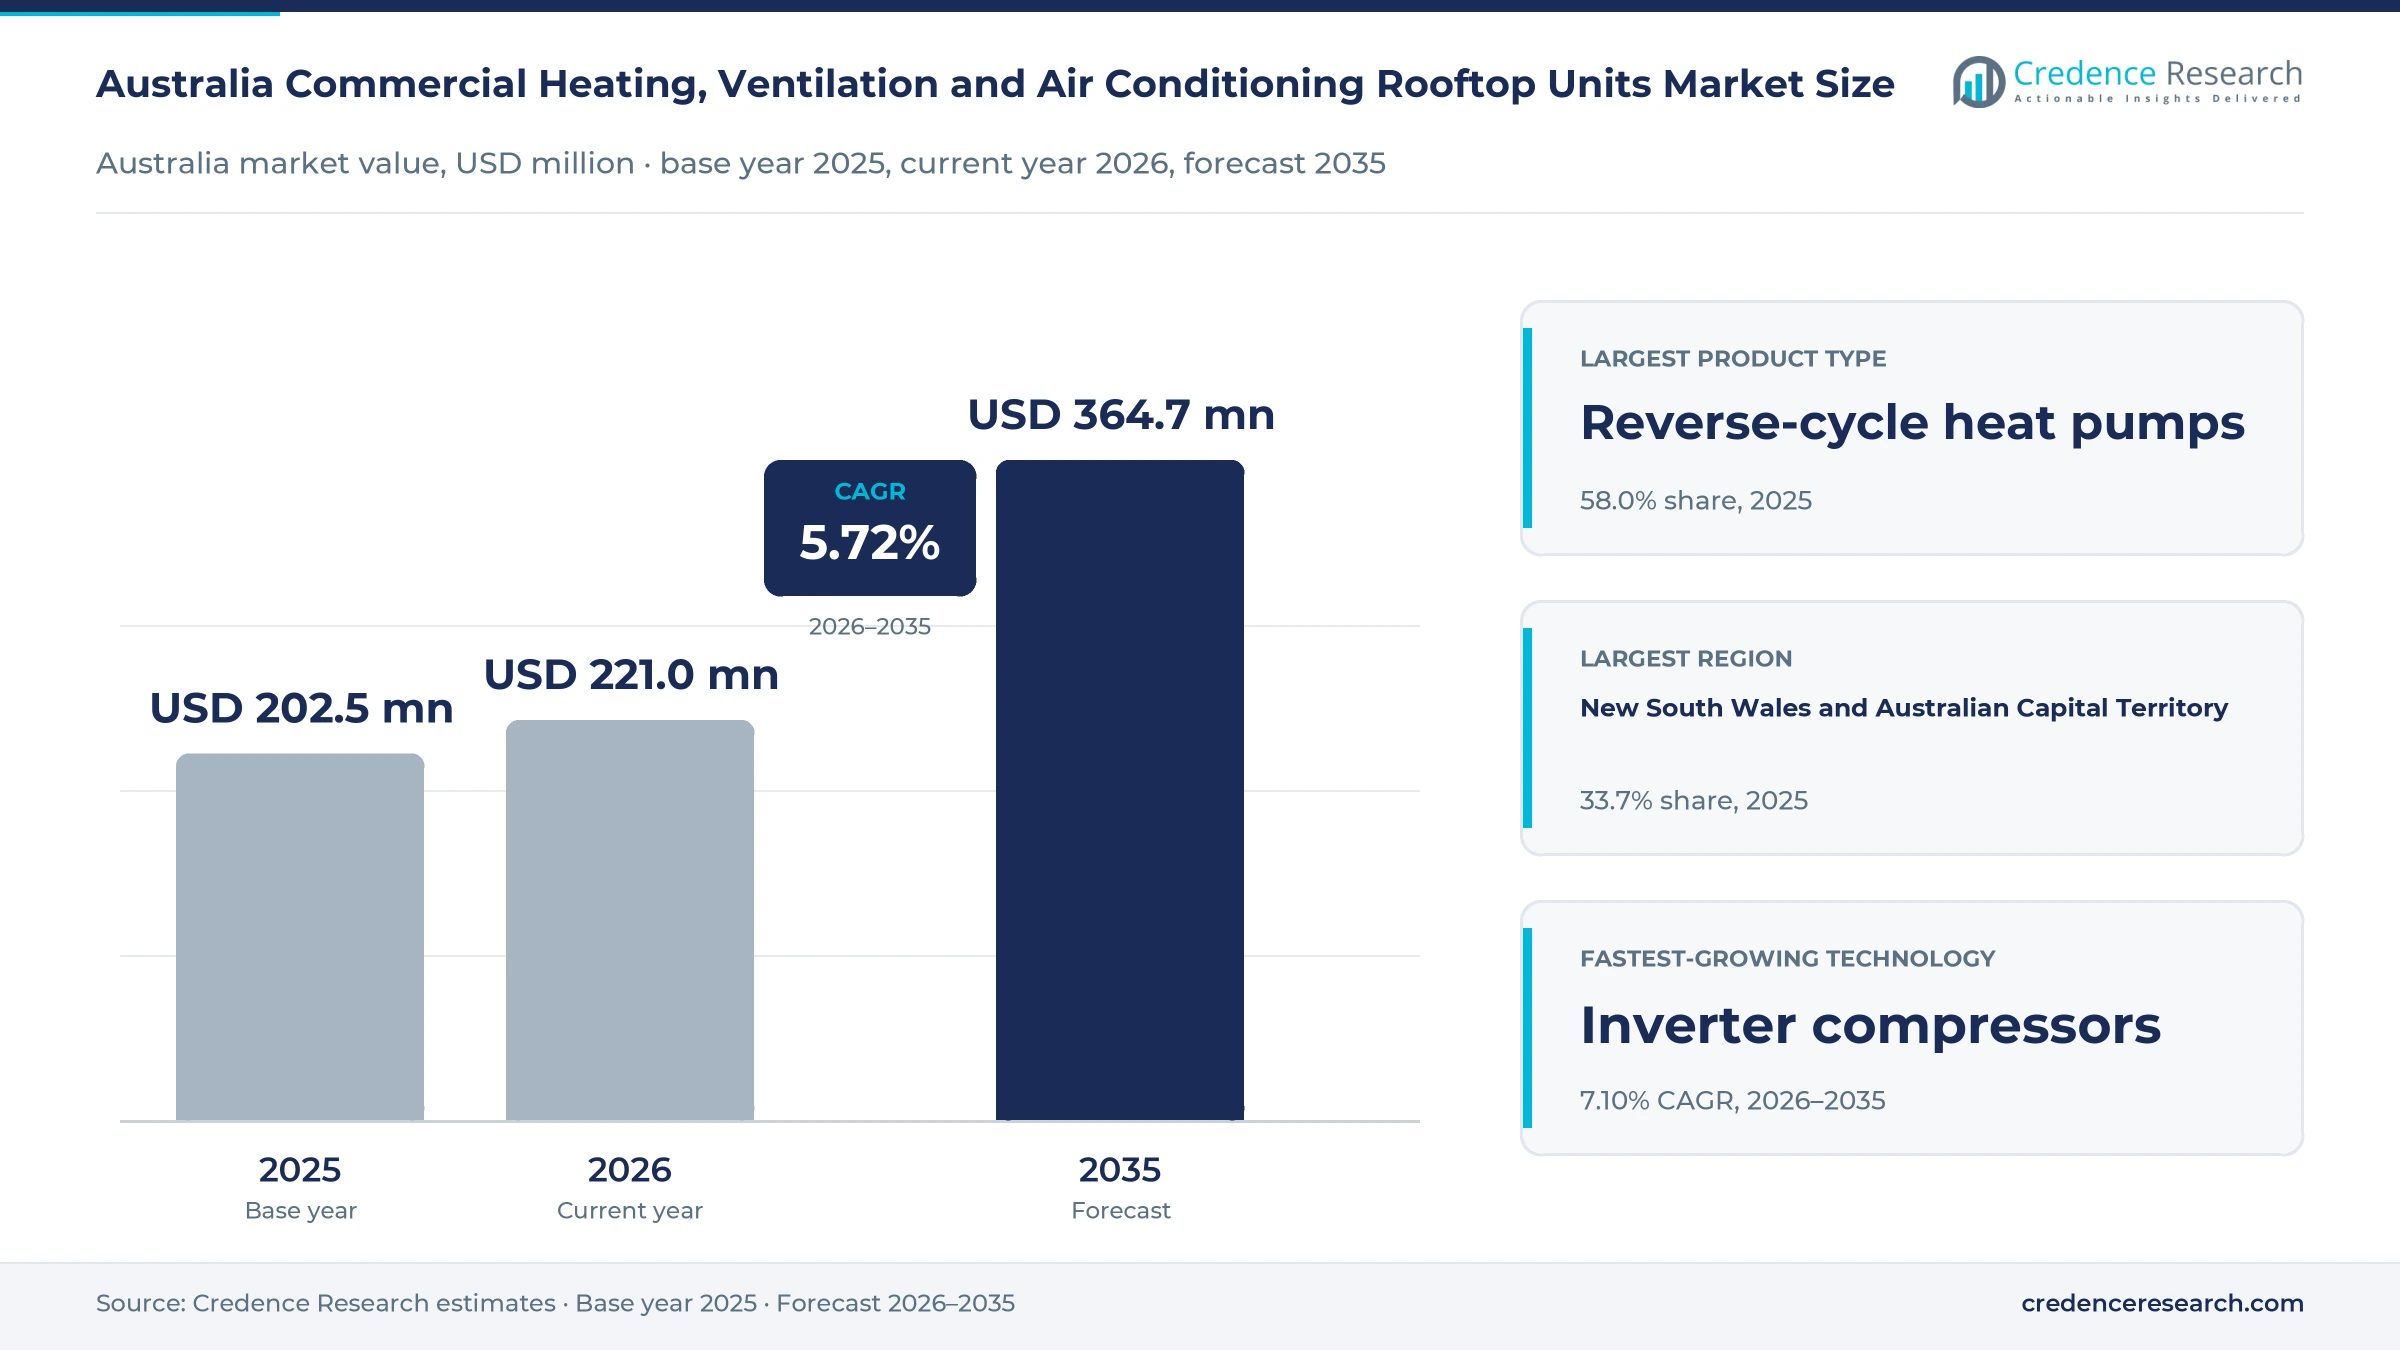
The Australia commercial heating, ventilation and air conditioning rooftop units market was valued at USD 202.5 million in 2025 and is projected to increase from USD 221.0 million in 2026 to USD 364.7 million by 2035, registering a CAGR of 5.72% during 2026–2035. Demand comes from shopping centers, hotels, restaurants, offices, warehouses, schools and clinics that heat and cool single-story or low-rise spaces with packaged units mounted on the roof. New South Wales and the Australian Capital Territory held the largest regional share, 33.7% in 2025, because Sydney holds the largest stock of retail and office floor space. Queensland and the Northern Territory form the fastest-growing region at 6.03% a year, as population growth and long cooling seasons lift installed capacity. At the same time, refrigerant import bans on smaller equipment and lower-impact refrigerant ranges from local makers are pushing owners to plan rooftop replacements well before older units fail.
Which packaged rooftop equipment does the estimate cover?
The estimate measures the value of new packaged rooftop units sold to commercial buyers in Australia, including reverse-cycle heat pump packages, cooling-only packages and gas-electric packages. It counts units from about nine kilowatts to well above 100 kilowatts, whether owners buy them for replacement, new buildings or added capacity.
The estimate excludes installation labor, ductwork, maintenance contracts, split systems, variable refrigerant flow systems and chillers. The value chain runs from manufacturers and importers through specialist distributors and equipment dealers to mechanical contractors, which install units for building owners, tenants, retailers and public agencies.
Australia Commercial Heating, Ventilation and Air Conditioning Rooftop Units Market Insights
- The market for packaged rooftop units was valued at USD 202.5 million in 2025 and is projected to reach USD 364.7 million by 2035, registering a CAGR of 5.72% during 2026–2035.
- New South Wales and the Australian Capital Territory held a 33.7% share of 2025 value, because Sydney has the largest retail, office and hospitality building stock in the country.
- Reverse-cycle heat pumps led with a 58.0% share of 2025 value, because one packaged unit can both heat and cool most commercial spaces in Australian climates.
- Australia banned imports of multi-head split and variable refrigerant flow outdoor units using refrigerant above 750 global warming potential from July 1, 2025, which signals tighter rules for packaged equipment later.
- Inverter compressors grow fastest at 7.10% a year during 2026–2035, as owners seeking better energy ratings replace fixed-speed rooftop units with variable-capacity models.
Reverse-cycle units lead while inverter models grow fastest
Why do reverse-cycle heat pumps hold the largest value?
Based on product type, the market is categorized into reverse-cycle heat pumps, cooling-only packages and gas-electric packages. Reverse-cycle heat pumps led with a 58.0% share of 2025 value, because one unit heats and cools most retail and office spaces without a gas connection. Reverse-cycle heat pumps grow fastest at 6.22% a year, as electrification rules and hotter summers favor all-electric equipment at each replacement.
How does replacement anchor rooftop unit demand?
Based on application, the market is categorized into replacement, new construction and capacity expansion. Replacement led with 57.0% of 2025 value, because a large installed fleet of older R410A and fixed-speed units reaches the end of its service life. Replacement also grows fastest at 5.99% a year, as refrigerant rules and energy disclosure push owners to replace units earlier.
Which building owners buy the most rooftop units?
Based on end-use industry, the market is categorized into retail and hospitality, offices and logistics premises, and education and healthcare. Retail and hospitality led with a 41.0% share of 2025 value, because shopping centers, restaurants and hotels run large single-story spaces. Education and healthcare grows fastest at 6.29% a year, as schools and clinics expand with population growth.
How is compressor technology shifting toward inverters?
Based on technology, the market is categorized into inverter compressors, staged compressors and single-stage fixed-speed compressors. Staged compressors led with a 40.0% share of 2025 value, because twin and tandem compressor designs dominate larger packaged units. Inverter compressors grow fastest at 7.10% a year, as variable-speed models cut part-load energy use and help owners improve building ratings.
| Segment Group | Leading Sub-segment | Share, 2025 | Fastest-growing Sub-segment | CAGR, 2026–2035 |
|---|---|---|---|---|
| By Product Type | Reverse-cycle heat pumps | 58.0% | Reverse-cycle heat pumps | 6.22% |
| By Application | Replacement | 57.0% | Replacement | 5.99% |
| By End-Use Industry | Retail and hospitality | 41.0% | Education and healthcare | 6.29% |
| By Technology | Staged compressors | 40.0% | Inverter compressors | 7.10% |
Request a Free Sample
Fill in your details and we'll send you a free sample report.
- Sample data tables & charts
- Research methodology
Refrigerant limits, disclosure and building work lift demand
How does the refrigerant transition reshape replacement plans?
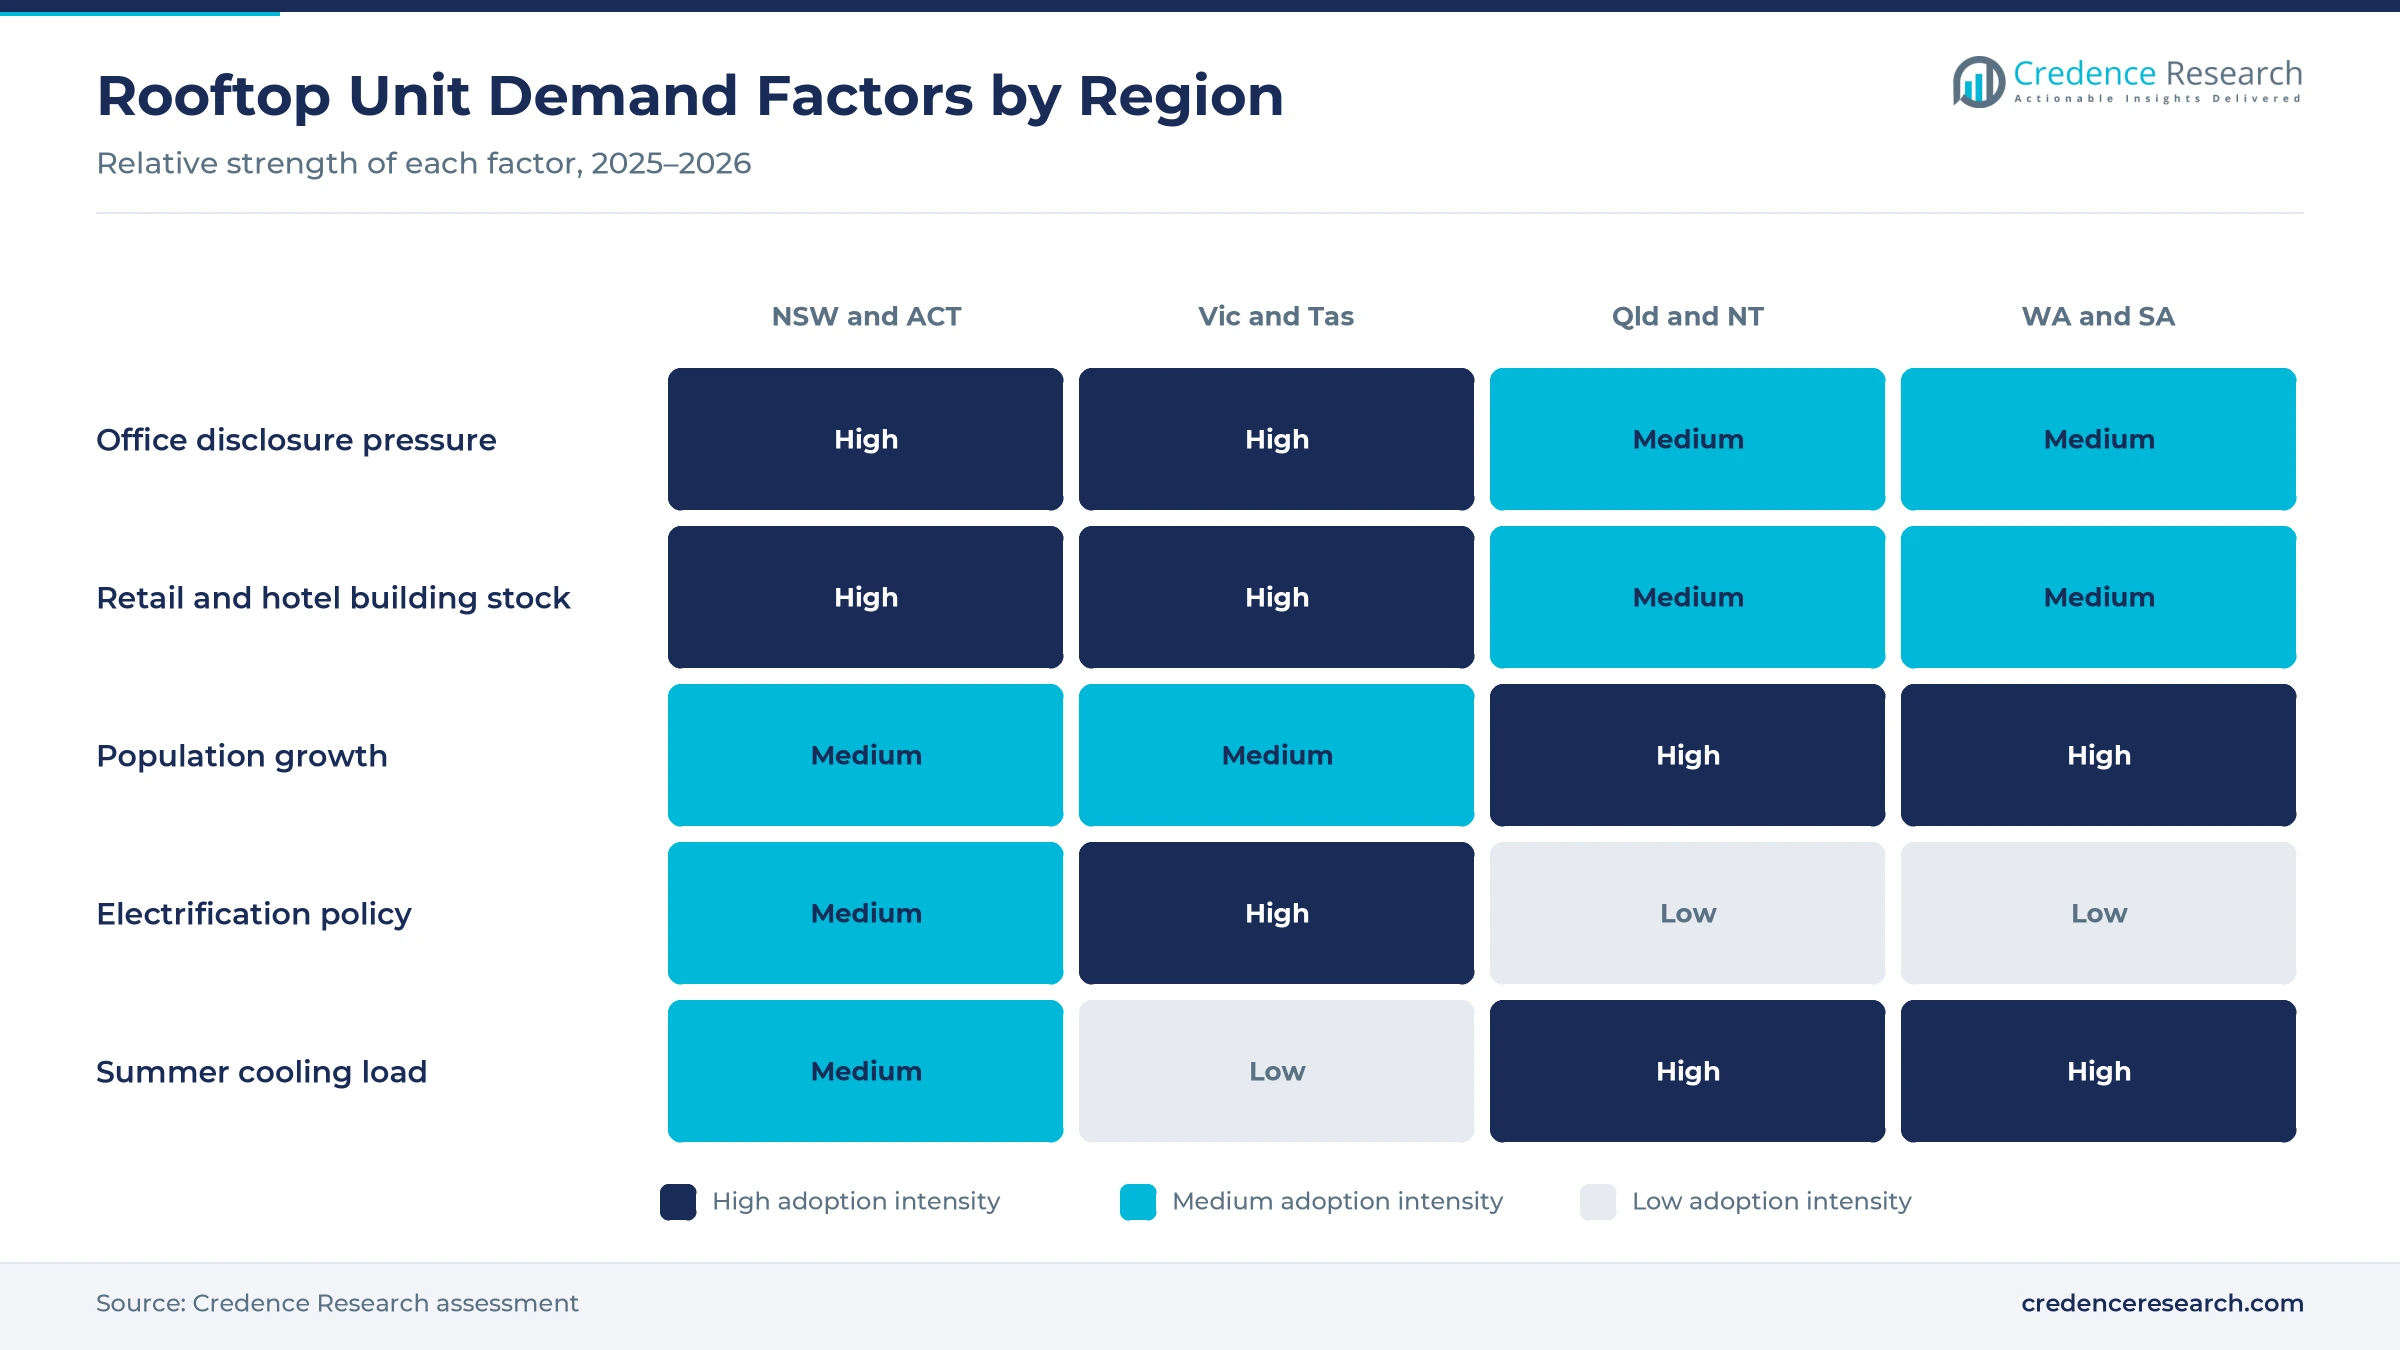
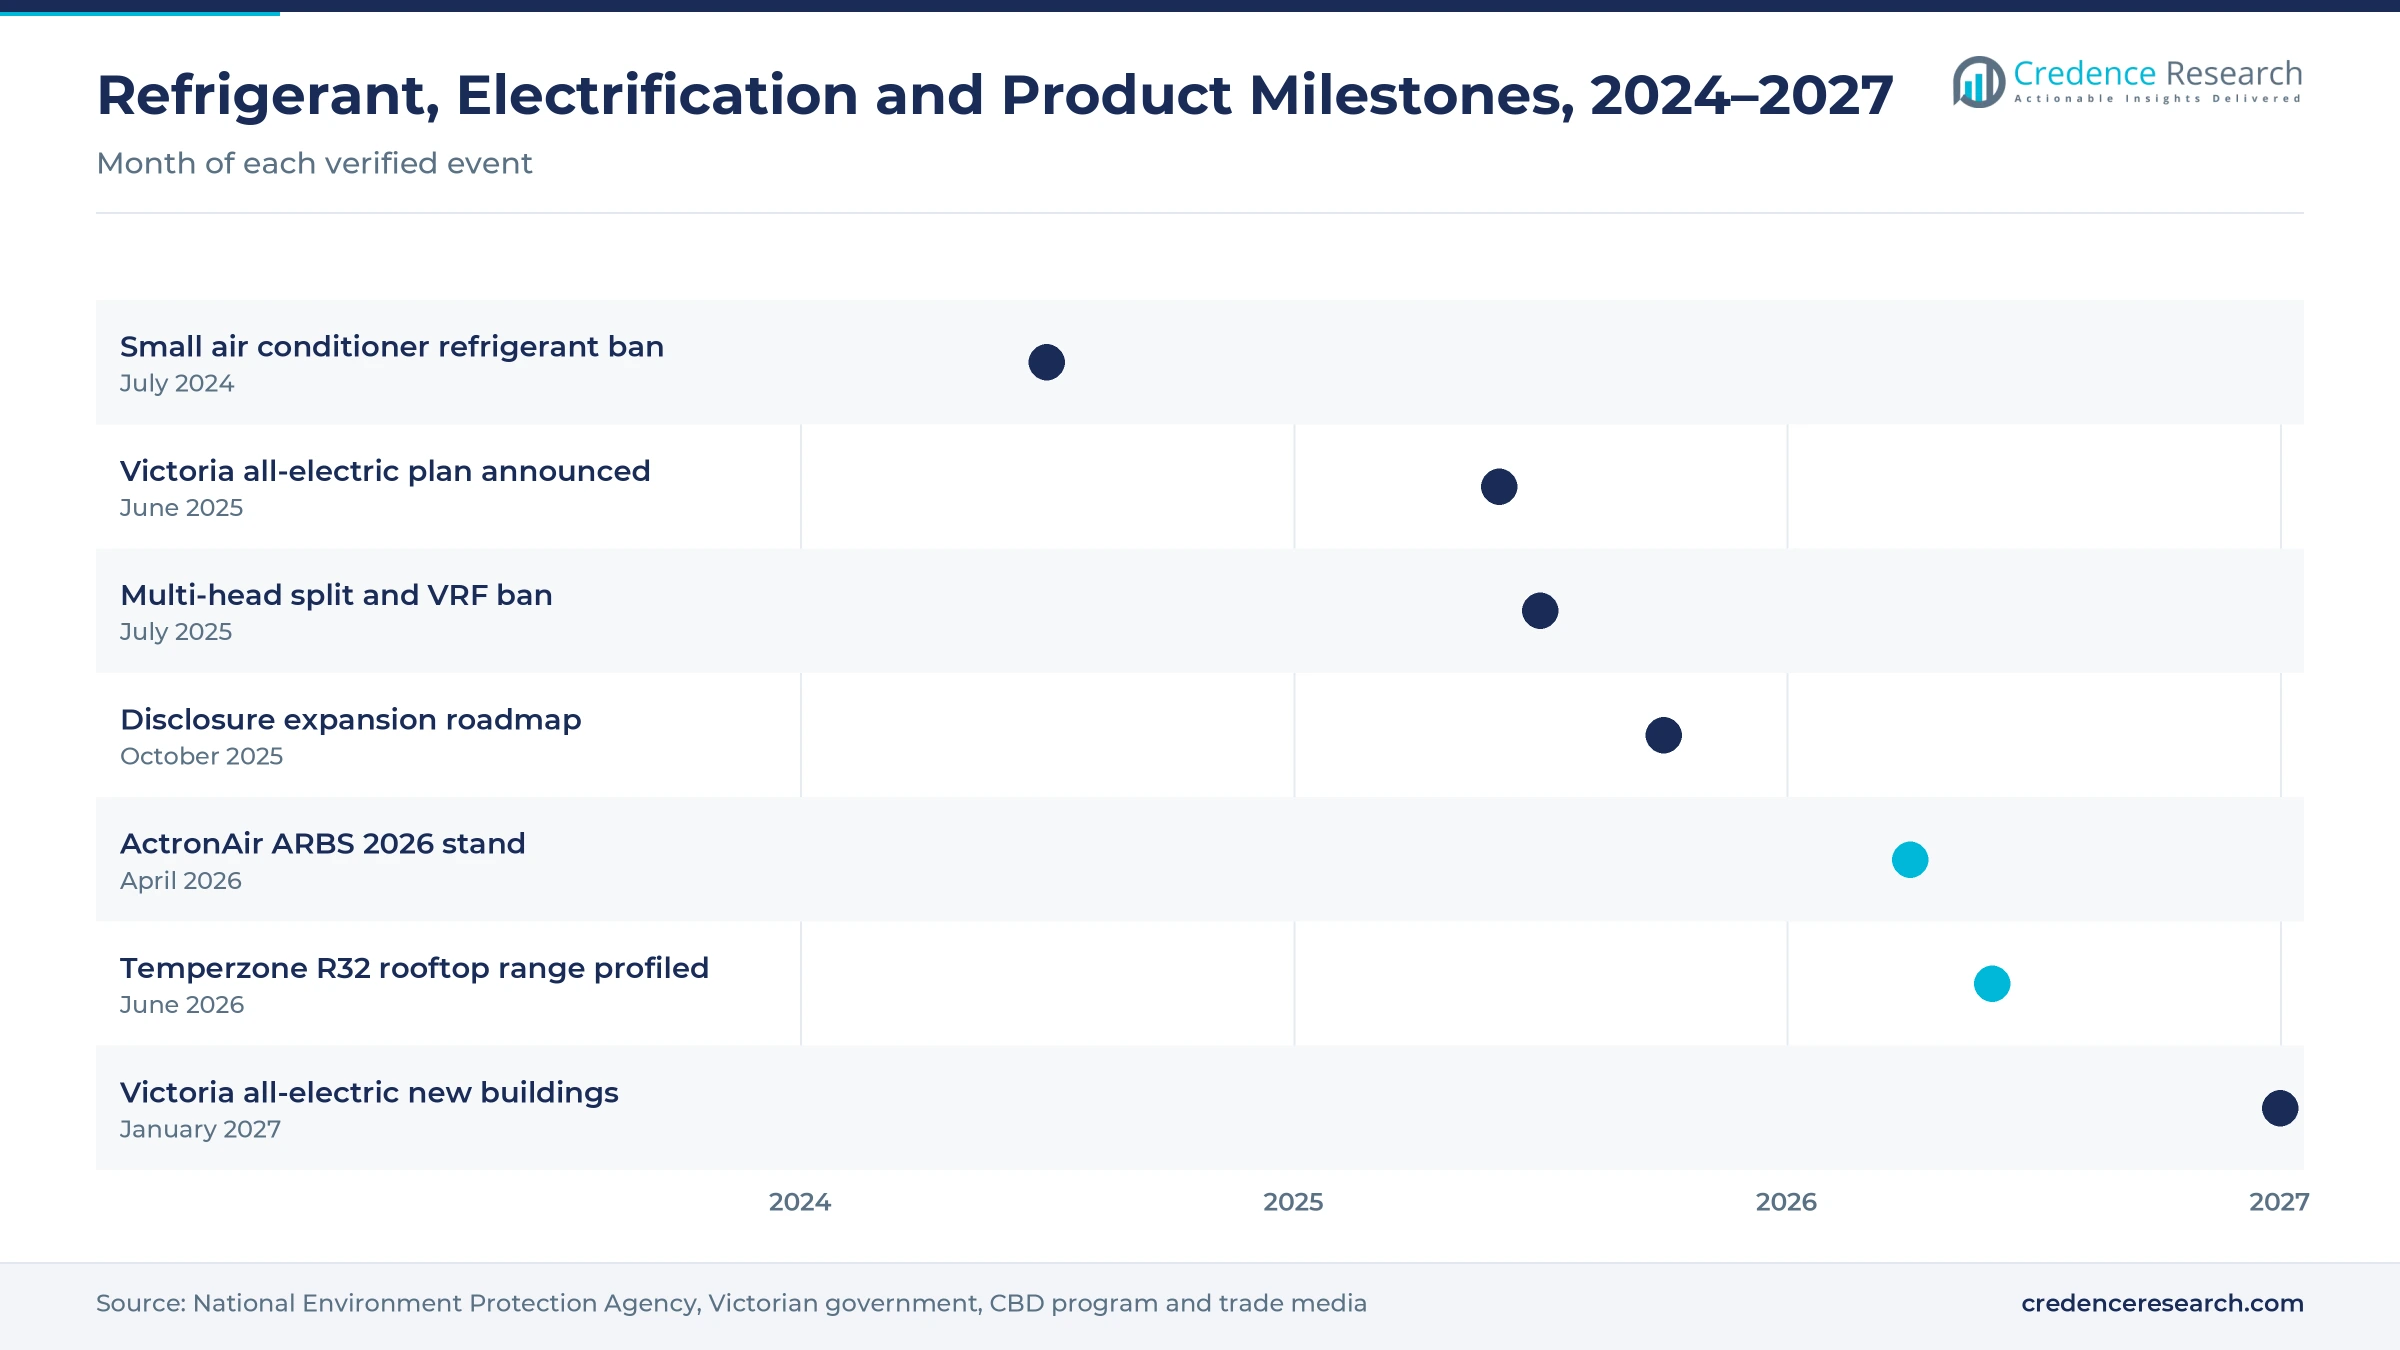
Refrigerant rules are pushing owners to plan rooftop replacements earlier, because older R410A fleets face rising service costs as gas supply tightens. Australia began phasing down hydrofluorocarbon imports on Jan. 1, 2018, and the phase-down reaches an 85% cut by Dec. 31, 2035, leaving a residual import allowance after that date, according to the National Environment Protection Agency. The agency says small split, window and portable units using refrigerant above 750 global warming potential were banned from July 1, 2024, and the ban widened on July 1, 2025 to multi-head split and variable refrigerant flow outdoor units. Ducted and larger packaged systems remain outside both bans for now. As a result, replacement holds 57.0% of 2025 value and grows at 5.99% a year.
Why does energy disclosure lift demand for efficient units?
Building owners face growing pressure to prove energy performance, which favors efficient rooftop units when old equipment is replaced. The Commercial Building Disclosure program requires energy efficiency information when commercial office space of 1,000 square meters or more is offered for sale or lease. The Energy Efficiency Council said in June 2024 that buildings disclosing under the program since 2012 had cut energy use by an average of 42%. Air conditioners above 65 kilowatts have also faced minimum energy performance standards since April 1, 2022, with seasonal efficiency ratings required at registration, according to the national Energy Rating program. In turn, owners that chase better ratings increasingly specify variable-speed units when they replace older packages.
How does selective non-residential building lift new installs?
Non-residential construction is recovering unevenly, which supports new rooftop installations in retail, logistics, education and health projects rather than across every building type. The Australian Bureau of Statistics reported on Aug. 26, 2026 that non-residential building work done rose 0.5% in the June quarter and stood 11.5% higher than a year earlier. Approvals remain volatile, because the same agency said non-residential approvals fell 24.7% to A$8.26 billion in June 2026 after a record May. South Australia's Department of Treasury and Finance noted that national non-residential approvals had risen 41% in May to stand 65% higher than a year earlier. As a result, new rooftop orders follow building construction pipelines in growth corridors.
Why do hotter summers and electrification favor heat pumps?
Hotter conditions and state gas policy both favor reverse-cycle rooftop units over cooling-only or gas-fired packages. The Bureau of Meteorology's State of the Climate 2024 found that Australia has warmed by 1.51°C since 1910, and that very high monthly maximum temperatures now occur about 11% of the time, against 2% in 1960–1989. In Victoria, the state government says that new hospitality buildings must be built all-electric from Jan. 1, 2027, with gas space heating excluded. RenewEconomy reported that the government announced on June 24, 2025 that the rule covers new commercial buildings except industrial, manufacturing and agricultural premises. As a result, reverse-cycle units hold 58.0% of 2025 value, as owners treat the rooftop package as the building's main heat pump.
Low-GWP ranges, inverter control and retrofit openings
How is the shift to R32 and R1234ze changing rooftop ranges?
Manufacturers are rebuilding packaged ranges around lower-impact refrigerants, which changes what owners buy when older R410A units fail. Daikin Australia said in September 2020 that R32 has a 66% lower global warming potential than R410A, the refrigerant then in common use. Climate Control News reported in June 2026 that Temperzone's Ecolite OPA uses R32 and was designed mainly to replace older R410A rooftop systems with a similar footprint and spigot locations. The same report said Temperzone's Environex OPA uses R1234ze with twin compressors and runs in cooling mode at ambient temperatures up to 60°C. In turn, like-for-like replacement becomes simpler, because new units fit existing roof curbs and ducts.
Why is the rise of inverter compressors and controls notable?
Variable-speed compressors and integrated controls are spreading from small split systems into packaged rooftop equipment, which raises the value of each unit sold. Temperzone's Econex HWP range uses R32 inverter technology to replace fixed-speed R410A water-cooled packages, Climate Control News reported. Rinnai Australia acquired the controls maker iZone on Oct. 19, 2023, saying that owning controls lets it offer a complete system with after-sales support. ActronAir highlighted zoning and integrated smart controls for light commercial uses at its ARBS 2026 stand, Climate Control News reported in April 2026. As a result, inverter compressors grow at 7.10% a year, the fastest technology.
Is there an opening in education and healthcare buildings?
Schools, clinics and hospitals offer a growing opening, because population growth adds floor space that must stay comfortable through longer hot seasons. The Australian Bureau of Statistics reported that the population grew by 392,700 people, or 1.4%, in the year to March 31, 2026. The Commercial Building Disclosure expansion roadmap says public hospitals and schools will be pursued through jurisdictional commitments before any direct regulation. The Bureau of Meteorology notes that extreme heat has caused more deaths in Australia than any other natural hazard, which raises the priority of reliable cooling in care settings. In turn, education and healthcare grows at 6.29% a year, the fastest end-use industry.
Can retail and hotel retrofits open a replacement window?
Shopping centers and large hotels could open a broad retrofit window, because both face likely energy ratings under the disclosure program's expansion. The roadmap describes shopping centers as large energy users with large air conditioning, heating and lighting requirements, and it would start with centers above 5,000 square meters. It names hotels with more than 100 rooms as first in line for hotel ratings, with full roadmap implementation by 2035. Rinnai Australia sells APAC commercial package units and acquired Perth rooftop package maker Specialized Engineering in April 2017. As a result, retail and hospitality holds 41.0% of 2025 value, and rated owners are likely to favor efficient replacements.
Capital limits, roof access and new skills slow upgrades
How do capital budgets delay replacement decisions?
Packaged rooftop units carry a high upfront cost once cranes, roof works and electrical upgrades are included, which leads many small owners to repair rather than replace. As a result, older fixed-speed units often stay in service well beyond their efficient life. Tenants who pay the power bills rarely fund the equipment, so landlords and tenants disagree on who should pay. Suppliers respond with staged replacement plans and service contracts that spread the cost over several years.
Why do roof access and site limits slow installs?
Rooftop replacement needs crane access, structural checks and short shutdowns, which are hard to arrange in busy shopping centers and city sites. In turn, projects can slip into cooler months or wait for tenant approval, which delays orders for distributors and dealers. New units that weigh more or need different curb sizes add steel and design costs. Manufacturers respond with replacement models that match existing footprints, spigot locations and duct connections closely.
How do new refrigerants raise skill and handling needs?
New refrigerants need updated handling, charging and leak-check practice for packaged units and the refrigeration compressors inside them, which adds training costs for mechanical contractors and service technicians. As a result, smaller contractors may hesitate to quote for newer equipment until their staff are confident with it. Owners also face uncertainty about which refrigerant will stay available longest. Manufacturers and distributors respond with product training, commissioning support and longer warranties for installers who complete their programs.
Why do split and VRF systems compete for projects?
Variable refrigerant flow and ducted split systems compete with rooftop packages in offices, clinics and multi-tenant buildings, because they offer zoning without large roof units. In turn, designers may choose split systems where roof space is limited or noise rules are strict. Import pricing and exchange rates also affect relative costs for equipment brought in from Asia. Rooftop suppliers respond with quieter units, zoning controls and simpler installation for single-story retail and warehouse buildings.
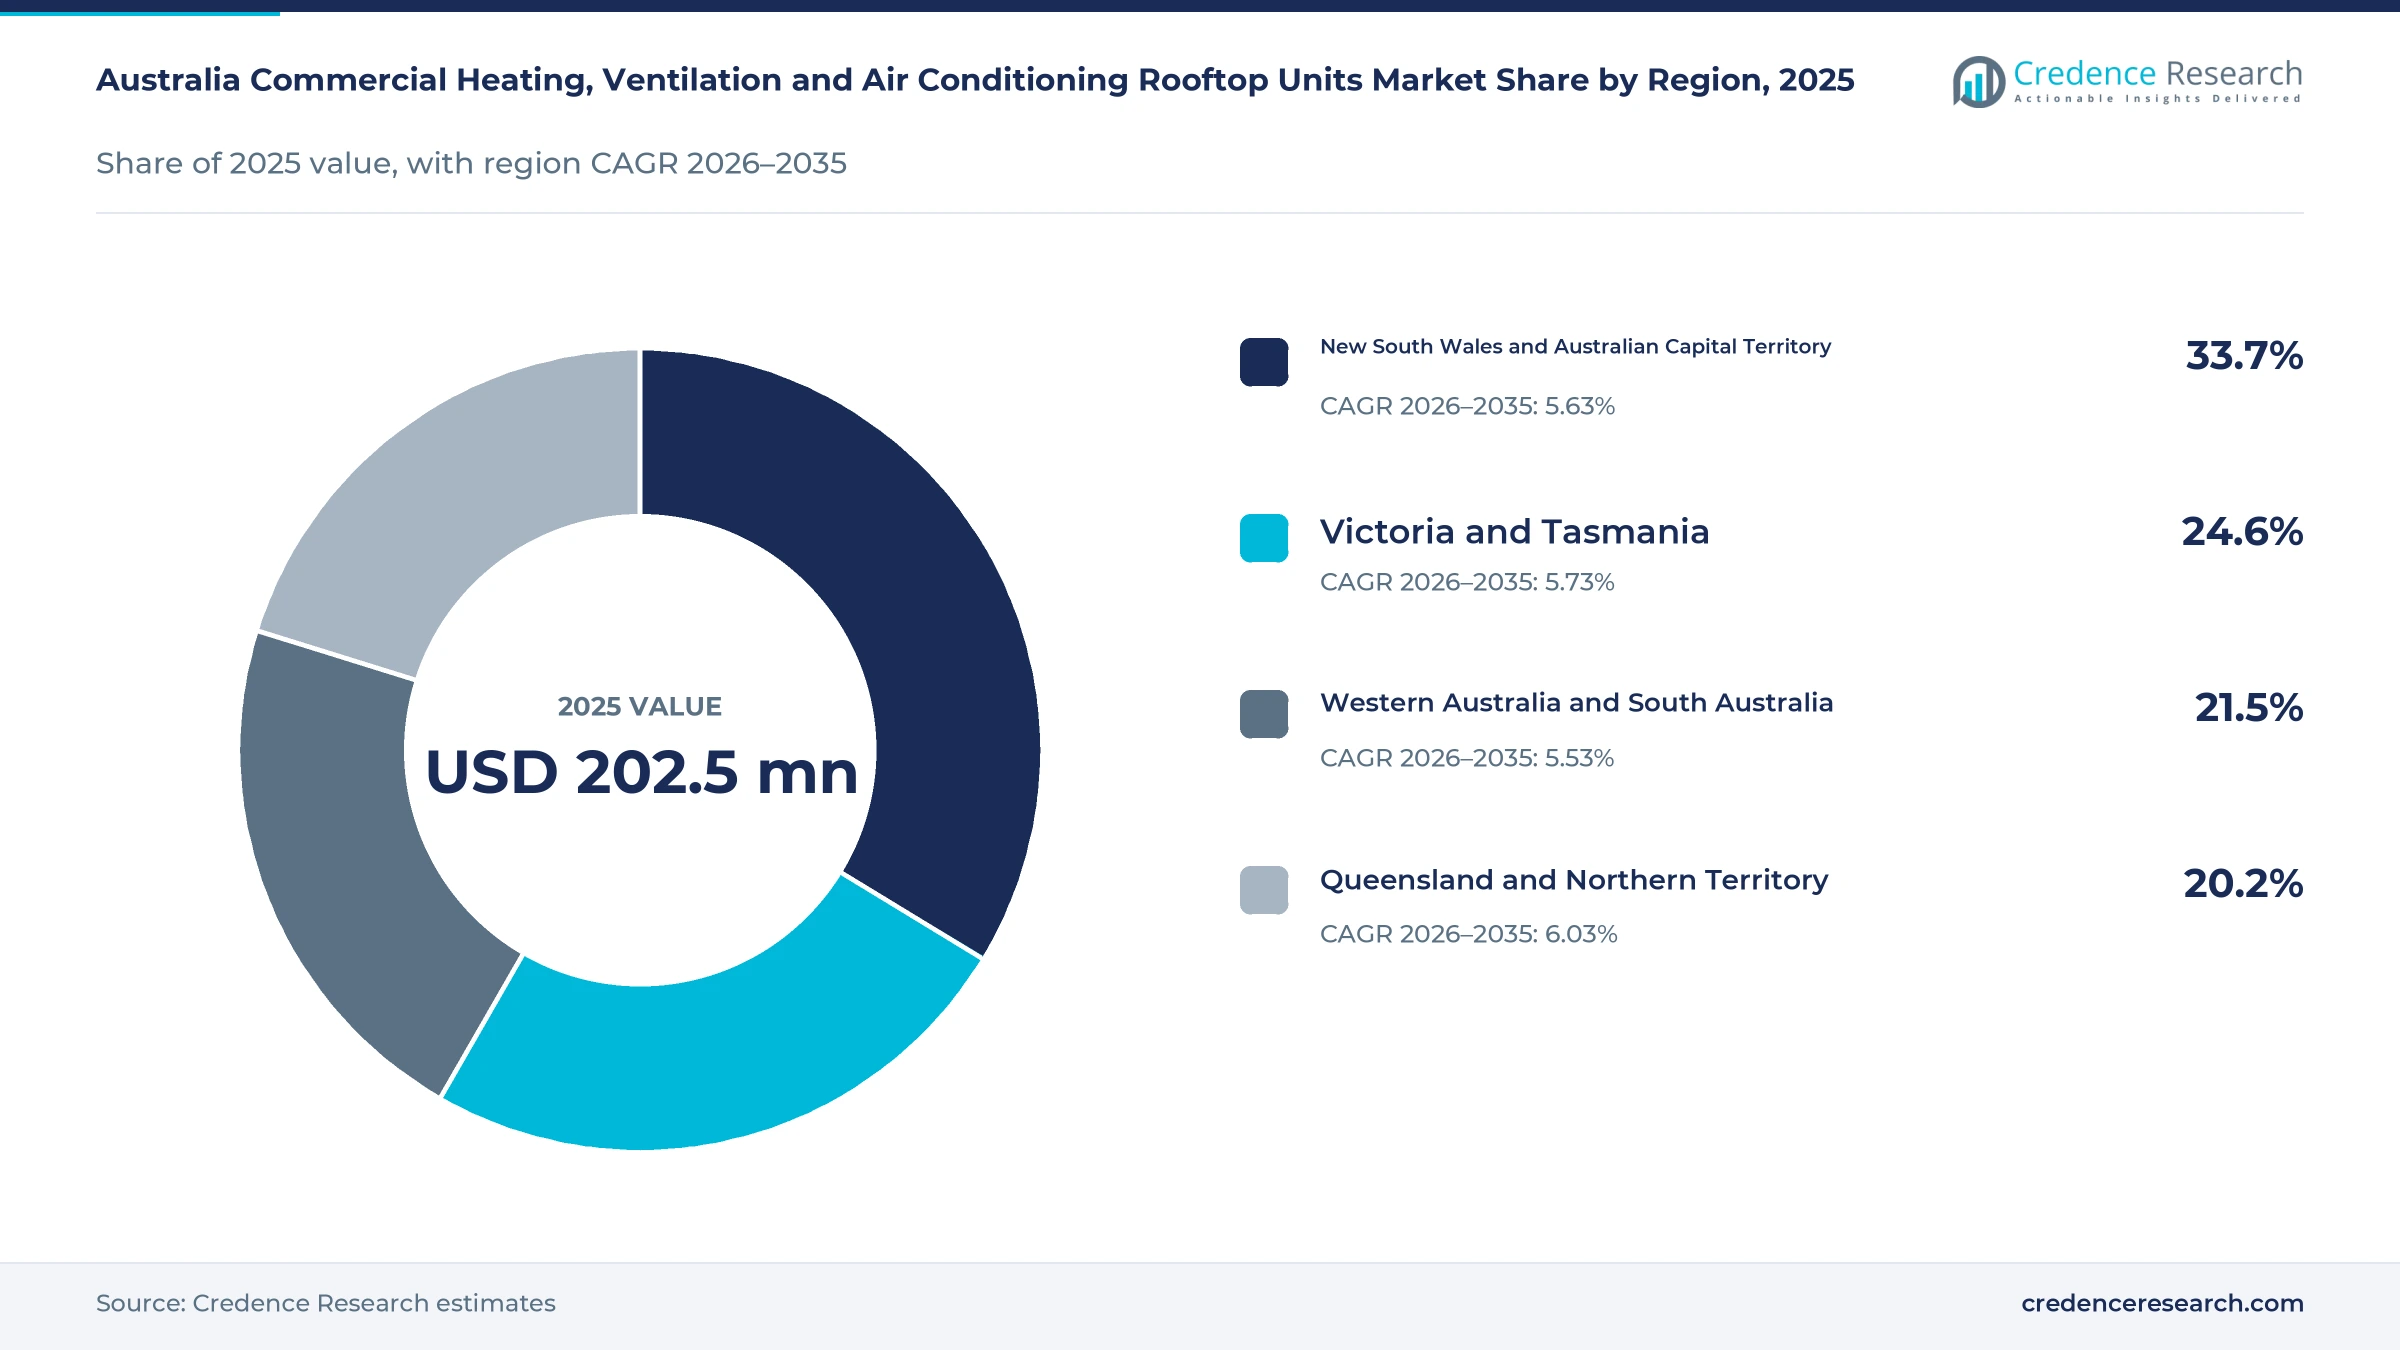
New South Wales leads while Queensland grows fastest
| Region | Value, 2025 (USD million) | Share, 2025 | CAGR, 2026–2035 |
|---|---|---|---|
| New South Wales and Australian Capital Territory | 68.2 | 33.7% | 5.63% |
| Victoria and Tasmania | 49.8 | 24.6% | 5.73% |
| Western Australia and South Australia | 43.5 | 21.5% | 5.53% |
| Queensland and Northern Territory | 40.9 | 20.2% | 6.03% |
New South Wales and the ACT hold the largest regional share
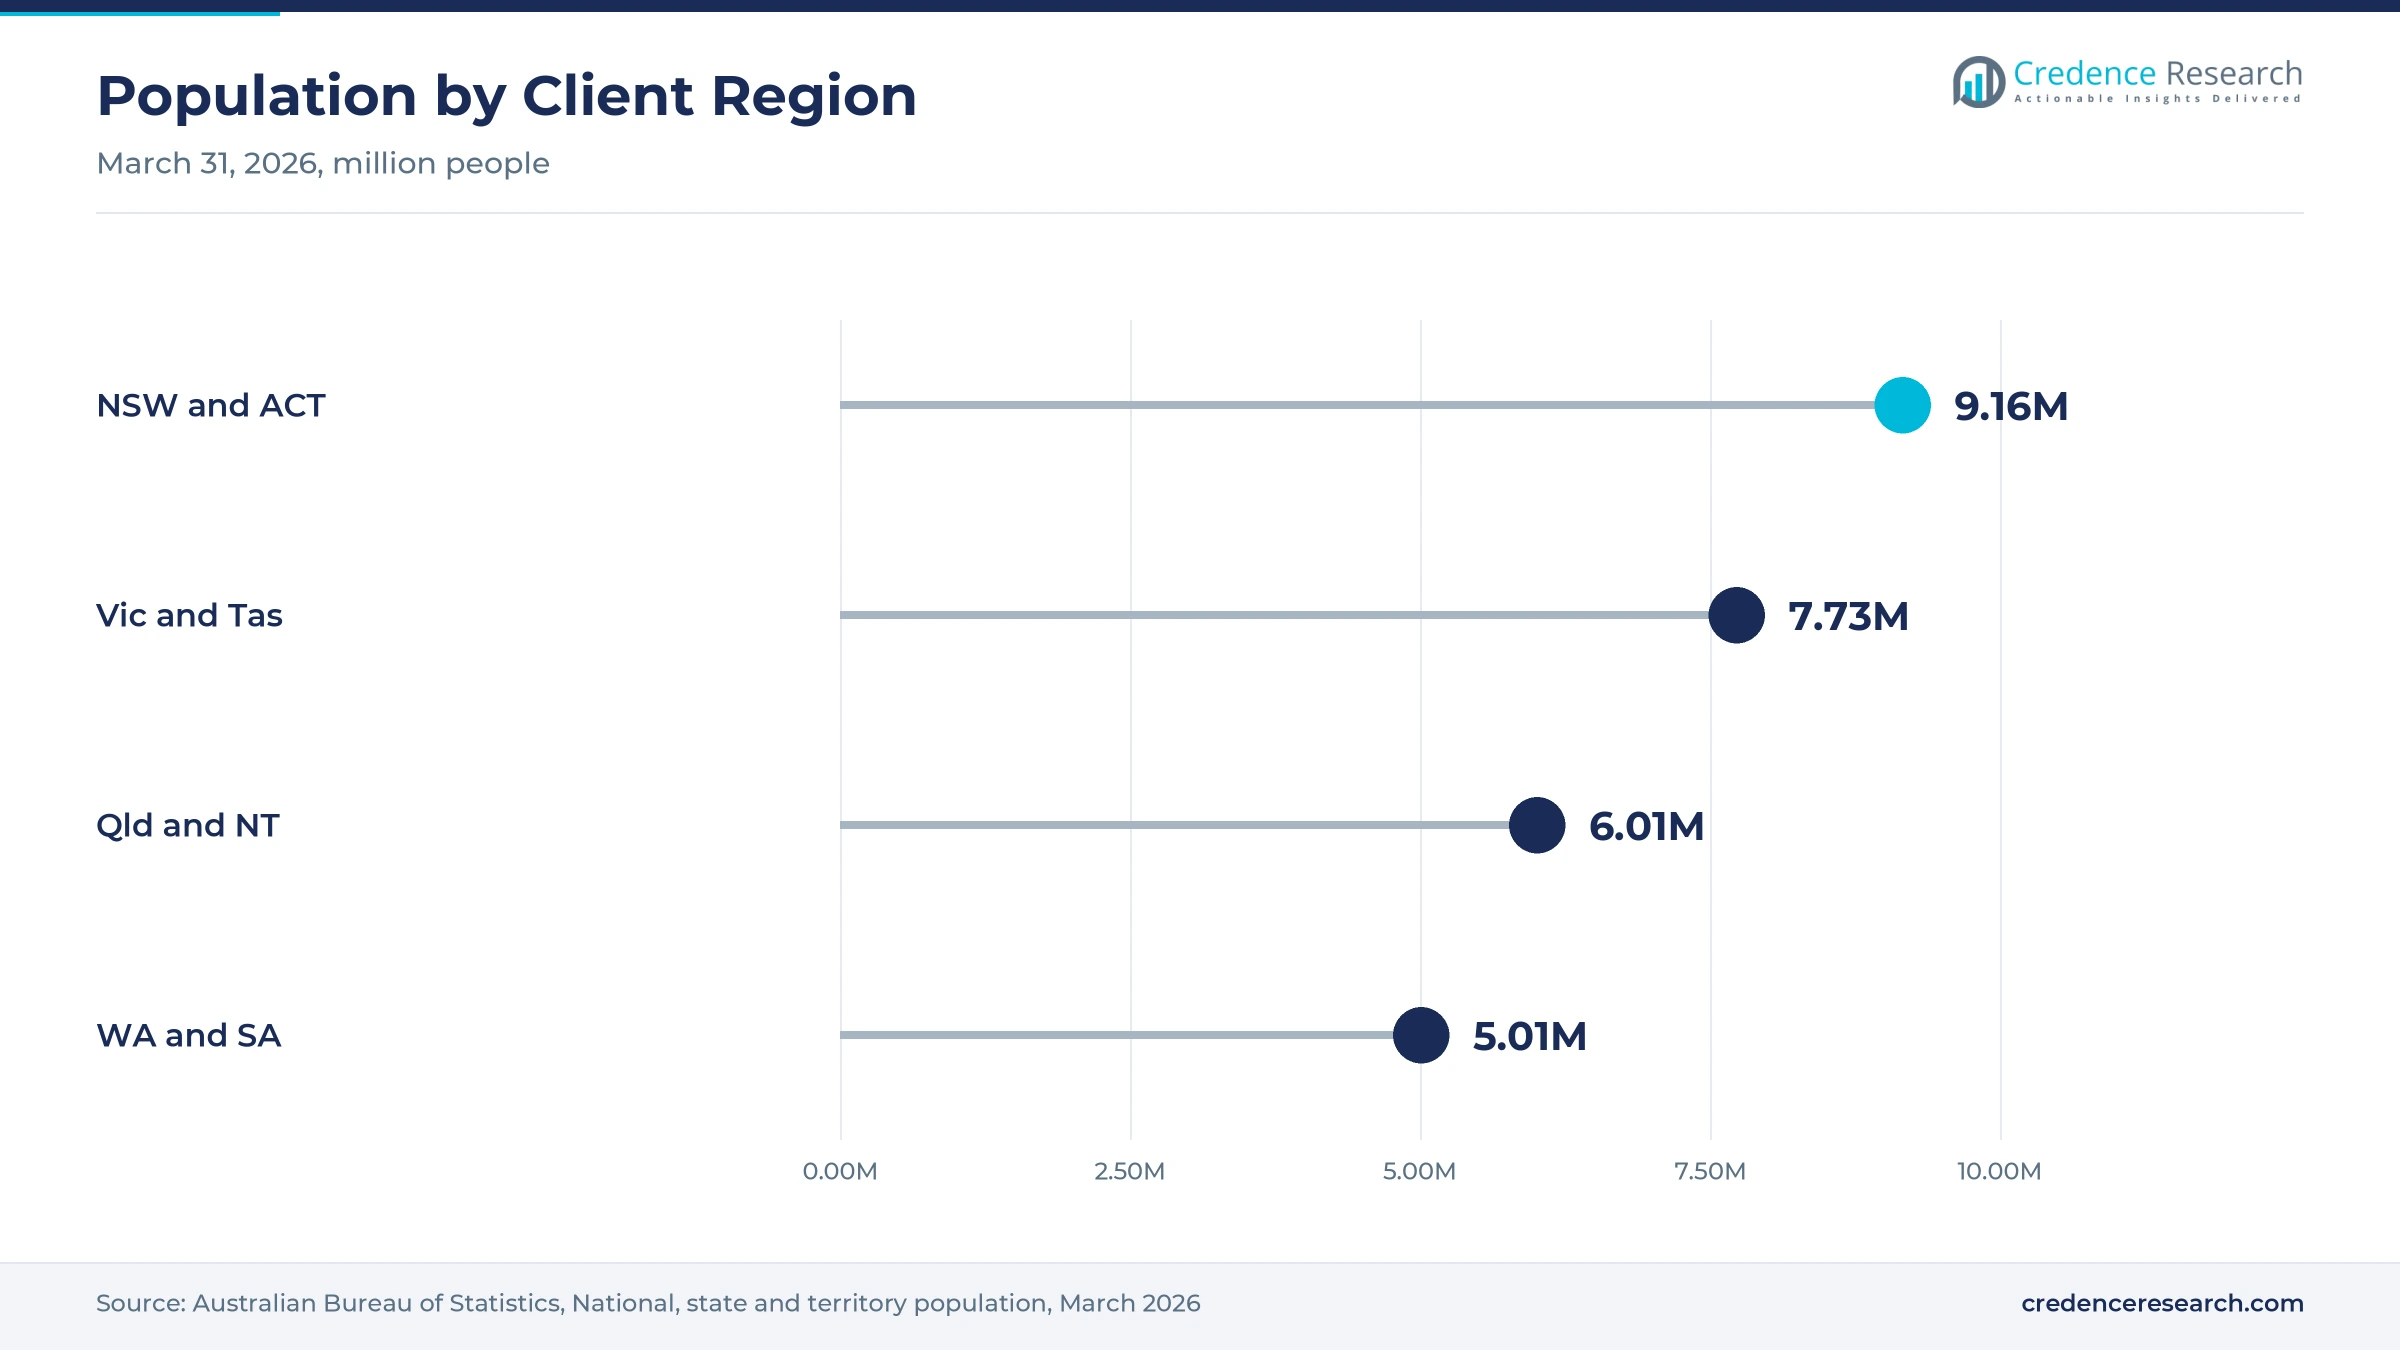
New South Wales and the Australian Capital Territory held a 33.7% share of 2025 value and grow at 5.63% a year, because Sydney and Canberra hold the largest stock of offices, shopping centers and public buildings. The zone had 9.16 million residents at March 31, 2026, according to the Australian Bureau of Statistics. Its large office stock also falls under national disclosure rules for spaces of 1,000 square meters or more. As a result, replacement of older units in established suburbs drives most regional demand.
How does electrification shape Victoria and Tasmania?
Victoria and Tasmania held a 24.6% share of 2025 value and grow at 5.73% a year, because cooler winters create strong heating demand alongside summer cooling. The zone had about 7.73 million residents at March 31, 2026, according to the Australian Bureau of Statistics. Victoria requires new commercial buildings to be all-electric from Jan. 1, 2027, which removes gas space heating from new projects. In turn, reverse-cycle packages replace gas-electric units in new Victorian retail and hospitality sites.
Western Australia and South Australia mix growth and local supply
Western Australia and South Australia held a 21.5% share of 2025 value and grow at 5.53% a year, because hot, dry summers make rooftop cooling essential. Western Australia had the fastest population growth of any state at 2.1% in the year to March 31, 2026, according to the Australian Bureau of Statistics. Rinnai Australia owns Specialized Engineering, a Perth-based maker of rooftop packaged units. South Australian non-residential approvals were 14% higher than a year earlier in May 2026, according to the state treasury.
Why are Queensland and the Northern Territory growing fastest?
Queensland and the Northern Territory held a 20.2% share of 2025 value and grow fastest at 6.03% a year, because long, humid cooling seasons keep rooftop units running for most of the year. Queensland's population grew 1.6% in the year to March 31, 2026, according to the Australian Bureau of Statistics. The zone had about 6.01 million residents at that date. As a result, new retail, logistics and school projects in south-east Queensland add steady demand for cooling-heavy packages.
Refrigerant bans, electrification rules and new ranges
| Development | Status and market relevance |
|---|---|
| In July 2024, Australia banned the import and manufacture of small air conditioners using refrigerant above 750 global warming potential. | Covers portable, window and non-ducted split units, while ducted and packaged systems are excluded |
| In June 2025, the Victorian government announced that new commercial buildings must be all-electric from January 2027. | Industrial, manufacturing and agricultural buildings are excluded, while existing buildings are exempt |
| In July 2025, Australia extended the refrigerant ban to multi-head split and variable refrigerant flow outdoor units. | Applies to units with up to 2.6 kilograms of refrigerant charge used for human comfort |
| In October 2025, the Commercial Building Disclosure program published its expansion roadmap. | Sets out future ratings for large hotels and shopping centers, with full implementation by 2035 |
| In June 2026, Climate Control News profiled Temperzone R32 and R1234ze packaged units shown at ARBS. | Ecolite OPA replaces older R410A rooftop systems with a similar footprint |
Inverter drives, new refrigerants and smarter controls
- Inverter compressors vary their speed to match the load, which cuts energy use at part load and supports better building energy ratings.
- Lower-impact refrigerants such as R32 and R1234ze replace R410A in new ranges, which reduces exposure to the import phase-down and future equipment bans.
- EC fan motors adjust airflow electronically, which lowers fan energy and allows quieter operation on retail and hospitality roofs.
- Integrated zoning controls link rooftop units with sensors and building systems, which lets owners track performance and schedule maintenance remotely.
Need a Custom Version of This Report?
Tailor the scope, geography, or segments to your exact requirements.
- Custom geography or segment scope
- Direct access to our analyst team
Local makers and global brands compete on fit and service
Competition combines Australian manufacturers with deep dealer networks and global brands that bring broad product ranges and service teams. ActronAir, an Australian company since 1984, sells commercial packaged rooftop units for small to large commercial spaces and cites ongoing investment in local manufacturing. Daikin Australia offers its UAYQ-C reverse-cycle rooftop packaged series in eight sizes from 16.3 to 84.2 kilowatts. Temperzone competes with R32 and R1234ze packaged ranges designed to replace older R410A units on existing roofs. Rinnai Australia sells APAC commercial package units, owns the Perth maker Specialized Engineering and acquired the controls maker iZone in October 2023. Suppliers compete on footprint match, delivery times, refrigerant choice and after-sales service, while mechanical contractors and specialist distributors strongly influence which brand an owner buys.
Which suppliers lead packaged rooftop equipment sales?
| Company | Type | Role in the market |
|---|---|---|
| ActronAir | Australian manufacturer | Sells commercial packaged rooftop units for small to large spaces |
| Daikin Australia | Global manufacturer | Offers UAYQ-C reverse-cycle rooftop packages from 16.3 to 84.2 kW |
| Temperzone | Packaged unit manufacturer | Sells R32 Ecolite OPA and R1234ze Environex OPA rooftop ranges |
| Rinnai Australia | Heating and cooling supplier | Sells APAC package units and owns Specialized Engineering |
Credence Research view on packaged rooftop replacement
Credence Research's view is that Australian rooftop unit demand will grow steadily because a large installed base of older units must be replaced under tighter refrigerant and energy rules. Replacement remains the largest application, while inverter compressors grow fastest as owners chase better ratings. Queensland and the Northern Territory gain most from population growth and long cooling seasons. Suppliers that offer footprint-matched, lower-impact refrigerant units with strong installer support should win the most replacement work by 2035.
How the national rooftop unit estimate was built
The report uses 2025 as the base year on a calendar basis, and market values come from the Credence Research model. That model draws on official building activity and population statistics, regulator pages on refrigerants and energy standards, state electrification guidance, company product pages and trade media. Segment splits and regional growth rates are Credence Research estimates, while regional shares follow the client split. The report used no interviews or surveys at any stage of the research work.
Heat pump retrofits and efficient replacements drive growth
The Australia commercial heating, ventilation and air conditioning rooftop units market is expected to reach USD 364.7 million by 2035, a 5.72% CAGR during 2026–2035, as owners replace older units and add capacity in growing regions. Growth should be strongest in reverse-cycle heat pumps, inverter compressors and education and healthcare buildings, because these areas gain most from electrification, disclosure and population growth. Capital limits and roof access could slow some projects, while footprint-matched replacement units should ease upgrades for many owners.
Frequently Asked Questions
How big is the Australia commercial rooftop HVAC unit market?
Which product type leads rooftop unit sales?
Which region leads the market?
How do refrigerant rules affect rooftop units?
How does energy disclosure support demand?
Why are inverter compressors growing fastest?
Who are the leading companies in the market?
What are the main challenges for building owners?
Table of Content
Chapter 1 Market Segmentation
- 1.1 Segmentation Framework
- 1.1.1 Product and Service Classification
- 1.1.2 Application and End-Use Classification
- 1.1.3 Technology and Solution Classification
- 1.1.4 Customer and Distribution Channel Classification
- 1.1.5 Geographic Segmentation
- 1.1.6 Market Segment Definitions and Boundaries
- 1.2 By Product Type
- 1.2.1 Reverse-cycle heat pumps
- 1.2.2 Cooling-only packages
- 1.2.3 Gas-electric packages
- 1.3 By Application
- 1.3.1 Replacement
- 1.3.2 New construction
- 1.3.3 Capacity expansion
- 1.4 By End-Use Industry
- 1.4.1 Retail and hospitality
- 1.4.2 Offices and logistics premises
- 1.4.3 Education and healthcare
- 1.5 By Technology
- 1.5.1 Inverter compressors
- 1.5.2 Staged compressors
- 1.5.3 Single-stage fixed-speed compressors
Chapter 2 Introduction
- 2.1 Report Objectives and Scope
- 2.2 Product Definition and Industry Terminology
- 2.3 Market Inclusions and Exclusions
- 2.4 Research Process
- 2.4.1 Primary Research and Expert Interviews
- 2.4.2 Secondary Research and Source Review
- 2.4.3 Top-Down and Bottom-Up Estimation
- 2.4.4 Data Triangulation and Verification
- 2.5 Market Size Measurement Basis
- 2.5.1 2025: USD 202.5 million → 2035: USD 364.7 million
- 2.6 Historical and Forecast Reference Periods
- 2.6.1 Historical Period: 2018-2025
- 2.6.2 Base Year: 2025
- 2.6.3 Forecast Period: 2025-2035
- 2.7 Research Assumptions and Limitations
Chapter 3 Executive Summary
- 3.1 Market Snapshot and Key Findings
- 3.2 Base-Year Market Size, 2025
- 3.3 Forecast Market Size, 2035
- 3.4 Revenue and Volume Growth Outlook
- 3.5 Key Demand and Supply Indicators
- 3.6 Leading Market Segments
- 3.7 Fastest-Growing Market Opportunities
- 3.8 Regional Performance Highlights
- 3.9 Technology and Industry Transformation
- 3.10 Competitive Landscape Summary
- 3.11 Analyst View and Strategic Implications
Chapter 4 Australia Commercial Heating, Ventilation and Air Conditioning Rooftop Units Market Trends and Developments
- 4.1 Historical Industry Development, 2018-2025
- 4.2 Recent Market Trends and Developments
- 4.3 Demand and Customer Behavior Trends
- 4.4 Technology and Product Innovation
- 4.5 Artificial Intelligence, Automation and Digitalization
- 4.6 Local Manufacturing and Supply Chain Realignment
- 4.7 Industry Partnerships, Mergers and Acquisitions
- 4.8 Sustainability and Circular Economy Developments
- 4.9 Government and Private Sector Investment Trends
- 4.10 Emerging Business Models and Commercialization
- 4.11 Industry Developments and Announcements
Chapter 5 Australia Commercial Heating, Ventilation and Air Conditioning Rooftop Units Market Production, Supply and Demand Analysis
- 5.1 Demand Trend and Consumption Analysis, 2018-2025
- 5.2 Demand Forecast, 2025-2035
- 5.3 Production and Output Trend, 2018-2025
- 5.4 Production and Output Forecast, 2025-2035
- 5.5 Installed Capacity and Capacity Utilization
- 5.6 Company-Wise Production Plants and Statistics
- 5.6.1 Installed Production Capacity
- 5.6.2 Actual Production
- 5.6.3 Planned Capacity and Expansion Targets
- 5.7 Supply Chain Structure and Procurement Trends
- 5.8 Supply-Demand Gap and Bottlenecks
- 5.9 Import Dependence and Sourcing Structure
- 5.10 Contract Manufacturing and Outsourcing
- 5.11 Regional Supply and Demand Concentration
Chapter 6 Australia Commercial Heating, Ventilation and Air Conditioning Rooftop Units Market Pricing Analysis
- 6.1 Pricing Structure and Measurement
- 6.2 Historical Pricing Trends, 2018-2025
- 6.3 Pricing Outlook, 2025-2035
- 6.4 Average Selling Price and Unit Economics
- 6.5 Pricing by Product and Market Segment
- 6.6 Geographic Pricing Differences
- 6.7 Key Input, Energy, Labor and Logistics Costs
- 6.8 Contract Pricing and Purchasing Models
- 6.9 Pricing Sensitivity and Competitive Positioning
- 6.10 Price, Margin and Profitability Implications
Chapter 7 Australia Commercial Heating, Ventilation and Air Conditioning Rooftop Units Market Dynamics
- 7.1 Market Growth Drivers
- 7.1.1 Demand-Side Drivers
- 7.1.2 Technology and Innovation Drivers
- 7.1.3 Infrastructure and Investment Drivers
- 7.1.4 Regulatory and Policy Drivers
- 7.2 Market Restraints
- 7.2.1 Cost and Affordability Constraints
- 7.2.2 Technology and Adoption Barriers
- 7.2.3 Supply Chain and Operational Constraints
- 7.3 Market Challenges
- 7.3.1 Competitive Pressure and Margin Erosion
- 7.3.2 Skills, Infrastructure and Implementation Gaps
- 7.4 Emerging Market Opportunities
- 7.5 Market Dynamics Impact and Time-Horizon Assessment
Chapter 8 Australia Commercial Heating, Ventilation and Air Conditioning Rooftop Units Value Chain Analysis
- 8.1 Industry Value Chain Overview
- 8.2 Upstream Suppliers and Critical Inputs
- 8.3 Technology and Component Providers
- 8.4 Manufacturing or Service Delivery
- 8.5 Distribution, Channel Partners and Integrators
- 8.6 Downstream Applications and End Users
- 8.7 Value Addition and Profit Pools
- 8.8 Vertical Integration and Outsourcing
- 8.9 Supplier Concentration and Risk
- 8.10 Supply Chain Localization and Resilience
Chapter 9 Australia Commercial Heating, Ventilation and Air Conditioning Rooftop Units Market Regulations and Policies
- 9.1 Relevant Laws, Standards and Compliance Frameworks
- 9.2 Product, Service, Safety and Quality Requirements
- 9.3 Government Policies, Incentives and Subsidies
- 9.4 Imports, Exports and Trade Barriers
- 9.5 Public Procurement and Local Content Requirements
- 9.6 Environmental and Sustainability Compliance
- 9.7 Upcoming Policy Changes and Market Implications
Chapter 10 Australia Commercial Heating, Ventilation and Air Conditioning Rooftop Units Market Hotspots and Opportunities
- 10.1 Market Opportunity Mapping and Growth Hotspots
- 10.2 High-Growth Applications and Customer Groups
- 10.3 Underserved Markets and White-Space Opportunities
- 10.4 Emerging Technology and Product Opportunities
- 10.5 New Capacity and Investment Hotspots
- 10.6 Market Entry and Expansion Opportunities
- 10.7 Distribution and Partnership Opportunities
- 10.8 Near-Term and Long-Term Commercial Potential
- 10.9 Opportunity Attractiveness and Execution Risks
Chapter 11 Australia Commercial Heating, Ventilation and Air Conditioning Rooftop Units Market Outlook, 2025-2035
- 11.1 Market Size and Analysis
- 11.1.1 Revenue (Market Measurement: 2025: USD 202.5 million → 2035: USD 364.7 million)
- 11.1.2 Market Volume and Quantity Sold
- 11.1.3 Historical Market Size, 2018-2025
- 11.1.4 Base-Year Market Size, 2025
- 11.2 Market Forecast, 2025-2035
- 11.2.1 Revenue Forecast to 2035
- 11.2.2 Volume Forecast to 2035
- 11.2.3 CAGR and Year-on-Year Growth
- 11.2.4 Incremental Revenue Opportunity
- 11.3 Forecast Assumptions and Scenario Analysis
- 11.3.1 Base-Case Forecast
- 11.3.2 Optimistic and Conservative Scenarios
- 11.3.3 Technology, Pricing and Policy Sensitivities
- 11.4 Market Attractiveness and Growth Outlook
Chapter 12 Australia Commercial Heating, Ventilation and Air Conditioning Rooftop Units Market Segmentation and Outlook
- 12.1 Segmentation Summary and Market Shares, 2025
- 12.2 Largest and Fastest-Growing Segments
- 12.3 By Product Type - Market Size and Forecast, 2025-2035
- 12.3.1 Segment Definition and Scope
- 12.3.2 Historical Market Size, 2018-2025
- 12.3.3 Revenue Forecast, 2025-2035
- 12.3.4 Volume Forecast, 2025-2035
- 12.3.5 Base-Year Market Share, 2025
- 12.3.6 Segment CAGR and Growth Drivers
- 12.3.7 Subsegment Market Size and Forecast
- 12.3.7.1 Reverse-cycle heat pumps
- 12.3.7.2 Cooling-only packages
- 12.3.7.3 Gas-electric packages
- 12.3.8 Subsegment Pricing and Adoption Trends
- 12.3.9 Leading Suppliers and Competition
- 12.3.10 Regional Demand and Opportunities
- 12.4 By Application - Market Size and Forecast, 2025-2035
- 12.4.1 Segment Definition and Scope
- 12.4.2 Historical Market Size, 2018-2025
- 12.4.3 Revenue Forecast, 2025-2035
- 12.4.4 Volume Forecast, 2025-2035
- 12.4.5 Base-Year Market Share, 2025
- 12.4.6 Segment CAGR and Growth Drivers
- 12.4.7 Subsegment Market Size and Forecast
- 12.4.7.1 Replacement
- 12.4.7.2 New construction
- 12.4.7.3 Capacity expansion
- 12.4.8 Subsegment Pricing and Adoption Trends
- 12.4.9 Leading Suppliers and Competition
- 12.4.10 Regional Demand and Opportunities
- 12.5 By End-Use Industry - Market Size and Forecast, 2025-2035
- 12.5.1 Segment Definition and Scope
- 12.5.2 Historical Market Size, 2018-2025
- 12.5.3 Revenue Forecast, 2025-2035
- 12.5.4 Volume Forecast, 2025-2035
- 12.5.5 Base-Year Market Share, 2025
- 12.5.6 Segment CAGR and Growth Drivers
- 12.5.7 Subsegment Market Size and Forecast
- 12.5.7.1 Retail and hospitality
- 12.5.7.2 Offices and logistics premises
- 12.5.7.3 Education and healthcare
- 12.5.8 Subsegment Pricing and Adoption Trends
- 12.5.9 Leading Suppliers and Competition
- 12.5.10 Regional Demand and Opportunities
- 12.6 By Technology - Market Size and Forecast, 2025-2035
- 12.6.1 Segment Definition and Scope
- 12.6.2 Historical Market Size, 2018-2025
- 12.6.3 Revenue Forecast, 2025-2035
- 12.6.4 Volume Forecast, 2025-2035
- 12.6.5 Base-Year Market Share, 2025
- 12.6.6 Segment CAGR and Growth Drivers
- 12.6.7 Subsegment Market Size and Forecast
- 12.6.7.1 Inverter compressors
- 12.6.7.2 Staged compressors
- 12.6.7.3 Single-stage fixed-speed compressors
- 12.6.8 Subsegment Pricing and Adoption Trends
- 12.6.9 Leading Suppliers and Competition
- 12.6.10 Regional Demand and Opportunities
- 12.7 Segment Growth Comparison
- 12.8 Segment Attractiveness and Priority Matrix
Chapter 13 Australia Commercial Heating, Ventilation and Air Conditioning Rooftop Units End-Use and Application Market Outlook
- 13.1 End-Use Industry and Customer Demand Structure
- 13.2 Leading Applications and Customer Groups
- 13.3 End-Use Market Size, Share and Forecast
- 13.4 Major End-Use Industry Deep Dives
- 13.4.1 Customer Requirements and Use Cases
- 13.4.2 Demand and Replacement Cycles
- 13.4.3 Technical and Regulatory Considerations
- 13.4.4 Purchasing and Procurement Models
- 13.4.5 Leading Vendors and Distribution Channels
- 13.4.6 Forecast and Commercial Opportunities
- 13.5 Emerging Applications and Cross-Segment Demand
- 13.6 End-Use Industry Investment Priorities
Chapter 14 Australia Commercial Heating, Ventilation and Air Conditioning Rooftop Units Geographic Market Outlook, 2025-2035
- 14.1 Domestic Market Distribution and Demand Clusters
- 14.2 State- or Province-Wise Market Size and Forecast, 2025-2035
- 14.3 City and Metropolitan Market Outlook
- 14.4 Industrial, Manufacturing and Commercial Clusters
- 14.5 Geographic Concentration of Key End Users
- 14.6 Local Pricing and Purchasing Differences
- 14.7 Domestic Production Facilities and Capacity Map
- 14.8 Local Infrastructure and Project Pipeline
- 14.9 State-Level Policy and Incentive Differences
- 14.10 Subnational Investment Hotspots and Opportunities
- 14.11 Distribution and Logistics Networks
- 14.12 Domestic Competitive Footprint
Chapter 15 Australia Commercial Heating, Ventilation and Air Conditioning Rooftop Units Technology, Innovation and Sustainability Outlook
- 15.1 Technology Landscape and Maturity
- 15.2 Product, Process and Service Innovation
- 15.3 AI, Automation and Digital Tools in the Industry
- 15.4 Technology Adoption and Performance Benchmarking
- 15.5 Innovation Pipeline and R&D Investment
- 15.6 Patent and Intellectual Property Trends
- 15.7 Energy Efficiency and Resource Management
- 15.8 Sustainability, Recycling and Circularity
- 15.9 Technology Roadmap, 2025-2035
- 15.10 Risks of Obsolescence and Technology Substitution
Chapter 16 Australia Commercial Heating, Ventilation and Air Conditioning Rooftop Units Market Key Strategic Imperatives
- 16.1 Growth and Market Entry Priorities
- 16.2 High-Return Products and Segments
- 16.3 Pricing, Profitability and Cost Optimization
- 16.4 Technology Investment and Product Differentiation
- 16.5 Supply Chain Localization and Resilience
- 16.6 Distribution and Customer Acquisition
- 16.7 Partnership, Acquisition and Capacity Strategy
- 16.8 Regional Expansion Priorities
- 16.9 Short-, Medium- and Long-Term Actions
Chapter 17 Competition Outlook
- 17.1 Industry Competition Characteristics
- 17.2 Market Structure and Concentration
- 17.3 Market Share and Competitive Positioning, 2025
- 17.4 Company-Wise Revenue and Product Benchmarking
- 17.5 Production and Service Capacity Benchmarking
- 17.6 Technology, Pricing and Differentiation
- 17.7 Regional Footprint and Distribution Strength
- 17.8 Mergers, Acquisitions and Strategic Alliances
- 17.9 New Entrants and Competitive Threats
- 17.10 Porter's Five Forces and Industry Attractiveness
- 17.11 Competitive Outlook, 2025-2035
Chapter 18 Company Profiles
- 18.1 Company Coverage and Selection Criteria
- 18.2 Daikin Australia
- 18.2.1 Business Description
- 18.2.2 Company Ownership and Geographic Presence
- 18.2.3 Product and Service Portfolio
- 18.2.4 Manufacturing and Operating Footprint
- 18.2.5 Production Capacity and Expansion Plans
- 18.2.6 Financial Performance and Investment
- 18.2.7 Market Share and Competitive Position
- 18.2.8 Technology and Innovation Capabilities
- 18.2.9 Strategic Alliances or Partnerships
- 18.2.10 Recent Developments
- 18.2.11 Growth Strategy and Outlook
- 18.3 Temperzone
- 18.4 ActronAir
- 18.5 Rinnai Australia
- 18.6 Trane
- 18.7 Other Relevant Market Participants
Note: Every listed company is profiled on the structure shown under the first company. The company list is preliminary and may change based on research findings, market developments, data availability and client requirements.
Chapter 19 Disclaimer
- 19.1 Research and Forecast Disclaimer
- 19.2 Data Source and Estimation Limitations
Note: The depth of individual sections depends on data availability for this market. Volume, capacity, trade and other unit-based metrics are included where applicable.

