
Servicing rules and new housing shape building safety demand
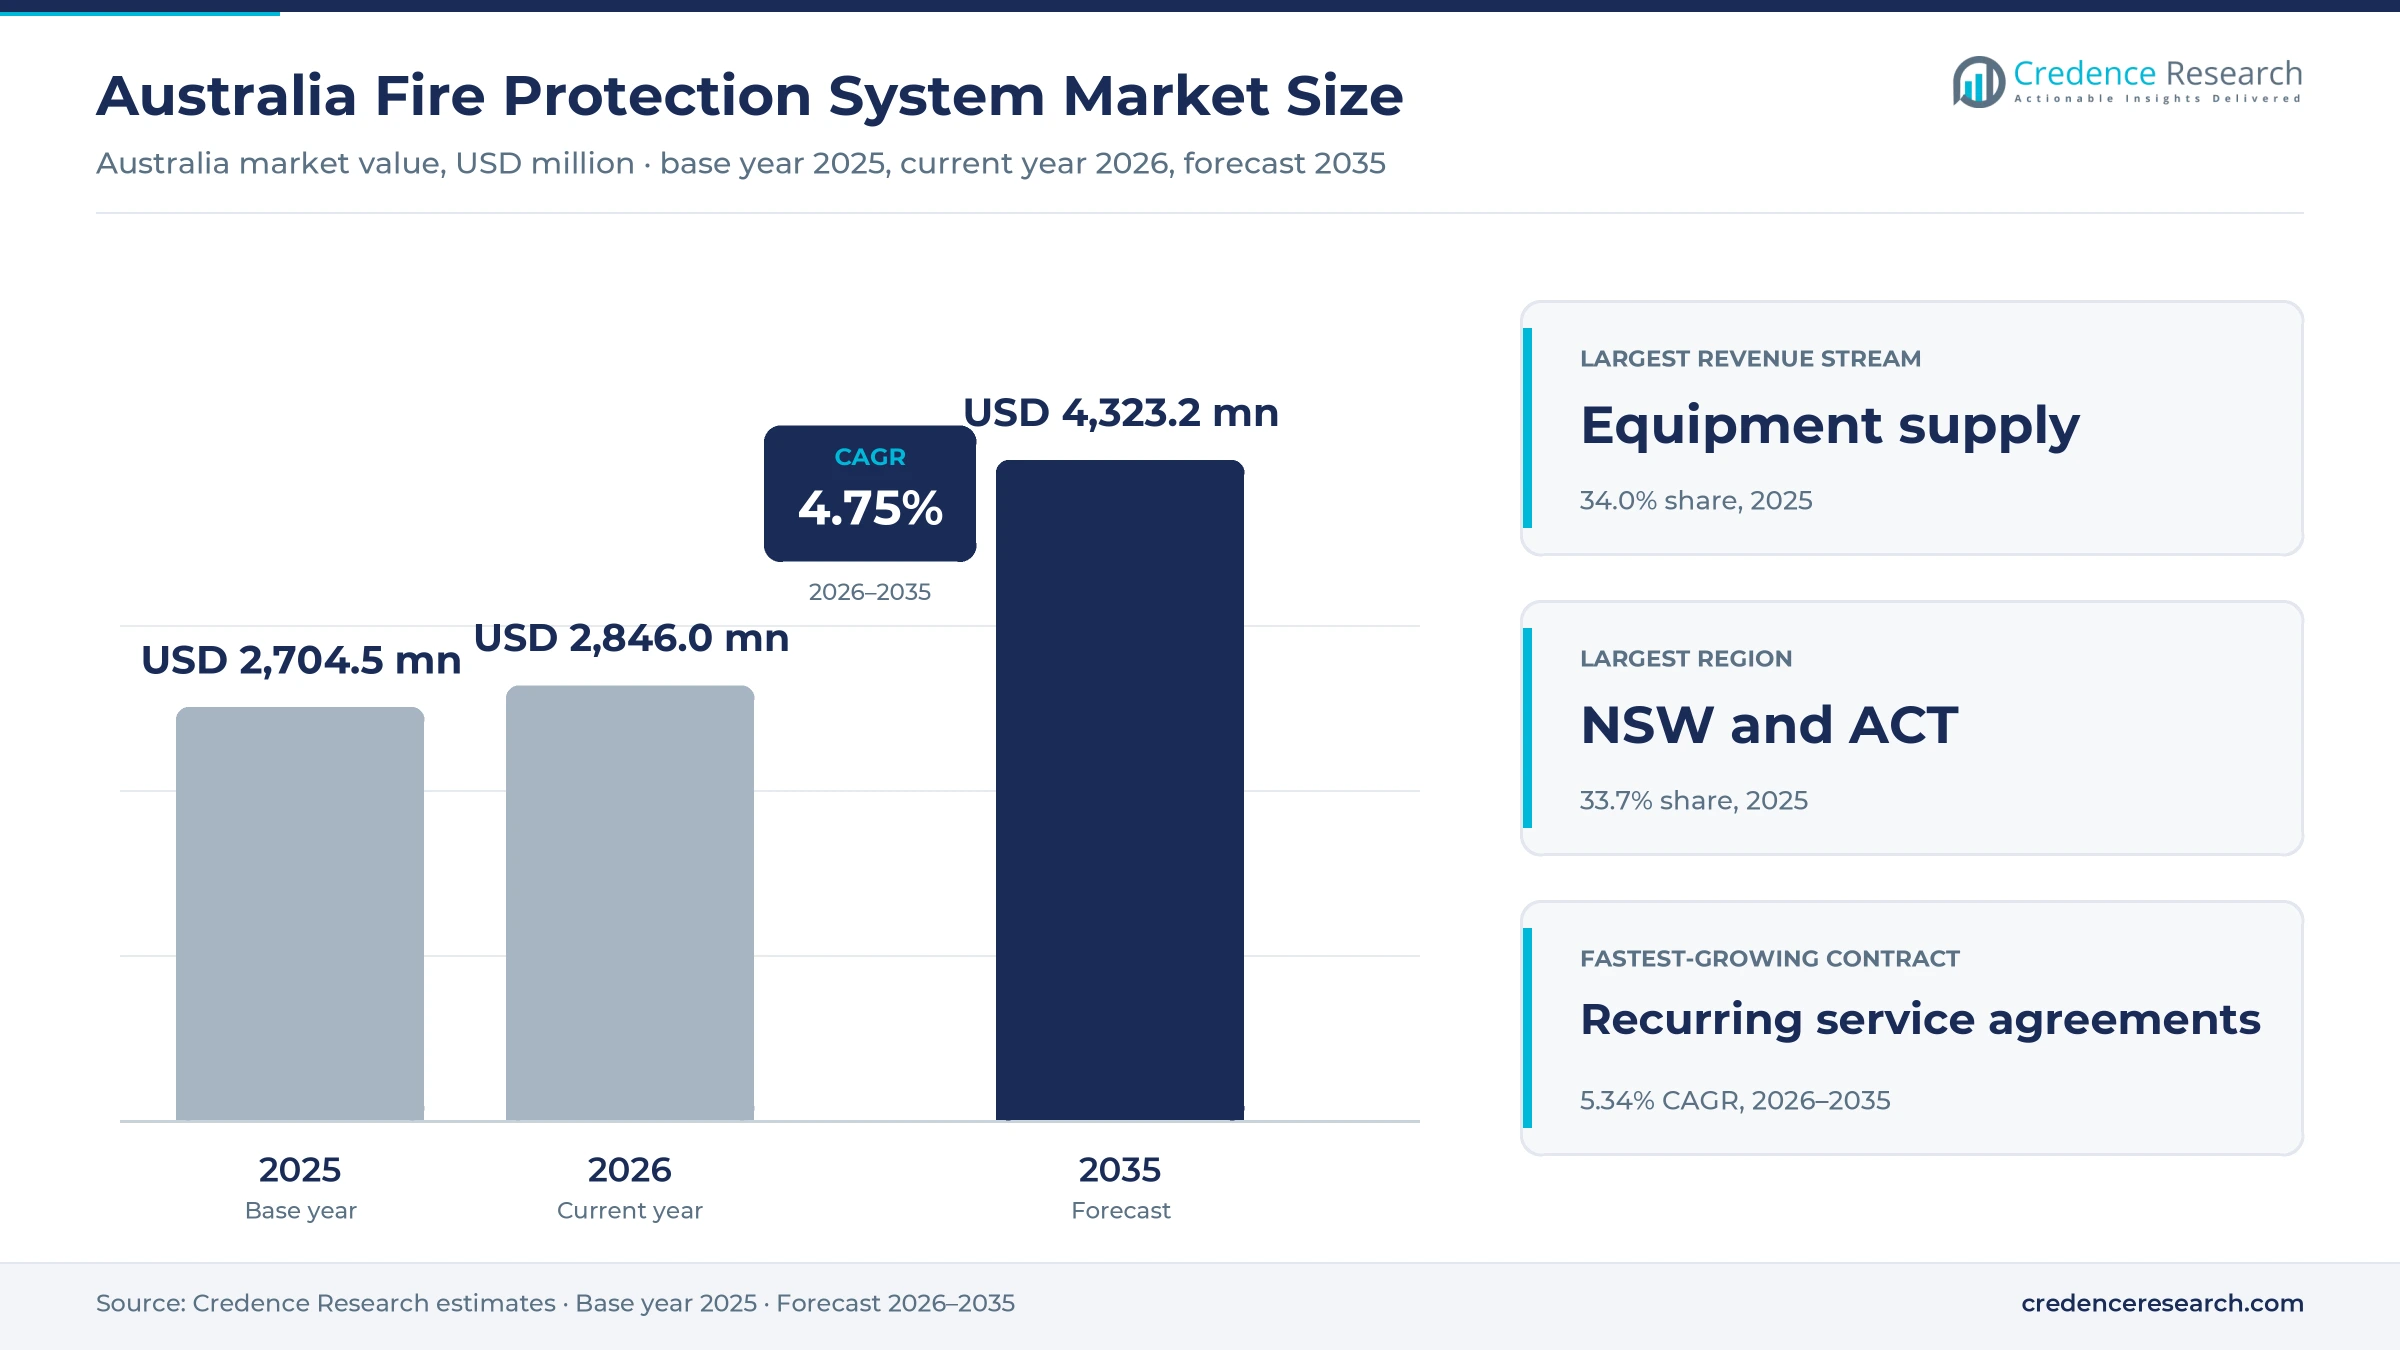
The Australia fire protection system market was valued at USD 2.70 billion in 2025 and is projected to increase from USD 2.85 billion in 2026 to USD 4.32 billion by 2035, registering a CAGR of 4.75% during 2026–2035. Demand comes from building owners that must keep detection, sprinkler, hydrant and emergency lighting systems in working order, and from developers that fit new apartments, offices and industrial sites. New South Wales and the Australian Capital Territory held the largest regional share, 33.7% in 2025, because the zone has the largest building stock and the strictest servicing rules. The same zone is also the fastest-growing region at 5.04% a year, as owners adjust to a new state servicing standard. In turn, AS 1851-2012 became mandatory for existing and new buildings in New South Wales in February 2026, which formalizes routine inspection and testing work across thousands of sites.
Which building safety products and services does the estimate cover?
The estimate measures the value of fire protection equipment and services sold in Australia, including equipment supply, installation and commissioning, maintenance and inspection, and design and engineering. It counts spending by private building owners, construction contractors and public asset owners through direct owner procurement, principal contractor procurement and integrator partner procurement.
The estimate excludes firefighting vehicles, bushfire suppression aircraft, personal protective equipment and fire brigade operations. The value chain runs from detector, panel, valve and sprinkler makers through distributors and specialist contractors to building owners, strata managers, facility managers and the certifiers who sign off compliance each year.
Australia Fire Protection System Market Insights
- The Australia fire protection system market was valued at USD 2.70 billion in 2025 and is projected to reach USD 4.32 billion by 2035, registering a CAGR of 4.75% during 2026–2035.
- New South Wales and the Australian Capital Territory held a 33.7% share of 2025 value, because the zone has the largest building stock.
- Equipment supply led with a 34.0% share of 2025 value, because detectors, panels, sprinklers and valves carry most project spending.
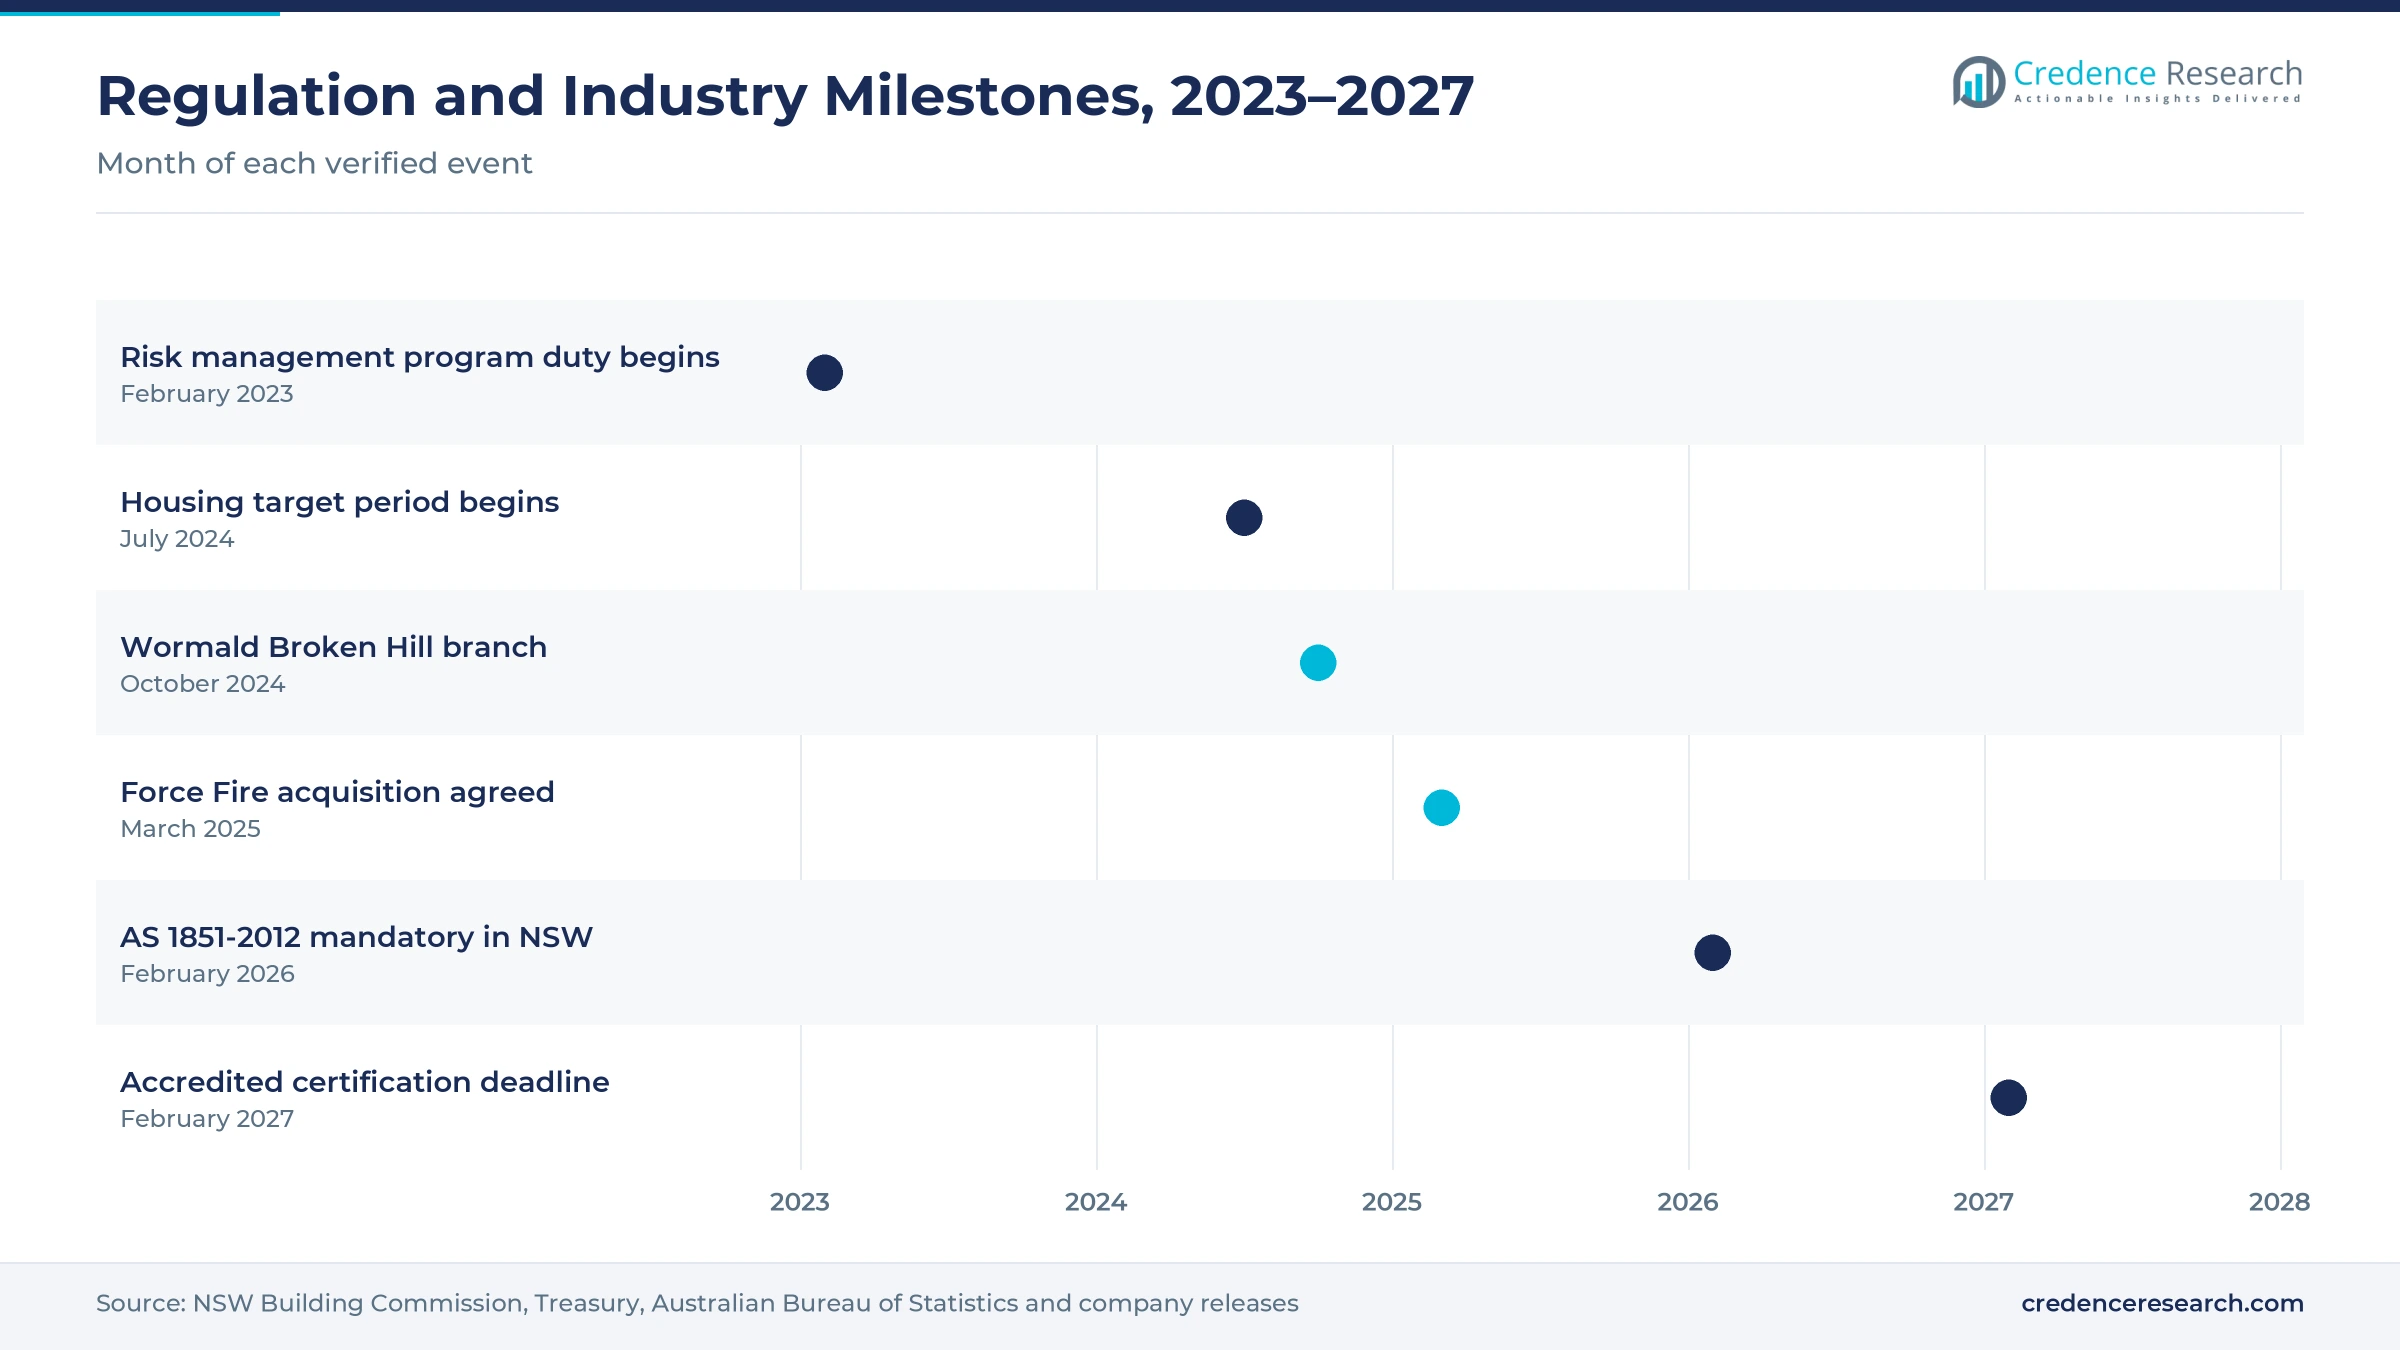
- AS 1851-2012 became mandatory for all new and existing class 1b and class 2 to class 9 buildings in New South Wales from Feb. 13, 2026.
- Recurring service agreements grow fastest at 5.34% a year during 2026–2035, as owners move routine testing onto multiyear contracts.
Equipment supply leads while upkeep work grows fastest
Why does equipment supply lead revenue streams?
Based on revenue stream, the market is categorized into equipment supply, installation and commissioning, maintenance and inspection, and design and engineering. Equipment Supply led with a 34.0% share of 2025 value, because detectors, panels, sprinkler heads and valves form the largest cost in each project. Maintenance and Inspection grows fastest at 5.36% a year, as statutory servicing rules push owners toward regular tests and repairs.
How do commercial and critical sites split demand?
Based on end-use industry, the market is categorized into commercial property, multi-residential property, critical infrastructure and resources and manufacturing. Commercial Property led with a 38.0% share of 2025 value, because offices, retail centers and hospitals hold dense safety systems. Critical Infrastructure grows fastest at 5.33% a year, as data centers, utilities and transport assets add special hazard protection.
Why do private owners buy the most protection?
Based on customer type, the market is categorized into private building owners, construction contractors and public asset owners. Private Building Owners led with a 46.0% share of 2025 value, because owners and strata bodies pay for annual servicing and upgrades. Private Building Owners grow fastest at 5.00% a year, as owners take direct responsibility for compliance under tighter state rules.
How fast are recurring service contracts rising?
Based on contracting model, the market is categorized into fixed-price projects, recurring service agreements and schedule-of-rates work. Fixed-Price Projects led with a 48.0% share of 2025 value, because new buildings and refits are usually tendered as lump-sum packages. Recurring Service Agreements grow fastest at 5.34% a year, as owners lock in monthly, six-monthly and yearly tests with one provider.
| Segment Group | Leading Sub-segment | Share, 2025 | Fastest-growing Sub-segment | CAGR, 2026–2035 |
|---|---|---|---|---|
| By Revenue Stream | Equipment Supply | 34.0% | Maintenance and Inspection | 5.36% |
| By End-Use Industry | Commercial Property | 38.0% | Critical Infrastructure | 5.33% |
| By Customer Type | Private Building Owners | 46.0% | Private Building Owners | 5.00% |
| By Contracting Model | Fixed-Price Projects | 48.0% | Recurring Service Agreements | 5.34% |
Request a Free Sample
Fill in your details and we'll send you a free sample report.
- Sample data tables & charts
- Research methodology
Servicing law, housing and infrastructure lift demand
How does statutory servicing formalization lift demand?
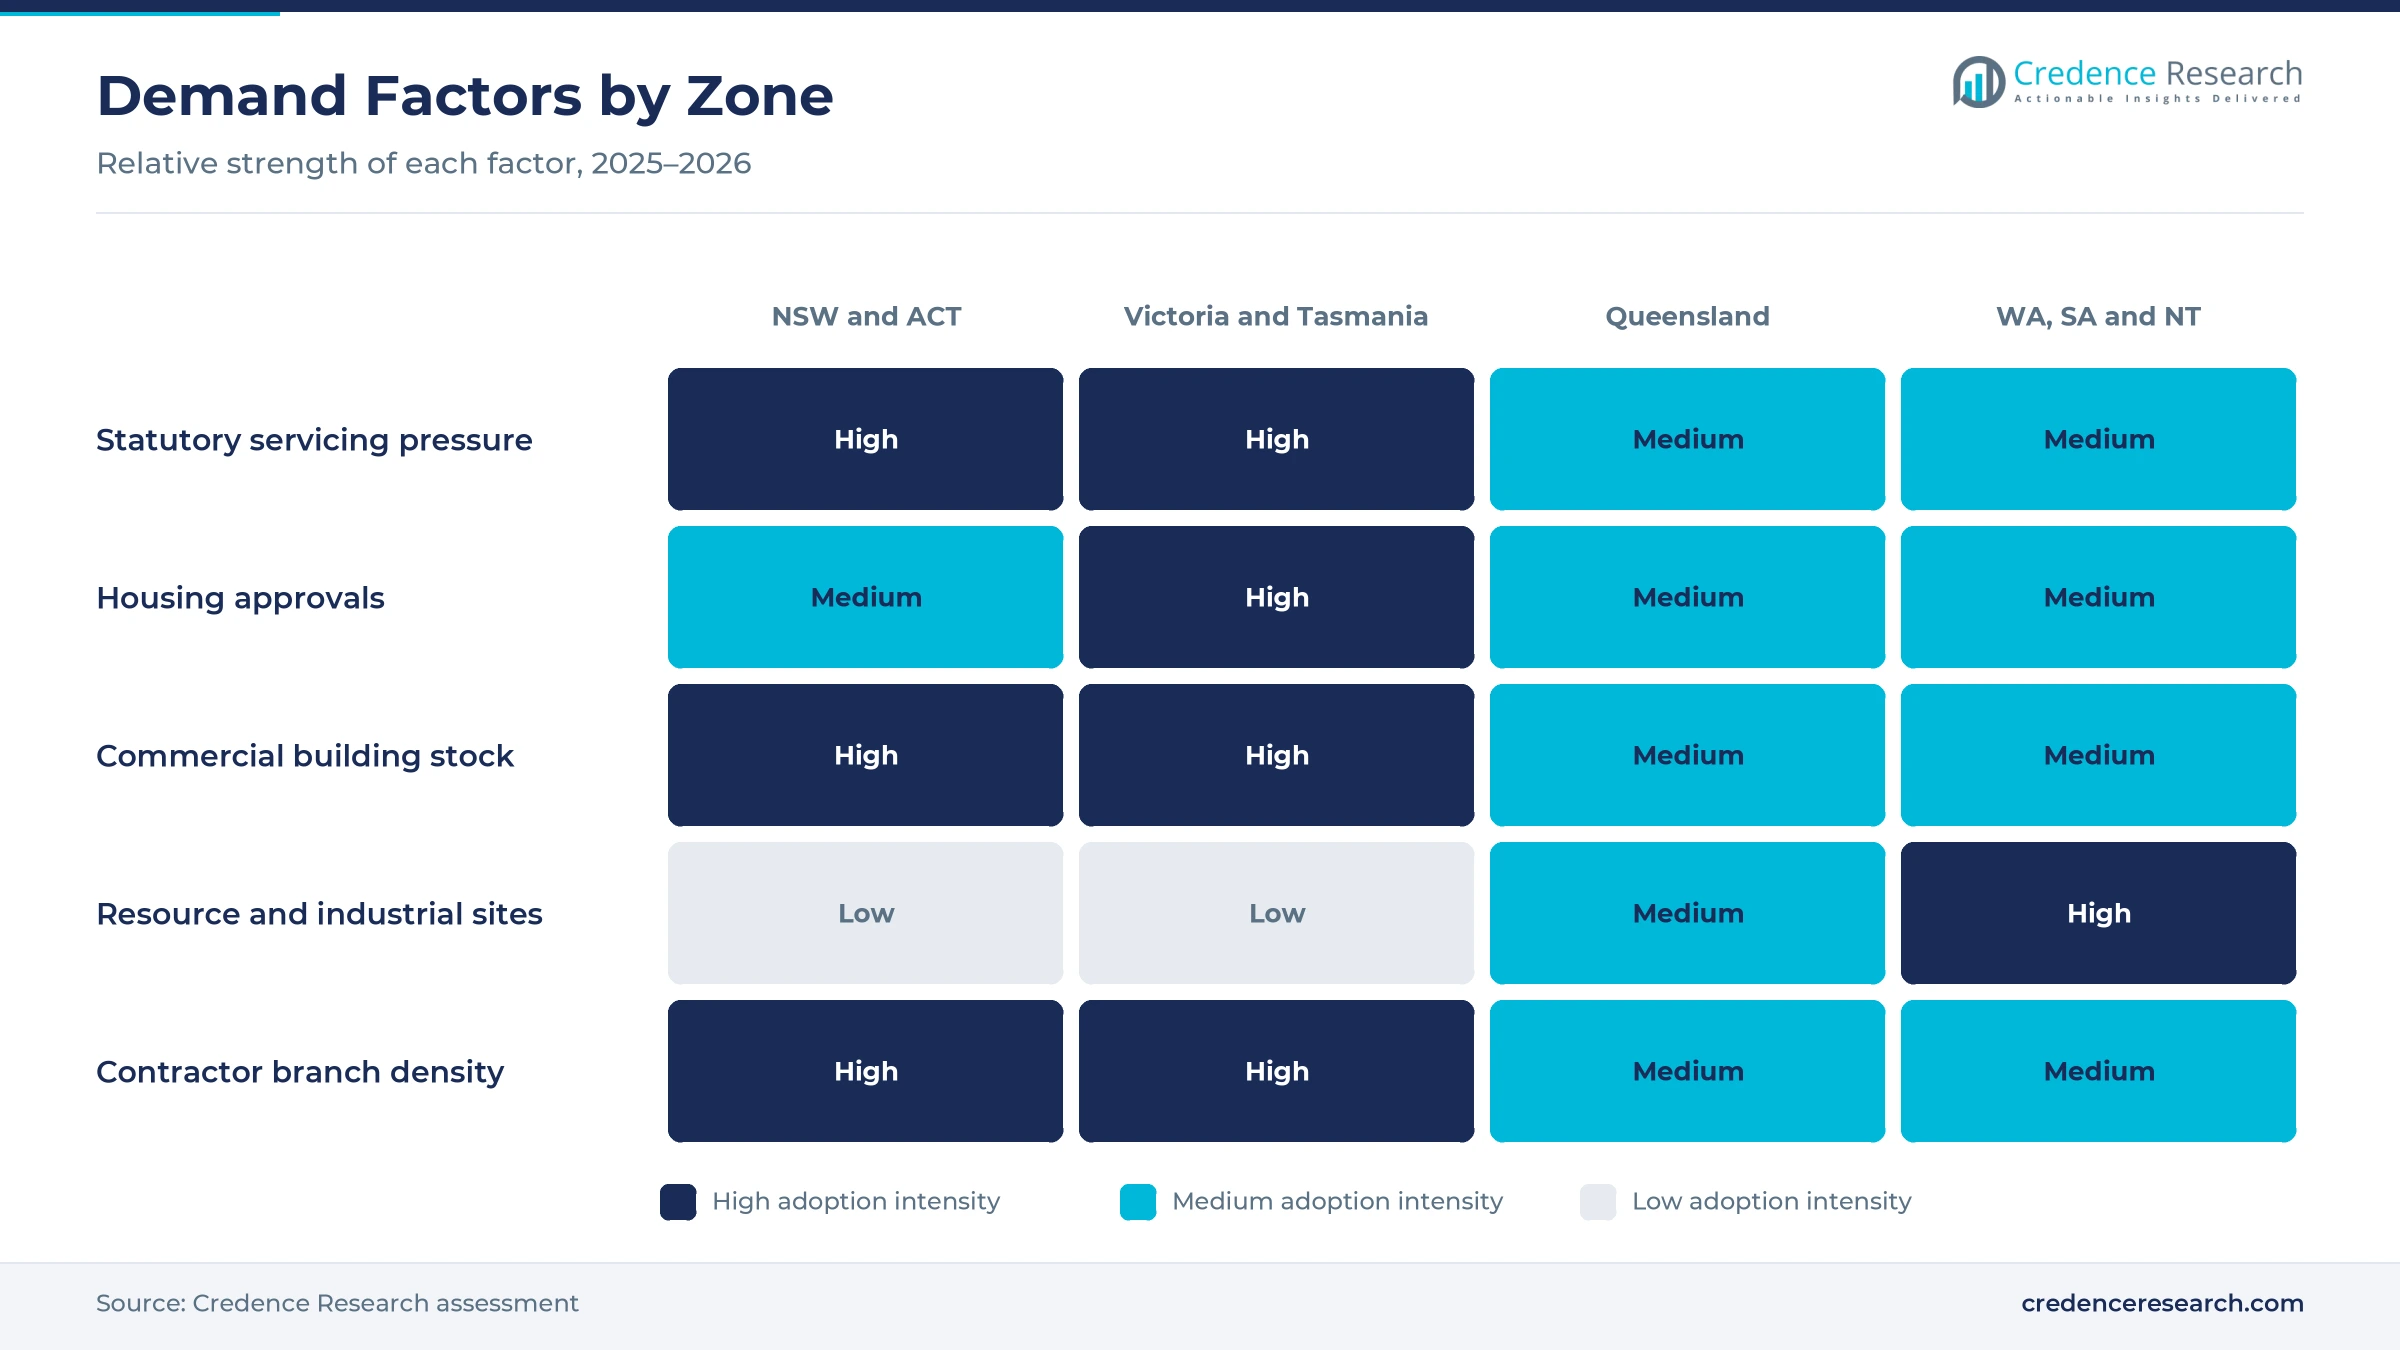
Statutory servicing formalization lifts recurring demand, because building owners must prove that each fire safety measure is inspected and tested to a set standard. AS 1851-2012 became mandatory from Feb. 13, 2026, for all new and existing class 1b and class 2 to class 9 buildings in New South Wales, according to the NSW Building Commission. The rule sits in section 81A of the state fire safety regulation and covers inspection, testing, preventive maintenance and survey. Annual fire safety statements must also be endorsed by an accredited practitioner or a registered certifier. In Victoria, owners must keep essential safety measures in working order under the Building Regulations 2018. As a result, maintenance and inspection grows fastest at 5.36% a year.
Why does housing asset formation add installation work?
Housing asset formation adds installation work, because each new apartment block needs detection, sprinklers, hydrants and emergency lighting before occupation. National Cabinet agreed a target of 1.2 million new well-located homes over five years from July 1, 2024, supported by a $3 billion New Home Bonus, according to the Treasury. NCC 2019 also requires sprinklers in new class 2 and 3 residential buildings with four or more stories and an effective height of 25 meters or less. Dwelling approvals reached 16,953 in August 2026, and private house approvals were 18.4% higher than a year earlier, according to the Australian Bureau of Statistics. In turn, contractors that bid on residential projects gain a steady building construction pipeline.
How does critical infrastructure protection widen demand?
Critical infrastructure protection widens specialist demand, because asset owners must manage physical and natural hazards that could disrupt essential services. The obligation to run a critical infrastructure risk management program for listed asset classes commenced on Feb. 17, 2023, under the Security of Critical Infrastructure Act 2018. Southern Cross Electrical Engineering agreed to buy Force Fire on March 31, 2025, citing wet and dry fire skills for commercial, industrial and data center clients, according to its ASX announcement. Force Fire employs more than 200 full-time staff across New South Wales and Queensland. Fire Protection Technologies, a special hazards design specialist, was acquired by United Safety on Nov. 29, 2023. As a result, critical infrastructure grows fastest at 5.33% a year.
How do population growth and urban density add sites?
Population growth and urban density raise the number of protected buildings, because more residents need more offices, hospitals, schools and apartments. Australia had 27,921,150 residents at March 31, 2026, after annual growth of 392,700 people, or 1.4%, according to national population data. Western Australia had the fastest growth rate of any state, at 2.1%, while Tasmania had the slowest, at 0.6%. Urban residents also made up 87.7% of the population in 2025, according to the World Bank. In turn, dense city building stock keeps commercial property in the lead with 38.0% of 2025 value, and facility management contracts bundle routine safety servicing with other building services.
Digital compliance, regional networks and audits gain ground
How is the shift to digital compliance records changing service?
The shift to digital compliance records is changing service, because owners need clear evidence for each inspection, defect and repair. ARA Fire offers CLARAFY, a fire protection management platform, across its national service network. The company was established in 2001 and employs more than 500 staff in New South Wales, Queensland, South Australia, Victoria and Western Australia. The AS 1851-2012 mandate in New South Wales from February 2026 also makes routine test records central to each annual statement. Planning NSW publishes standard statement templates, and Fire Protection Association Australia keeps a register of accredited practitioners. As a result, recurring service agreements grow at 5.34% a year, because digital logs make multiyear contracts easier to manage and audit.
Why is the rise of regional service networks notable?
The rise of regional service networks is notable, because statutory testing must happen on site in every town that holds a regulated building. Wormald opened a sales and service branch in Broken Hill, in far west New South Wales, in October 2024. The company now has regional offices in every Australian state and more than 40 locations nationwide. Wormald says it has led Australian fire protection for 135 years, while Chubb has operated local branches in Australia since 1896. Force Fire, headquartered in Sydney, also employs more than 200 full-time staff across New South Wales and Queensland. In turn, national contractors with dense branch networks win more portfolio contracts from owners that hold sites in both cities and regional centers.
Can accredited certification open advisory work?
Accredited certification can open advisory work, because owners will need qualified people to certify installed safety measures before a fire safety certificate is issued. From Feb. 13, 2027, or 18 months after an accreditation scheme is approved, owners in New South Wales must use accredited persons for this task. The Fire Protection Accreditation Scheme was developed by Fire Protection Association Australia and approved on July 1, 2020. If no accredited practitioner is reasonably available, owners must get authorization from Building Commission NSW before using another competent person. As a result, design and engineering firms that hold accreditation can sell audits, performance solution reviews and certification work alongside routine alarm equipment upgrades.
Is there room to grow in data centers and resource sites?
Data centers and resource sites offer room to grow, because high-value equipment needs special hazard systems that suit each risk. Force Fire lists commercial and industrial buildings and data centers among its main sectors, with both mechanical wet fire and electrical dry fire skills. Fire Protection Technologies offers independent special hazards design knowledge and has served the industry for more than 25 years. Industry, including construction, also produced 23.9% of Australian gross domestic product in 2025, according to World Bank data. In turn, resources and manufacturing clients buy gas suppression, foam and deluge systems, while data center owners favor early warning detection, clean agent suppression and pre-action sprinklers for server halls.
Skills gaps, price pressure and apartment slowdowns weigh
How do skills shortages slow service delivery?
Skills shortages slow service delivery, because statutory testing needs licensed technicians, sprinkler fitters and accredited practitioners in every region. As a result, contractors face long lead times for regional jobs and higher wage costs in busy city markets. Providers respond with apprenticeships, internal training and accreditation support, which help them keep up with recurring tests and reduce the number of overdue inspections across large commercial, residential and public building portfolios.
Why does price pressure squeeze project margins?
Price pressure squeezes project margins, because fixed-price tenders reward the lowest bid on detection, sprinkler and hydrant packages. In turn, specialist subcontractors carry the risk of rising material and labor costs during long builds. Contractors respond with clearer scopes, early design input and schedule-of-rates terms for variations, which protect margins and reduce disputes with principal contractors at handover, commissioning and defect liability stages of each building project.
How does a slowdown in apartments affect installers?
A slowdown in apartments affects installers, because multi-story residential blocks carry the most sprinkler and detection work per project. Approvals for private dwellings excluding houses fell 21.2% in August 2026 from July, according to national building data. As a result, installers that depend on apartment pipelines face gaps in work. Many respond by moving crews into servicing, refits and commercial projects to keep skilled teams busy until residential approvals recover.
Why do compliance costs strain small owners?
Compliance costs strain small owners, because strata schemes and small commercial landlords must fund regular testing, repairs and annual statements. In turn, some owners delay defect repairs until a council notice or insurance review forces action. Providers respond with fixed annual service plans, staged repair programs and clear defect reports, which help owners budget for compliance and avoid council penalties and insurance problems for buildings that fall behind on statutory servicing.
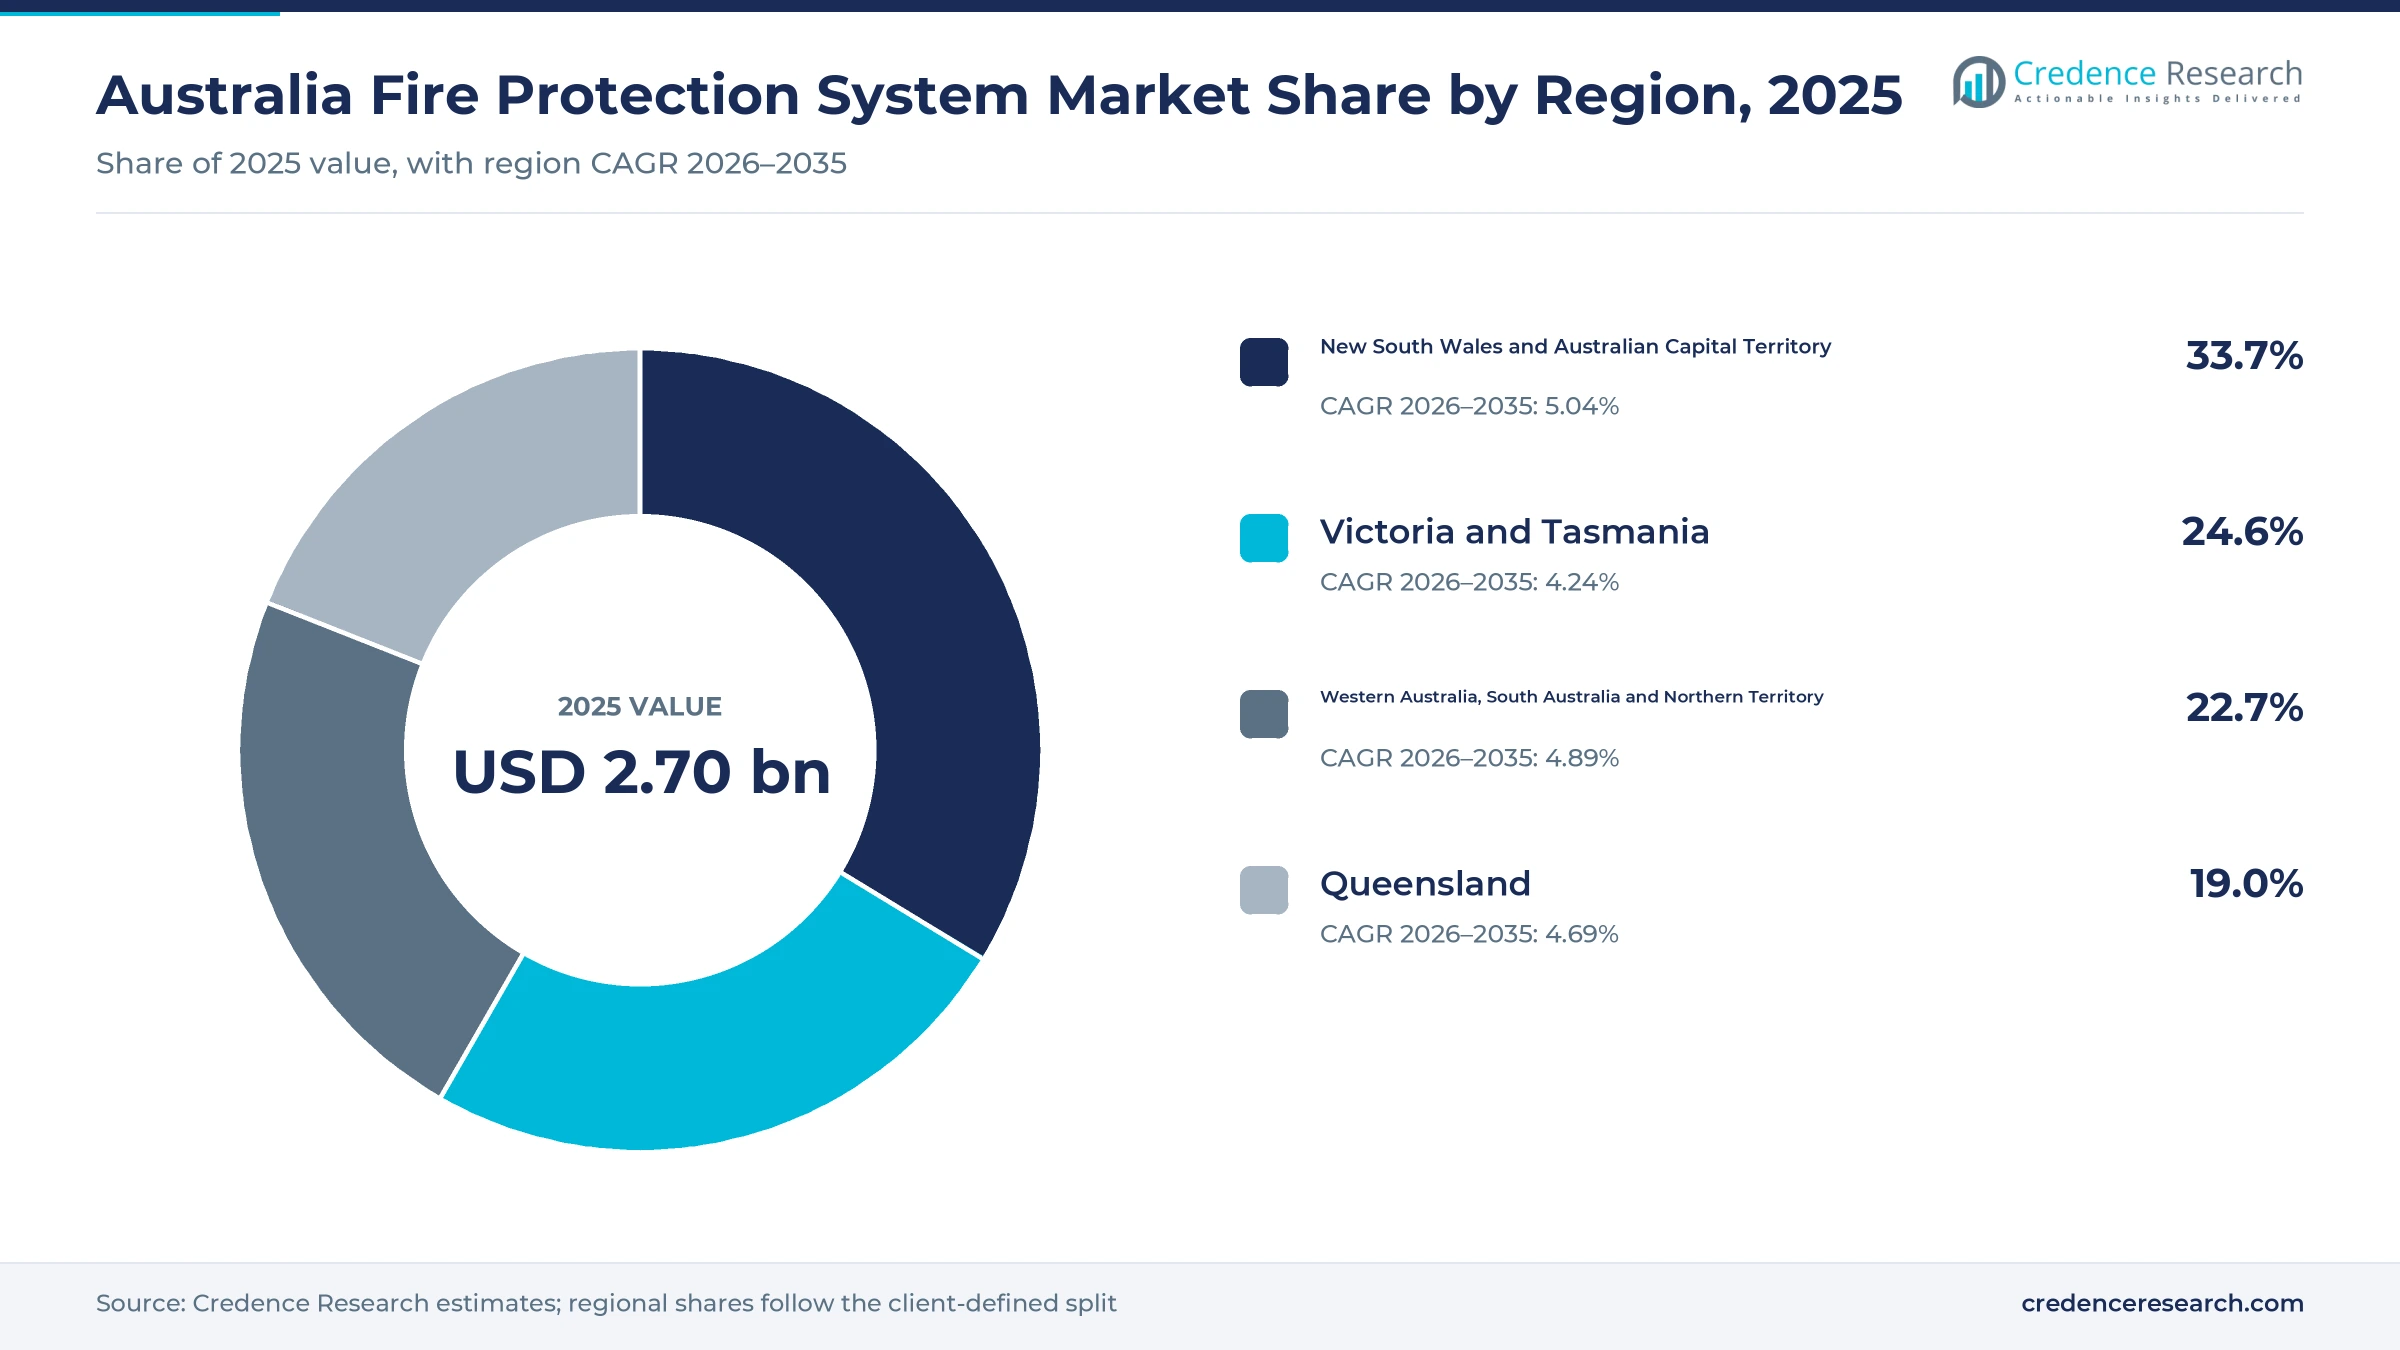
NSW and ACT lead and grow fastest after the AS 1851 mandate
| Region | Value, 2025 (USD billion) | Share, 2025 | CAGR, 2026–2035 |
|---|---|---|---|
| New South Wales and Australian Capital Territory | 0.91 | 33.7% | 5.04% |
| Victoria and Tasmania | 0.67 | 24.6% | 4.24% |
| Western Australia, South Australia and Northern Territory | 0.61 | 22.7% | 4.89% |
| Queensland | 0.51 | 19.0% | 4.69% |
Why do New South Wales and the ACT lead and grow fastest?
New South Wales and the Australian Capital Territory held a 33.7% share of 2025 value and grow fastest at 5.04% a year, because the zone had about 9.16 million residents in March 2026. The new AS 1851-2012 mandate also makes routine servicing a legal duty for existing buildings across the state. As a result, owners in Sydney and Canberra sign more recurring service agreements with accredited providers than owners in any other zone of the country.
How do Victoria and Tasmania support demand?
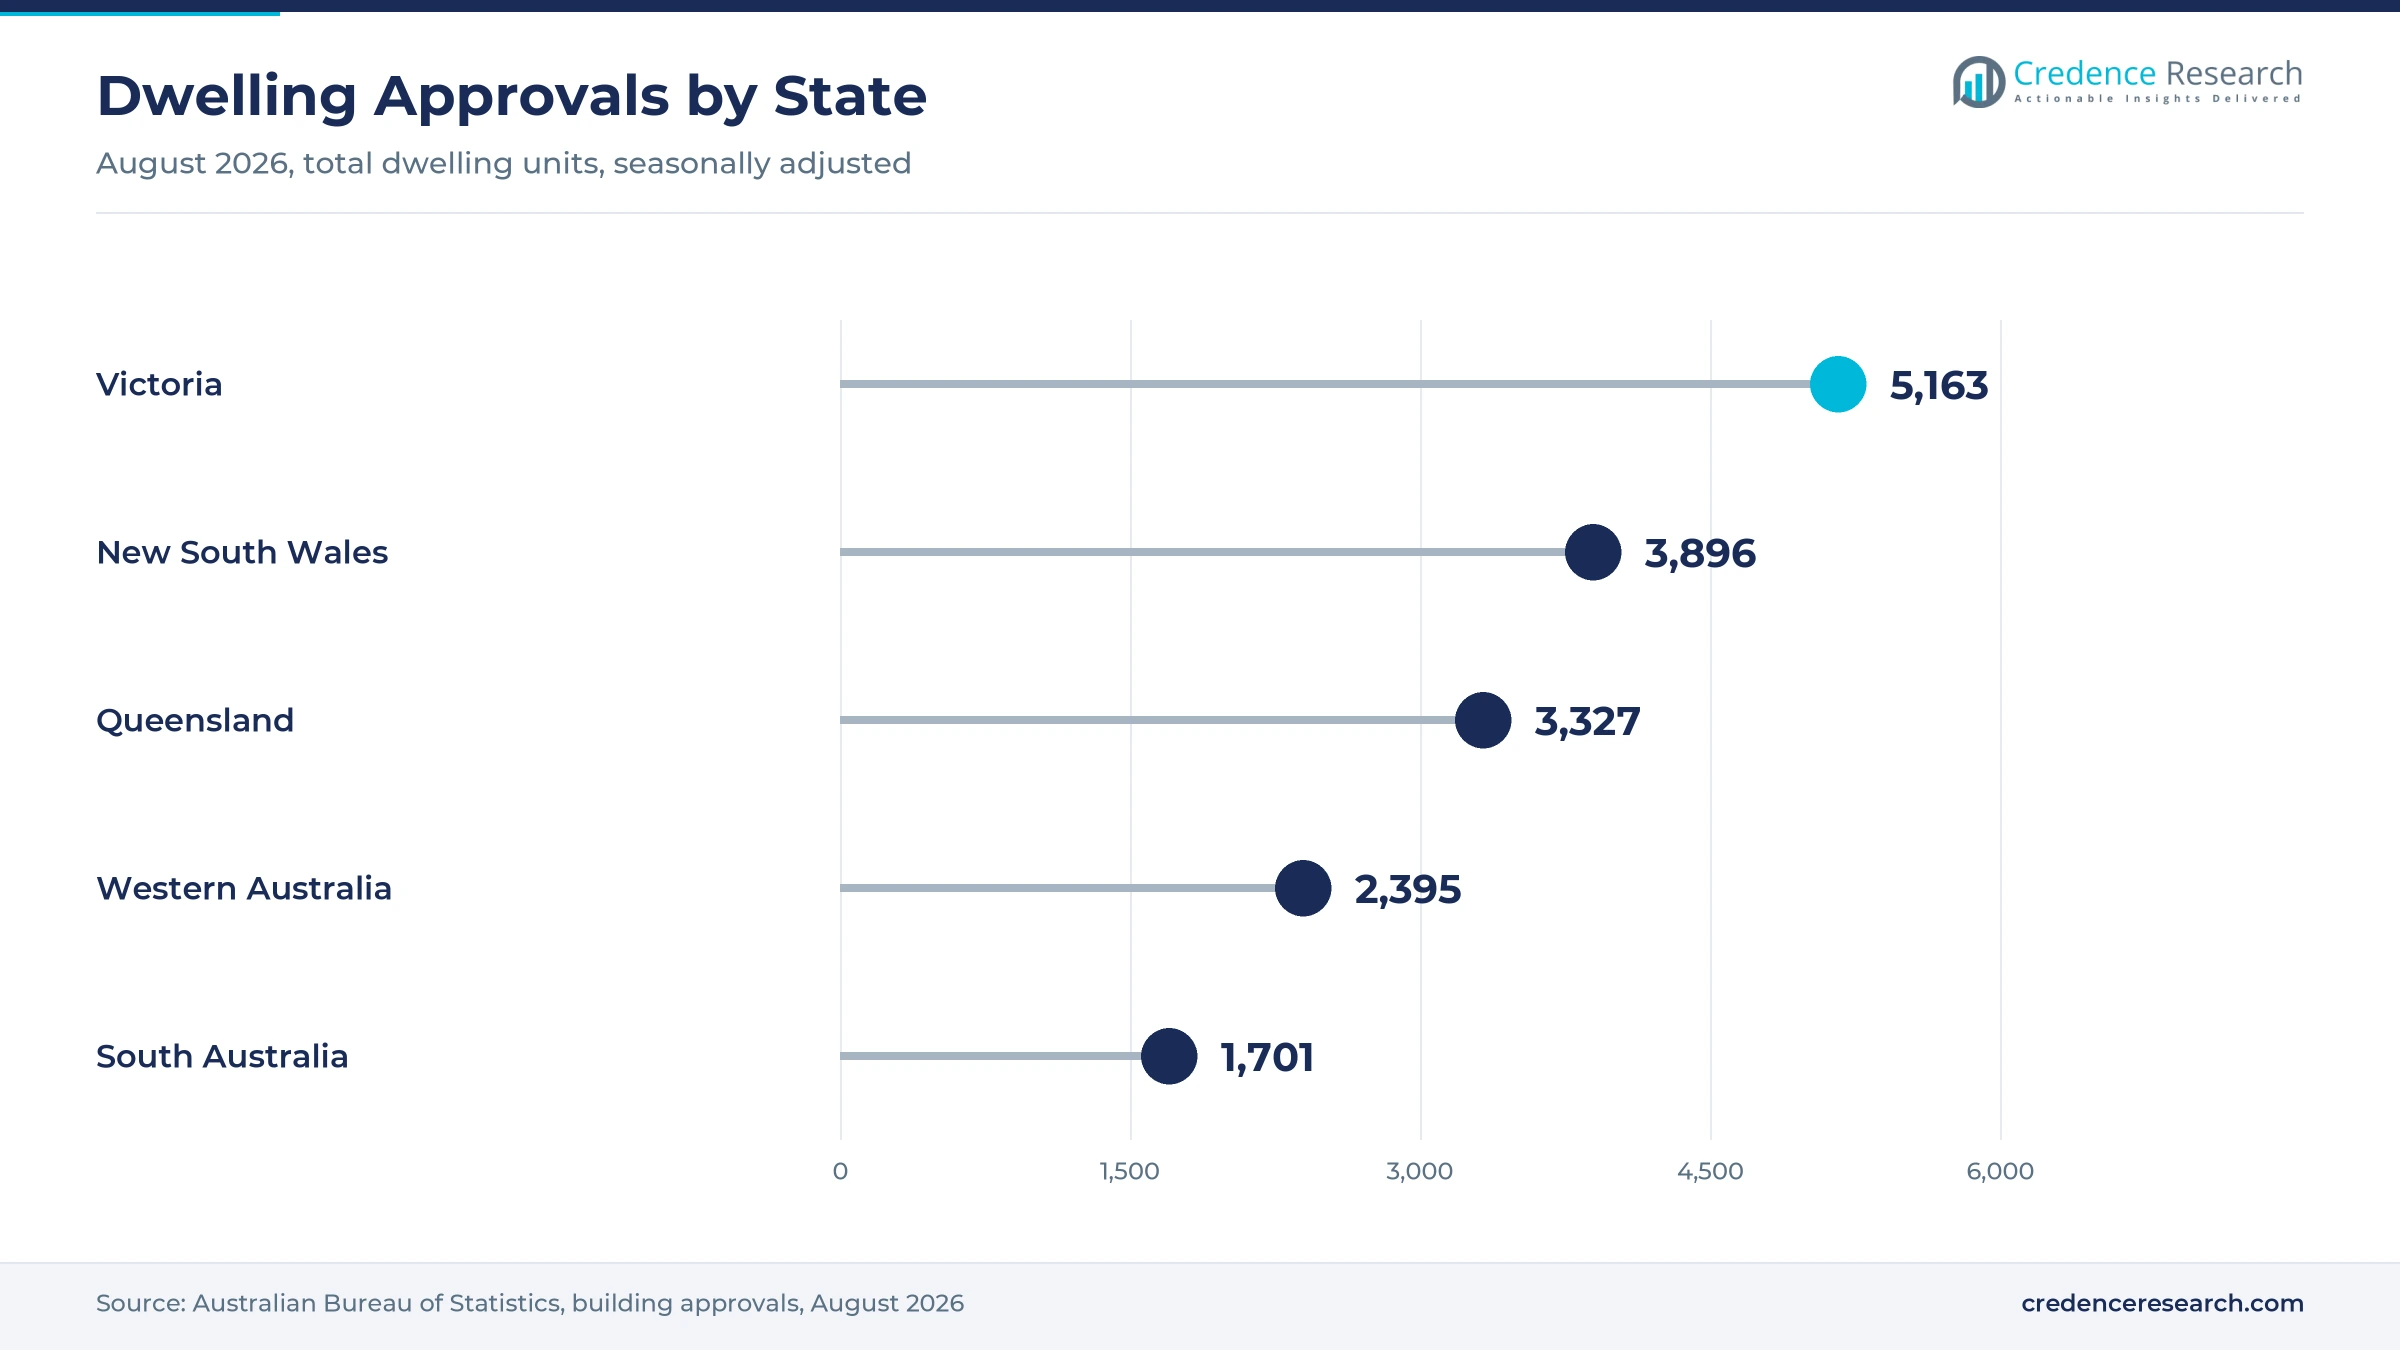
Victoria and Tasmania held a 24.6% share of 2025 value and grow at 4.24% a year, because Melbourne has a large stock of offices, hospitals and apartments under essential safety measure rules. Victoria approved 5,163 dwellings in August 2026, the most of any state that month. However, Tasmania had the slowest population growth of any state, at 0.6%, which limits new building work and keeps servicing of existing stock the main source of demand there.
Why do the western and central states hold a large share?
Western Australia, South Australia and the Northern Territory held a 22.7% share of 2025 value and grow at 4.89% a year, because mines, ports and processing plants need special hazard systems. Western Australia approved 2,395 dwellings in August 2026, and South Australia approved 1,701. In turn, resource and housing projects keep installers busy across Perth, Adelaide, Darwin and regional mining and port centers.
What shapes demand in Queensland?
Queensland held a 19.0% share of 2025 value and grows at 4.69% a year, because the state had about 5.74 million residents in March 2026 after growth of 1.6%. Queensland also approved 3,327 dwellings in August 2026, which adds new installation work in Brisbane and on the coast.
Branch, acquisition and regulation milestones
| Development | Status and market relevance |
|---|---|
| In July 2024, the five-year period for the national target of 1.2 million new well-located homes began. | Supports residential installation work |
| In October 2024, Wormald opened a sales and service branch in Broken Hill, giving it more than 40 locations nationwide. | Widens regional servicing reach |
| In March 2025, Southern Cross Electrical Engineering agreed to acquire Force Fire, a Sydney-based wet and dry fire specialist. | Adds scale in commercial and data center work |
| In February 2026, AS 1851-2012 became mandatory for all new and existing class 1b and class 2 to class 9 buildings in New South Wales. | Formalizes routine servicing demand |
| In September 2026, the Australian Bureau of Statistics reported 16,953 dwelling approvals for August 2026. | Signals a steady housing pipeline |
Detection, water, special hazard and passive layers
- Detection and alarm systems use smoke, heat and flame detectors linked to control panels, which warn occupants and call the fire brigade within seconds.
- Water-based systems include sprinklers, hydrants and hose reels, which control or put out fires and need regular flow and pressure tests.
- Special hazard systems use gas, foam or water mist to protect server rooms, plants and mining equipment where water could cause damage.
- Passive protection covers fire doors, walls and penetration seals, which keep fire and smoke inside one area and protect escape routes.
Need a Custom Version of This Report?
Tailor the scope, geography, or segments to your exact requirements.
- Custom geography or segment scope
- Direct access to our analyst team
National contractors and specialists compete on reach
Competition is led by national service contractors with wide branch networks and by specialist firms that focus on special hazards or single states. ARA Fire employs more than 500 staff across five states and offers its CLARAFY management platform. Wormald has more than 40 locations and opened a Broken Hill branch in 2024, while Chubb has served Australian buildings since 1896. Force Fire, acquired by Southern Cross Electrical Engineering in 2025, offers wet and dry fire work in New South Wales and Queensland. Fire Protection Technologies brings special hazards design skills under United Safety ownership. Rivals compete on response time, accreditation, compliance reporting and price. Because owners now face stricter servicing rules, providers that combine testing, repairs and certification win longer contracts. Manufacturers of detectors, panels and valves sell through these contractors and through integrator partners.
Which companies serve Australian building owners?
| Company | Type | Role in the market |
|---|---|---|
| ARA Group (ARA Fire) | National service contractor | Testing, installation and CLARAFY compliance platform in five states |
| Wormald Australia | National service contractor | More than 40 locations, including a Broken Hill branch opened in 2024 |
| Chubb Fire & Security Australia | National service provider | Fire safety, training and monitoring since 1896 |
| Force Fire | Specialist contractor | Wet and dry fire work in New South Wales and Queensland |
| Fire Protection Technologies | Special hazards specialist | Independent special hazards design and products |
Credence Research view on statutory servicing growth
Credence Research's view is that Australian fire protection spending will grow steadily because state servicing rules now turn routine testing into a fixed legal duty for owners. Equipment supply remains the largest value pool, while maintenance, recurring contracts and critical infrastructure add the fastest growth. New South Wales leads both share and growth after the AS 1851-2012 mandate. Contractors with accredited staff, regional branches and digital records should gain the most, while skills shortages and apartment cycles keep margins under pressure.
How the national building safety estimate was built
The report uses 2025 as the base year on a calendar basis, and market values come from the Credence Research model. That model combines building approvals, population data, state fire safety regulation and company announcements. Segment splits and zone growth rates are Credence Research estimates, while zone shares follow the client-defined split. Sources used are official statistics, government publications, stock exchange announcements and company releases, and no interviews or surveys were used.
Recurring servicing and critical sites carry growth to 2035
The Australia fire protection system market is expected to reach USD 4.32 billion by 2035, a 4.75% CAGR during 2026–2035, as owners fund regular servicing and developers fit new homes and critical sites. Growth should be strongest in maintenance and inspection, recurring service agreements and critical infrastructure, because state rules and risk programs make testing routine. Accredited certification in New South Wales could add audit work from 2027, while skills shortages and slower apartment approvals could slow installation demand.
Frequently Asked Questions
How big is the Australia fire protection system market?
Which revenue stream leads Australian value?
Which region leads the Australian market?
What changed in New South Wales fire safety rules in 2026?
How does housing policy affect fire protection demand?
Which contracting model is growing fastest?
Who are the leading companies in the Australian market?
What are the main challenges for fire protection providers?
Table of Content
Chapter 1 Market Segmentation
- 1.1 Segmentation Framework
- 1.1.1 Product and Service Classification
- 1.1.2 Application and End-Use Classification
- 1.1.3 Technology and Solution Classification
- 1.1.4 Customer and Distribution Channel Classification
- 1.1.5 Geographic Segmentation
- 1.1.6 Market Segment Definitions and Boundaries
- 1.2 By Revenue Stream
- 1.2.1 Equipment Supply
- 1.2.2 Installation and Commissioning
- 1.2.3 Maintenance and Inspection
- 1.2.4 Design and Engineering
- 1.3 By End-Use Industry
- 1.3.1 Commercial Property
- 1.3.2 Multi-Residential Property
- 1.3.3 Critical Infrastructure
- 1.3.4 Resources and Manufacturing
- 1.4 By Customer Type
- 1.4.1 Private Building Owners
- 1.4.2 Construction Contractors
- 1.4.3 Public Asset Owners
- 1.5 By Contracting Model
- 1.5.1 Fixed-Price Projects
- 1.5.2 Recurring Service Agreements
- 1.5.3 Schedule-of-Rates Work
Chapter 2 Introduction
- 2.1 Report Objectives and Scope
- 2.2 Product Definition and Industry Terminology
- 2.3 Market Inclusions and Exclusions
- 2.4 Research Process
- 2.4.1 Primary Research and Expert Interviews
- 2.4.2 Secondary Research and Source Review
- 2.4.3 Top-Down and Bottom-Up Estimation
- 2.4.4 Data Triangulation and Verification
- 2.5 Market Size Measurement Basis
- 2.5.1 2025: USD 2.70 billion → 2035: USD 4.32 billion
- 2.6 Historical and Forecast Reference Periods
- 2.6.1 Historical Period: 2018-2025
- 2.6.2 Base Year: 2025
- 2.6.3 Forecast Period: 2025-2035
- 2.7 Research Assumptions and Limitations
Chapter 3 Executive Summary
- 3.1 Market Snapshot and Key Findings
- 3.2 Base-Year Market Size, 2025
- 3.3 Forecast Market Size, 2035
- 3.4 Revenue and Volume Growth Outlook
- 3.5 Key Demand and Supply Indicators
- 3.6 Leading Market Segments
- 3.7 Fastest-Growing Market Opportunities
- 3.8 Regional Performance Highlights
- 3.9 Technology and Industry Transformation
- 3.10 Competitive Landscape Summary
- 3.11 Analyst View and Strategic Implications
Chapter 4 Australia Fire Protection System Market Trends and Developments
- 4.1 Historical Industry Development, 2018-2025
- 4.2 Recent Market Trends and Developments
- 4.3 Demand and Customer Behavior Trends
- 4.4 Technology and Product Innovation
- 4.5 Artificial Intelligence, Automation and Digitalization
- 4.6 Local Manufacturing and Supply Chain Realignment
- 4.7 Industry Partnerships, Mergers and Acquisitions
- 4.8 Sustainability and Circular Economy Developments
- 4.9 Government and Private Sector Investment Trends
- 4.10 Emerging Business Models and Commercialization
- 4.11 Industry Developments and Announcements
Chapter 5 Australia Fire Protection System Market Production, Supply and Demand Analysis
- 5.1 Demand Trend and Consumption Analysis, 2018-2025
- 5.2 Demand Forecast, 2025-2035
- 5.3 Production and Output Trend, 2018-2025
- 5.4 Production and Output Forecast, 2025-2035
- 5.5 Installed Capacity and Capacity Utilization
- 5.6 Company-Wise Production Plants and Statistics
- 5.6.1 Installed Production Capacity
- 5.6.2 Actual Production
- 5.6.3 Planned Capacity and Expansion Targets
- 5.7 Supply Chain Structure and Procurement Trends
- 5.8 Supply-Demand Gap and Bottlenecks
- 5.9 Import Dependence and Sourcing Structure
- 5.10 Contract Manufacturing and Outsourcing
- 5.11 Regional Supply and Demand Concentration
Chapter 6 Australia Fire Protection System Market Pricing Analysis
- 6.1 Pricing Structure and Measurement
- 6.2 Historical Pricing Trends, 2018-2025
- 6.3 Pricing Outlook, 2025-2035
- 6.4 Average Selling Price and Unit Economics
- 6.5 Pricing by Product and Market Segment
- 6.6 Geographic Pricing Differences
- 6.7 Key Input, Energy, Labor and Logistics Costs
- 6.8 Contract Pricing and Purchasing Models
- 6.9 Pricing Sensitivity and Competitive Positioning
- 6.10 Price, Margin and Profitability Implications
Chapter 7 Australia Fire Protection System Market Dynamics
- 7.1 Market Growth Drivers
- 7.1.1 Demand-Side Drivers
- 7.1.2 Technology and Innovation Drivers
- 7.1.3 Infrastructure and Investment Drivers
- 7.1.4 Regulatory and Policy Drivers
- 7.2 Market Restraints
- 7.2.1 Cost and Affordability Constraints
- 7.2.2 Technology and Adoption Barriers
- 7.2.3 Supply Chain and Operational Constraints
- 7.3 Market Challenges
- 7.3.1 Competitive Pressure and Margin Erosion
- 7.3.2 Skills, Infrastructure and Implementation Gaps
- 7.4 Emerging Market Opportunities
- 7.5 Market Dynamics Impact and Time-Horizon Assessment
Chapter 8 Australia Fire Protection System Value Chain Analysis
- 8.1 Industry Value Chain Overview
- 8.2 Upstream Suppliers and Critical Inputs
- 8.3 Technology and Component Providers
- 8.4 Manufacturing or Service Delivery
- 8.5 Distribution, Channel Partners and Integrators
- 8.6 Downstream Applications and End Users
- 8.7 Value Addition and Profit Pools
- 8.8 Vertical Integration and Outsourcing
- 8.9 Supplier Concentration and Risk
- 8.10 Supply Chain Localization and Resilience
Chapter 9 Australia Fire Protection System Market Regulations and Policies
- 9.1 Relevant Laws, Standards and Compliance Frameworks
- 9.2 Product, Service, Safety and Quality Requirements
- 9.3 Government Policies, Incentives and Subsidies
- 9.4 Imports, Exports and Trade Barriers
- 9.5 Public Procurement and Local Content Requirements
- 9.6 Environmental and Sustainability Compliance
- 9.7 Upcoming Policy Changes and Market Implications
Chapter 10 Australia Fire Protection System Market Hotspots and Opportunities
- 10.1 Market Opportunity Mapping and Growth Hotspots
- 10.2 High-Growth Applications and Customer Groups
- 10.3 Underserved Markets and White-Space Opportunities
- 10.4 Emerging Technology and Product Opportunities
- 10.5 New Capacity and Investment Hotspots
- 10.6 Market Entry and Expansion Opportunities
- 10.7 Distribution and Partnership Opportunities
- 10.8 Near-Term and Long-Term Commercial Potential
- 10.9 Opportunity Attractiveness and Execution Risks
Chapter 11 Australia Fire Protection System Market Outlook, 2025-2035
- 11.1 Market Size and Analysis
- 11.1.1 Revenue (Market Measurement: 2025: USD 2.70 billion → 2035: USD 4.32 billion)
- 11.1.2 Market Volume and Quantity Sold
- 11.1.3 Historical Market Size, 2018-2025
- 11.1.4 Base-Year Market Size, 2025
- 11.2 Market Forecast, 2025-2035
- 11.2.1 Revenue Forecast to 2035
- 11.2.2 Volume Forecast to 2035
- 11.2.3 CAGR and Year-on-Year Growth
- 11.2.4 Incremental Revenue Opportunity
- 11.3 Forecast Assumptions and Scenario Analysis
- 11.3.1 Base-Case Forecast
- 11.3.2 Optimistic and Conservative Scenarios
- 11.3.3 Technology, Pricing and Policy Sensitivities
- 11.4 Market Attractiveness and Growth Outlook
Chapter 12 Australia Fire Protection System Market Segmentation and Outlook
- 12.1 Segmentation Summary and Market Shares, 2025
- 12.2 Largest and Fastest-Growing Segments
- 12.3 By Revenue Stream - Market Size and Forecast, 2025-2035
- 12.3.1 Segment Definition and Scope
- 12.3.2 Historical Market Size, 2018-2025
- 12.3.3 Revenue Forecast, 2025-2035
- 12.3.4 Volume Forecast, 2025-2035
- 12.3.5 Base-Year Market Share, 2025
- 12.3.6 Segment CAGR and Growth Drivers
- 12.3.7 Subsegment Market Size and Forecast
- 12.3.7.1 Equipment Supply
- 12.3.7.2 Installation and Commissioning
- 12.3.7.3 Maintenance and Inspection
- 12.3.7.4 Design and Engineering
- 12.3.8 Subsegment Pricing and Adoption Trends
- 12.3.9 Leading Suppliers and Competition
- 12.3.10 Regional Demand and Opportunities
- 12.4 By End-Use Industry - Market Size and Forecast, 2025-2035
- 12.4.1 Segment Definition and Scope
- 12.4.2 Historical Market Size, 2018-2025
- 12.4.3 Revenue Forecast, 2025-2035
- 12.4.4 Volume Forecast, 2025-2035
- 12.4.5 Base-Year Market Share, 2025
- 12.4.6 Segment CAGR and Growth Drivers
- 12.4.7 Subsegment Market Size and Forecast
- 12.4.7.1 Commercial Property
- 12.4.7.2 Multi-Residential Property
- 12.4.7.3 Critical Infrastructure
- 12.4.7.4 Resources and Manufacturing
- 12.4.8 Subsegment Pricing and Adoption Trends
- 12.4.9 Leading Suppliers and Competition
- 12.4.10 Regional Demand and Opportunities
- 12.5 By Customer Type - Market Size and Forecast, 2025-2035
- 12.5.1 Segment Definition and Scope
- 12.5.2 Historical Market Size, 2018-2025
- 12.5.3 Revenue Forecast, 2025-2035
- 12.5.4 Volume Forecast, 2025-2035
- 12.5.5 Base-Year Market Share, 2025
- 12.5.6 Segment CAGR and Growth Drivers
- 12.5.7 Subsegment Market Size and Forecast
- 12.5.7.1 Private Building Owners
- 12.5.7.2 Construction Contractors
- 12.5.7.3 Public Asset Owners
- 12.5.8 Subsegment Pricing and Adoption Trends
- 12.5.9 Leading Suppliers and Competition
- 12.5.10 Regional Demand and Opportunities
- 12.6 By Contracting Model - Market Size and Forecast, 2025-2035
- 12.6.1 Segment Definition and Scope
- 12.6.2 Historical Market Size, 2018-2025
- 12.6.3 Revenue Forecast, 2025-2035
- 12.6.4 Volume Forecast, 2025-2035
- 12.6.5 Base-Year Market Share, 2025
- 12.6.6 Segment CAGR and Growth Drivers
- 12.6.7 Subsegment Market Size and Forecast
- 12.6.7.1 Fixed-Price Projects
- 12.6.7.2 Recurring Service Agreements
- 12.6.7.3 Schedule-of-Rates Work
- 12.6.8 Subsegment Pricing and Adoption Trends
- 12.6.9 Leading Suppliers and Competition
- 12.6.10 Regional Demand and Opportunities
- 12.7 Segment Growth Comparison
- 12.8 Segment Attractiveness and Priority Matrix
Chapter 13 Australia Fire Protection System End-Use and Application Market Outlook
- 13.1 End-Use Industry and Customer Demand Structure
- 13.2 Leading Applications and Customer Groups
- 13.3 End-Use Market Size, Share and Forecast
- 13.4 Major End-Use Industry Deep Dives
- 13.4.1 Customer Requirements and Use Cases
- 13.4.2 Demand and Replacement Cycles
- 13.4.3 Technical and Regulatory Considerations
- 13.4.4 Purchasing and Procurement Models
- 13.4.5 Leading Vendors and Distribution Channels
- 13.4.6 Forecast and Commercial Opportunities
- 13.5 Emerging Applications and Cross-Segment Demand
- 13.6 End-Use Industry Investment Priorities
Chapter 14 Australia Fire Protection System Geographic Market Outlook, 2025-2035
- 14.1 Domestic Market Distribution and Demand Clusters
- 14.2 State- or Province-Wise Market Size and Forecast, 2025-2035
- 14.3 City and Metropolitan Market Outlook
- 14.4 Industrial, Manufacturing and Commercial Clusters
- 14.5 Geographic Concentration of Key End Users
- 14.6 Local Pricing and Purchasing Differences
- 14.7 Domestic Production Facilities and Capacity Map
- 14.8 Local Infrastructure and Project Pipeline
- 14.9 State-Level Policy and Incentive Differences
- 14.10 Subnational Investment Hotspots and Opportunities
- 14.11 Distribution and Logistics Networks
- 14.12 Domestic Competitive Footprint
Chapter 15 Australia Fire Protection System Technology, Innovation and Sustainability Outlook
- 15.1 Technology Landscape and Maturity
- 15.2 Product, Process and Service Innovation
- 15.3 AI, Automation and Digital Tools in the Industry
- 15.4 Technology Adoption and Performance Benchmarking
- 15.5 Innovation Pipeline and R&D Investment
- 15.6 Patent and Intellectual Property Trends
- 15.7 Energy Efficiency and Resource Management
- 15.8 Sustainability, Recycling and Circularity
- 15.9 Technology Roadmap, 2025-2035
- 15.10 Risks of Obsolescence and Technology Substitution
Chapter 16 Australia Fire Protection System Market Key Strategic Imperatives
- 16.1 Growth and Market Entry Priorities
- 16.2 High-Return Products and Segments
- 16.3 Pricing, Profitability and Cost Optimization
- 16.4 Technology Investment and Product Differentiation
- 16.5 Supply Chain Localization and Resilience
- 16.6 Distribution and Customer Acquisition
- 16.7 Partnership, Acquisition and Capacity Strategy
- 16.8 Regional Expansion Priorities
- 16.9 Short-, Medium- and Long-Term Actions
Chapter 17 Competition Outlook
- 17.1 Industry Competition Characteristics
- 17.2 Market Structure and Concentration
- 17.3 Market Share and Competitive Positioning, 2025
- 17.4 Company-Wise Revenue and Product Benchmarking
- 17.5 Production and Service Capacity Benchmarking
- 17.6 Technology, Pricing and Differentiation
- 17.7 Regional Footprint and Distribution Strength
- 17.8 Mergers, Acquisitions and Strategic Alliances
- 17.9 New Entrants and Competitive Threats
- 17.10 Porter's Five Forces and Industry Attractiveness
- 17.11 Competitive Outlook, 2025-2035
Chapter 18 Company Profiles
- 18.1 Company Coverage and Selection Criteria
- 18.2 ARA Group (ARA Fire)
- 18.2.1 Business Description
- 18.2.2 Company Ownership and Geographic Presence
- 18.2.3 Product and Service Portfolio
- 18.2.4 Manufacturing and Operating Footprint
- 18.2.5 Production Capacity and Expansion Plans
- 18.2.6 Financial Performance and Investment
- 18.2.7 Market Share and Competitive Position
- 18.2.8 Technology and Innovation Capabilities
- 18.2.9 Strategic Alliances or Partnerships
- 18.2.10 Recent Developments
- 18.2.11 Growth Strategy and Outlook
- 18.3 Wormald Australia
- 18.4 Chubb Fire & Security Australia
- 18.5 Johnson Controls Australia
- 18.6 Siemens Australia
- 18.7 Honeywell Australia (NOTIFIER)
- 18.8 Ampac
- 18.9 Fire Protection Technologies
- 18.10 Force Fire
- 18.11 Walker Fire Protection
- 18.12 Other Relevant Market Participants
Note: Every listed company is profiled on the structure shown under the first company. The company list is preliminary and may change based on research findings, market developments, data availability and client requirements.
Chapter 19 Disclaimer
- 19.1 Research and Forecast Disclaimer
- 19.2 Data Source and Estimation Limitations
Note: The depth of individual sections depends on data availability for this market. Volume, capacity, trade and other unit-based metrics are included where applicable.

