
Aging opening spans keep upkeep spending steady
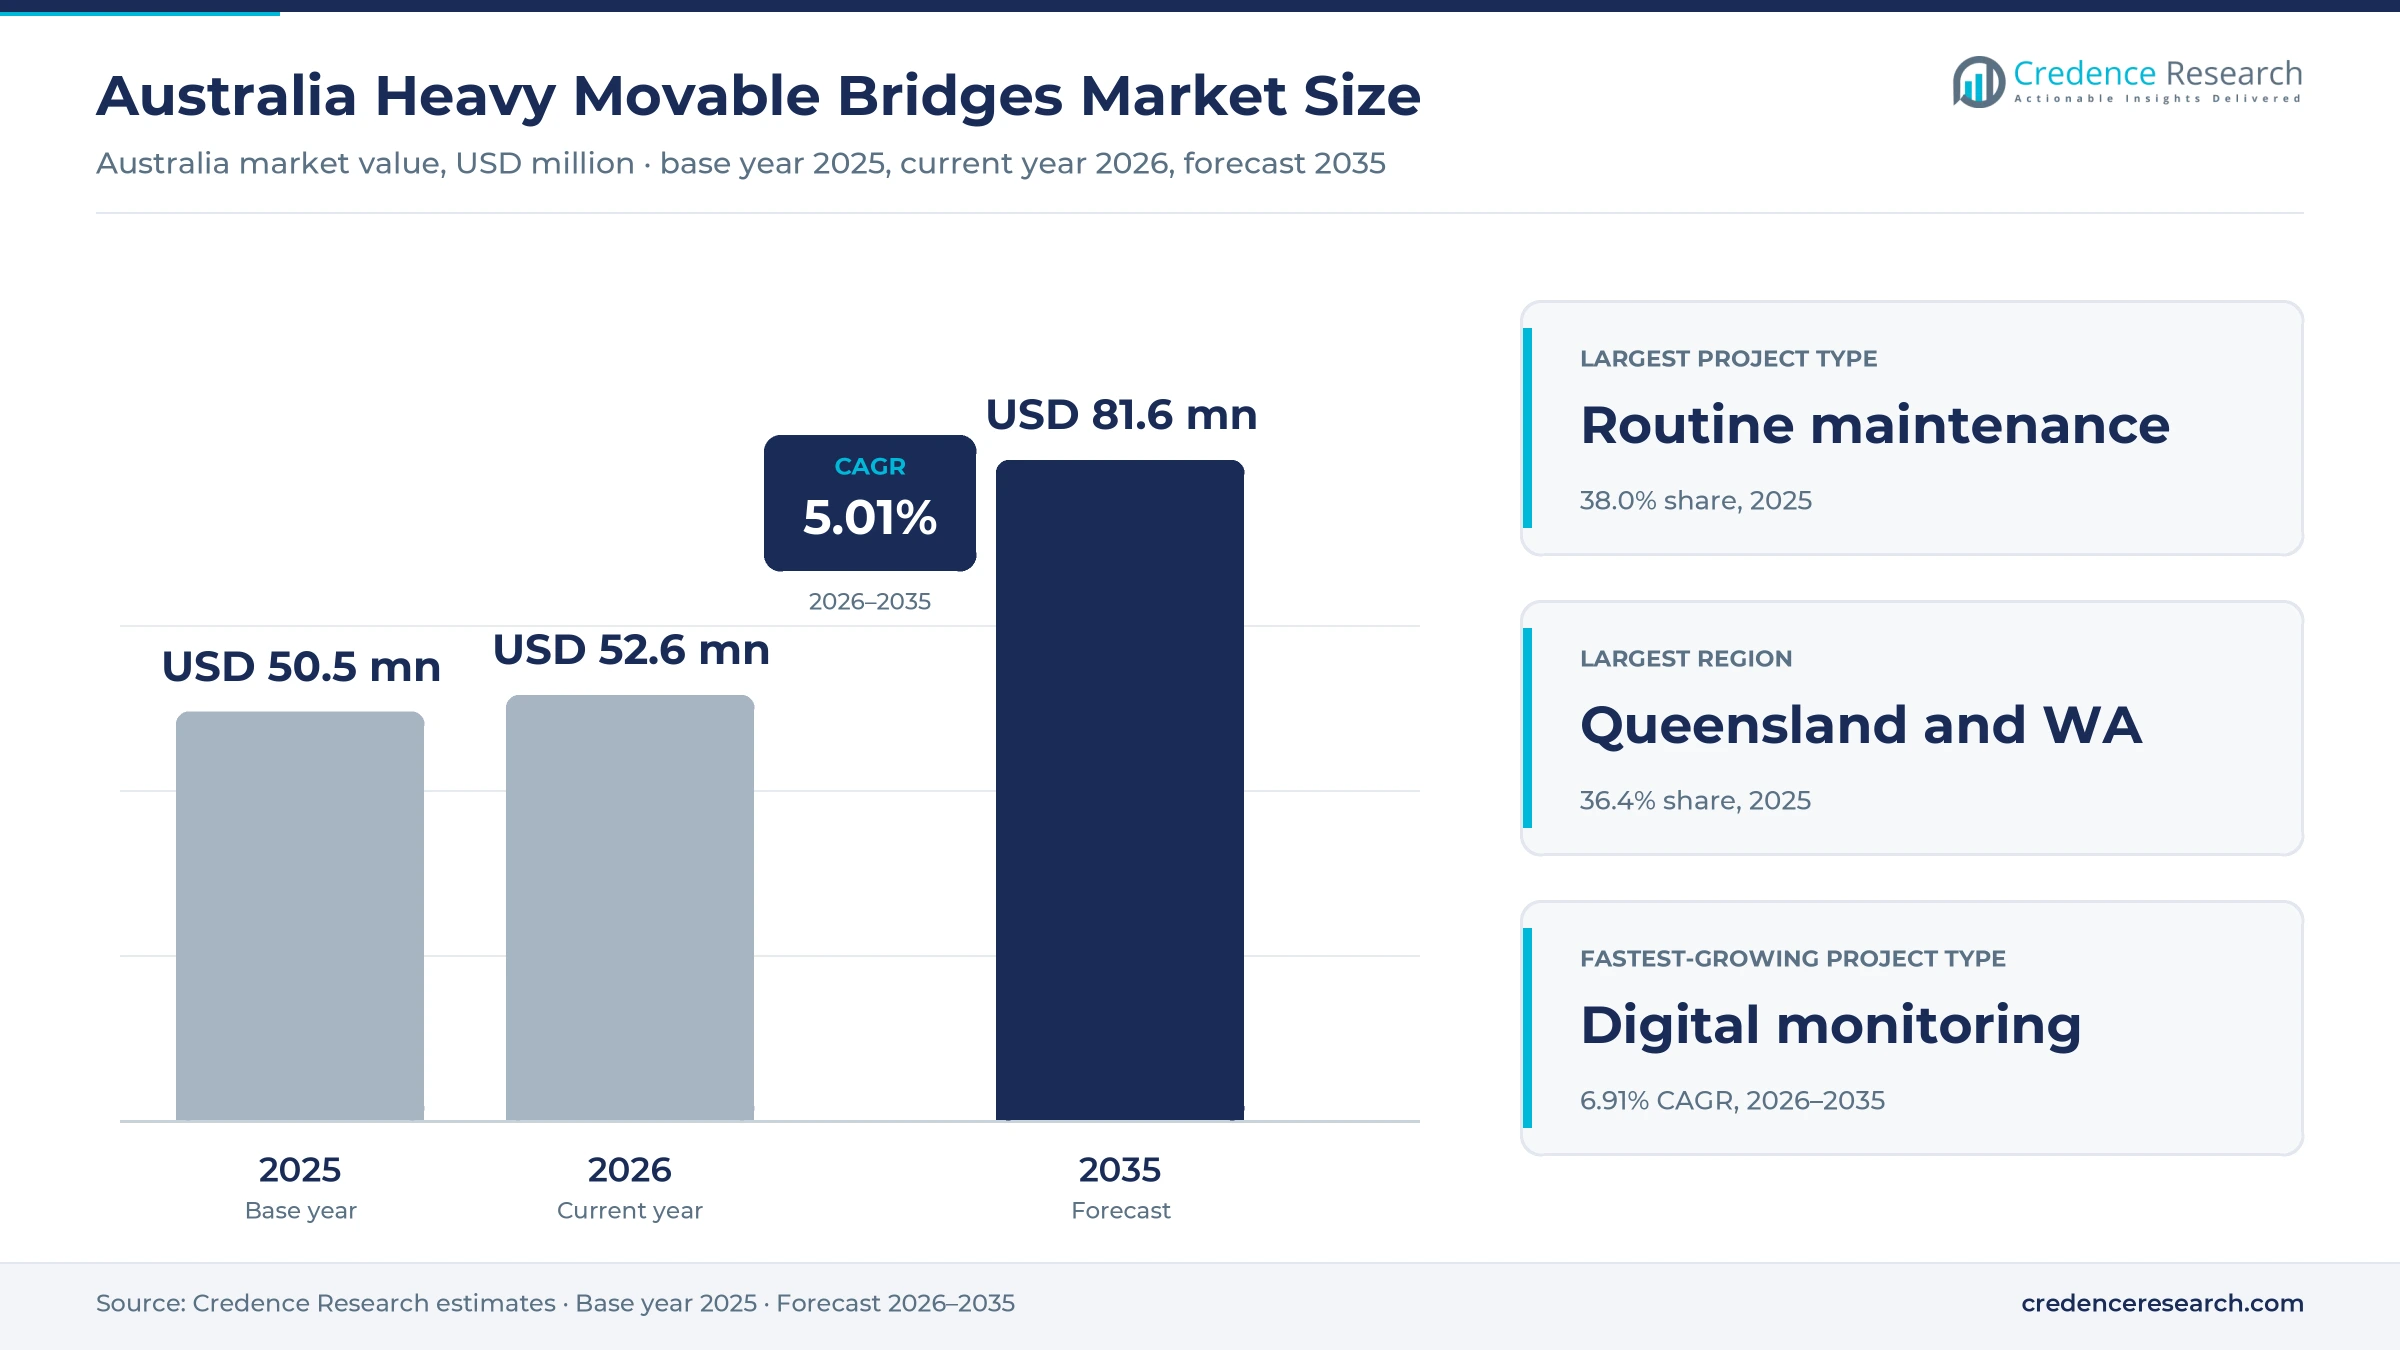
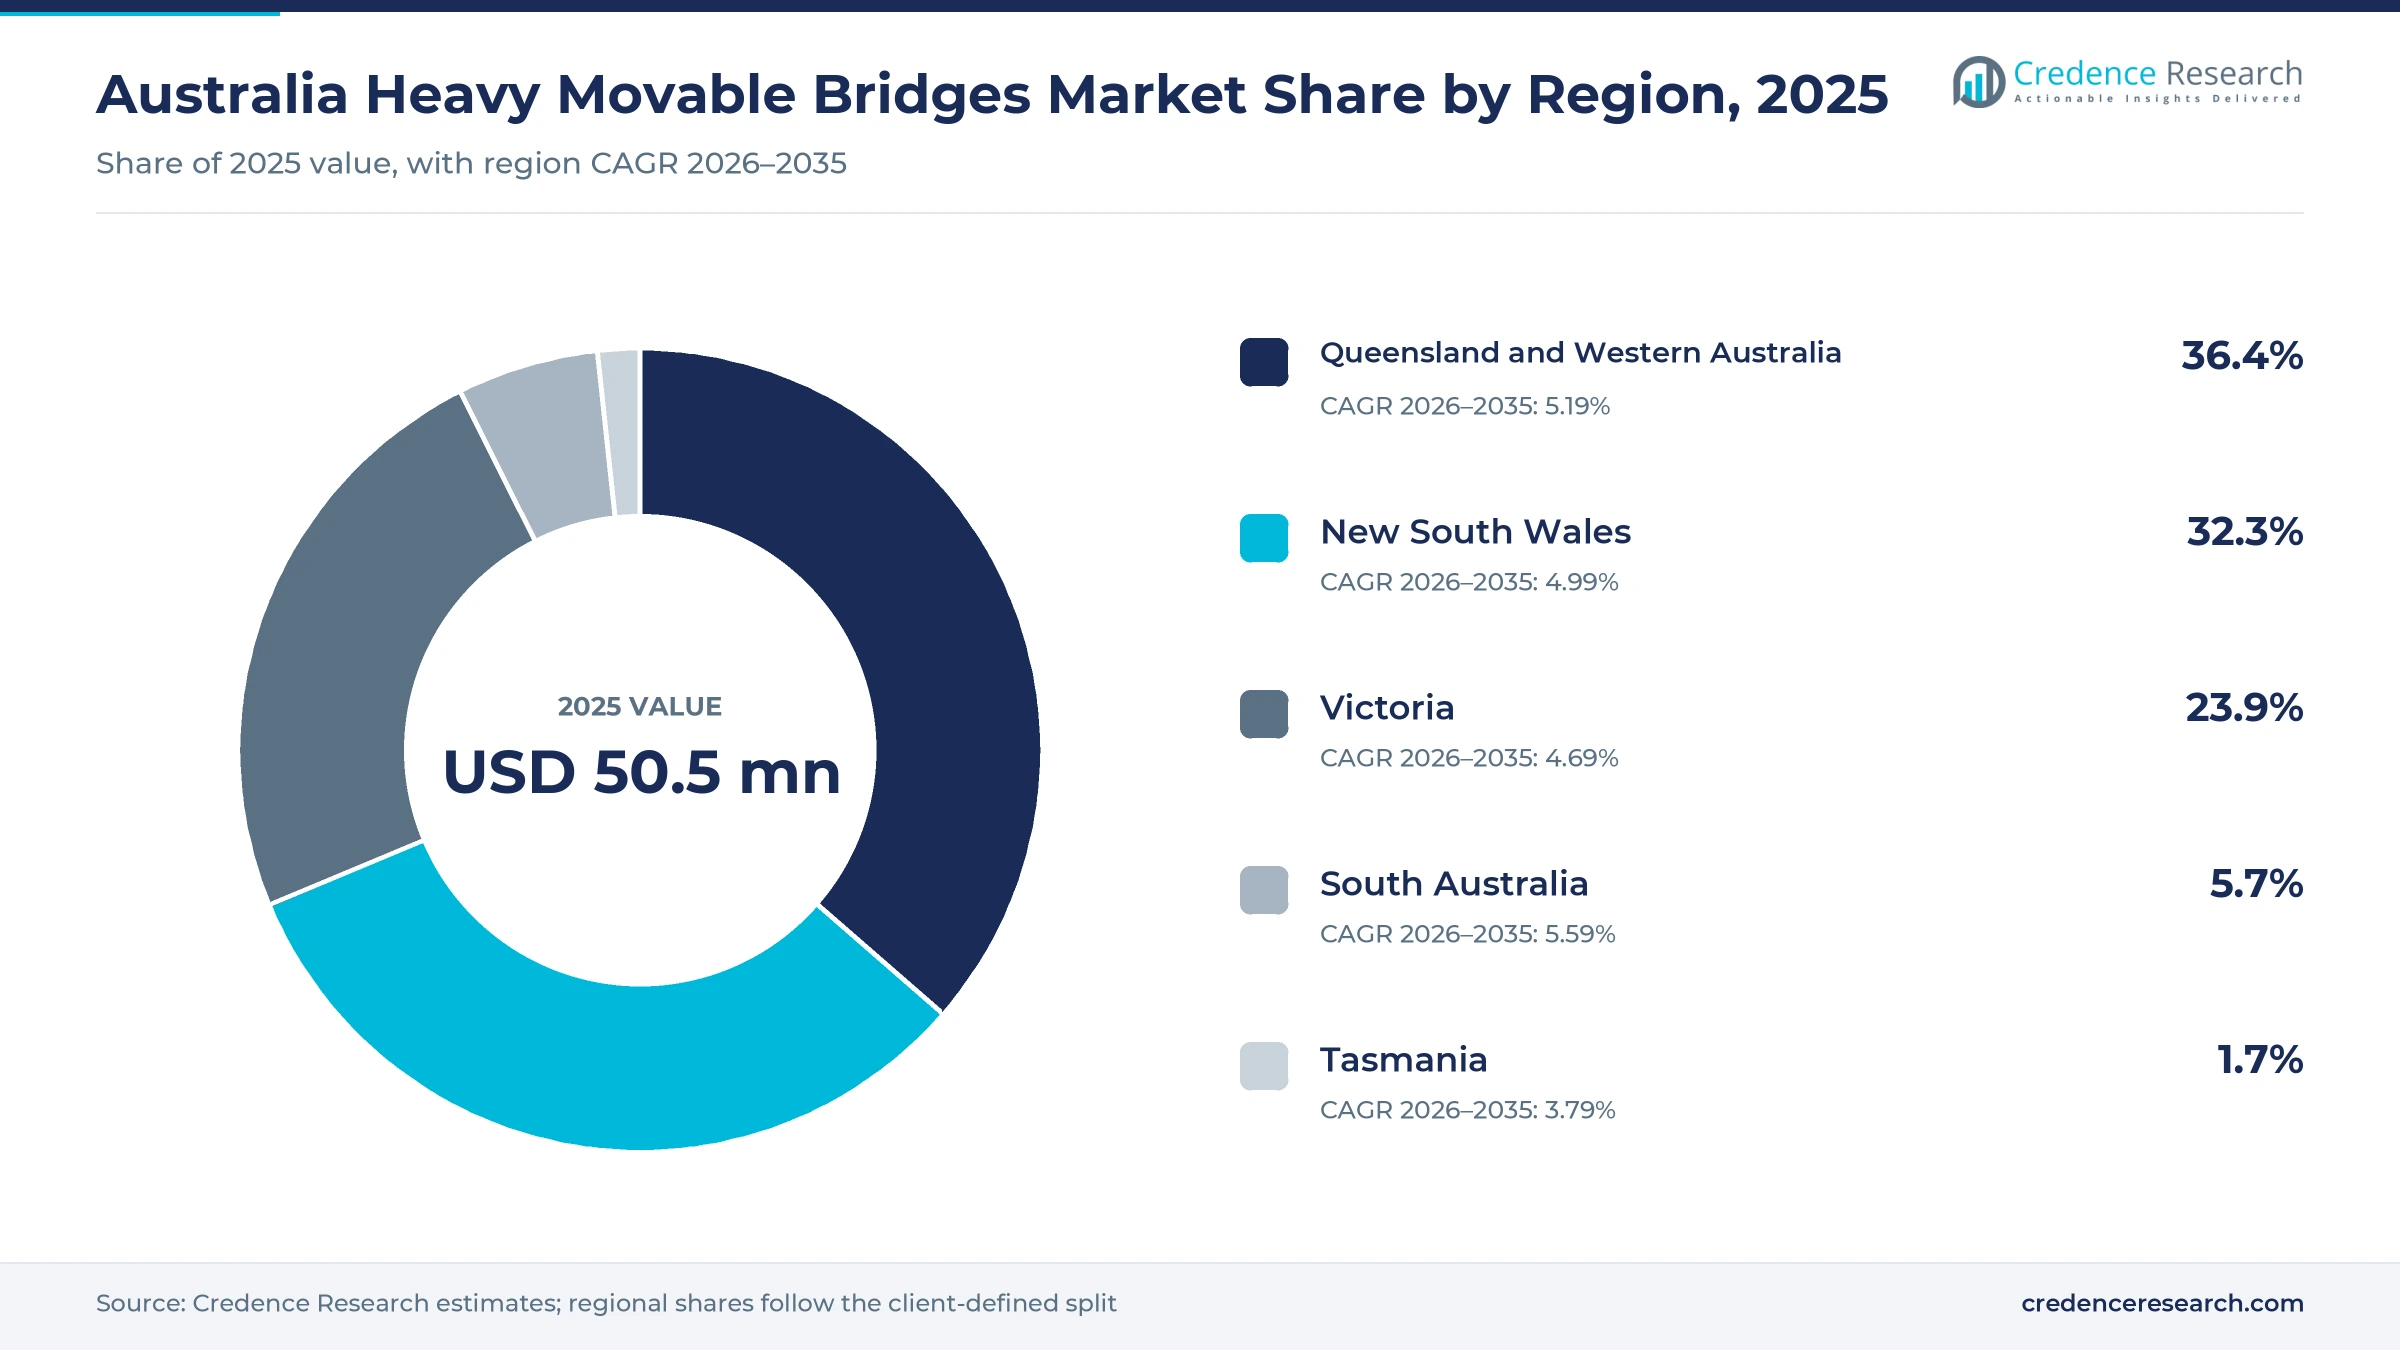
The Australia heavy movable bridges market was valued at USD 50.5 million in 2025 and is projected to increase from USD 52.5 million in 2026 to USD 81.6 million by 2035, registering a CAGR of 5.01% during 2026–2035. Demand comes from state transport agencies, councils and port and rail owners that must keep vertical lift, bascule and swing spans opening safely for vessels while carrying road and rail traffic. Queensland and Western Australia held the largest regional share, 36.4% in 2025, because the zone combines two large states with busy ports and freight routes. South Australia is the fastest-growing region at 5.59% a year, as the road and rail bascule spans at Port Adelaide need intensive mechanical and electrical care. In turn, the opening of the new Bridgewater Bridge in Tasmania in June 2025 retired one of the oldest working lift spans in the country.
Which opening span services does the estimate cover?
The estimate measures spending on routine maintenance and operation, capital rehabilitation, engineering and advisory work, and digital monitoring services for heavy vertical lift, bascule and swing bridges in Australia. It counts work bought by state transport authorities, local government authorities and port and rail asset owners under term, capital and professional services contracts.
The estimate excludes the construction of new fixed bridges, light pedestrian opening bridges and general road resurfacing that is not tied to an opening span. The value chain runs from asset owners through engineering consultants, mechanical and electrical contractors and component suppliers to the bridge operators who raise spans for vessels.
Australia Heavy Movable Bridges Market Insights
- The Australia heavy movable bridges market was valued at USD 50.5 million in 2025 and is projected to reach USD 81.6 million by 2035, registering a CAGR of 5.01% during 2026–2035.
- Queensland and Western Australia held a 36.4% share of 2025 value, because the zone combines two large states with major ports and freight networks.
- Routine maintenance and operations led with a 38.0% share of 2025 value, because every opening span needs monthly test lifts and twice-yearly servicing.
- Transport for NSW manages 26 movable span bridges, of which 14 are still operational, according to a heritage study published in February 2023.
- Digital monitoring services grow fastest at 6.91% a year during 2026–2035, as owners move toward condition reports and remote supervision of span machinery.
Routine upkeep leads while digital monitoring grows fastest
Why does routine upkeep lead opening span spending?
Based on project type, the market is categorized into routine maintenance and operations, capital rehabilitation, engineering and advisory, and digital monitoring services. Routine Maintenance and Operations led with a 38.0% share of 2025 value, because owners must test, lubricate and service span machinery every month. Digital Monitoring Services grow fastest at 6.91% a year, as owners add sensors, condition reports and remote alarms to older spans.
How do lift, bascule and swing spans split the work?
Based on asset type, the market is categorized into vertical lift bridges, bascule bridges and swing bridges. Vertical Lift Bridges led with a 46.0% share of 2025 value, because lift spans are the most numerous opening type on Australian rivers. Bascule Bridges grow fastest at 5.42% a year, as busy hydraulic bascules at Swansea and Port Adelaide need frequent servicing and parts renewal.
Why do public road crossings dominate demand?
Based on end-use sector, the market is categorized into public road crossings, rail freight crossings and port service road crossings. Public Road Crossings led with a 64.0% share of 2025 value, because most opening spans carry highways and local roads. Port Service Road Crossings grow fastest at 5.49% a year, as port traffic rises and owners keep harbor access routes open for freight trucks and vessels alike.
How do term contracts shape buying?
Based on contracting model, the market is categorized into term maintenance contracts, capital works contracts and professional services engagements. Term Maintenance Contracts led with a 44.0% share of 2025 value, because owners hire specialist contractors for inspections, breakdown response and servicing over several years. Professional Services Engagements grow fastest at 5.39% a year, as heritage studies and condition audits require more engineering advice.
| Segment Group | Leading Sub-segment | Share, 2025 | Fastest-growing Sub-segment | CAGR, 2026–2035 |
|---|---|---|---|---|
| By Project Type | Routine Maintenance and Operations | 38.0% | Digital Monitoring Services | 6.91% |
| By Asset Type | Vertical Lift Bridges | 46.0% | Bascule Bridges | 5.42% |
| By End-Use Sector | Public Road Crossings | 64.0% | Port Service Road Crossings | 5.49% |
| By Contracting Model | Term Maintenance Contracts | 44.0% | Professional Services Engagements | 5.39% |
Request a Free Sample
Fill in your details and we'll send you a free sample report.
- Sample data tables & charts
- Research methodology
Aging machinery, term contracts and renewal lift spending
How do aging mechanisms and recurring inspection lift spending?
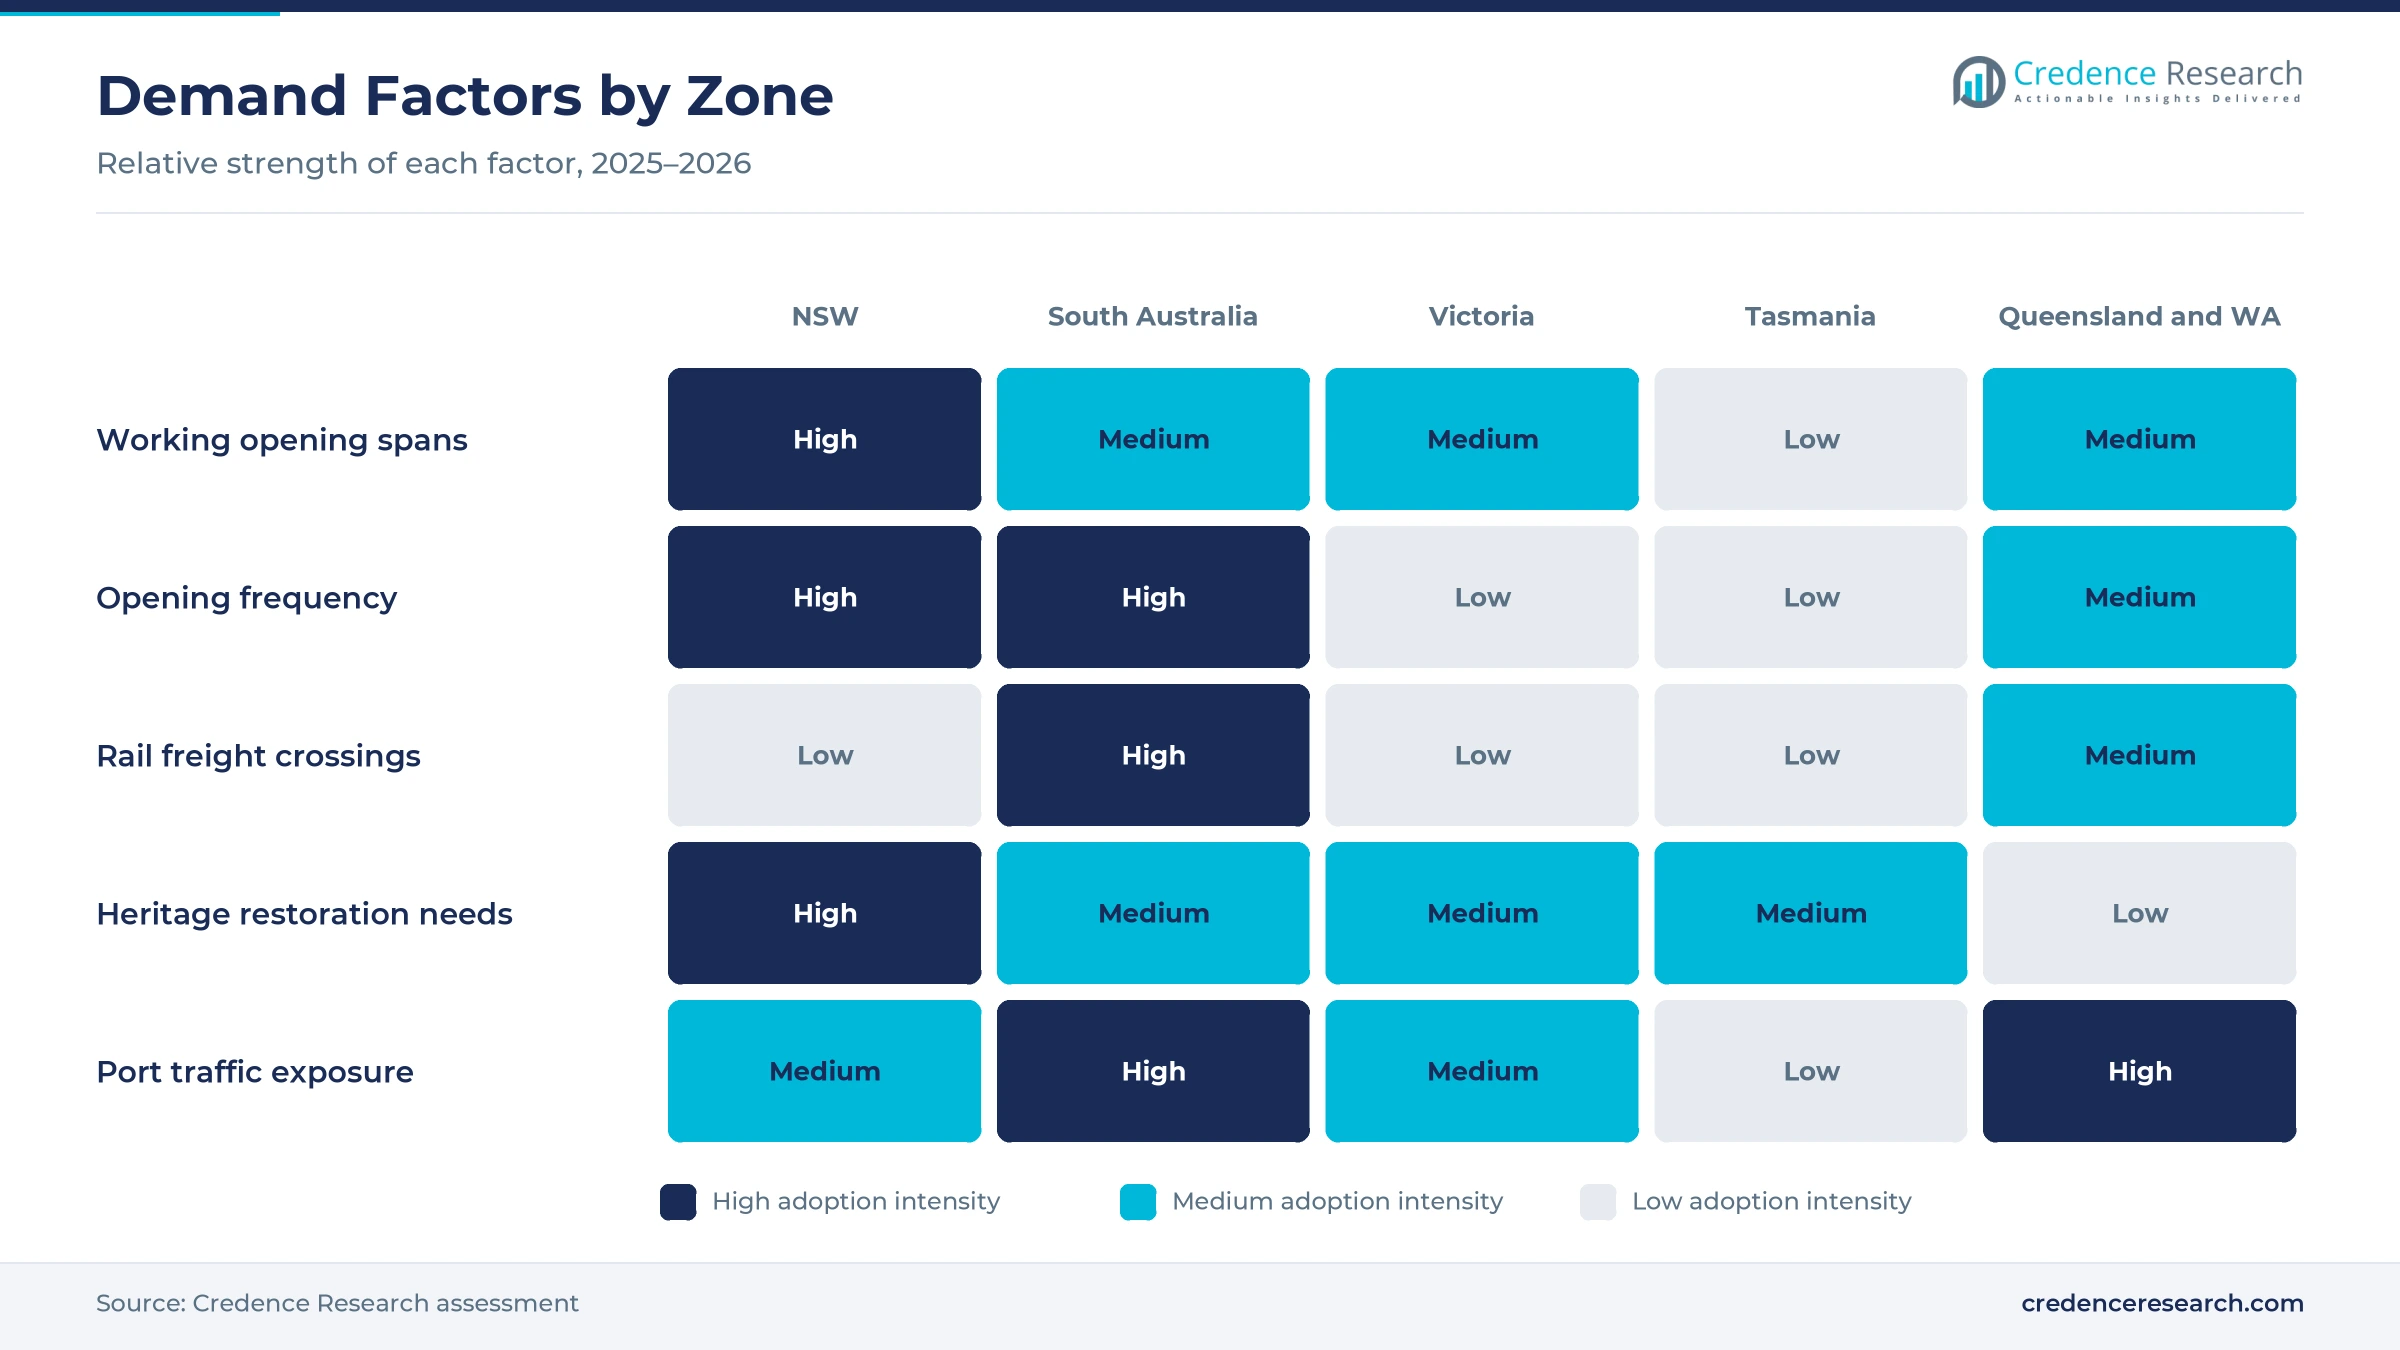
Aging mechanisms and recurring inspection lift spending, because many Australian opening spans run on machinery that is decades old. Transport for NSW manages 26 movable span bridges, and 14 remain operational, according to its movable span bridge study. Some 66 movable span bridges were built in New South Wales, and 48 of them were lift or bascule types built between 1882 and 2005. Hexham Bridge, built between 1945 and 1952, receives monthly test lifts and servicing of its electrical, mechanical and emergency systems in March and August or September. As a result, routine maintenance and operations hold 38.0% of 2025 value, because every working span needs this recurring care whether or not it opens often.
Why does contracted specialist maintenance expand the market?
Contracted specialist maintenance expands the market, because owners rely on outside firms with mechanical, electrical and rail skills. The South Australian master specification for the Port River Expressway road and rail bridges, issued in July 2022, requires fortnightly safety inspections and monthly inspections that raise and lower each span. It also demands a 24-hour breakdown service, with a target response of 30 minutes when a span cannot close safely. Work on the rail span needs rail operator accreditation and track access approval. In turn, term maintenance contracts hold 44.0% of 2025 value, because few owners keep such skills in house.
How does asset assurance and electrical renewal drive projects?
Asset assurance and electrical renewal drive capital projects, because owners must prove that each span stays safe and reliable. Swansea Bridge biannual maintenance from May 25, 2026, covered electrical, mechanical and hydraulic components, emergency systems, bridge locks and hydraulic cylinders. The Barham Koondrook Bridge restoration cost $30 million between 2012 and 2018 and included mechanical repairs to the lift span. A further $1.5 million strengthening project on the same crossing followed in 2021. As a result, capital rehabilitation grows steadily, and owners buy more hydraulic cylinders, drives and control panels as original equipment on older movable bridges reaches the end of its service life.
Why do heavy road and marine traffic keep spans busy?
Heavy road and marine traffic keep spans busy, because opening bridges carry major highways while serving boats that need a clear channel. Swansea Bridge opens about 2,000 times a year for up to 4,500 boats, while more than 27,000 vehicles cross it each day. Hexham Bridge opens about 120 times a year and carries more than 20,000 vehicles daily on the Pacific Highway. Container traffic through Australian ports reached 9,579,396 TEU in 2024, up from 9,283,435 in 2023, according to the World Bank. In turn, public road crossings hold 64.0% of 2025 value, while port service road crossings grow fastest.
Fixed replacements, heritage funds and monitoring shape work
How is the shift to fixed high-level crossings changing work?
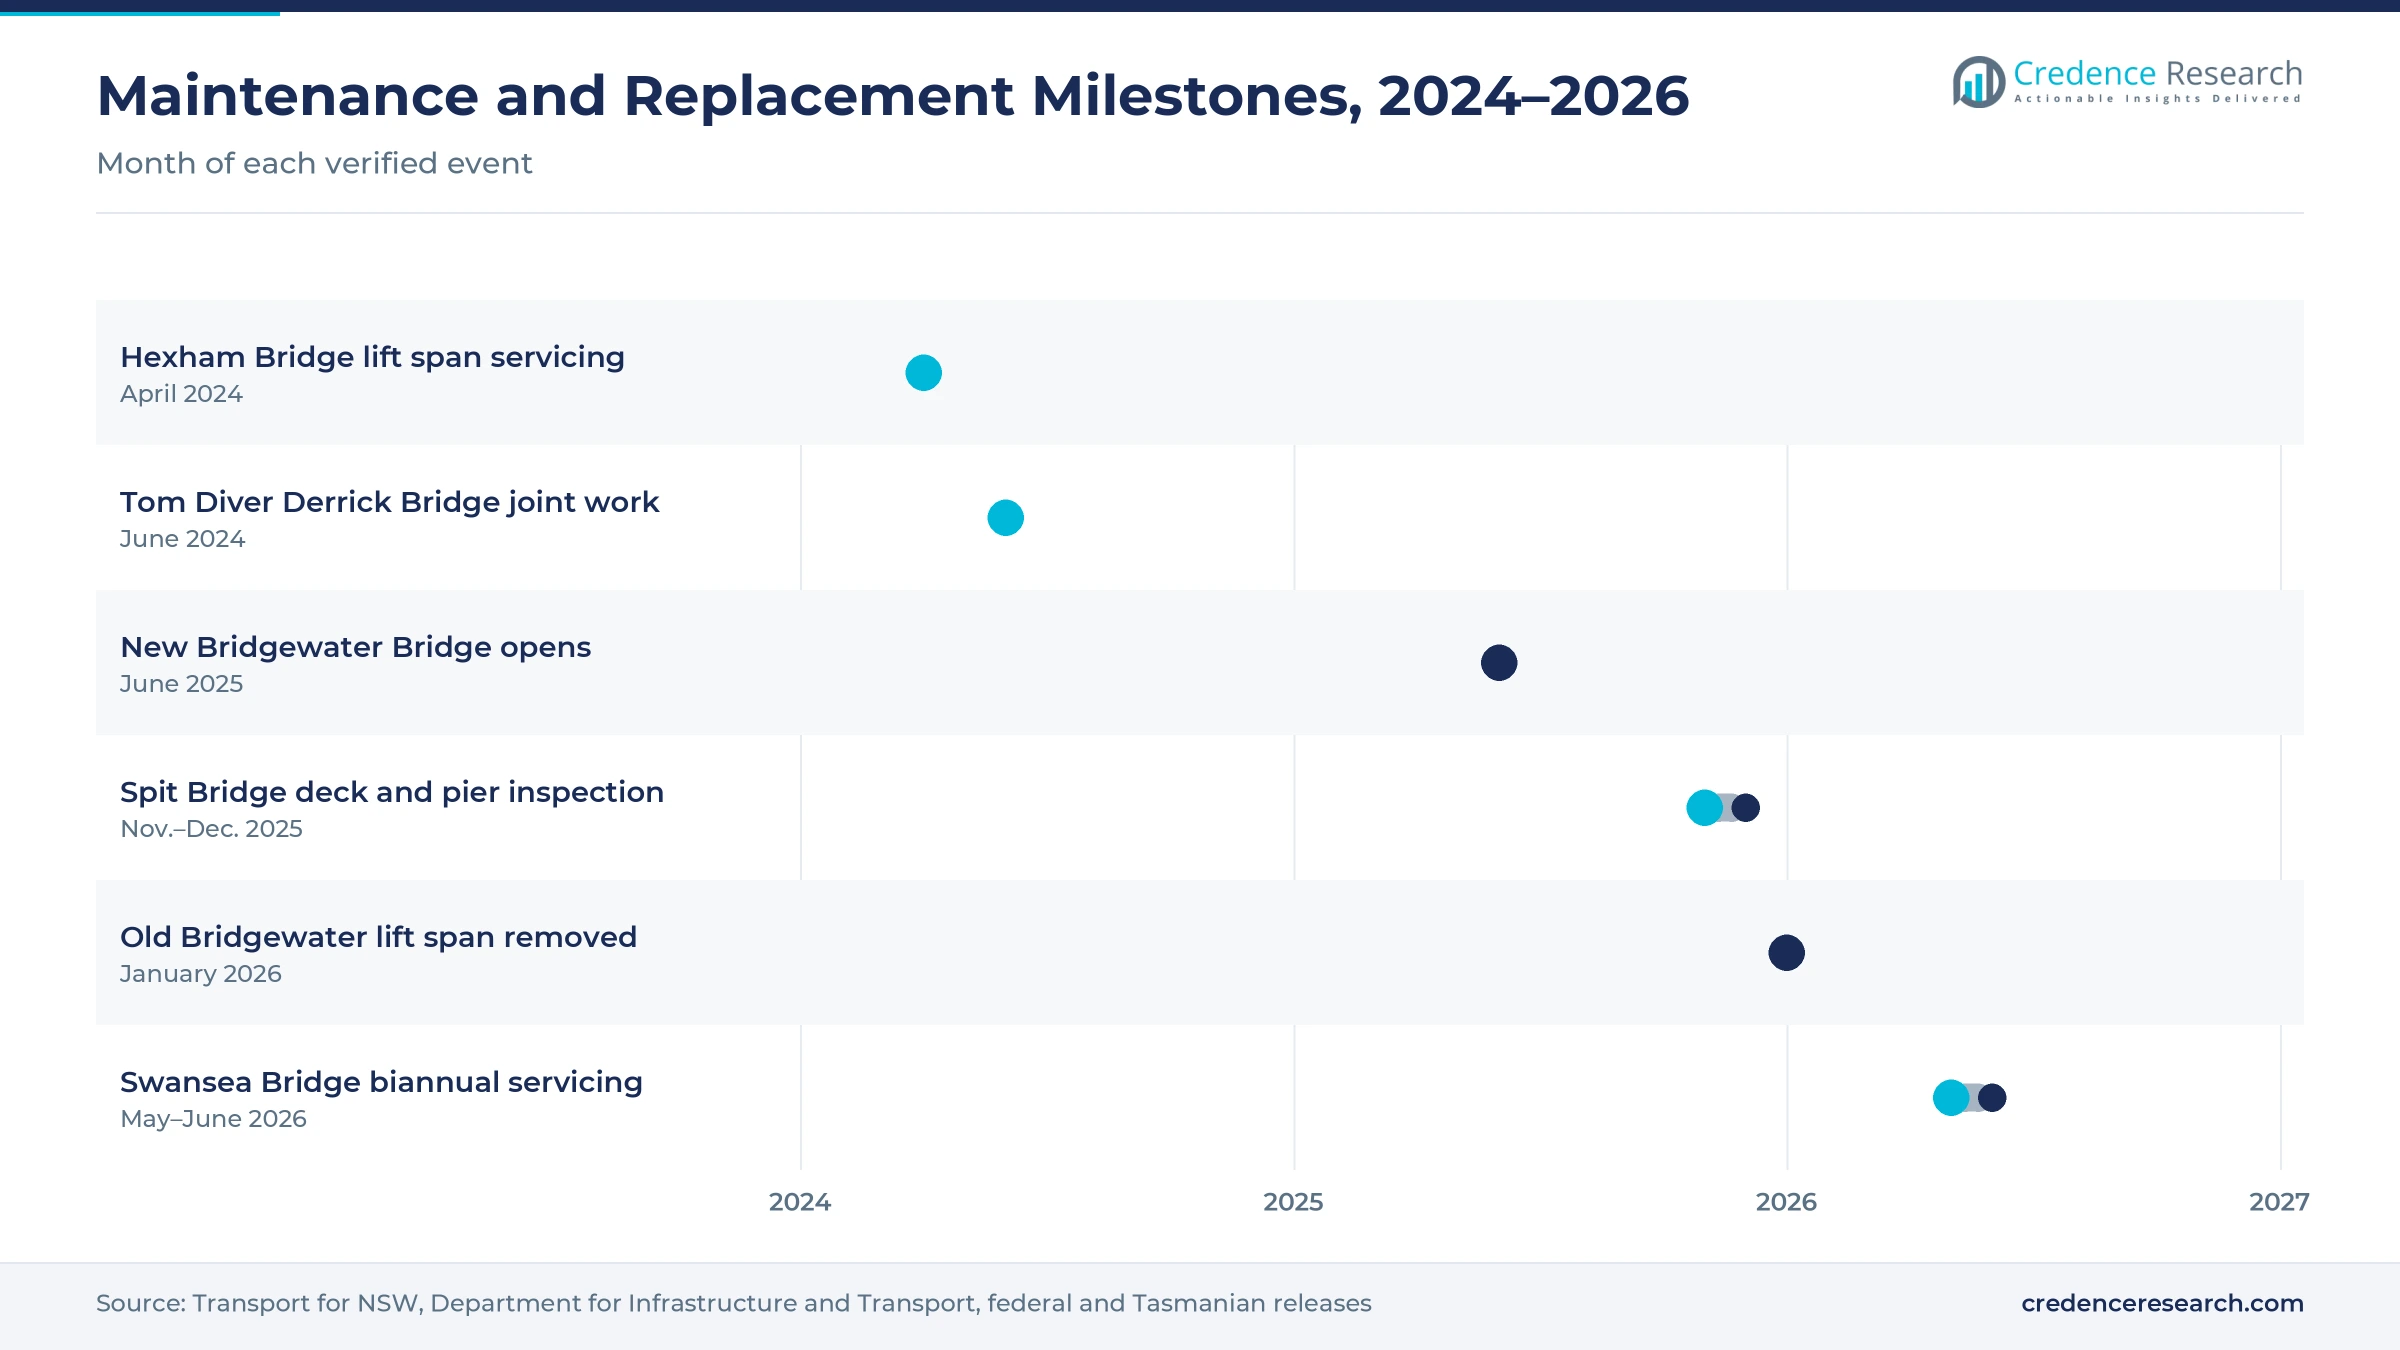
The shift to fixed high-level crossings is changing work, because some owners now replace old lift spans instead of renewing them. The new Bridgewater Bridge in Tasmania opened to traffic in June 2025 at a cost of $786 million, according to the federal infrastructure minister. The federal government contributed $628.8 million, while the Tasmanian government covered the remaining $157.2 million. Crews then removed the old 41-meter lift span by barge in January 2026, with demolition due to finish by mid-2026. As a result, Tasmania grows slowest at 3.79% a year, while demolition and heritage records add short bursts of engineering work during each replacement.
Why is the rise of standard maintenance strategies notable?
The rise of standard maintenance strategies is notable, because owners want consistent care across many span designs. GHD prepared the New South Wales movable span bridge study with the Transport for NSW Environment Branch, and the study was published in February 2023. It sorts the movable bridges into 13 subtypes, 8 for vertical lift spans and 5 for bascule bridges, after 66 such bridges were built in the state. The study then sets maintenance, repair, rehabilitation and upgrade strategies for each subtype. In turn, engineering and advisory work holds a steady place, and owners use the subtypes to plan structural health monitoring and parts renewal across groups of similar bridges.
Can heritage restoration funding open new rehabilitation work?
Heritage restoration funding can open new rehabilitation work, because several opening spans are state-listed landmarks that owners must keep in use. The NSW government committed $59.6 million over 10 years to restore the timber trusses of Pyrmont Bridge, according to a July 2025 report. The bridge opened in 1903 and has two steel spans and 12 timber spans. It is also the oldest opening bridge in the world still driven by its original electric motor. Placemaking NSW manages the bridge and employs its own maintenance supervisor. As a result, New South Wales keeps a 32.3% share of 2025 value, and heritage work on its swing span adds steady capital projects.
Is there room to grow through remote supervision and monitoring?
Suppliers have room to grow through remote supervision and monitoring, because owners need faster fault detection on spans that open on demand. In South Australia, public requests to open the Port River bridges pass through the state traffic management center and must be met within two hours. The Port River Expressway bridge opens 2 times on weekdays and 3 times on weekends, while Birkenhead Bridge opens on request with two hours of notice. Contractors must also file inspection reports within 14 days and an annual condition report on mechanical and electrical systems. In turn, digital monitoring services grow fastest at 6.91% a year, as owners link span controls to SCADA systems and remote alarms.
Night windows, weather and shrinking asset base test owners
How do narrow work windows raise costs?
Narrow work windows raise costs, because owners allow major servicing only at night or outside traffic peaks. The Port River specification bars traffic-restricting work between 7 and 9 a.m. and 4 and 6 p.m., and closures need approval two months ahead. As a result, contractors pay for night crews and traffic control. Owners respond by bundling inspections, servicing and repairs into the same closures, which cuts the number of nights crews spend on site.
Why does weather delay planned servicing?
Weather delays planned servicing, because span machinery cannot be safely opened or worked on in high wind or heavy rain. The Port River Expressway bridge does not open in winds of 40 kilometers an hour or more, and Swansea Bridge maintenance planned for May 2026 was postponed to June because of weather. In turn, contractors must keep crews and parts ready for new dates. Owners respond with flexible contract windows and agreed backup dates for each closure.
How does the shrinking working asset base limit volumes?
The shrinking working asset base limits volumes, because only 14 of the 26 movable span bridges that Transport for NSW manages still operate. Bridgewater in Tasmania also stopped lifting before its replacement opened in 2025. As a result, spending is concentrated on fewer, busier spans. Suppliers respond by offering heritage records, demolition support and monitoring for retired spans, which keeps some work flowing after a bridge stops opening.
Why do specialist skills and old parts create risk?
Specialist skills and old parts create risk, because many spans use custom gears, ropes, motors and controls that are no longer made. Rail spans also need accredited rail workers and track access approval before any work begins. In turn, a single breakdown can close a road or rail crossing for hours. Owners respond with long-term contracts, spare part stocks and detailed manuals that contractors must keep up to date within 28 days of changes.
Queensland and WA lead as South Australia grows fastest
| Region | Value, 2025 (USD million) | Share, 2025 | CAGR, 2026–2035 |
|---|---|---|---|
| Queensland and Western Australia | 18.4 | 36.4% | 5.19% |
| New South Wales | 16.3 | 32.3% | 4.99% |
| Victoria | 12.1 | 23.9% | 4.69% |
| South Australia | 2.9 | 5.7% | 5.59% |
| Tasmania | 0.9 | 1.7% | 3.79% |
Why do Queensland and Western Australia hold the top share?
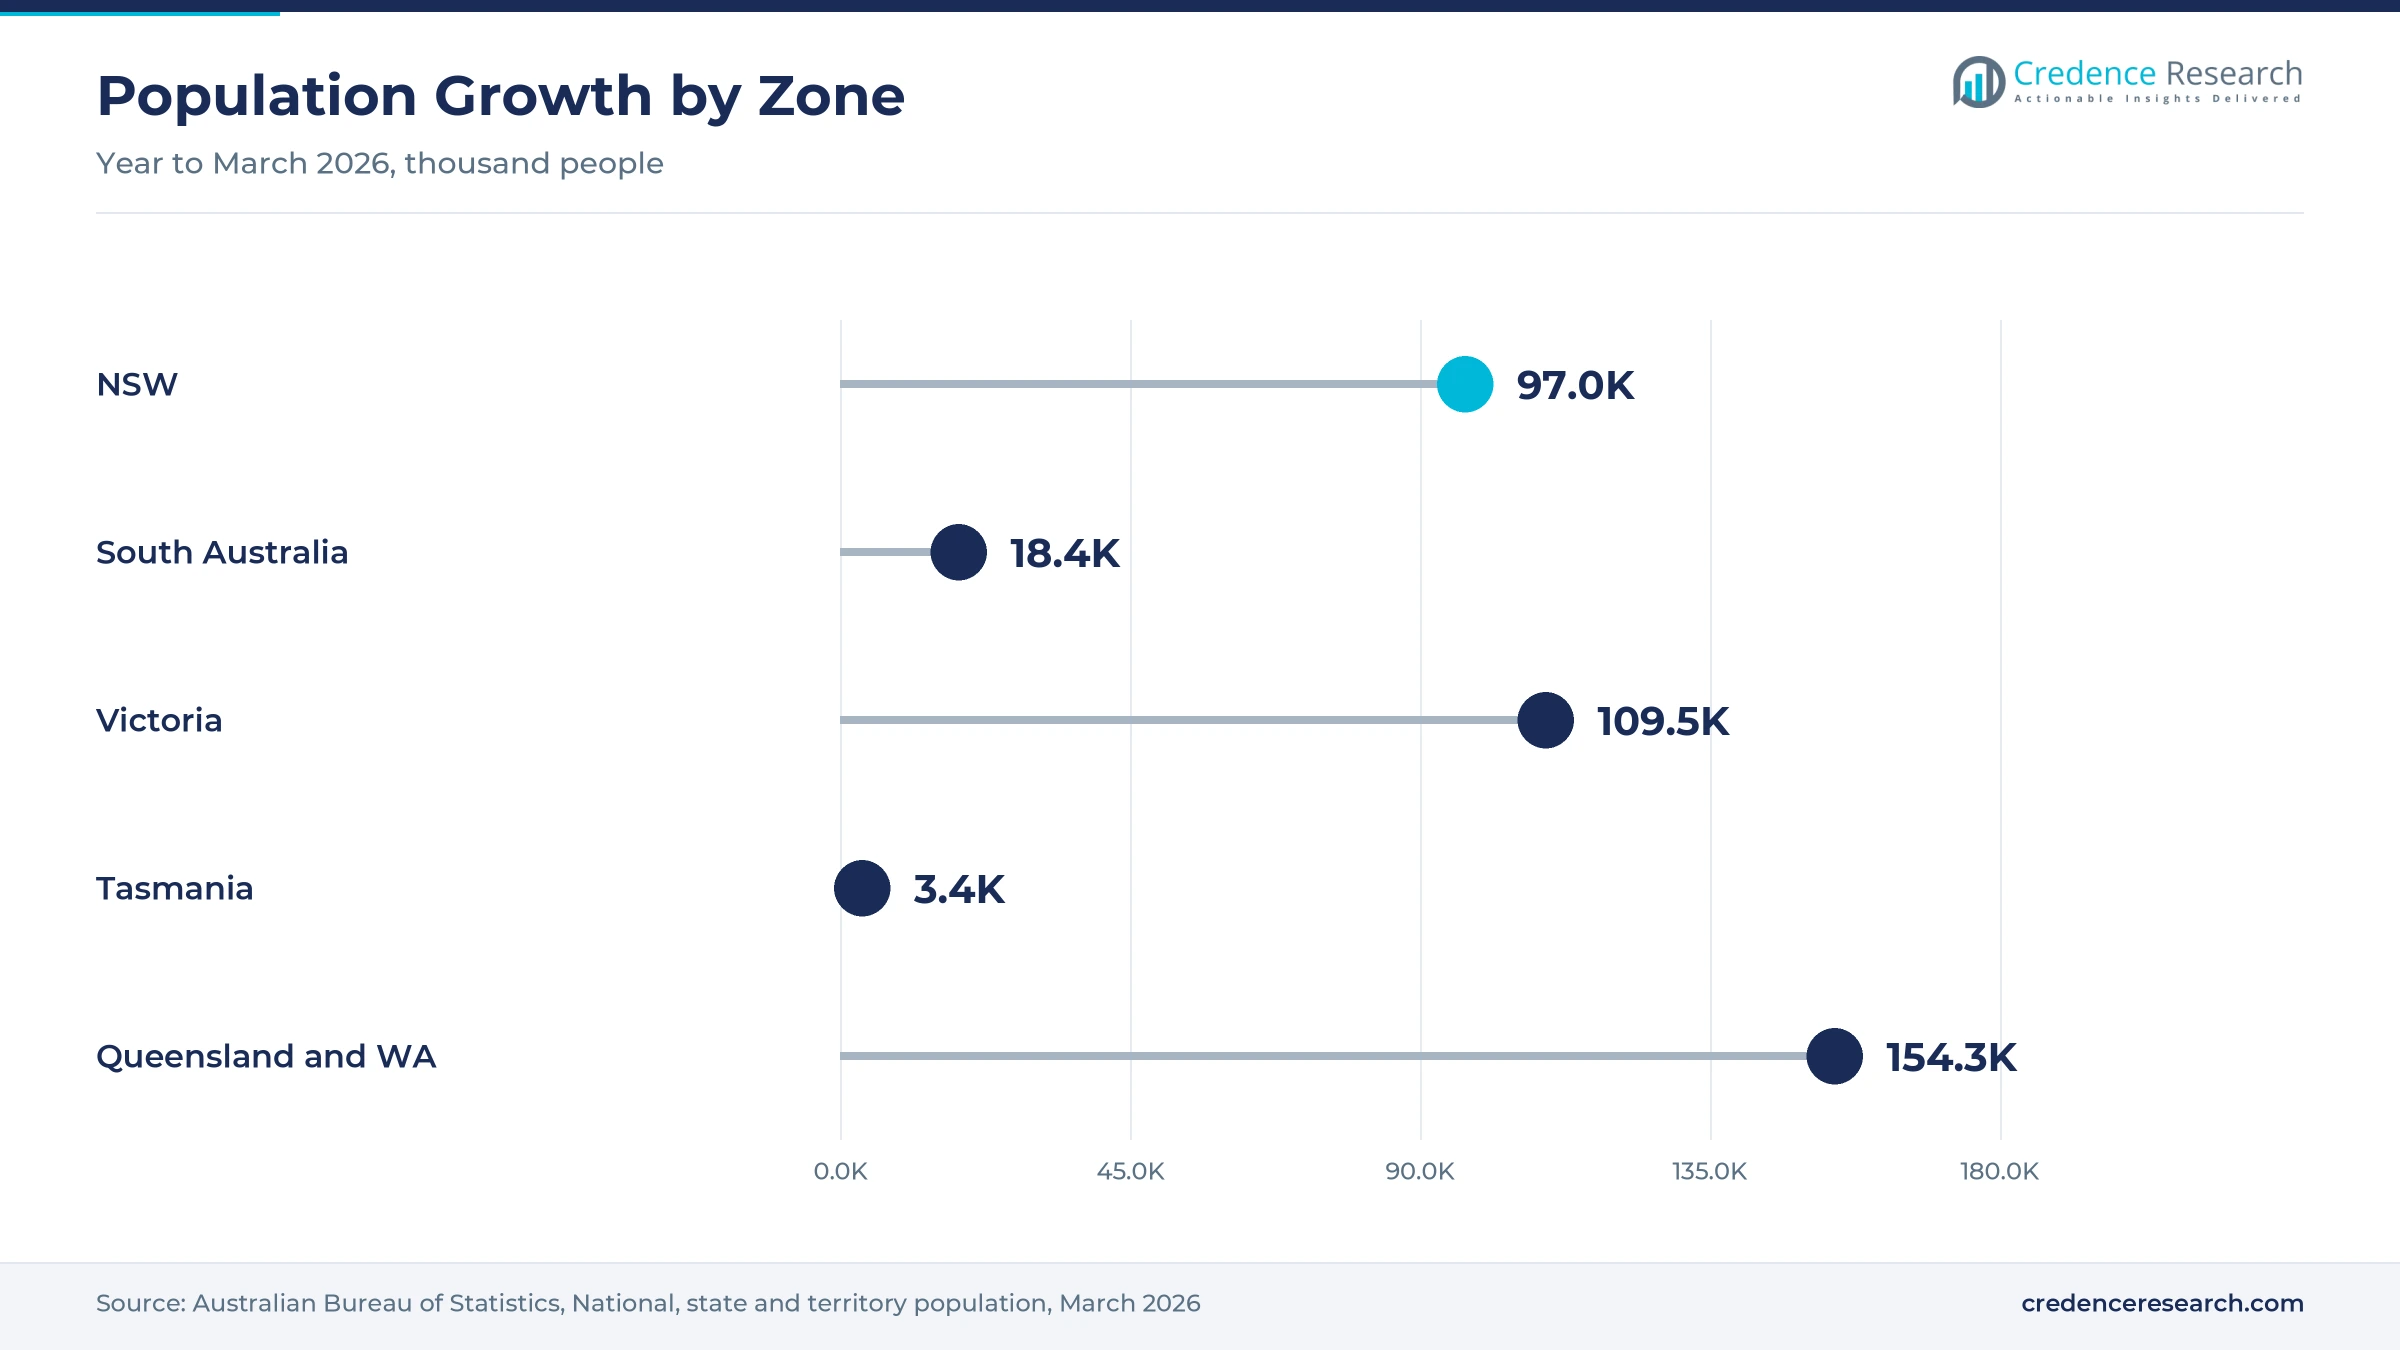
Queensland and Western Australia held a 36.4% share of 2025 value and grow at 5.19% a year, because the zone joins two large states with busy ports, resource freight routes and coastal river crossings. Western Australia had the fastest population growth of any state in the year to March 2026, at 2.1%, while Queensland added about 90,100 people. As a result, port service road and rail freight crossings in the zone draw steady maintenance spending.
How does New South Wales anchor opening span work?
New South Wales held a 32.3% share of 2025 value and grows at 4.99% a year, because the state has the largest group of working lift and bascule spans. Hexham, Swansea and Spit bridges all carry major roads and receive regular servicing. In November 2025, Transport for NSW also inspected the underside of the Spit Bridge deck and its piers from a barge. In turn, the state supports steady term and capital work.
What shapes demand in Victoria?
Victoria held a 23.9% share of 2025 value and grows at 4.69% a year, because several historic lift spans cross the Murray River on the border with New South Wales. Transport for NSW maintains the Barham Koondrook Bridge with Regional Roads Victoria, which shows how the two states share upkeep. Victoria also added about 109,500 people in the year to March 2026, which raises traffic on river crossings.
Why is South Australia growing fastest?
South Australia held a 5.7% share of 2025 value and grows fastest at 5.59% a year, because the Port River road and rail bascules and Birkenhead Bridge need intensive care. Crews raised the Tom 'Diver' Derrick Bridge for joint maintenance from June 17 to 19, 2024. Birkenhead Bridge also received a $3.73 million upgrade from August 2020, which included a new lightweight deck for its bascule spans.
How does Tasmania change after the Bridgewater replacement?
Tasmania held a 1.7% share of 2025 value and grows at 3.79% a year, the slowest rate, because its main lift span closed when the new Bridgewater Bridge opened in June 2025. Crews removed the old lift span by barge in January 2026, and demolition runs to mid-2026. As a result, Tasmanian spending shifts from servicing to demolition, heritage records and inspection of the new fixed crossing.
Maintenance, replacement and funding milestones, 2024–2026
| Development | Status and market relevance |
|---|---|
| In April 2024, Transport for NSW began two weeks of night servicing of the Hexham Bridge lift span systems. | Twice-yearly electrical and mechanical servicing |
| In June 2024, crews raised the Tom 'Diver' Derrick Bridge at Port Adelaide to carry out joint maintenance. | Three nights of closures |
| In June 2025, the new $786 million Bridgewater Bridge opened to traffic in Tasmania. | Retired one of the oldest working lift spans |
| In November 2025, Transport for NSW started deck and pier inspections on the Spit Bridge. | Up to 20 day shifts from a barge |
| In January 2026, crews removed the 41-meter lift span of the old Bridgewater Bridge by barge. | Demolition due to finish by mid-2026 |
Control systems move from local panels to supervision
- Local manual control relies on an operator in a control house who raises and lowers the span by hand, which suits older lift bridges that open rarely.
- Local automated control uses programmable controls, hydraulic drives and interlocked warning gates, which lets a single operator open a busy bascule span safely and quickly.
- Remote supervisory control links span sensors and alarms to a traffic management center, which helps owners schedule openings, spot faults early and send breakdown crews faster.
Need a Custom Version of This Report?
Tailor the scope, geography, or segments to your exact requirements.
- Custom geography or segment scope
- Direct access to our analyst team
Engineering firms and local contractors share the work
Competition for work on movable bridges combines engineering consultants, mechanical and electrical contractors and civil builders. GHD prepared the movable span bridge study for Transport for NSW, which set maintenance strategies for each bridge subtype. Wallbridge Gilbert Aztec designed a new lightweight deck for the bascule spans of Birkenhead Bridge in South Australia, while McMahon Services carried out the main construction work on that upgrade. Hazell Brothers led the demolition of the old Bridgewater Bridge in Tasmania in a joint venture with Brodie Marine and Civil. Rivals compete on mechanical and electrical skill, breakdown response time, rail accreditation and heritage experience. Because owners award term contracts for several years, firms with local crews and spare parts win more work. Specialist hydraulic and electrical suppliers also support the main contractors when spans need new drives, controls or rail maintenance machinery.
Which companies work on Australian opening spans?
| Company | Type | Role in the market |
|---|---|---|
| GHD | Engineering consultant | Prepared the NSW movable span bridge study with Transport for NSW |
| Wallbridge Gilbert Aztec | Engineering consultant | Designed a lightweight deck for Birkenhead Bridge bascule spans |
| McMahon Services | Contractor | Carried out the main construction work on the Birkenhead Bridge upgrade |
| Hazell Brothers | Civil contractor | Led demolition of the old Bridgewater lift bridge |
| Brodie Marine and Civil | Marine contractor | Joint venture partner on the Bridgewater demolition |
Credence Research view on opening span asset care
Credence Research's view is that Australian spending on opening spans will grow steadily because the remaining working bridges are old, busy and costly to replace. Routine servicing remains the largest value pool, while digital monitoring adds the fastest growth as owners seek earlier fault warnings. Replacement of some lift spans with fixed crossings will reduce the asset base, but heritage funding and rehabilitation will offset part of that loss. Contractors with mechanical, electrical and rail skills should gain the most work.
How the national opening span estimate was built
The report uses 2025 as the base year on a calendar basis, and market values come from the Credence Research model. That model combines state transport agency project pages, maintenance specifications, government media releases, heritage studies, population statistics and port traffic data. Segment splits and zone growth rates are Credence Research estimates, while zone shares follow the client-defined split. Sources used are official statistics, government publications and company releases, and no interviews or surveys were used.
Rehabilitation and monitoring carry growth to 2035
Spending is expected to reach USD 81.6 million by 2035, a 5.01% CAGR during 2026–2035, as owners keep old opening spans safe and reliable. Growth should be strongest in capital rehabilitation and monitoring, because original drives and controls are reaching the end of their lives. After 2030, some owners may replace more lift spans with fixed crossings, which would shift work toward demolition and heritage records. Contractors with local crews and spare parts are expected to gain the most.
Frequently Asked Questions
How big is the Australia heavy movable bridges market?
Which project type leads Australian value?
Which region leads the Australian market?
How many movable span bridges does Transport for NSW manage?
How often do the busiest Australian opening spans open?
Which asset type is growing fastest?
Who are the leading companies in the Australian market?
What are the main challenges for owners and contractors?
Table of Content
Chapter 1 Market Segmentation
- 1.1 Segmentation Framework
- 1.1.1 Product and Service Classification
- 1.1.2 Application and End-Use Classification
- 1.1.3 Technology and Solution Classification
- 1.1.4 Customer and Distribution Channel Classification
- 1.1.5 Geographic Segmentation
- 1.1.6 Market Segment Definitions and Boundaries
- 1.2 By Project Type
- 1.2.1 Routine Maintenance and Operations
- 1.2.2 Capital Rehabilitation
- 1.2.3 Engineering and Advisory
- 1.2.4 Digital Monitoring Services
- 1.3 By Asset Type
- 1.3.1 Vertical Lift Bridges
- 1.3.2 Bascule Bridges
- 1.3.3 Swing Bridges
- 1.4 By End-Use Sector
- 1.4.1 Public Road Crossings
- 1.4.2 Rail Freight Crossings
- 1.4.3 Port Service Road Crossings
- 1.5 By Contracting Model
- 1.5.1 Term Maintenance Contracts
- 1.5.2 Capital Works Contracts
- 1.5.3 Professional Services Engagements
Chapter 2 Introduction
- 2.1 Report Objectives and Scope
- 2.2 Product Definition and Industry Terminology
- 2.3 Market Inclusions and Exclusions
- 2.4 Research Process
- 2.4.1 Primary Research and Expert Interviews
- 2.4.2 Secondary Research and Source Review
- 2.4.3 Top-Down and Bottom-Up Estimation
- 2.4.4 Data Triangulation and Verification
- 2.5 Market Size Measurement Basis
- 2.5.1 2025: USD 50.5 million → 2035: USD 81.6 million
- 2.6 Historical and Forecast Reference Periods
- 2.6.1 Historical Period: 2018-2025
- 2.6.2 Base Year: 2025
- 2.6.3 Forecast Period: 2025-2035
- 2.7 Research Assumptions and Limitations
Chapter 3 Executive Summary
- 3.1 Market Snapshot and Key Findings
- 3.2 Base-Year Market Size, 2025
- 3.3 Forecast Market Size, 2035
- 3.4 Revenue and Volume Growth Outlook
- 3.5 Key Demand and Supply Indicators
- 3.6 Leading Market Segments
- 3.7 Fastest-Growing Market Opportunities
- 3.8 Regional Performance Highlights
- 3.9 Technology and Industry Transformation
- 3.10 Competitive Landscape Summary
- 3.11 Analyst View and Strategic Implications
Chapter 4 Australia Heavy Movable Bridges Market Trends and Developments
- 4.1 Historical Industry Development, 2018-2025
- 4.2 Recent Market Trends and Developments
- 4.3 Demand and Customer Behavior Trends
- 4.4 Technology and Product Innovation
- 4.5 Artificial Intelligence, Automation and Digitalization
- 4.6 Local Manufacturing and Supply Chain Realignment
- 4.7 Industry Partnerships, Mergers and Acquisitions
- 4.8 Sustainability and Circular Economy Developments
- 4.9 Government and Private Sector Investment Trends
- 4.10 Emerging Business Models and Commercialization
- 4.11 Industry Developments and Announcements
Chapter 5 Australia Heavy Movable Bridges Market Production, Supply and Demand Analysis
- 5.1 Demand Trend and Consumption Analysis, 2018-2025
- 5.2 Demand Forecast, 2025-2035
- 5.3 Production and Output Trend, 2018-2025
- 5.4 Production and Output Forecast, 2025-2035
- 5.5 Installed Capacity and Capacity Utilization
- 5.6 Company-Wise Production Plants and Statistics
- 5.6.1 Installed Production Capacity
- 5.6.2 Actual Production
- 5.6.3 Planned Capacity and Expansion Targets
- 5.7 Supply Chain Structure and Procurement Trends
- 5.8 Supply-Demand Gap and Bottlenecks
- 5.9 Import Dependence and Sourcing Structure
- 5.10 Contract Manufacturing and Outsourcing
- 5.11 Regional Supply and Demand Concentration
Chapter 6 Australia Heavy Movable Bridges Market Pricing Analysis
- 6.1 Pricing Structure and Measurement
- 6.2 Historical Pricing Trends, 2018-2025
- 6.3 Pricing Outlook, 2025-2035
- 6.4 Average Selling Price and Unit Economics
- 6.5 Pricing by Product and Market Segment
- 6.6 Geographic Pricing Differences
- 6.7 Key Input, Energy, Labor and Logistics Costs
- 6.8 Contract Pricing and Purchasing Models
- 6.9 Pricing Sensitivity and Competitive Positioning
- 6.10 Price, Margin and Profitability Implications
Chapter 7 Australia Heavy Movable Bridges Market Dynamics
- 7.1 Market Growth Drivers
- 7.1.1 Demand-Side Drivers
- 7.1.2 Technology and Innovation Drivers
- 7.1.3 Infrastructure and Investment Drivers
- 7.1.4 Regulatory and Policy Drivers
- 7.2 Market Restraints
- 7.2.1 Cost and Affordability Constraints
- 7.2.2 Technology and Adoption Barriers
- 7.2.3 Supply Chain and Operational Constraints
- 7.3 Market Challenges
- 7.3.1 Competitive Pressure and Margin Erosion
- 7.3.2 Skills, Infrastructure and Implementation Gaps
- 7.4 Emerging Market Opportunities
- 7.5 Market Dynamics Impact and Time-Horizon Assessment
Chapter 8 Australia Heavy Movable Bridges Value Chain Analysis
- 8.1 Industry Value Chain Overview
- 8.2 Upstream Suppliers and Critical Inputs
- 8.3 Technology and Component Providers
- 8.4 Manufacturing or Service Delivery
- 8.5 Distribution, Channel Partners and Integrators
- 8.6 Downstream Applications and End Users
- 8.7 Value Addition and Profit Pools
- 8.8 Vertical Integration and Outsourcing
- 8.9 Supplier Concentration and Risk
- 8.10 Supply Chain Localization and Resilience
Chapter 9 Australia Heavy Movable Bridges Market Regulations and Policies
- 9.1 Relevant Laws, Standards and Compliance Frameworks
- 9.2 Product, Service, Safety and Quality Requirements
- 9.3 Government Policies, Incentives and Subsidies
- 9.4 Imports, Exports and Trade Barriers
- 9.5 Public Procurement and Local Content Requirements
- 9.6 Environmental and Sustainability Compliance
- 9.7 Upcoming Policy Changes and Market Implications
Chapter 10 Australia Heavy Movable Bridges Market Hotspots and Opportunities
- 10.1 Market Opportunity Mapping and Growth Hotspots
- 10.2 High-Growth Applications and Customer Groups
- 10.3 Underserved Markets and White-Space Opportunities
- 10.4 Emerging Technology and Product Opportunities
- 10.5 New Capacity and Investment Hotspots
- 10.6 Market Entry and Expansion Opportunities
- 10.7 Distribution and Partnership Opportunities
- 10.8 Near-Term and Long-Term Commercial Potential
- 10.9 Opportunity Attractiveness and Execution Risks
Chapter 11 Australia Heavy Movable Bridges Market Outlook, 2025-2035
- 11.1 Market Size and Analysis
- 11.1.1 Revenue (Market Measurement: 2025: USD 50.5 million → 2035: USD 81.6 million)
- 11.1.2 Market Volume and Quantity Sold
- 11.1.3 Historical Market Size, 2018-2025
- 11.1.4 Base-Year Market Size, 2025
- 11.2 Market Forecast, 2025-2035
- 11.2.1 Revenue Forecast to 2035
- 11.2.2 Volume Forecast to 2035
- 11.2.3 CAGR and Year-on-Year Growth
- 11.2.4 Incremental Revenue Opportunity
- 11.3 Forecast Assumptions and Scenario Analysis
- 11.3.1 Base-Case Forecast
- 11.3.2 Optimistic and Conservative Scenarios
- 11.3.3 Technology, Pricing and Policy Sensitivities
- 11.4 Market Attractiveness and Growth Outlook
Chapter 12 Australia Heavy Movable Bridges Market Segmentation and Outlook
- 12.1 Segmentation Summary and Market Shares, 2025
- 12.2 Largest and Fastest-Growing Segments
- 12.3 By Project Type - Market Size and Forecast, 2025-2035
- 12.3.1 Segment Definition and Scope
- 12.3.2 Historical Market Size, 2018-2025
- 12.3.3 Revenue Forecast, 2025-2035
- 12.3.4 Volume Forecast, 2025-2035
- 12.3.5 Base-Year Market Share, 2025
- 12.3.6 Segment CAGR and Growth Drivers
- 12.3.7 Subsegment Market Size and Forecast
- 12.3.7.1 Routine Maintenance and Operations
- 12.3.7.2 Capital Rehabilitation
- 12.3.7.3 Engineering and Advisory
- 12.3.7.4 Digital Monitoring Services
- 12.3.8 Subsegment Pricing and Adoption Trends
- 12.3.9 Leading Suppliers and Competition
- 12.3.10 Regional Demand and Opportunities
- 12.4 By Asset Type - Market Size and Forecast, 2025-2035
- 12.4.1 Segment Definition and Scope
- 12.4.2 Historical Market Size, 2018-2025
- 12.4.3 Revenue Forecast, 2025-2035
- 12.4.4 Volume Forecast, 2025-2035
- 12.4.5 Base-Year Market Share, 2025
- 12.4.6 Segment CAGR and Growth Drivers
- 12.4.7 Subsegment Market Size and Forecast
- 12.4.7.1 Vertical Lift Bridges
- 12.4.7.2 Bascule Bridges
- 12.4.7.3 Swing Bridges
- 12.4.8 Subsegment Pricing and Adoption Trends
- 12.4.9 Leading Suppliers and Competition
- 12.4.10 Regional Demand and Opportunities
- 12.5 By End-Use Sector - Market Size and Forecast, 2025-2035
- 12.5.1 Segment Definition and Scope
- 12.5.2 Historical Market Size, 2018-2025
- 12.5.3 Revenue Forecast, 2025-2035
- 12.5.4 Volume Forecast, 2025-2035
- 12.5.5 Base-Year Market Share, 2025
- 12.5.6 Segment CAGR and Growth Drivers
- 12.5.7 Subsegment Market Size and Forecast
- 12.5.7.1 Public Road Crossings
- 12.5.7.2 Rail Freight Crossings
- 12.5.7.3 Port Service Road Crossings
- 12.5.8 Subsegment Pricing and Adoption Trends
- 12.5.9 Leading Suppliers and Competition
- 12.5.10 Regional Demand and Opportunities
- 12.6 By Contracting Model - Market Size and Forecast, 2025-2035
- 12.6.1 Segment Definition and Scope
- 12.6.2 Historical Market Size, 2018-2025
- 12.6.3 Revenue Forecast, 2025-2035
- 12.6.4 Volume Forecast, 2025-2035
- 12.6.5 Base-Year Market Share, 2025
- 12.6.6 Segment CAGR and Growth Drivers
- 12.6.7 Subsegment Market Size and Forecast
- 12.6.7.1 Term Maintenance Contracts
- 12.6.7.2 Capital Works Contracts
- 12.6.7.3 Professional Services Engagements
- 12.6.8 Subsegment Pricing and Adoption Trends
- 12.6.9 Leading Suppliers and Competition
- 12.6.10 Regional Demand and Opportunities
- 12.7 Segment Growth Comparison
- 12.8 Segment Attractiveness and Priority Matrix
Chapter 13 Australia Heavy Movable Bridges End-Use and Application Market Outlook
- 13.1 End-Use Industry and Customer Demand Structure
- 13.2 Leading Applications and Customer Groups
- 13.3 End-Use Market Size, Share and Forecast
- 13.4 Major End-Use Industry Deep Dives
- 13.4.1 Customer Requirements and Use Cases
- 13.4.2 Demand and Replacement Cycles
- 13.4.3 Technical and Regulatory Considerations
- 13.4.4 Purchasing and Procurement Models
- 13.4.5 Leading Vendors and Distribution Channels
- 13.4.6 Forecast and Commercial Opportunities
- 13.5 Emerging Applications and Cross-Segment Demand
- 13.6 End-Use Industry Investment Priorities
Chapter 14 Australia Heavy Movable Bridges Geographic Market Outlook, 2025-2035
- 14.1 Domestic Market Distribution and Demand Clusters
- 14.2 State- or Province-Wise Market Size and Forecast, 2025-2035
- 14.3 City and Metropolitan Market Outlook
- 14.4 Industrial, Manufacturing and Commercial Clusters
- 14.5 Geographic Concentration of Key End Users
- 14.6 Local Pricing and Purchasing Differences
- 14.7 Domestic Production Facilities and Capacity Map
- 14.8 Local Infrastructure and Project Pipeline
- 14.9 State-Level Policy and Incentive Differences
- 14.10 Subnational Investment Hotspots and Opportunities
- 14.11 Distribution and Logistics Networks
- 14.12 Domestic Competitive Footprint
Chapter 15 Australia Heavy Movable Bridges Technology, Innovation and Sustainability Outlook
- 15.1 Technology Landscape and Maturity
- 15.2 Product, Process and Service Innovation
- 15.3 AI, Automation and Digital Tools in the Industry
- 15.4 Technology Adoption and Performance Benchmarking
- 15.5 Innovation Pipeline and R&D Investment
- 15.6 Patent and Intellectual Property Trends
- 15.7 Energy Efficiency and Resource Management
- 15.8 Sustainability, Recycling and Circularity
- 15.9 Technology Roadmap, 2025-2035
- 15.10 Risks of Obsolescence and Technology Substitution
Chapter 16 Australia Heavy Movable Bridges Market Key Strategic Imperatives
- 16.1 Growth and Market Entry Priorities
- 16.2 High-Return Products and Segments
- 16.3 Pricing, Profitability and Cost Optimization
- 16.4 Technology Investment and Product Differentiation
- 16.5 Supply Chain Localization and Resilience
- 16.6 Distribution and Customer Acquisition
- 16.7 Partnership, Acquisition and Capacity Strategy
- 16.8 Regional Expansion Priorities
- 16.9 Short-, Medium- and Long-Term Actions
Chapter 17 Competition Outlook
- 17.1 Industry Competition Characteristics
- 17.2 Market Structure and Concentration
- 17.3 Market Share and Competitive Positioning, 2025
- 17.4 Company-Wise Revenue and Product Benchmarking
- 17.5 Production and Service Capacity Benchmarking
- 17.6 Technology, Pricing and Differentiation
- 17.7 Regional Footprint and Distribution Strength
- 17.8 Mergers, Acquisitions and Strategic Alliances
- 17.9 New Entrants and Competitive Threats
- 17.10 Porter's Five Forces and Industry Attractiveness
- 17.11 Competitive Outlook, 2025-2035
Chapter 18 Company Profiles
- 18.1 Company Coverage and Selection Criteria
- 18.2 GHD
- 18.2.1 Business Description
- 18.2.2 Company Ownership and Geographic Presence
- 18.2.3 Product and Service Portfolio
- 18.2.4 Manufacturing and Operating Footprint
- 18.2.5 Production Capacity and Expansion Plans
- 18.2.6 Financial Performance and Investment
- 18.2.7 Market Share and Competitive Position
- 18.2.8 Technology and Innovation Capabilities
- 18.2.9 Strategic Alliances or Partnerships
- 18.2.10 Recent Developments
- 18.2.11 Growth Strategy and Outlook
- 18.3 AECOM
- 18.4 Wallbridge Gilbert Aztec
- 18.5 McMahon Services
- 18.6 Custom Fluidpower
- 18.7 Other Relevant Market Participants
Note: Every listed company is profiled on the structure shown under the first company. The company list is preliminary and may change based on research findings, market developments, data availability and client requirements.
Chapter 19 Disclaimer
- 19.1 Research and Forecast Disclaimer
- 19.2 Data Source and Estimation Limitations
Note: The depth of individual sections depends on data availability for this market. Volume, capacity, trade and other unit-based metrics are included where applicable.

