
House starts and precinct paving shape finish demand
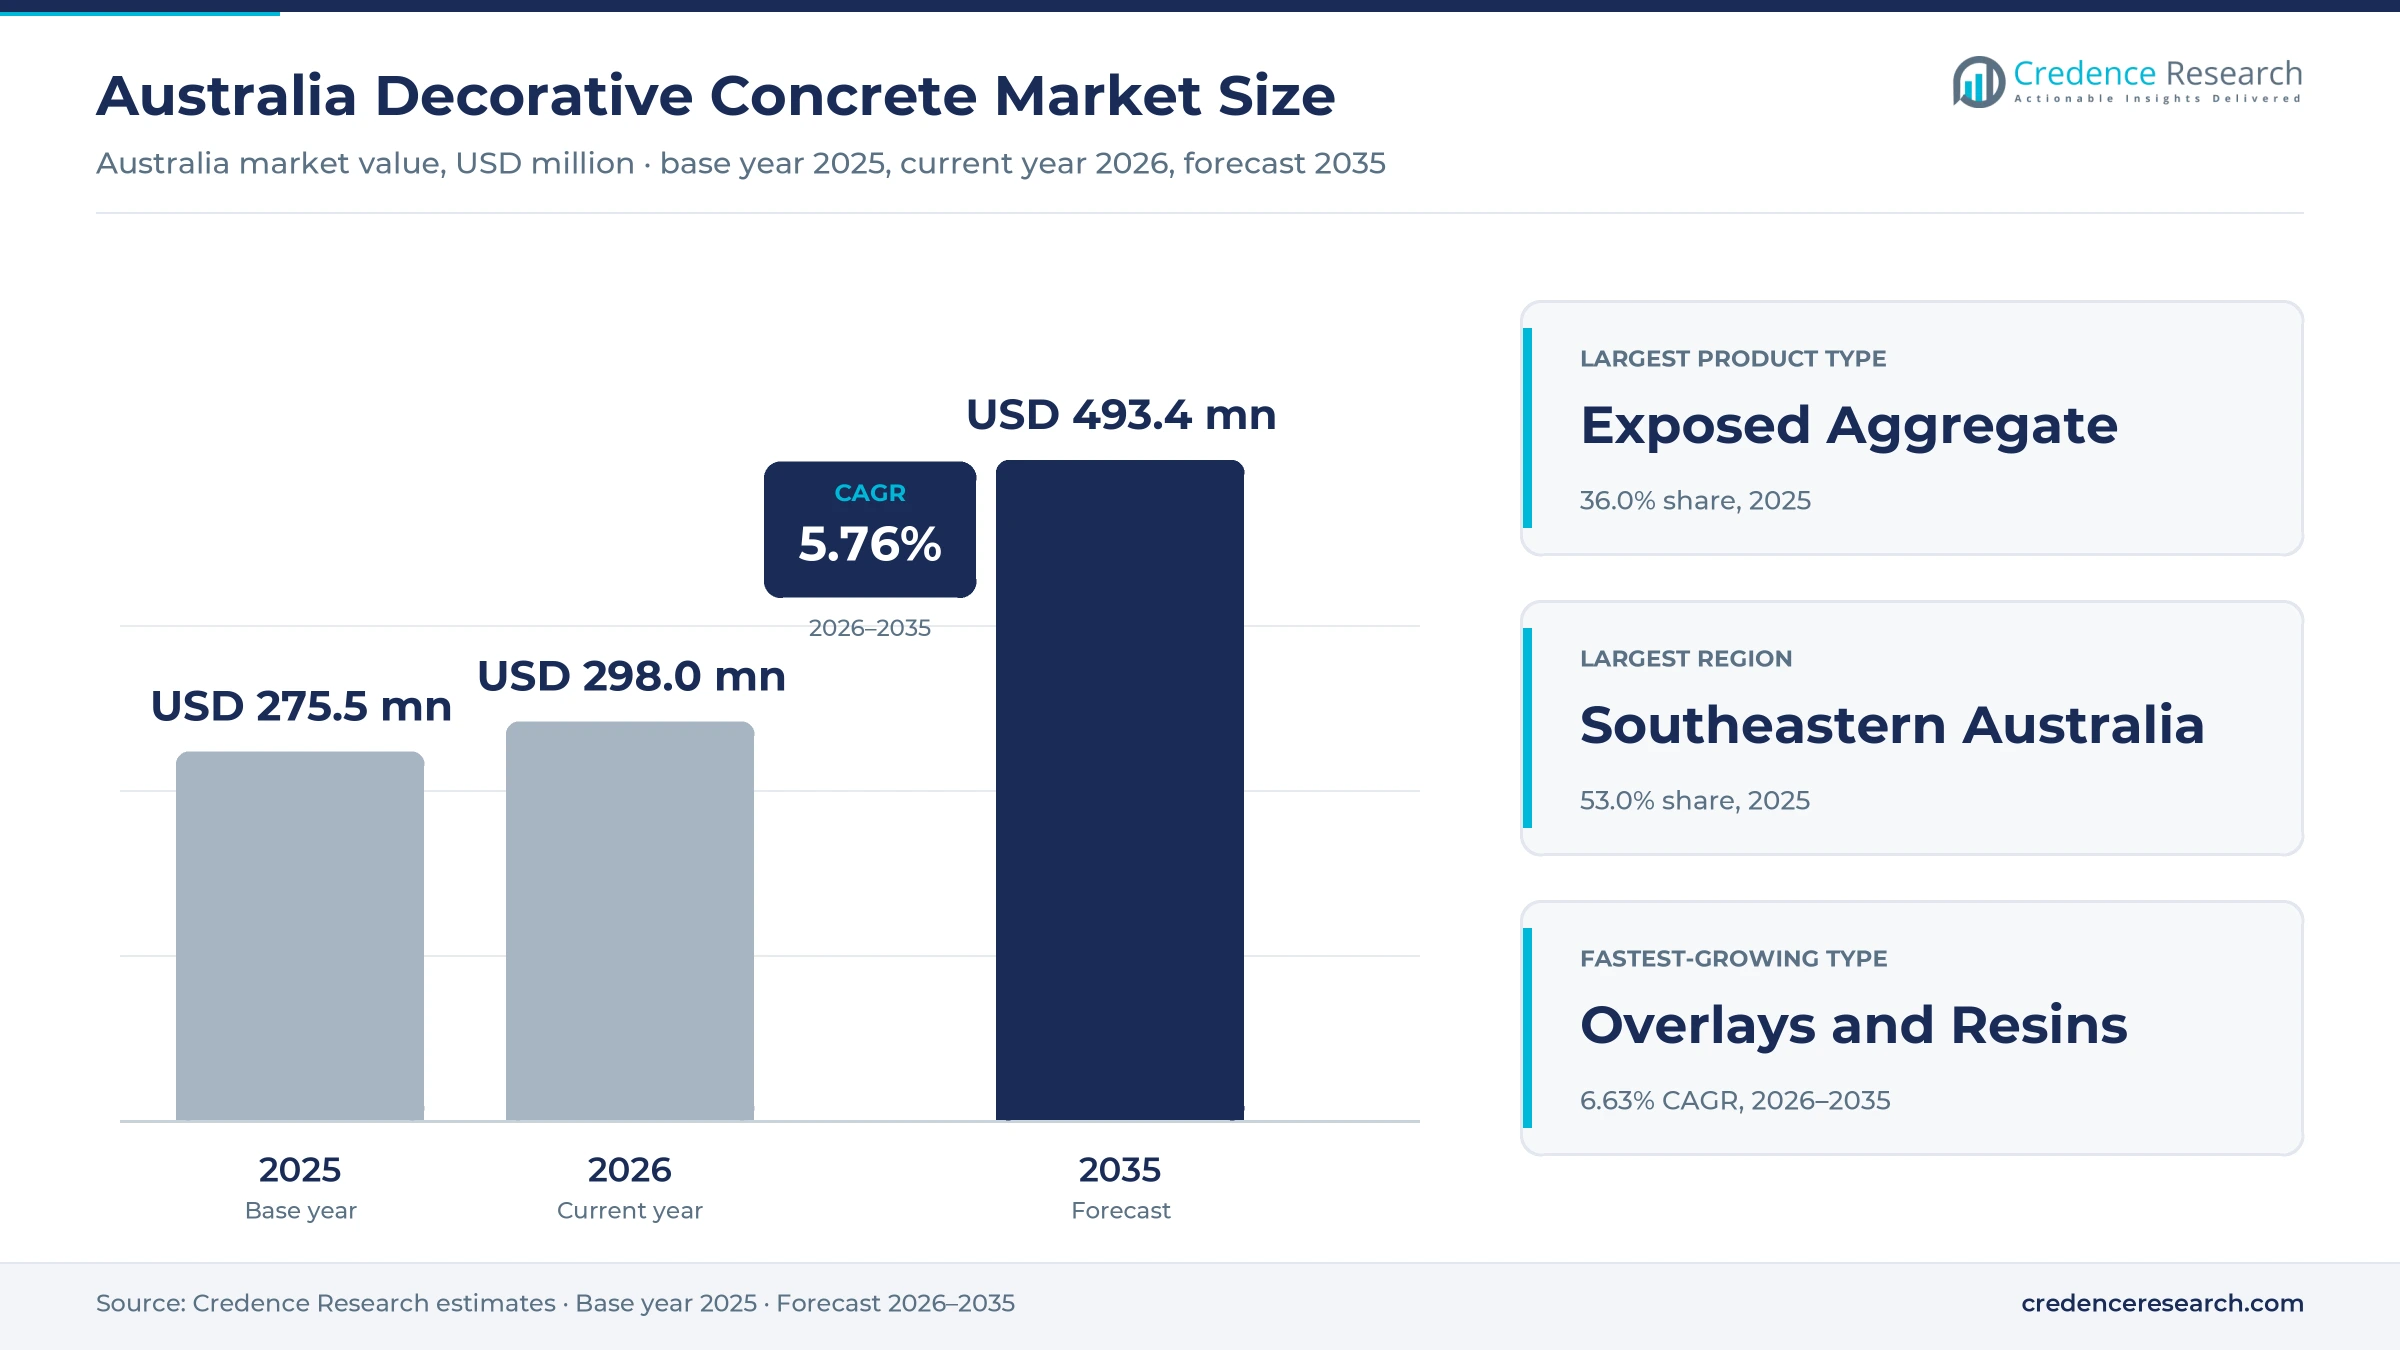
The Australia decorative concrete market was valued at USD 275.5 million in 2025 and is projected to increase from USD 298.0 million in 2026 to USD 493.4 million by 2035, registering a CAGR of 5.76% during 2026–2035. Demand comes from homeowners, volume builders, landscapers, commercial owners and councils that specify exposed, polished, colored and resin finishes for driveways, patios, shop floors and public plazas. Southeastern Australia held the largest regional share, 53.0% in 2025, because Sydney and Melbourne combine the biggest housing pipeline with dense retail, office and civic paving work. Queensland is the fastest-growing region at 6.32% a year, as dwelling starts rise and venue works for the Brisbane 2032 Games begin. At the same time, stricter national silica rules for power-tool processing of concrete since September 2024 are changing how contractors grind, polish and refurbish slabs.
Which architectural concrete finishes does the estimate cover?
The estimate measures the value of decorative ready-mix concrete, pigments, surface treatments, overlays and resin systems, together with the installation work that turns a plain slab into a finished surface. It counts exposed aggregate mixes, ground and polished floors, full-depth colored and stenciled or stamped concrete, and thin cementitious or resin toppings used on new and existing slabs across Australia.
The estimate excludes plain structural concrete, precast paving units, natural stone, ceramic tiles and industrial floor coatings sold only for chemical or wear resistance. The value chain runs from quarries, cement plants and pigment makers through concrete producers and coating suppliers to specialist contractors, builders and councils that place, finish and seal the surfaces on site.
Australia Decorative Concrete Market Insights
- The Australia decorative concrete market was valued at USD 275.5 million in 2025 and is projected to reach USD 493.4 million by 2035, registering a CAGR of 5.76% during 2026–2035.
- Southeastern Australia held a 53.0% share of 2025 value, because New South Wales and Victoria commenced 27,491 dwellings in the June quarter of 2026.
- Exposed aggregate concrete led with a 36.0% share of 2025 value, because slip-resistant stone finishes remain the default choice for driveways, paths and pool surrounds.
- Australia commenced 52,201 dwellings in the June quarter of 2026 in seasonally adjusted terms, as private house commencements climbed to 31,707 from 28,403 a quarter earlier.
- Decorative overlays and resin systems grow fastest at 6.63% a year during 2026–2035, as owners refinish existing slabs in shops, homes and hospitality venues.
Exposed aggregate leads, overlays and resins grow fastest
Why does exposed aggregate hold the largest share?
Based on product type, the market is categorized into exposed aggregate concrete, polished concrete, coloured and patterned concrete, and decorative overlays and resin systems. Exposed aggregate concrete led with a 36.0% share of 2025 value, because local stone finishes give driveways and paths a textured, slip-resistant surface. Decorative overlays and resin systems grow fastest at 6.63% a year, as thin toppings refinish existing slabs without demolition.
How do homes and public precincts split demand?
Based on end-use industry, the market is categorized into residential building, retail and hospitality, offices and community facilities, and public realm and transport precincts. Residential building led with a 58.0% share of 2025 value, because almost every new house adds a driveway, path and alfresco slab. Public realm and transport precincts grow fastest at 6.56% a year, as plazas, stations and venue forecourts are rebuilt.
Why do driveways and outdoor living areas lead?
Based on application, the market is categorized into driveways and outdoor living, interior architectural floors, surface refurbishment and architectural walls and features. Driveways and outdoor living led with 44.0% of 2025 value, because outdoor slabs are large and visible on every detached home. Surface refurbishment grows fastest at 6.38% a year, as owners resurface tired driveways, patios and shop floors instead of replacing them.
How do contractors control most buying decisions?
Based on sales channel, the market is categorized into contractor-led supply and installation, producer-direct contracts, specialist distributor sales and public competitive tenders. Contractor-led supply and installation led with a 52.0% share of 2025 value, because homeowners usually buy a finished surface from one concreter. Public competitive tenders grow fastest at 6.42% a year, as councils and state agencies tender precinct paving.
| Segment Group | Leading Sub-segment | Share, 2025 | Fastest-growing Sub-segment | CAGR, 2026–2035 |
|---|---|---|---|---|
| By Product Type | Exposed aggregate concrete | 36.0% | Decorative overlays and resin systems | 6.63% |
| By End-Use Industry | Residential building | 58.0% | Public realm and transport precincts | 6.56% |
| By Application | Driveways and outdoor living | 44.0% | Surface refurbishment | 6.38% |
| By Sales Channel | Contractor-led supply and installation | 52.0% | Public competitive tenders | 6.42% |
Request a Free Sample
Fill in your details and we'll send you a free sample report.
- Sample data tables & charts
- Research methodology
Housing starts, public precincts and design ranges lift use
How does rising house building convert into finish orders?
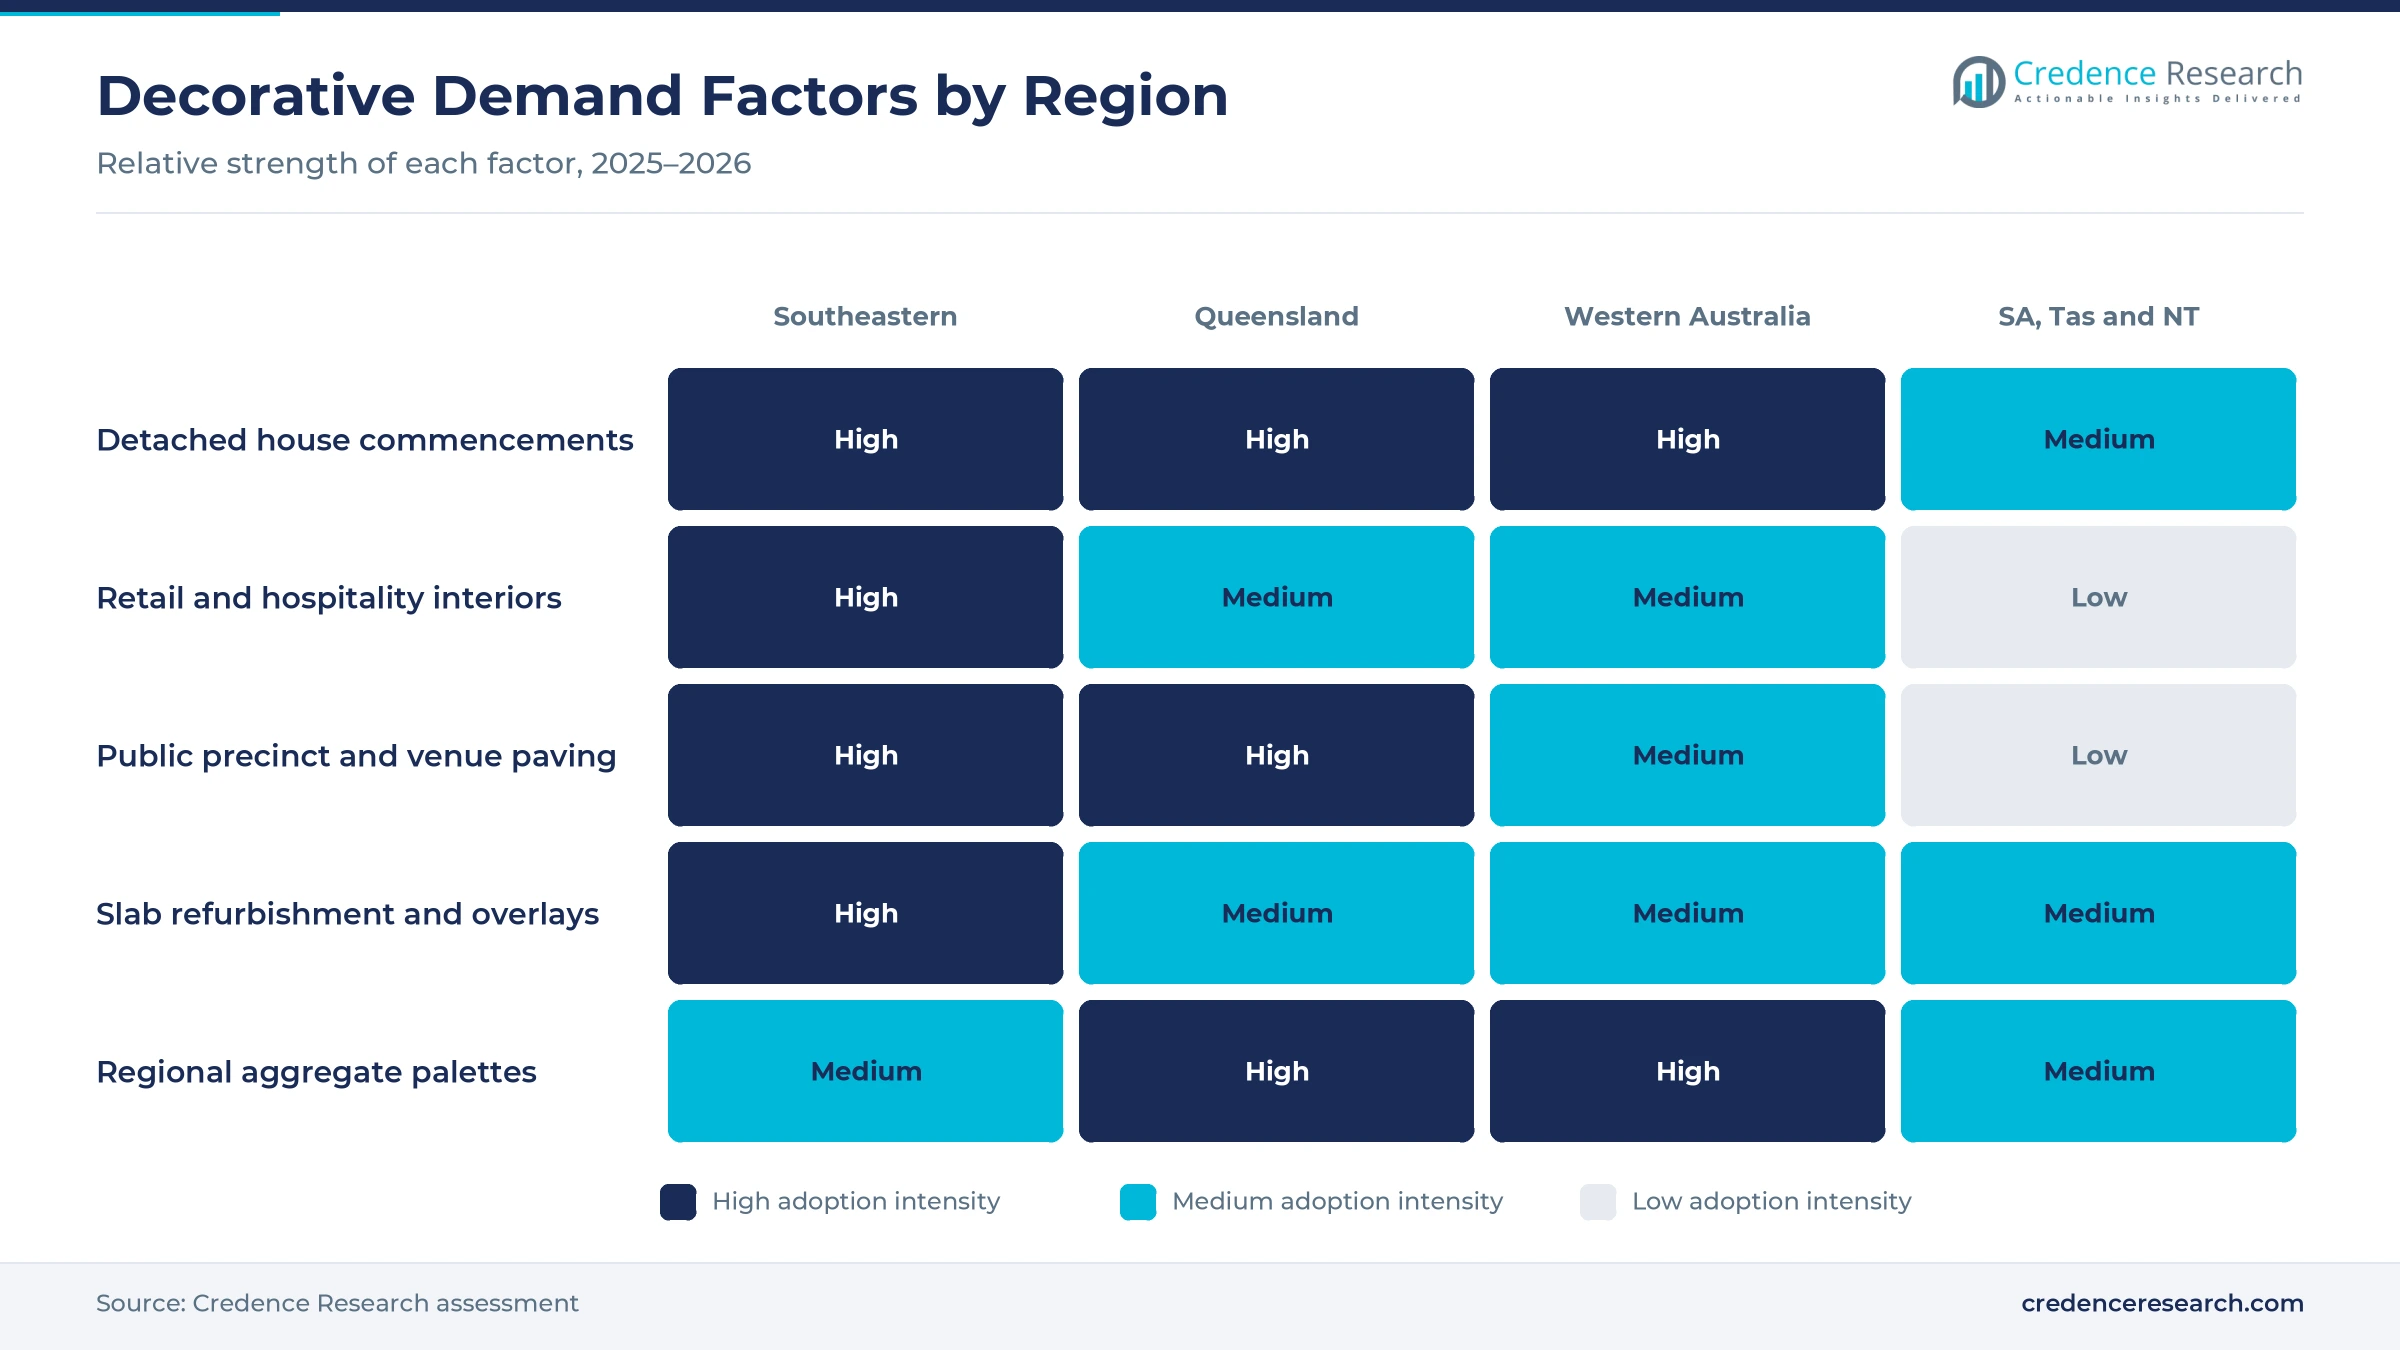
Detached houses carry the largest decorative slabs, because each one needs a driveway, entry path and outdoor living area. The Australian Bureau of Statistics reported 52,201 dwelling commencements in the June quarter of 2026, with private house commencements rising to 31,707 from 28,403 in the March quarter. Private sector house approvals reached 10,885 in August 2026, up 18.4% from a year earlier, according to the same agency. Population growth of 1.53% in 2025, shown in World Bank data, keeps that housing need high. As a result, residential building holds 58.0% of 2025 value, and driveways and outdoor living areas lead applications with 44.0%.
Why does the national housing target lift forward demand?
Governments have set a delivery target that keeps volume builders and their concreters busy through the end of the decade. The Treasury says National Cabinet agreed in August 2023 to a target of 1.2 million new well-located homes over five years from mid-2024. National Cabinet also endorsed A$3.5 billion in Commonwealth payments to state, territory and local governments to support delivery of those homes. Builders in Western Australia commenced 7,240 dwellings in the June quarter of 2026, up from 5,872 a year earlier, the Australian Bureau of Statistics reported. That buying pattern explains why contractor-led supply and installation holds 52.0% of 2025 value, because most house-and-land buyers order the finished slab through their builder or concreter.
How do public precinct projects convert into paving work?
Plazas, station forecourts, footpaths and venue concourses use long runs of honed, exposed and colored concrete that councils specify for slip resistance and durability. The Queensland government announced on June 23, 2026 that its 2026-27 budget starts works on Brisbane Stadium at Victoria Park within an A$7.1 billion Games venue provision. The same budget commits A$417 million to venues across the state. Infrastructure Australia's 2025 Infrastructure Market Capacity Report, as reported by Infrastructure Magazine, put building projects at A$77 billion within an A$242 billion public pipeline. The City of Sydney footway specification requires new pavers to reach a P4 or P5 wet slip rating under HB 198. Those projects help public realm and transport precincts grow at 6.56% a year.
Why do branded design ranges raise value per square meter?
Producers now sell decorative concrete as a named design product rather than a commodity mix, which lifts the price per installed square meter. Holcim Australia's Geostone brand introduced a South East Queensland Range with 24 new decorative colors and a Melbourne Range of 28 new products. Boral sells Exposé exposed aggregate, boralstone polished concrete and Colori oxides that color the full depth of the slab. Hanson Australia announced its rebrand to Heidelberg Materials Australia in November 2024, and the company now markets imagecrete in color, polished and exposed versions. Private house commencements rose 20.7% in the year to the June quarter of 2026, which widens the pool of slabs that can take an upgraded finish. In turn, branded ranges widen the price gap between plain and finished slabs.
Regional color ranges, low-carbon mixes and overlays
How is the shift to regional aggregate palettes changing ranges?
Producers are tying color ranges to local quarries, so a driveway in Perth or Cairns shows stone from its own region. Boral says its Western Australian decorative ranges draw on aggregates sourced from Western Australian quarries, with blends such as Swanbourne and Two Rocks. The company offers a separate Far North Queensland range built on aggregates from that region's quarries. Holcim Australia says its Geostone South East Queensland Range uses natural stone sourced from regional Queensland and adds 24 new colors. Western Australia's dwelling commencements rose about 23% in the year to the June quarter of 2026, which gives Perth blends a growing local base. Local palettes give builders a design story without the freight cost of imported stone, which helps exposed aggregate concrete keep 36.0% of 2025 value.
Why are councils asking for low-carbon decorative mixes?
Developers and councils now ask for embodied-carbon data on visible concrete, which pushes decorative ranges toward lower-carbon binders. Boral says its Exposé exposed aggregate range is available in ENVISIA low carbon concrete while keeping strength and appearance. Holcim Australia lists ECOPact low-carbon concrete beside Geostone in its ready-mix range. Holcim also says Geostone is made from locally sourced materials, which shortens haulage from quarry to site. The value of total building work done reached A$45.8 billion in the June quarter of 2026 in chain volume terms, official data show, so small carbon cuts per cubic meter add up. Public competitive tenders grow fastest at 6.42% a year as councils write low-carbon finishes into specifications, part of a broader push across building construction for greener materials.
Can thin toppings win indoor refurbishment work?
Cementitious and resin toppings let owners create a polished or seamless look on an existing slab, which avoids the cost and downtime of new concrete. ARDEX Australia offers its panDOMO range in Floor, FloorPlus, Loft, TerrazzoMicro and Wall versions for decorative floors and walls. MAPEI used its Ultratop self-leveling cementitious topping for seamless flooring at the Platypus Shoes store on the Gold Coast in 2016. Flowcrete Australia supplies decorative commercial resin finishes, a niche within the wider floor coatings business. Residential alterations and additions approved were worth A$1.28 billion in August 2026, the Australian Bureau of Statistics said. Steady renovation spending lets surface refurbishment grow at 6.38% a year.
Is there an opening in builder-integrated outdoor packages?
Volume builders increasingly bundle driveways, paths and alfresco slabs into house-and-land packages, which turns decorative concrete into a standard upgrade sold at contract signing. Concretus, a member of the ABN Group with an almost 20-year history, supplies and installs concrete for that group's home-building companies in Western Australia and offers a full range of decorative products. Concrete Colour Systems, a Queensland family company established in 1994, sells full-depth color, LuxStone polished concrete, Stylepave overlays and sealers nationwide. Total dwelling commencements rose 14.4% in the year to the June quarter of 2026, the Australian Bureau of Statistics reported. In turn, builders can pair finished slabs with landscaping products and lift value per home.
Silica rules, labor gaps and project swings weigh on work
How do silica dust rules raise grinding costs?
Grinding, polishing and cutting concrete release respirable crystalline silica, which exposes workers to serious lung disease. Under rules in force from Sept. 1, 2024, Safe Work Australia says stronger duties apply to materials with 1% or more crystalline silica, and it lists concrete among them. High-risk processing needs a silica risk control plan and worker training. As a result, polishing contractors spend more on wet cutting, dust extraction and paperwork, which squeezes margins for small crews.
Why do labor shortages slow finishing crews?
Decorative work needs skilled finishers who time washing, grinding and sealing to the weather and the cure of each slab. Infrastructure Australia estimated that the industry is about 141,000 workers short of what the public pipeline requires. In turn, concreters move between public projects and house slabs, which stretches lead times for homeowners. Suppliers respond with training, showroom support and simpler products, but skilled exposed aggregate and polishing crews remain scarce in outer growth suburbs.
How do commercial approval swings disrupt planning?
Retail, office and hospitality projects carry the highest-value interior finishes, so swings in approvals hit the most profitable work first. The value of non-residential building approved fell 44.8% to A$5.53 billion in August 2026, the Australian Bureau of Statistics reported. As a result, polishing and overlay contractors can face gaps between large jobs. Firms that also serve homes and council work smooth these gaps, while specialists that depend on one commercial builder carry more risk.
Why does natural color variation create disputes?
Decorative concrete uses quarry stone, cement and oxides that vary from batch to batch, so the finished color can differ from a showroom sample. Boral warns that its decorative concrete contains natural quarry materials, so some variation in appearance and consistency may occur. In turn, homeowners may reject a driveway that looks lighter or darker than expected. Producers respond with regional sample boards and clear disclaimers, while contractors pour large areas from one batch where they can.
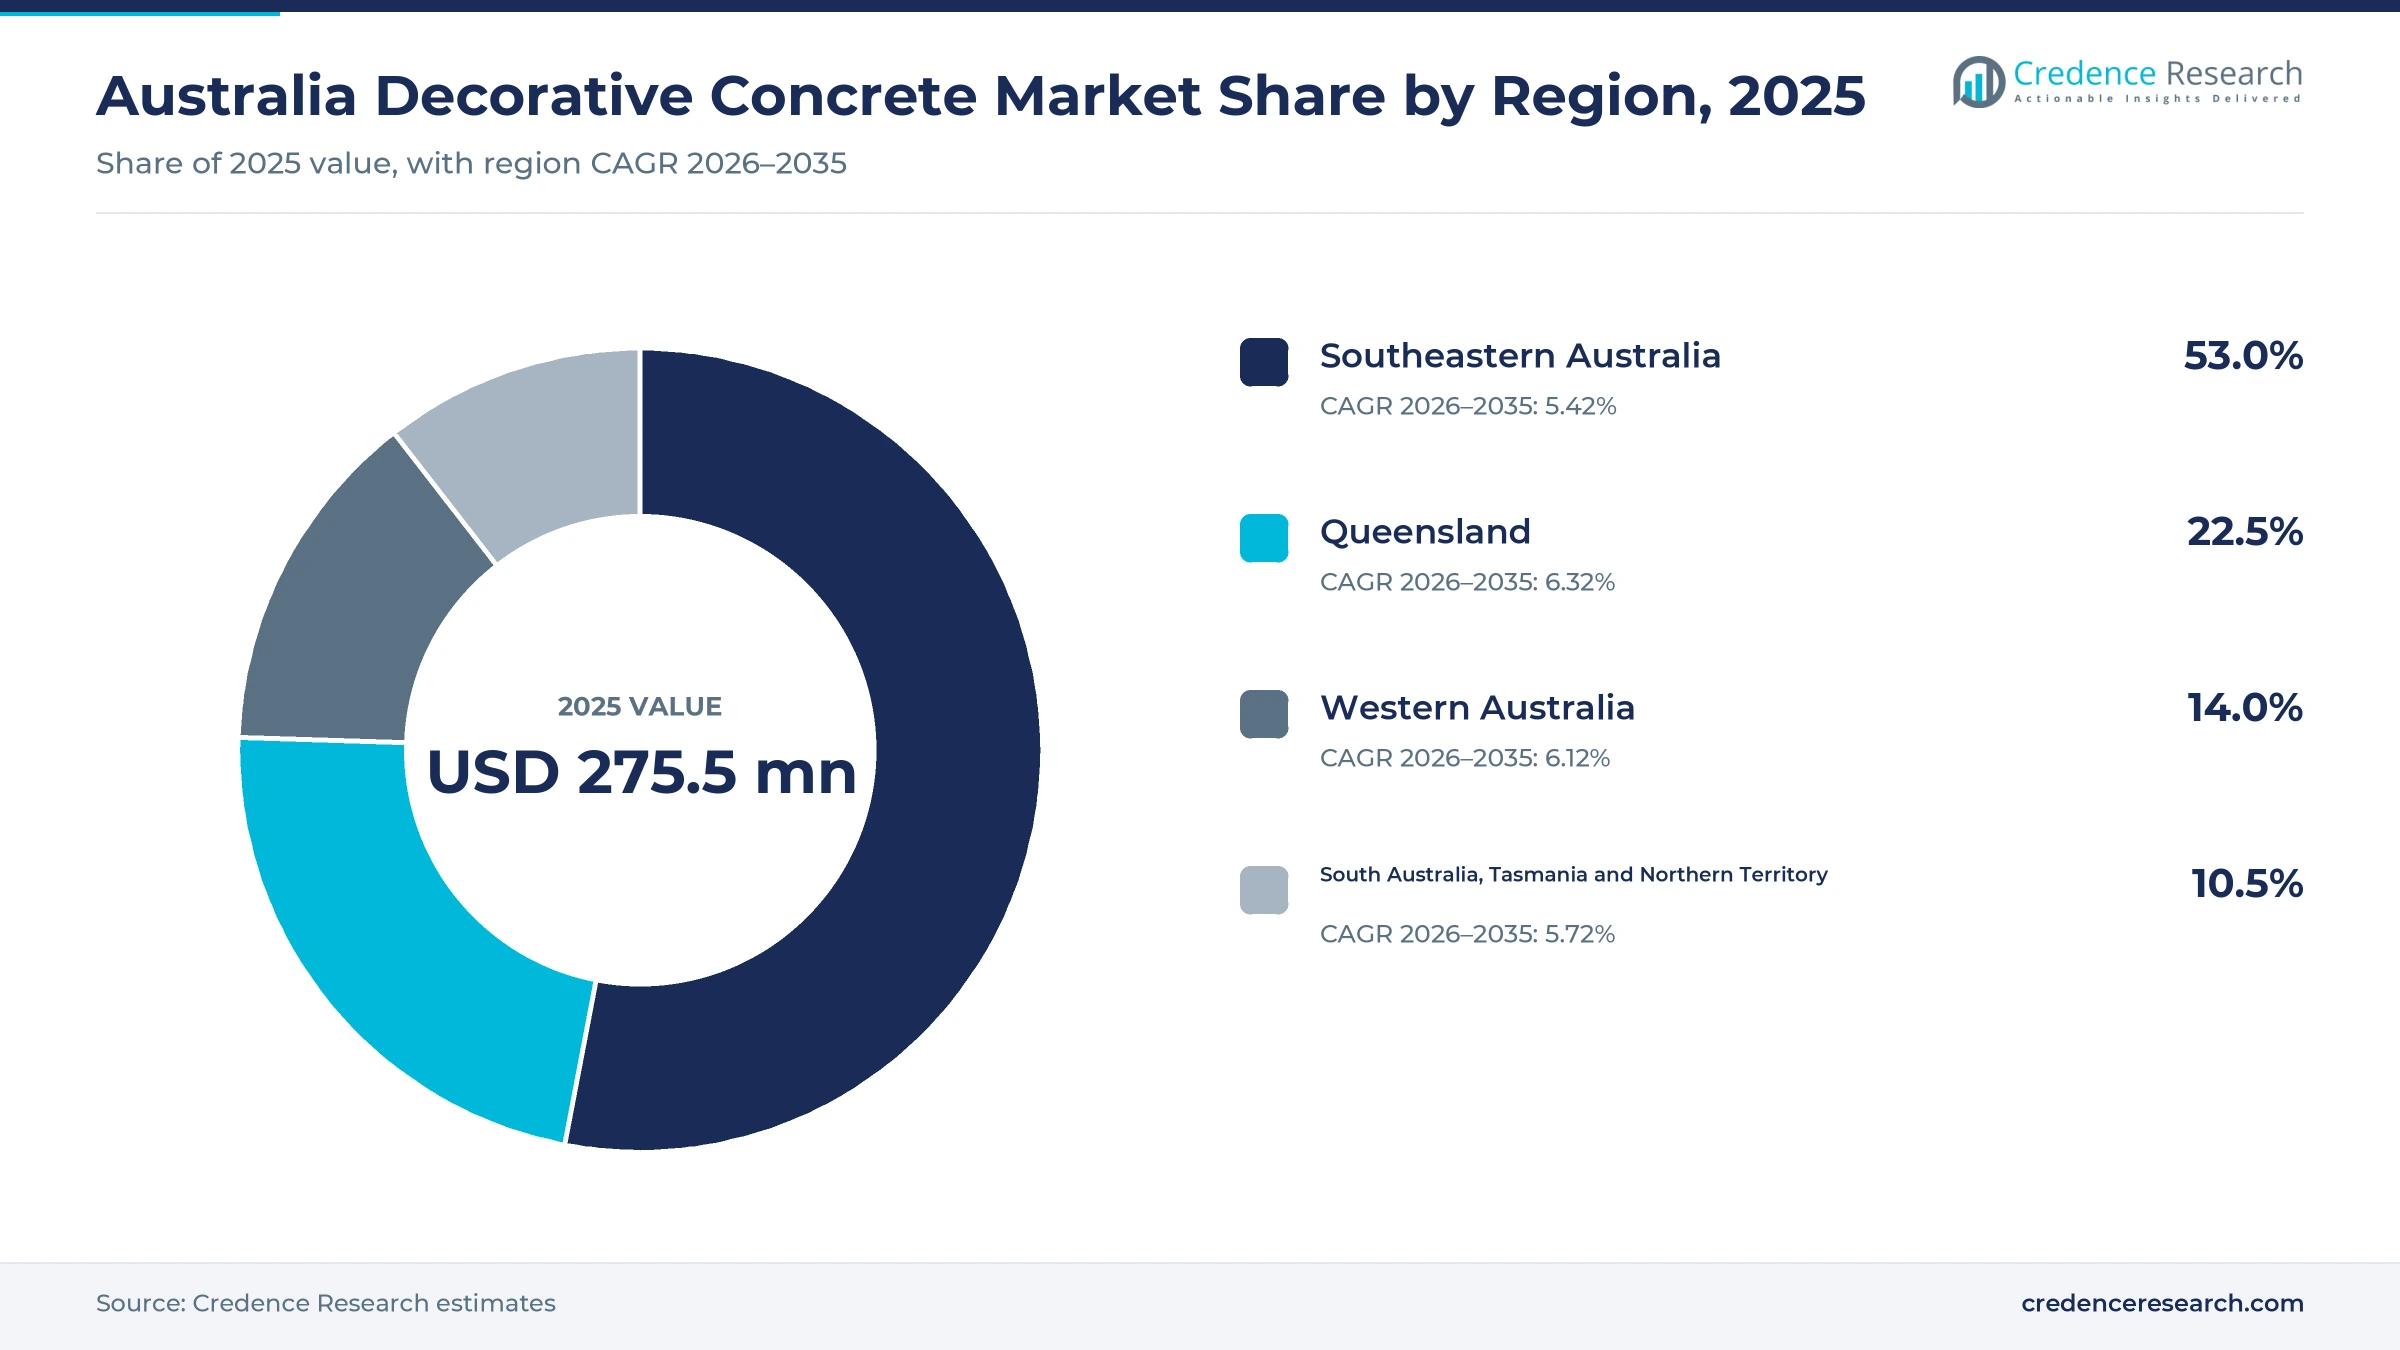
Southeastern Australia leads as Queensland grows fastest
| Region | Value, 2025 (USD million) | Share, 2025 | CAGR, 2026–2035 |
|---|---|---|---|
| Southeastern Australia | 146.0 | 53.0% | 5.42% |
| Queensland | 62.0 | 22.5% | 6.32% |
| Western Australia | 38.6 | 14.0% | 6.12% |
| South Australia, Tasmania and Northern Territory | 28.9 | 10.5% | 5.72% |
Southeastern Australia leads on housing and civic paving
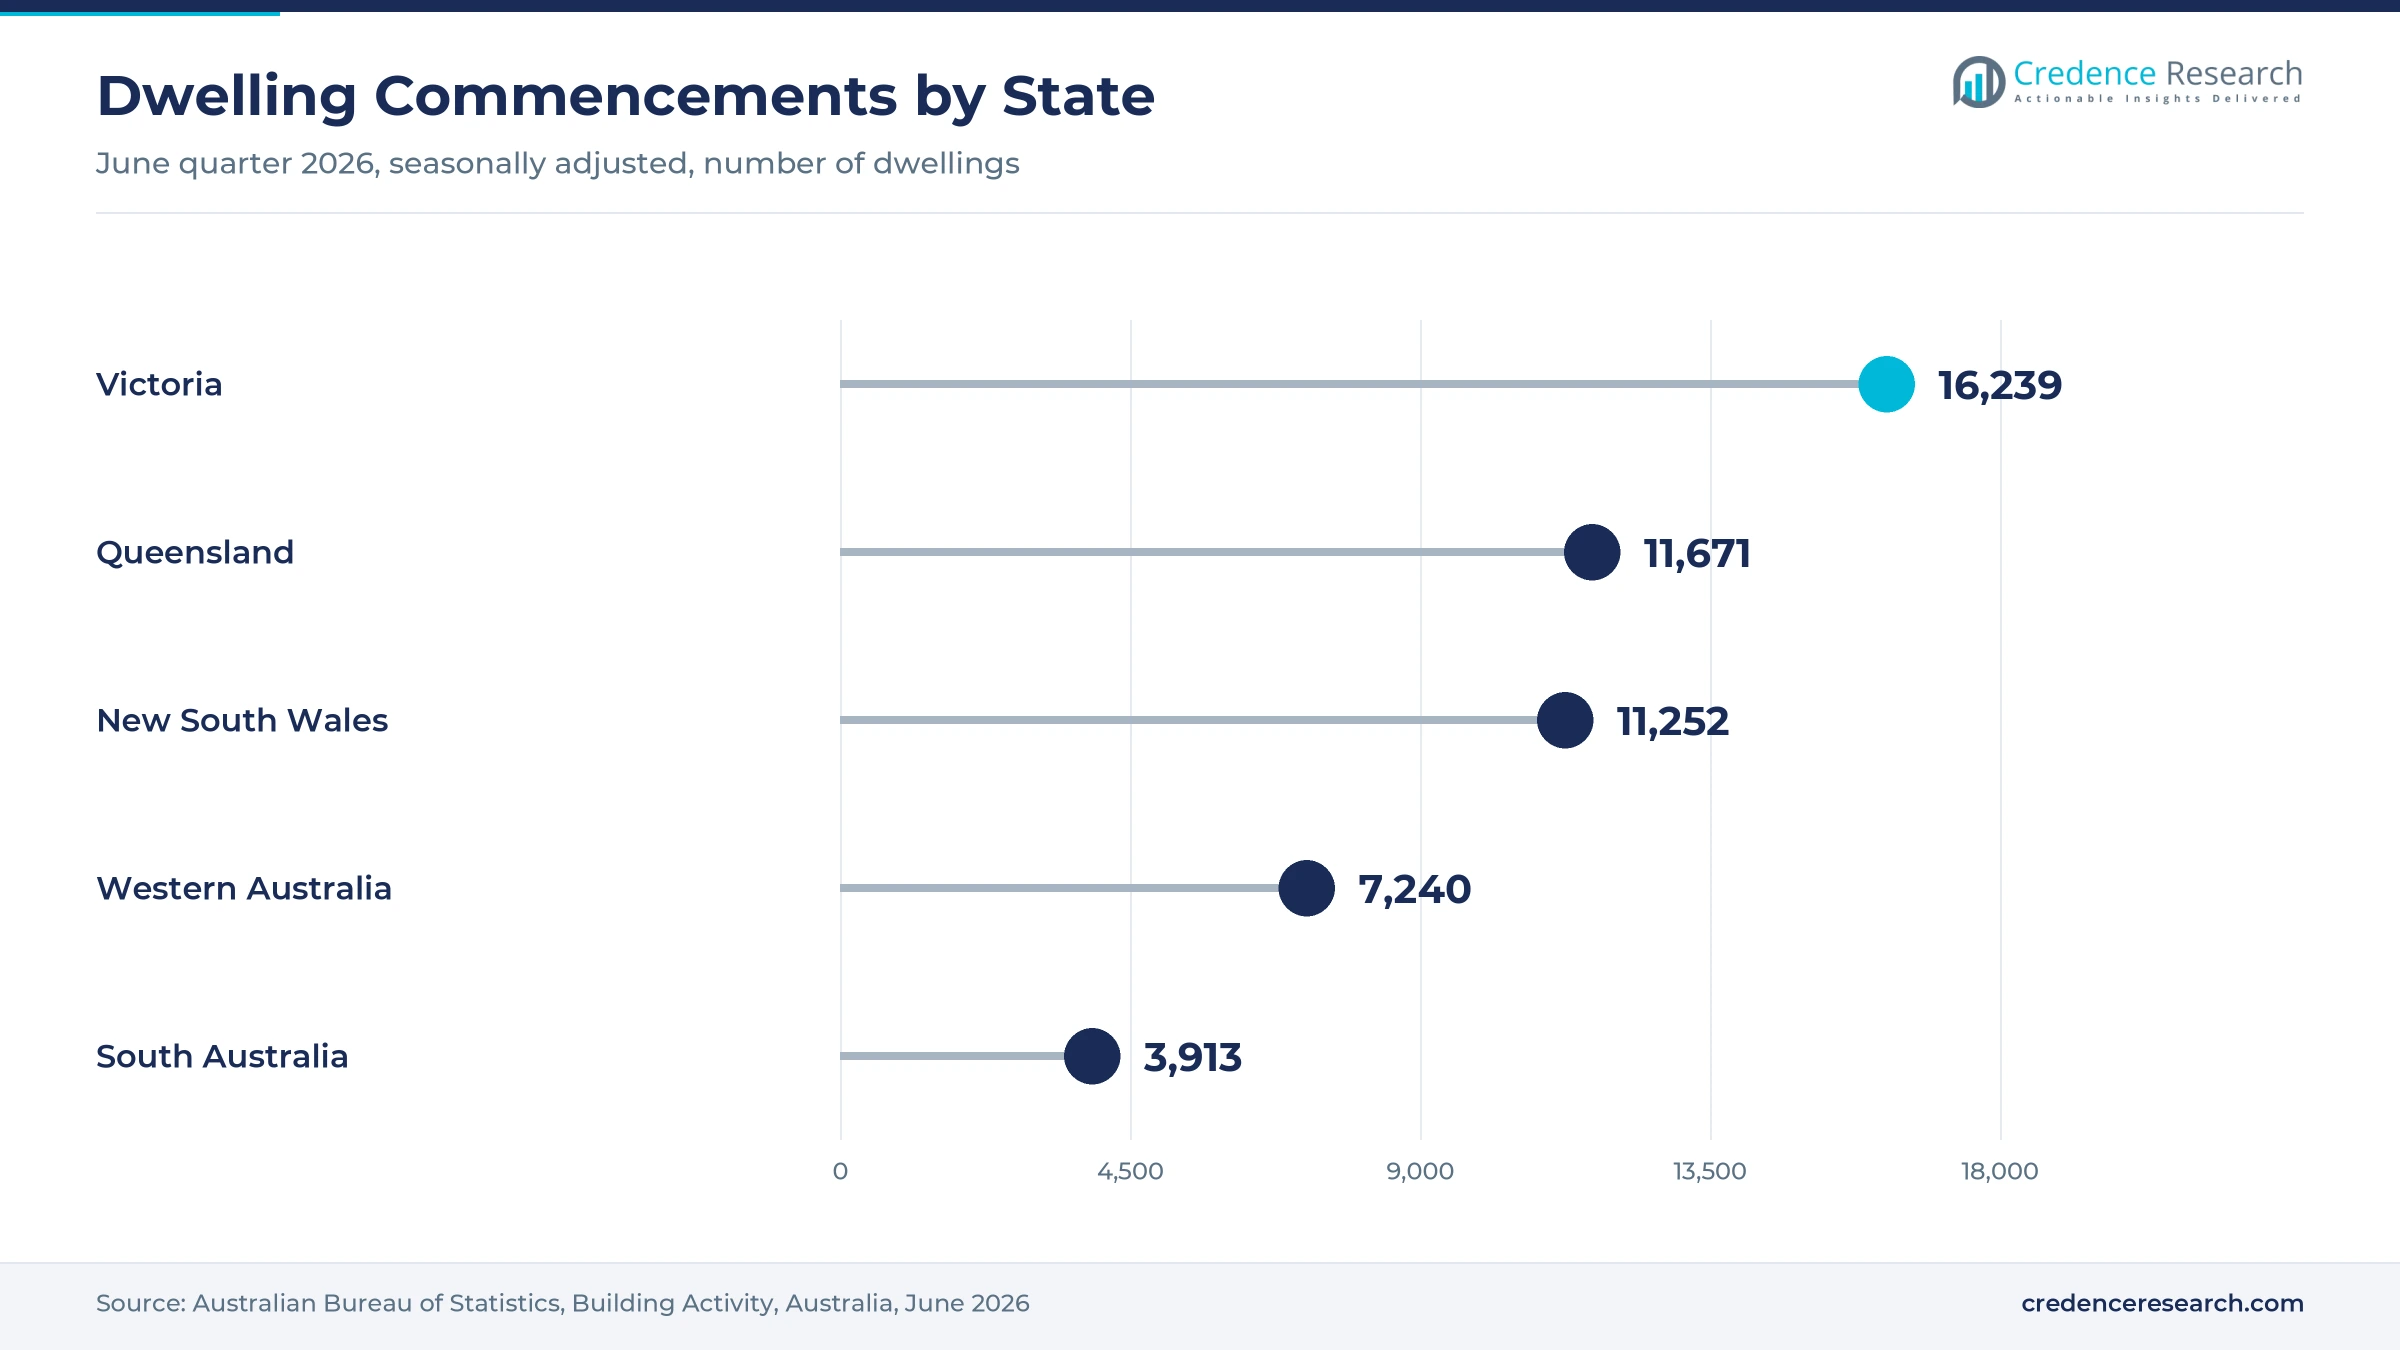
Southeastern Australia held a 53.0% share of 2025 value and grows at 5.42% a year, because Sydney and Melbourne combine the largest housing pipeline with dense retail and civic paving. Victoria commenced 16,239 dwellings and New South Wales 11,252 in the June quarter of 2026, according to the Australian Bureau of Statistics. Holcim Australia's Melbourne Range of 28 decorative products serves this zone. With that mix, the zone should keep the largest share of polished and exposed work to 2035.
How does Queensland become the fastest-growing region?
Queensland held a 22.5% share of 2025 value and grows fastest at 6.32% a year, because housing and Games venue work are both rising. The state commenced 11,671 dwellings in the June quarter of 2026, up from 9,550 a year earlier. Its 2026-27 budget starts works on Brisbane Stadium at Victoria Park, which adds forecourt and concourse paving to the state's pipeline. Queensland therefore adds the most new demand for outdoor, precinct and polished finishes.
Western Australia gains from the house-building upswing
Western Australia held a 14.0% share of 2025 value and grows at 6.12% a year, because detached house building in Perth is climbing fast. The state commenced 7,240 dwellings in the June quarter of 2026, up from 5,872 a year earlier. Boral sells exposed blends named after Perth coastal suburbs, and Concretus installs decorative concrete for ABN Group builders. As a result, driveways and alfresco areas take most of the zone's spending.
Why do South Australia, Tasmania and the NT grow steadily?
South Australia, Tasmania and Northern Territory held a 10.5% share of 2025 value and grow at 5.72% a year, because Adelaide drives most of the zone's volume. South Australia commenced 3,913 dwellings in the June quarter of 2026, up from 3,281 a year earlier. Boral offers a dedicated South Australian decorative range for local builders. In turn, steady house building keeps exposed aggregate driveways at the center of demand.
Ownership changes, silica rules and Games venue funding
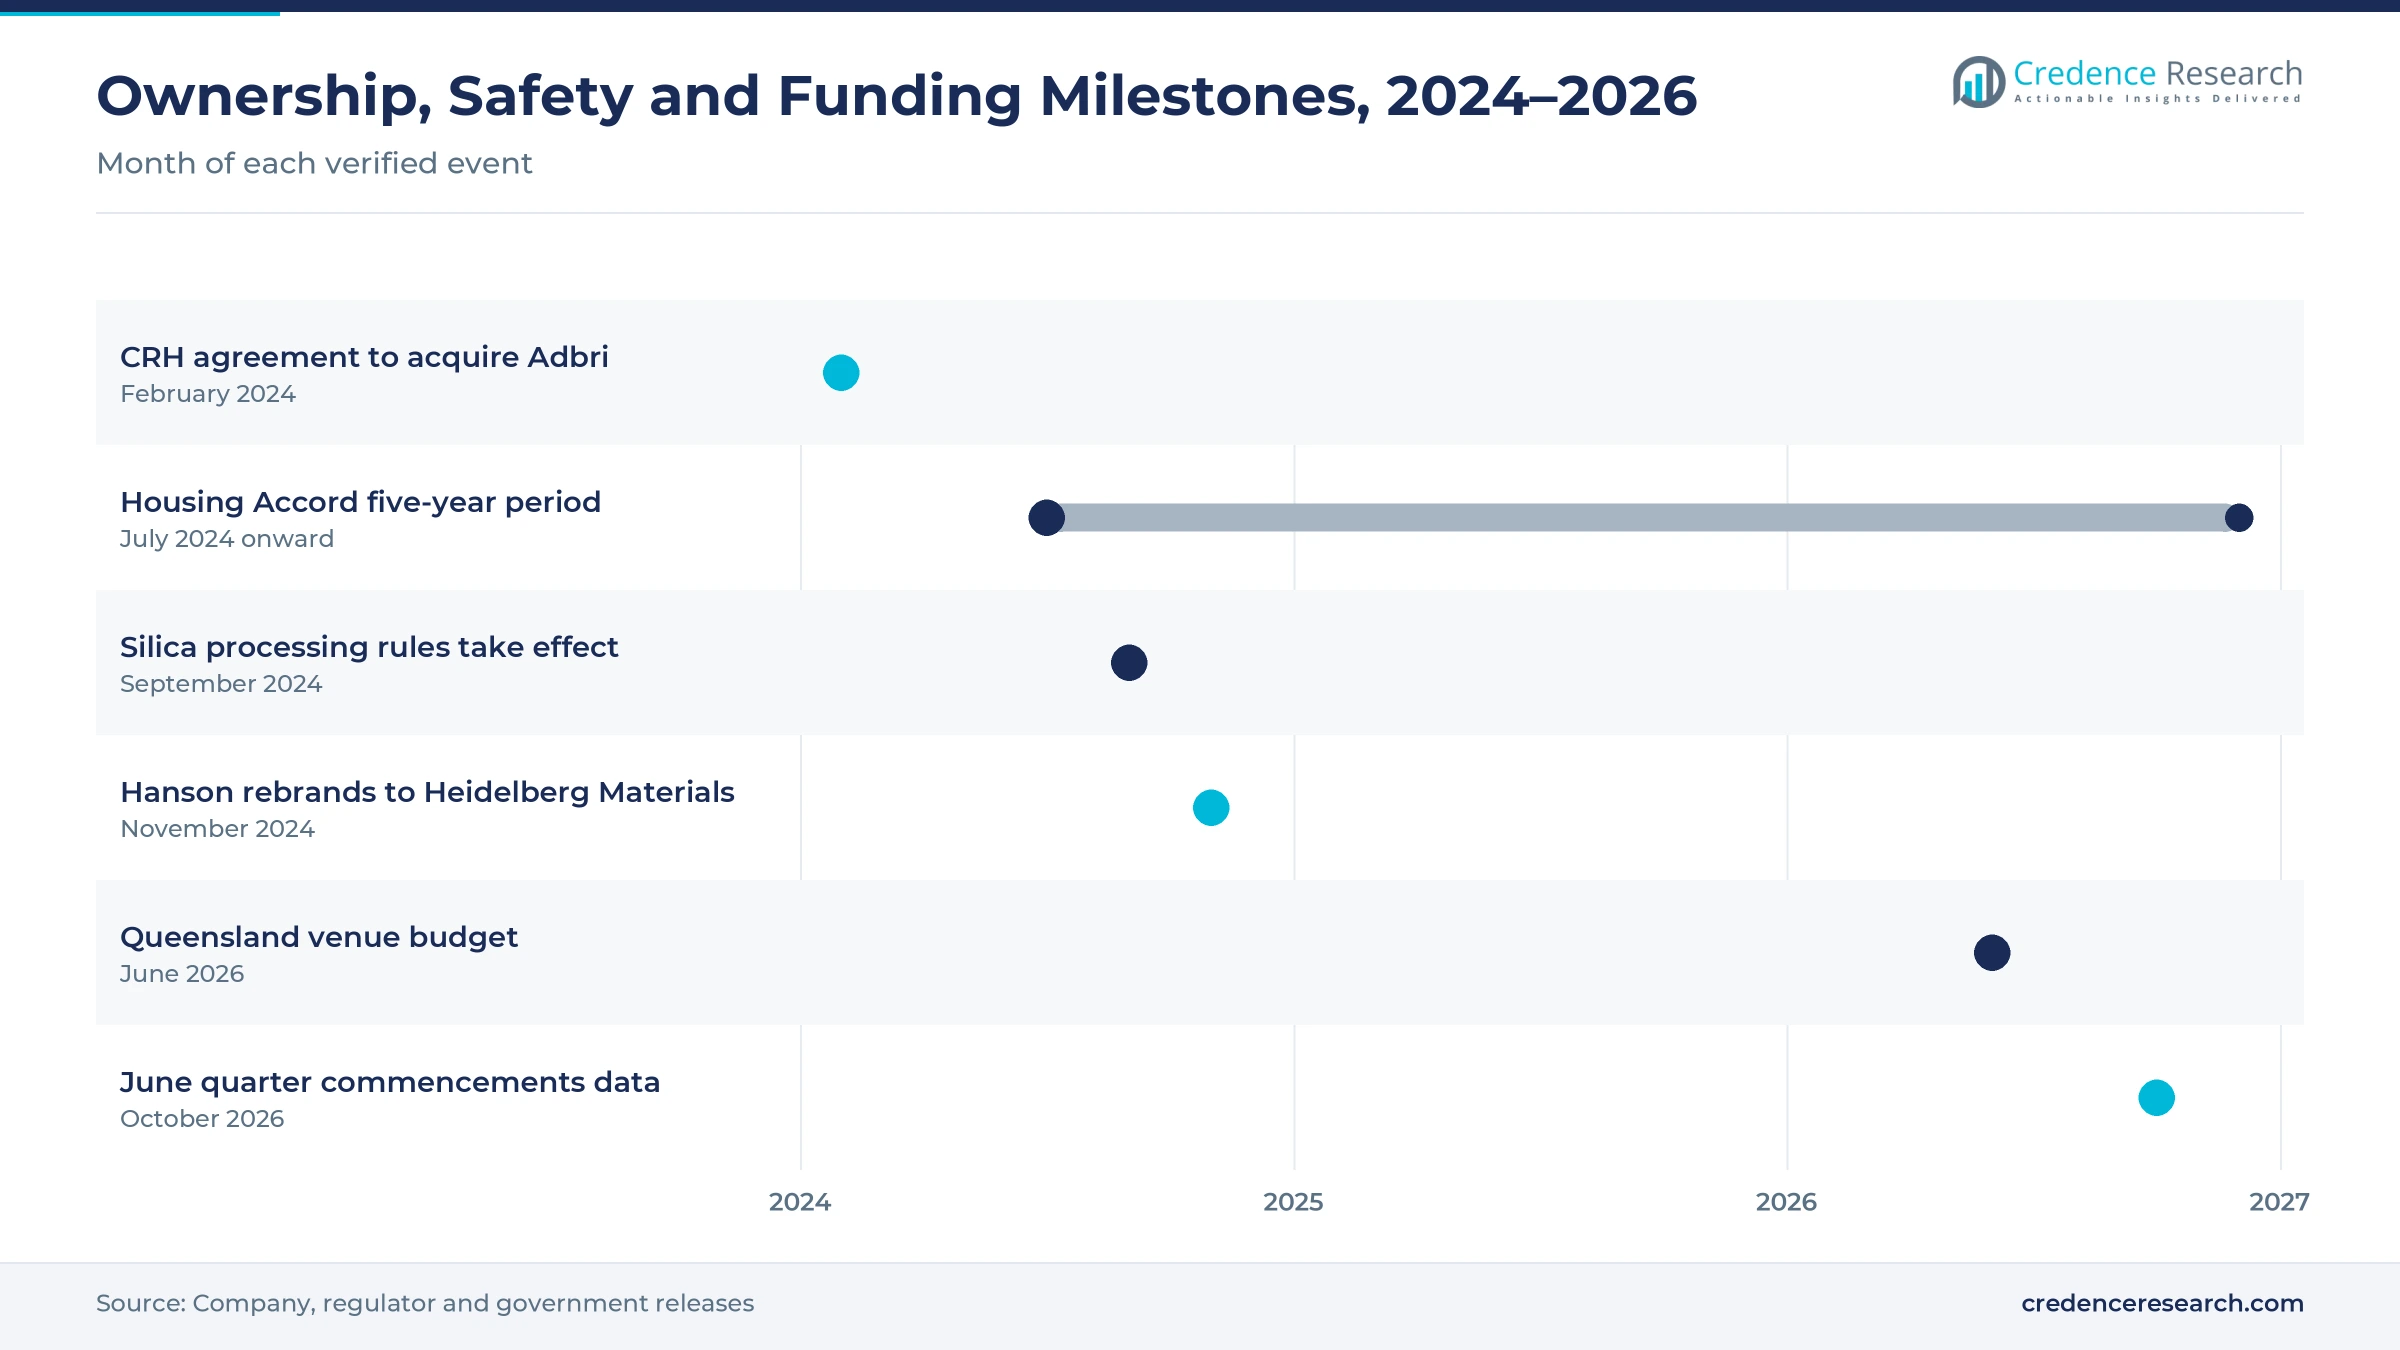
| Development | Status and market relevance |
|---|---|
| In July 2024, CRH acquired a majority stake in Adbri after signing a binding agreement in February 2024. | Consolidates a major Australian cement and concrete supplier under new ownership |
| In September 2024, stronger national rules for processing crystalline silica substances took effect. | Raises dust control and training needs for grinding and polishing crews |
| In June 2026, the Queensland government started Brisbane Stadium works in its 2026-27 budget. | Opens venue forecourt and precinct paving work within an A$7.1 billion provision |
| In August 2026, private sector house approvals reached 10,885, up 18.4% on a year earlier. | Points to a larger pipeline of driveways and outdoor living slabs in 2027 |
| In October 2026, official data showed 52,201 dwelling commencements in the June quarter. | Confirms rising house starts that feed decorative finish orders |
Surface retarders, oxides, grinding and thin toppings
- Surface retarders and washing delay the set of the top layer, which lets crews wash away fines and reveal the stone in exposed aggregate driveways and paths.
- Mineral oxide pigments color the concrete through its full depth, which keeps driveways and patios uniform when the surface wears or chips.
- Diamond grinding and densifiers cut and harden the slab surface in stages, which produces honed or polished floors for homes, shops and offices.
- Cementitious and resin toppings bond a thin decorative layer to an existing slab, which gives a seamless finish without breaking out the old concrete.
Need a Custom Version of This Report?
Tailor the scope, geography, or segments to your exact requirements.
- Custom geography or segment scope
- Direct access to our analyst team
Concrete producers and coating specialists split the work
Competition splits between concrete producers that sell branded decorative mixes and specialist suppliers of pigments, overlays and resins. Boral sells Exposé, boralstone and Colori through regional ranges and showrooms. Holcim Australia markets Geostone with city and regional palettes, and Heidelberg Materials Australia sells imagecrete. Ownership has also shifted, because CRH completed its acquisition of a majority stake in Adbri, an Australian cement and concrete group, on July 1, 2024. Concrete Colour Systems supplies color, sealers, overlays and epoxy systems, including polyaspartic coatings, from Queensland. ARDEX Australia, MAPEI and Flowcrete Australia compete in thin toppings and decorative resin floors for commercial interiors. Sika Australia, founded in 1976 and employing more than 300 people, supplies resin flooring and cement leveling systems, and it opened a combined Bibra Lake plant in Western Australia in July 2016. Concretus competes as an installer inside a builder group in Western Australia. Suppliers win work through sample boards, contractor training and fast delivery of matched batches.
Which producers and specialists lead decorative supply?
| Company | Type | Role in the market |
|---|---|---|
| Boral | Concrete producer | Sells Exposé exposed aggregate, boralstone polished and Colori colored concrete |
| Holcim Australia | Concrete producer | Markets Geostone with South East Queensland and Melbourne ranges |
| Heidelberg Materials Australia | Concrete producer | Sells imagecrete color, polished and exposed concrete |
| Concrete Colour Systems | Pigment and coating maker | Supplies full-depth color, LuxStone polish and Stylepave overlays |
| ARDEX Australia | Topping supplier | Offers panDOMO decorative floor and wall toppings |
| MAPEI Australia | Topping supplier | Supplies Ultratop self-leveling cementitious flooring |
| Flowcrete Australia | Resin flooring supplier | Supplies decorative commercial resin floor finishes |
| Sika Australia | Construction chemicals supplier | Supplies resin flooring and cement leveling systems |
| Concretus | Installer | Supplies and installs decorative concrete for ABN Group builders in Western Australia |
Credence Research view on Australian architectural finishes
Credence Research's view is that Australian decorative concrete demand will grow steadily because new houses, public precincts and refurbishment all need durable finished surfaces. Exposed aggregate remains the largest product type, while overlays and resin systems grow fastest as owners refinish existing slabs. Queensland gains most from rising starts and Games venue works. Producers that combine regional palettes, low-carbon options and trained installer networks should win the most builder loyalty and council specifications by 2035, provided contractors manage silica controls well.
How the national architectural finish estimate was built
The report uses 2025 as the base year on a calendar basis, and market values come from the Credence Research model. That model combines official dwelling commencement and approval statistics, population data, workplace safety guidance, public budget statements and company product information. Segment splits, regional shares and regional growth rates are Credence Research estimates, with regional shares based on dwelling commencements by state. Sources used are government and regulator pages, statistical releases, company websites and trade media, and no interviews or surveys were used.
Housing delivery and precinct works carry growth to 2035
The Australia decorative concrete market is expected to reach USD 493.4 million by 2035, a 5.76% CAGR during 2026–2035, as builders deliver more homes and councils upgrade plazas, stations and venue forecourts. Growth should be strongest in overlays and resin systems, public precincts and Queensland, because refurbishment and Games works add new surface area each year. Silica compliance costs, labor shortages and swings in commercial approvals could slow some work, while regional palettes and low-carbon mixes should support higher value per square meter.
Frequently Asked Questions
How big is the Australia decorative concrete market?
Which product type leads decorative concrete spending?
Which region leads the market?
How does house building support demand?
How do silica rules affect polishing contractors?
Why are overlays and resin systems growing quickly?
Who are the leading companies in the market?
What are the main challenges for suppliers?
Table of Content
Chapter 1 Market Segmentation
- 1.1 Segmentation Framework
- 1.1.1 Product and Service Classification
- 1.1.2 Application and End-Use Classification
- 1.1.3 Technology and Solution Classification
- 1.1.4 Customer and Distribution Channel Classification
- 1.1.5 Geographic Segmentation
- 1.1.6 Market Segment Definitions and Boundaries
- 1.2 By Product Type
- 1.2.1 Exposed aggregate concrete
- 1.2.2 Polished concrete
- 1.2.3 Coloured and patterned concrete
- 1.2.4 Decorative overlays and resin systems
- 1.3 By End-Use Industry
- 1.3.1 Residential building
- 1.3.2 Retail and hospitality
- 1.3.3 Offices and community facilities
- 1.3.4 Public realm and transport precincts
- 1.4 By Application
- 1.4.1 Driveways and outdoor living
- 1.4.2 Interior architectural floors
- 1.4.3 Surface refurbishment
- 1.4.4 Architectural walls and features
- 1.5 By Sales Channel
- 1.5.1 Contractor-led supply and installation
- 1.5.2 Producer-direct contracts
- 1.5.3 Specialist distributor sales
- 1.5.4 Public competitive tenders
Chapter 2 Introduction
- 2.1 Report Objectives and Scope
- 2.2 Product Definition and Industry Terminology
- 2.3 Market Inclusions and Exclusions
- 2.4 Research Process
- 2.4.1 Primary Research and Expert Interviews
- 2.4.2 Secondary Research and Source Review
- 2.4.3 Top-Down and Bottom-Up Estimation
- 2.4.4 Data Triangulation and Verification
- 2.5 Market Size Measurement Basis
- 2.5.1 2025: USD 275.5 million → 2035: USD 493.4 million
- 2.6 Historical and Forecast Reference Periods
- 2.6.1 Historical Period: 2018-2025
- 2.6.2 Base Year: 2025
- 2.6.3 Forecast Period: 2025-2035
- 2.7 Research Assumptions and Limitations
Chapter 3 Executive Summary
- 3.1 Market Snapshot and Key Findings
- 3.2 Base-Year Market Size, 2025
- 3.3 Forecast Market Size, 2035
- 3.4 Revenue and Volume Growth Outlook
- 3.5 Key Demand and Supply Indicators
- 3.6 Leading Market Segments
- 3.7 Fastest-Growing Market Opportunities
- 3.8 Regional Performance Highlights
- 3.9 Technology and Industry Transformation
- 3.10 Competitive Landscape Summary
- 3.11 Analyst View and Strategic Implications
Chapter 4 Australia Decorative Concrete Market Trends and Developments
- 4.1 Historical Industry Development, 2018-2025
- 4.2 Recent Market Trends and Developments
- 4.3 Demand and Customer Behavior Trends
- 4.4 Technology and Product Innovation
- 4.5 Artificial Intelligence, Automation and Digitalization
- 4.6 Local Manufacturing and Supply Chain Realignment
- 4.7 Industry Partnerships, Mergers and Acquisitions
- 4.8 Sustainability and Circular Economy Developments
- 4.9 Government and Private Sector Investment Trends
- 4.10 Emerging Business Models and Commercialization
- 4.11 Industry Developments and Announcements
Chapter 5 Australia Decorative Concrete Market Production, Supply and Demand Analysis
- 5.1 Demand Trend and Consumption Analysis, 2018-2025
- 5.2 Demand Forecast, 2025-2035
- 5.3 Production and Output Trend, 2018-2025
- 5.4 Production and Output Forecast, 2025-2035
- 5.5 Installed Capacity and Capacity Utilization
- 5.6 Company-Wise Production Plants and Statistics
- 5.6.1 Installed Production Capacity
- 5.6.2 Actual Production
- 5.6.3 Planned Capacity and Expansion Targets
- 5.7 Supply Chain Structure and Procurement Trends
- 5.8 Supply-Demand Gap and Bottlenecks
- 5.9 Import Dependence and Sourcing Structure
- 5.10 Contract Manufacturing and Outsourcing
- 5.11 Regional Supply and Demand Concentration
Chapter 6 Australia Decorative Concrete Market Pricing Analysis
- 6.1 Pricing Structure and Measurement
- 6.2 Historical Pricing Trends, 2018-2025
- 6.3 Pricing Outlook, 2025-2035
- 6.4 Average Selling Price and Unit Economics
- 6.5 Pricing by Product and Market Segment
- 6.6 Geographic Pricing Differences
- 6.7 Key Input, Energy, Labor and Logistics Costs
- 6.8 Contract Pricing and Purchasing Models
- 6.9 Pricing Sensitivity and Competitive Positioning
- 6.10 Price, Margin and Profitability Implications
Chapter 7 Australia Decorative Concrete Market Dynamics
- 7.1 Market Growth Drivers
- 7.1.1 Demand-Side Drivers
- 7.1.2 Technology and Innovation Drivers
- 7.1.3 Infrastructure and Investment Drivers
- 7.1.4 Regulatory and Policy Drivers
- 7.2 Market Restraints
- 7.2.1 Cost and Affordability Constraints
- 7.2.2 Technology and Adoption Barriers
- 7.2.3 Supply Chain and Operational Constraints
- 7.3 Market Challenges
- 7.3.1 Competitive Pressure and Margin Erosion
- 7.3.2 Skills, Infrastructure and Implementation Gaps
- 7.4 Emerging Market Opportunities
- 7.5 Market Dynamics Impact and Time-Horizon Assessment
Chapter 8 Australia Decorative Concrete Value Chain Analysis
- 8.1 Industry Value Chain Overview
- 8.2 Upstream Suppliers and Critical Inputs
- 8.3 Technology and Component Providers
- 8.4 Manufacturing or Service Delivery
- 8.5 Distribution, Channel Partners and Integrators
- 8.6 Downstream Applications and End Users
- 8.7 Value Addition and Profit Pools
- 8.8 Vertical Integration and Outsourcing
- 8.9 Supplier Concentration and Risk
- 8.10 Supply Chain Localization and Resilience
Chapter 9 Australia Decorative Concrete Market Regulations and Policies
- 9.1 Relevant Laws, Standards and Compliance Frameworks
- 9.2 Product, Service, Safety and Quality Requirements
- 9.3 Government Policies, Incentives and Subsidies
- 9.4 Imports, Exports and Trade Barriers
- 9.5 Public Procurement and Local Content Requirements
- 9.6 Environmental and Sustainability Compliance
- 9.7 Upcoming Policy Changes and Market Implications
Chapter 10 Australia Decorative Concrete Market Hotspots and Opportunities
- 10.1 Market Opportunity Mapping and Growth Hotspots
- 10.2 High-Growth Applications and Customer Groups
- 10.3 Underserved Markets and White-Space Opportunities
- 10.4 Emerging Technology and Product Opportunities
- 10.5 New Capacity and Investment Hotspots
- 10.6 Market Entry and Expansion Opportunities
- 10.7 Distribution and Partnership Opportunities
- 10.8 Near-Term and Long-Term Commercial Potential
- 10.9 Opportunity Attractiveness and Execution Risks
Chapter 11 Australia Decorative Concrete Market Outlook, 2025-2035
- 11.1 Market Size and Analysis
- 11.1.1 Revenue (Market Measurement: 2025: USD 275.5 million → 2035: USD 493.4 million)
- 11.1.2 Market Volume and Quantity Sold
- 11.1.3 Historical Market Size, 2018-2025
- 11.1.4 Base-Year Market Size, 2025
- 11.2 Market Forecast, 2025-2035
- 11.2.1 Revenue Forecast to 2035
- 11.2.2 Volume Forecast to 2035
- 11.2.3 CAGR and Year-on-Year Growth
- 11.2.4 Incremental Revenue Opportunity
- 11.3 Forecast Assumptions and Scenario Analysis
- 11.3.1 Base-Case Forecast
- 11.3.2 Optimistic and Conservative Scenarios
- 11.3.3 Technology, Pricing and Policy Sensitivities
- 11.4 Market Attractiveness and Growth Outlook
Chapter 12 Australia Decorative Concrete Market Segmentation and Outlook
- 12.1 Segmentation Summary and Market Shares, 2025
- 12.2 Largest and Fastest-Growing Segments
- 12.3 By Product Type - Market Size and Forecast, 2025-2035
- 12.3.1 Segment Definition and Scope
- 12.3.2 Historical Market Size, 2018-2025
- 12.3.3 Revenue Forecast, 2025-2035
- 12.3.4 Volume Forecast, 2025-2035
- 12.3.5 Base-Year Market Share, 2025
- 12.3.6 Segment CAGR and Growth Drivers
- 12.3.7 Subsegment Market Size and Forecast
- 12.3.7.1 Exposed aggregate concrete
- 12.3.7.2 Polished concrete
- 12.3.7.3 Coloured and patterned concrete
- 12.3.7.4 Decorative overlays and resin systems
- 12.3.8 Subsegment Pricing and Adoption Trends
- 12.3.9 Leading Suppliers and Competition
- 12.3.10 Regional Demand and Opportunities
- 12.4 By End-Use Industry - Market Size and Forecast, 2025-2035
- 12.4.1 Segment Definition and Scope
- 12.4.2 Historical Market Size, 2018-2025
- 12.4.3 Revenue Forecast, 2025-2035
- 12.4.4 Volume Forecast, 2025-2035
- 12.4.5 Base-Year Market Share, 2025
- 12.4.6 Segment CAGR and Growth Drivers
- 12.4.7 Subsegment Market Size and Forecast
- 12.4.7.1 Residential building
- 12.4.7.2 Retail and hospitality
- 12.4.7.3 Offices and community facilities
- 12.4.7.4 Public realm and transport precincts
- 12.4.8 Subsegment Pricing and Adoption Trends
- 12.4.9 Leading Suppliers and Competition
- 12.4.10 Regional Demand and Opportunities
- 12.5 By Application - Market Size and Forecast, 2025-2035
- 12.5.1 Segment Definition and Scope
- 12.5.2 Historical Market Size, 2018-2025
- 12.5.3 Revenue Forecast, 2025-2035
- 12.5.4 Volume Forecast, 2025-2035
- 12.5.5 Base-Year Market Share, 2025
- 12.5.6 Segment CAGR and Growth Drivers
- 12.5.7 Subsegment Market Size and Forecast
- 12.5.7.1 Driveways and outdoor living
- 12.5.7.2 Interior architectural floors
- 12.5.7.3 Surface refurbishment
- 12.5.7.4 Architectural walls and features
- 12.5.8 Subsegment Pricing and Adoption Trends
- 12.5.9 Leading Suppliers and Competition
- 12.5.10 Regional Demand and Opportunities
- 12.6 By Sales Channel - Market Size and Forecast, 2025-2035
- 12.6.1 Segment Definition and Scope
- 12.6.2 Historical Market Size, 2018-2025
- 12.6.3 Revenue Forecast, 2025-2035
- 12.6.4 Volume Forecast, 2025-2035
- 12.6.5 Base-Year Market Share, 2025
- 12.6.6 Segment CAGR and Growth Drivers
- 12.6.7 Subsegment Market Size and Forecast
- 12.6.7.1 Contractor-led supply and installation
- 12.6.7.2 Producer-direct contracts
- 12.6.7.3 Specialist distributor sales
- 12.6.7.4 Public competitive tenders
- 12.6.8 Subsegment Pricing and Adoption Trends
- 12.6.9 Leading Suppliers and Competition
- 12.6.10 Regional Demand and Opportunities
- 12.7 Segment Growth Comparison
- 12.8 Segment Attractiveness and Priority Matrix
Chapter 13 Australia Decorative Concrete End-Use and Application Market Outlook
- 13.1 End-Use Industry and Customer Demand Structure
- 13.2 Leading Applications and Customer Groups
- 13.3 End-Use Market Size, Share and Forecast
- 13.4 Major End-Use Industry Deep Dives
- 13.4.1 Customer Requirements and Use Cases
- 13.4.2 Demand and Replacement Cycles
- 13.4.3 Technical and Regulatory Considerations
- 13.4.4 Purchasing and Procurement Models
- 13.4.5 Leading Vendors and Distribution Channels
- 13.4.6 Forecast and Commercial Opportunities
- 13.5 Emerging Applications and Cross-Segment Demand
- 13.6 End-Use Industry Investment Priorities
Chapter 14 Australia Decorative Concrete Geographic Market Outlook, 2025-2035
- 14.1 Domestic Market Distribution and Demand Clusters
- 14.2 State- or Province-Wise Market Size and Forecast, 2025-2035
- 14.3 City and Metropolitan Market Outlook
- 14.4 Industrial, Manufacturing and Commercial Clusters
- 14.5 Geographic Concentration of Key End Users
- 14.6 Local Pricing and Purchasing Differences
- 14.7 Domestic Production Facilities and Capacity Map
- 14.8 Local Infrastructure and Project Pipeline
- 14.9 State-Level Policy and Incentive Differences
- 14.10 Subnational Investment Hotspots and Opportunities
- 14.11 Distribution and Logistics Networks
- 14.12 Domestic Competitive Footprint
Chapter 15 Australia Decorative Concrete Technology, Innovation and Sustainability Outlook
- 15.1 Technology Landscape and Maturity
- 15.2 Product, Process and Service Innovation
- 15.3 AI, Automation and Digital Tools in the Industry
- 15.4 Technology Adoption and Performance Benchmarking
- 15.5 Innovation Pipeline and R&D Investment
- 15.6 Patent and Intellectual Property Trends
- 15.7 Energy Efficiency and Resource Management
- 15.8 Sustainability, Recycling and Circularity
- 15.9 Technology Roadmap, 2025-2035
- 15.10 Risks of Obsolescence and Technology Substitution
Chapter 16 Australia Decorative Concrete Market Key Strategic Imperatives
- 16.1 Growth and Market Entry Priorities
- 16.2 High-Return Products and Segments
- 16.3 Pricing, Profitability and Cost Optimization
- 16.4 Technology Investment and Product Differentiation
- 16.5 Supply Chain Localization and Resilience
- 16.6 Distribution and Customer Acquisition
- 16.7 Partnership, Acquisition and Capacity Strategy
- 16.8 Regional Expansion Priorities
- 16.9 Short-, Medium- and Long-Term Actions
Chapter 17 Competition Outlook
- 17.1 Industry Competition Characteristics
- 17.2 Market Structure and Concentration
- 17.3 Market Share and Competitive Positioning, 2025
- 17.4 Company-Wise Revenue and Product Benchmarking
- 17.5 Production and Service Capacity Benchmarking
- 17.6 Technology, Pricing and Differentiation
- 17.7 Regional Footprint and Distribution Strength
- 17.8 Mergers, Acquisitions and Strategic Alliances
- 17.9 New Entrants and Competitive Threats
- 17.10 Porter's Five Forces and Industry Attractiveness
- 17.11 Competitive Outlook, 2025-2035
Chapter 18 Company Profiles
- 18.1 Company Coverage and Selection Criteria
- 18.2 Boral
- 18.2.1 Business Description
- 18.2.2 Company Ownership and Geographic Presence
- 18.2.3 Product and Service Portfolio
- 18.2.4 Manufacturing and Operating Footprint
- 18.2.5 Production Capacity and Expansion Plans
- 18.2.6 Financial Performance and Investment
- 18.2.7 Market Share and Competitive Position
- 18.2.8 Technology and Innovation Capabilities
- 18.2.9 Strategic Alliances or Partnerships
- 18.2.10 Recent Developments
- 18.2.11 Growth Strategy and Outlook
- 18.3 Holcim Australia
- 18.4 Heidelberg Materials Australia
- 18.5 Hy-Tec
- 18.6 Sika Australia
- 18.7 Concrete Colour Systems
- 18.8 Flowcrete Australia
- 18.9 MAPEI Australia
- 18.10 ARDEX Australia
- 18.11 Concretus
- 18.12 Other Relevant Market Participants
Note: Every listed company is profiled on the structure shown under the first company. The company list is preliminary and may change based on research findings, market developments, data availability and client requirements.
Chapter 19 Disclaimer
- 19.1 Research and Forecast Disclaimer
- 19.2 Data Source and Estimation Limitations
Note: The depth of individual sections depends on data availability for this market. Volume, capacity, trade and other unit-based metrics are included where applicable.

