
Orchard netting and weather cover keep fabric demand rising
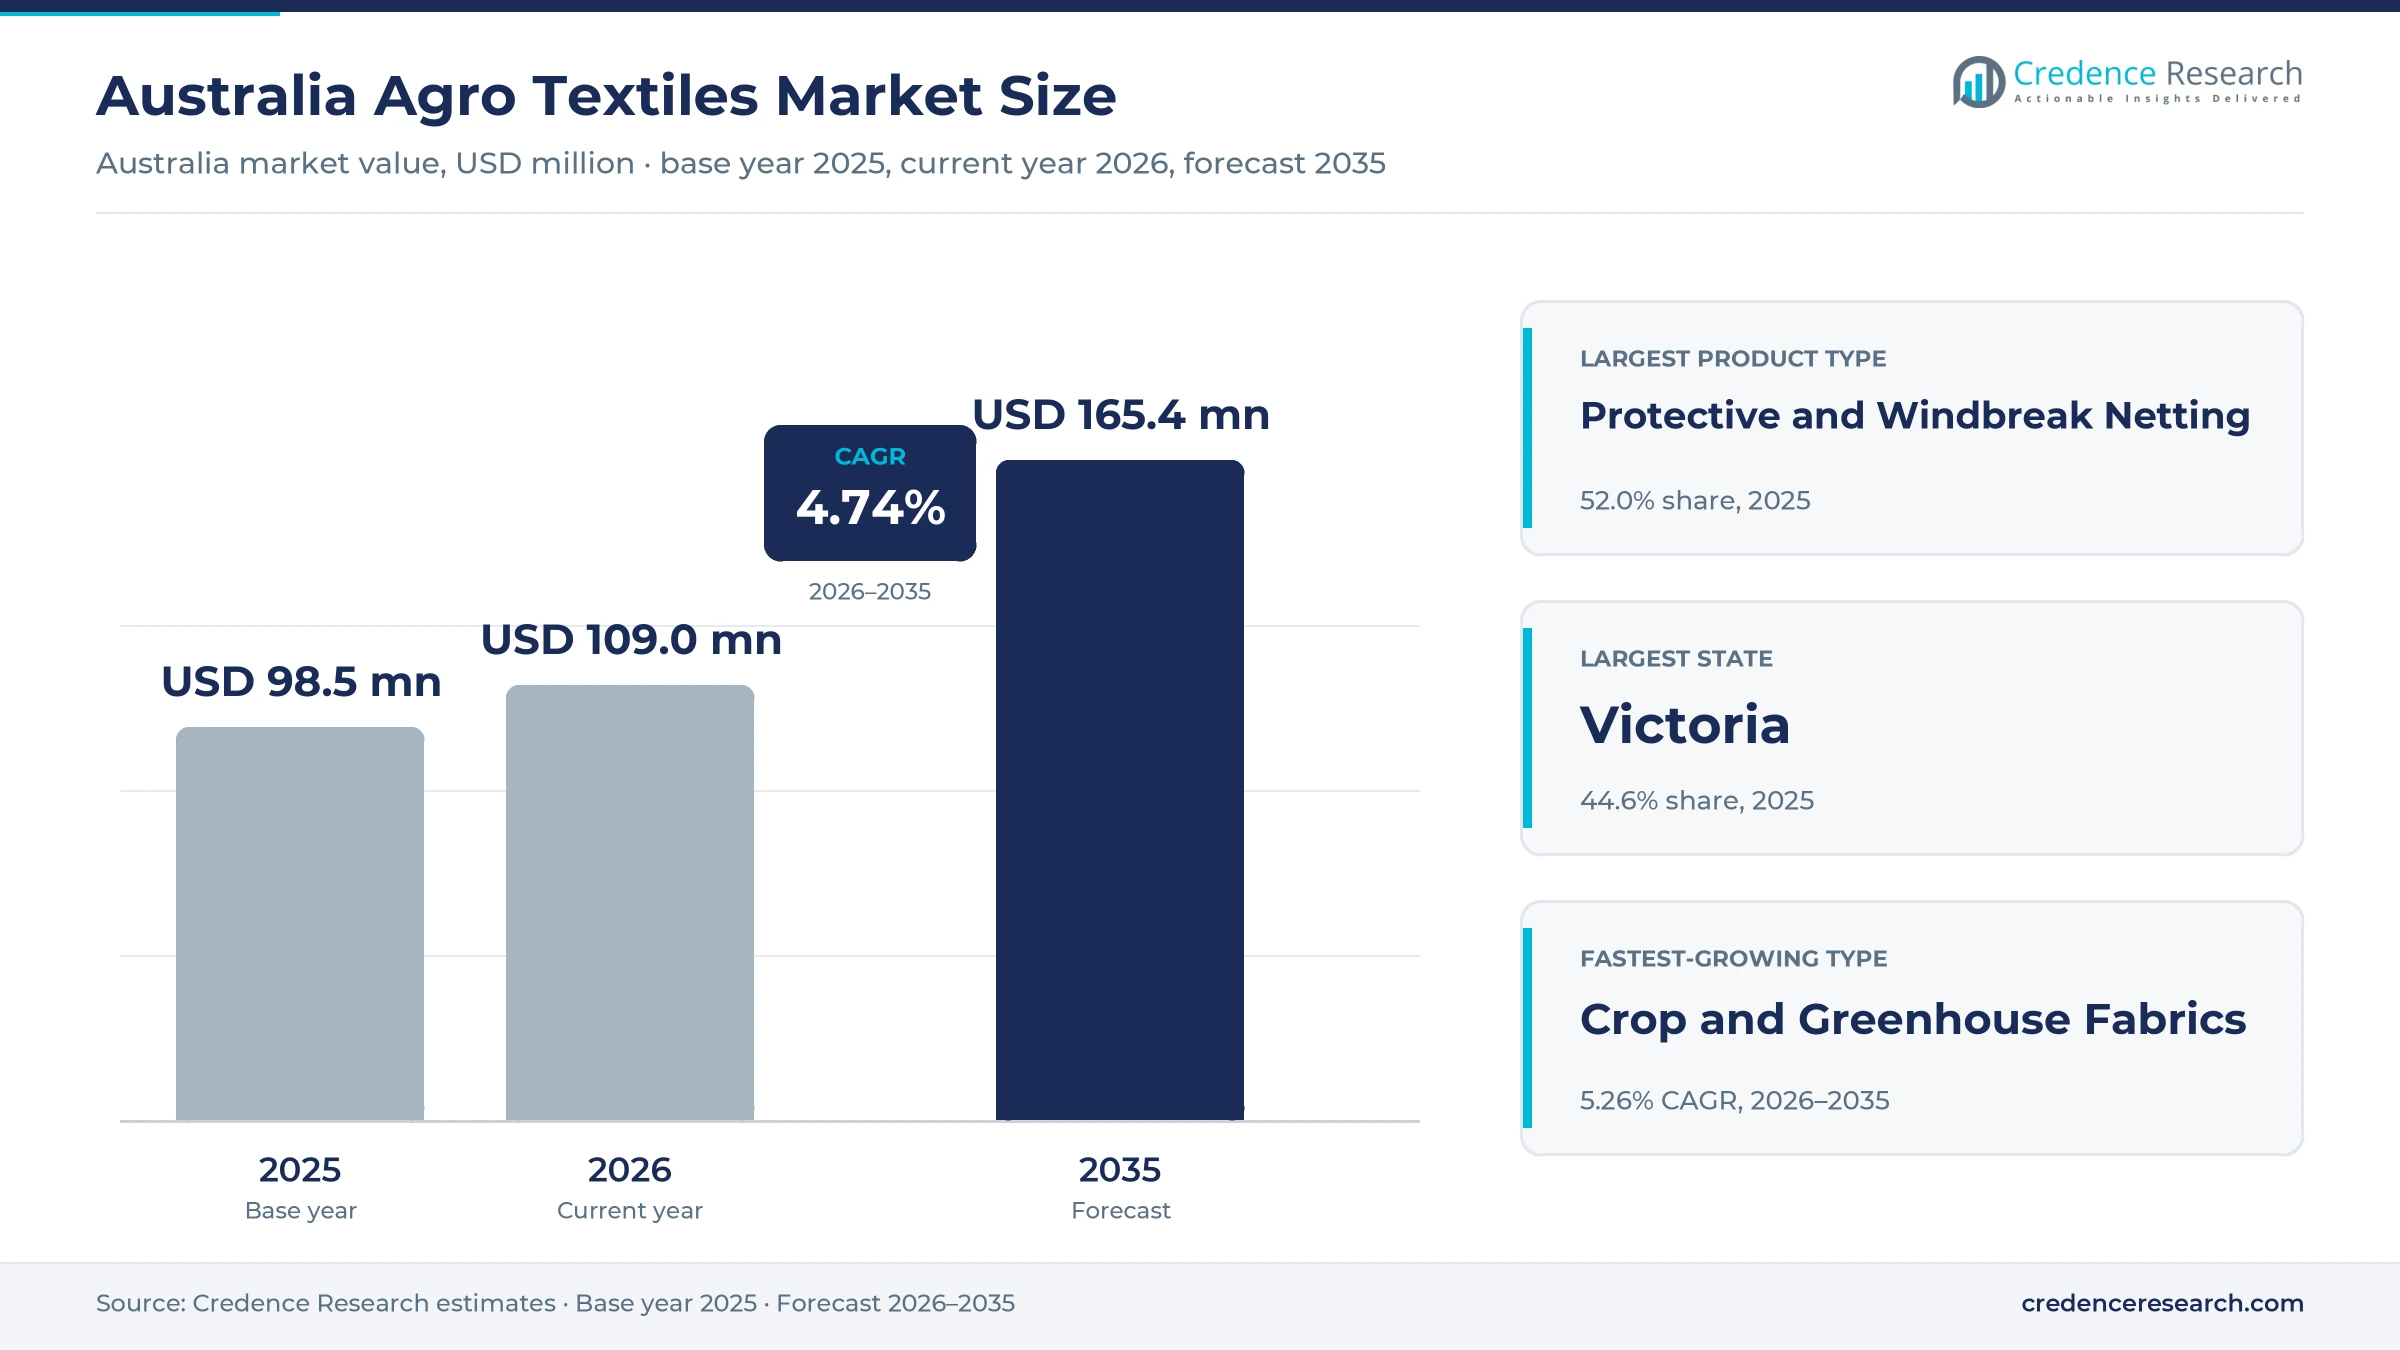
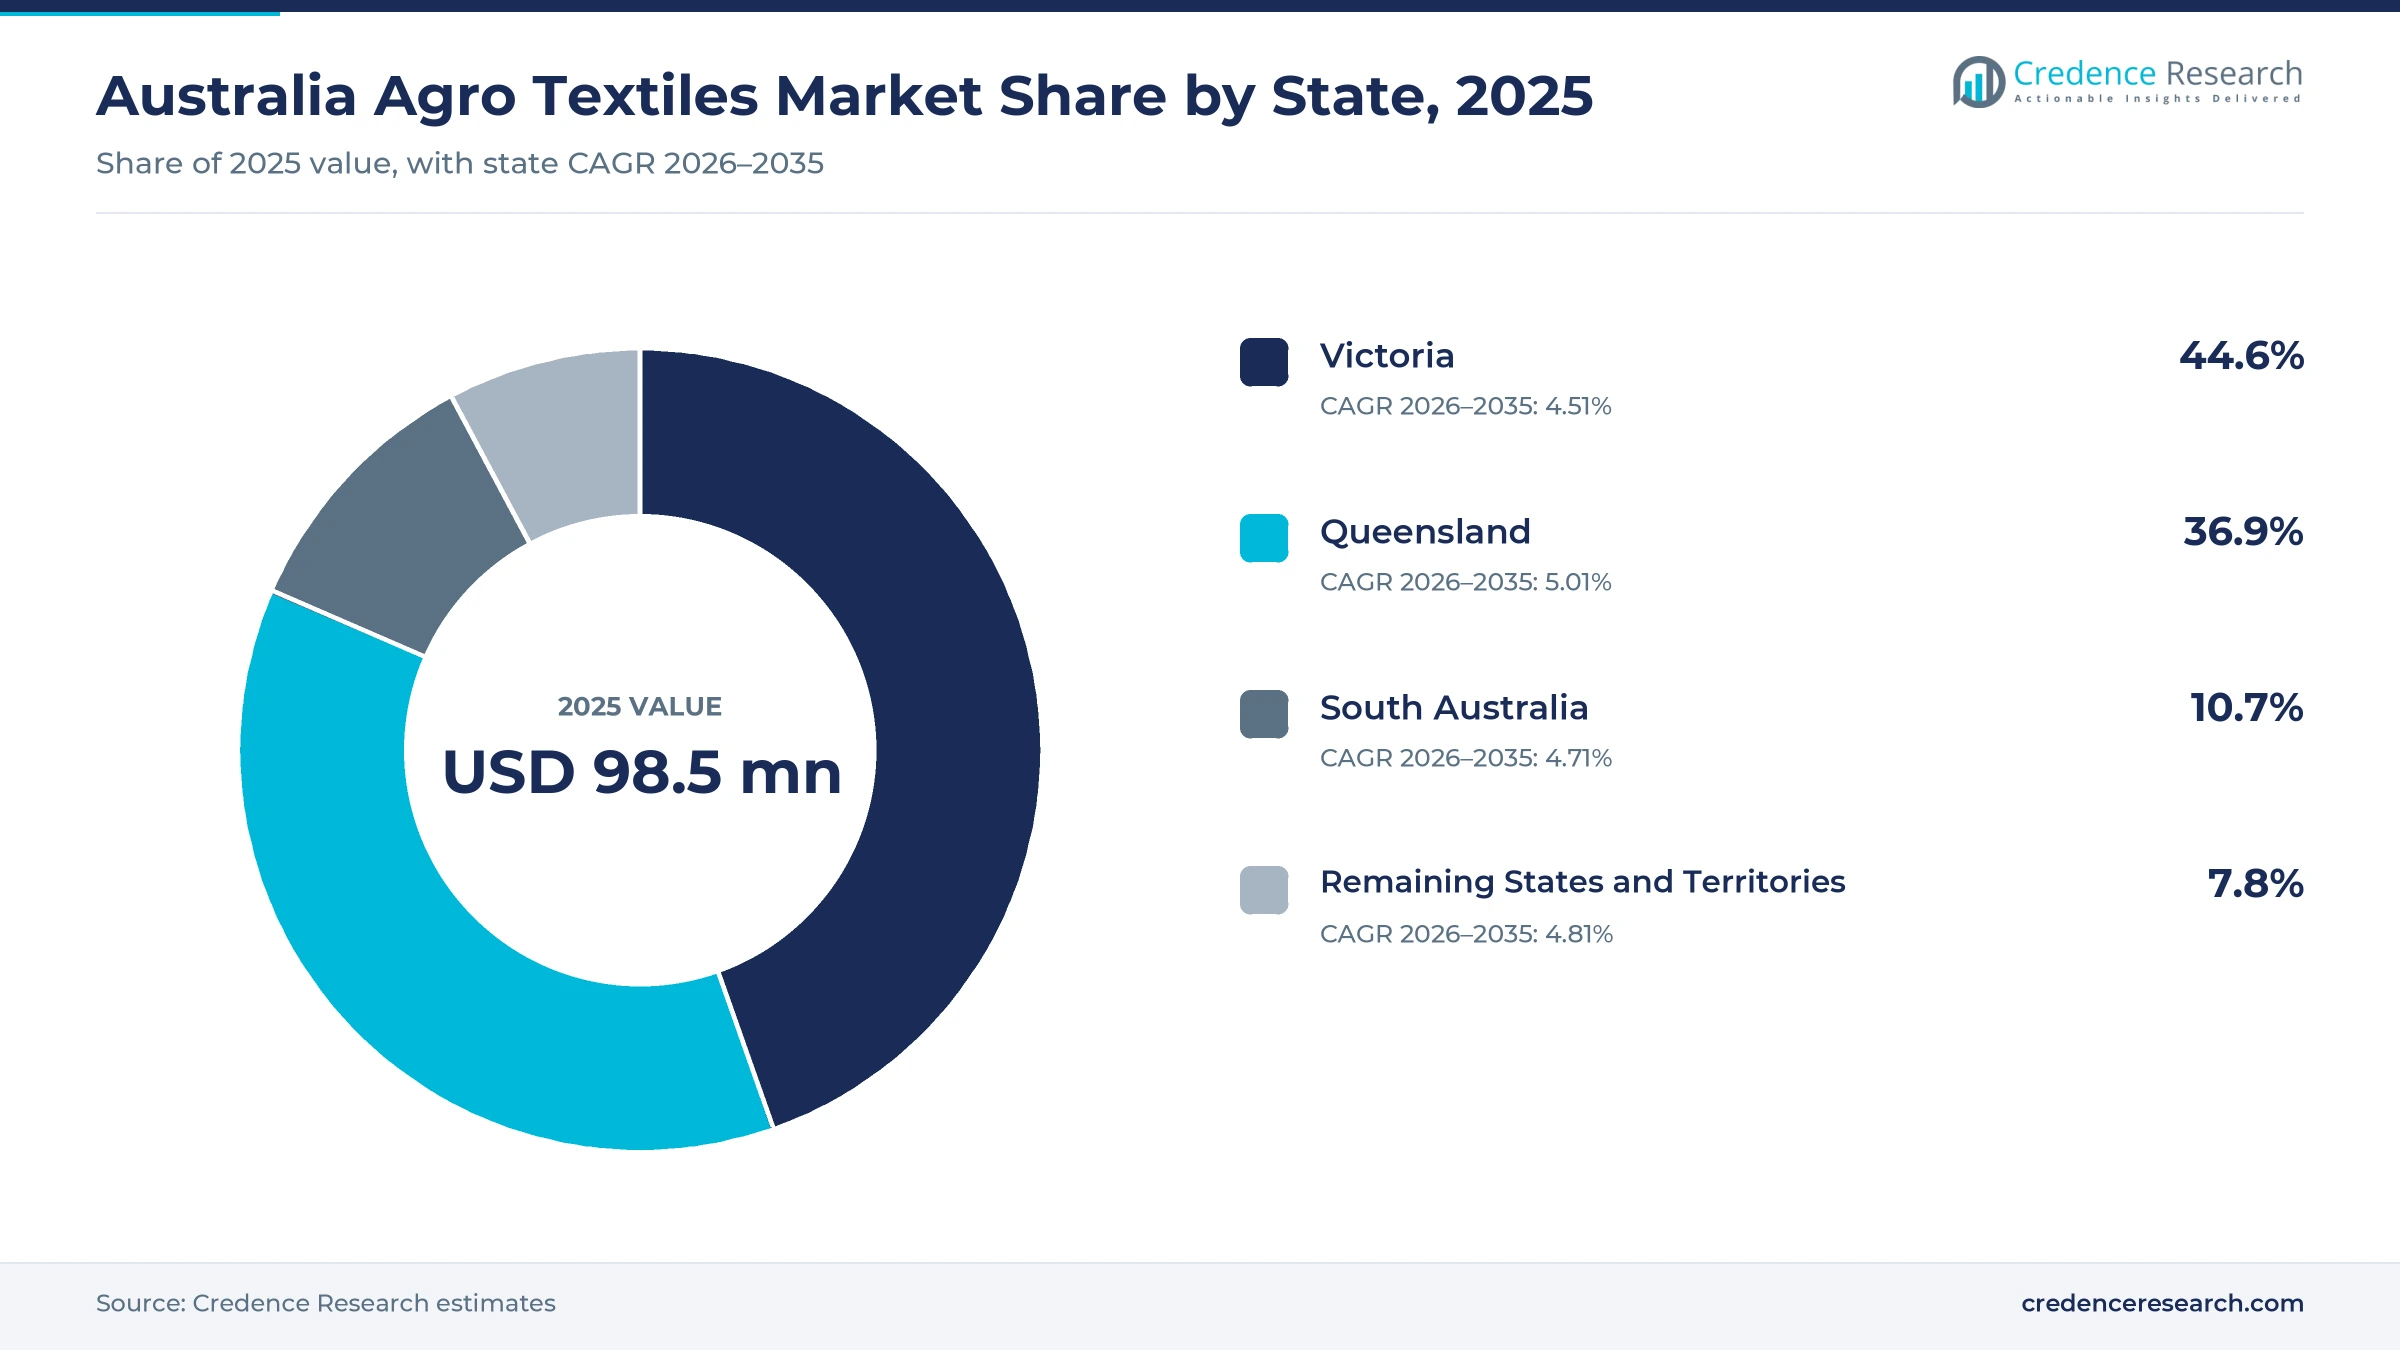
The Australia agro textiles market was valued at USD 98.5 million in 2025 and is projected to increase from USD 109.0 million in 2026 to USD 165.4 million by 2035, registering a CAGR of 4.74% during 2026–2035. Demand comes from orchard, vineyard, vegetable, berry, nursery and livestock producers that buy netting, ground covers, shade fabrics and silage covers to protect crops and stock. Victoria held the largest state share, 44.6% in 2025, because apple, pear and stone fruit orchards in the Goulburn Valley rely on permanent hail netting. Queensland is the fastest-growing state at 5.01% a year, as banana, avocado and berry growers add weather and wildlife protection. In turn, a public netting program in Victoria allocated AUD 15.9 million through 190 grants by October 2024, which pulled forward orchard installations across the state.
Which farm fabrics are counted in Australia?
The estimate measures spending in Australia on protective and windbreak netting, ground management textiles such as weed mat, crop and greenhouse fabrics such as shade cloth and crop covers, and livestock and silage textiles. It covers purchases by independent farm businesses, corporate farming groups, grower cooperatives and public agricultural operators through direct sales, specialist distributors, installers and online stores. Values are stated in USD million at current prices and exclude goods and services tax.
The estimate excludes plastic films, rigid glasshouse panels, steel poles and cables sold without fabric, and fabrics used only in home gardens. The value chain runs from polymer suppliers and knitting or weaving mills through importers and specialist distributors to netting installers and growers in every state.
Australia Agro Textiles Market Insights
- The Australia agro textiles market was valued at USD 98.5 million in 2025 and is projected to reach USD 165.4 million by 2035, at a 4.74% CAGR during 2026–2035.
- Victoria held 44.6% of 2025 value, because apple, pear and stone fruit orchards in the state rely on permanent hail netting.
- Protective and windbreak netting led product types with 52.0% of 2025 value, as orchards and vineyards cover blocks against hail, birds and bats.
- The Victorian Horticultural Netting Program allocated AUD 15.9 million through 190 grants to 150 producers by October 2024.
- Crop and greenhouse fabrics grow fastest at 5.26% a year during 2026–2035, as growers shift berries and vegetables under shade and covered structures.
Netting leads while greenhouse fabrics grow fastest
Why does protective netting lead farm fabric spending?
Based on product type, the market is categorized into protective and windbreak netting, ground management textiles, crop and greenhouse fabrics and livestock and silage textiles. Protective and Windbreak Netting led with 52.0% of 2025 value, because permanent hail and bird netting covers large orchard blocks at high cost per hectare. Crop and Greenhouse Fabrics grow fastest at 5.26% a year, as berry and vegetable growers move crops under shade.
Which crops buy the most protective fabric?
Based on crop type, the market is categorized into orchard and vine crops, vegetable and berry crops, nursery and floriculture crops and pasture and mixed farming. Orchard and Vine Crops led with 41.0% of 2025 value, because apples, pears, stone fruit and table grapes carry high value per hectare. Vegetable and Berry Crops grow fastest at 5.18% a year, as berry and leafy vegetable growers adopt tunnels and shade houses.
How do growers use farm fabrics in the field?
Based on application, the market is categorized into weather protection, pest exclusion, soil management and controlled microclimates. Weather Protection led with 43.0% of 2025 value, because hail, sunburn and wind damage drive most orchard netting decisions. Controlled Microclimates grow fastest at 5.30% a year, as growers use shade and covered structures to cut water use and steady yields.
How do farms source netting and covers?
Based on sales channel, the market is categorized into direct manufacturer sales, specialist distributors, installer-led procurement and digital direct sales. Specialist Distributors led with 38.0% of 2025 value, because growers need local stock, mesh advice and cut-to-length supply. Digital Direct Sales grows fastest at 6.17% a year, as small growers order bird netting and weed mat online.
| Segment Group | Leading Sub-segment | Share, 2025 | Fastest-growing Sub-segment | CAGR, 2026–2035 |
|---|---|---|---|---|
| By Product Type | Protective and Windbreak Netting | 52.0% | Crop and Greenhouse Fabrics | 5.26% |
| By Crop Type | Orchard and Vine Crops | 41.0% | Vegetable and Berry Crops | 5.18% |
| By Application | Weather Protection | 43.0% | Controlled Microclimates | 5.30% |
| By Sales Channel | Specialist Distributors | 38.0% | Digital Direct Sales | 6.17% |
Request a Free Sample
Fill in your details and we'll send you a free sample report.
- Sample data tables & charts
- Research methodology
Hail risk, structure renewal and grants lift netting demand
How does climate risk push growers toward crop protection?
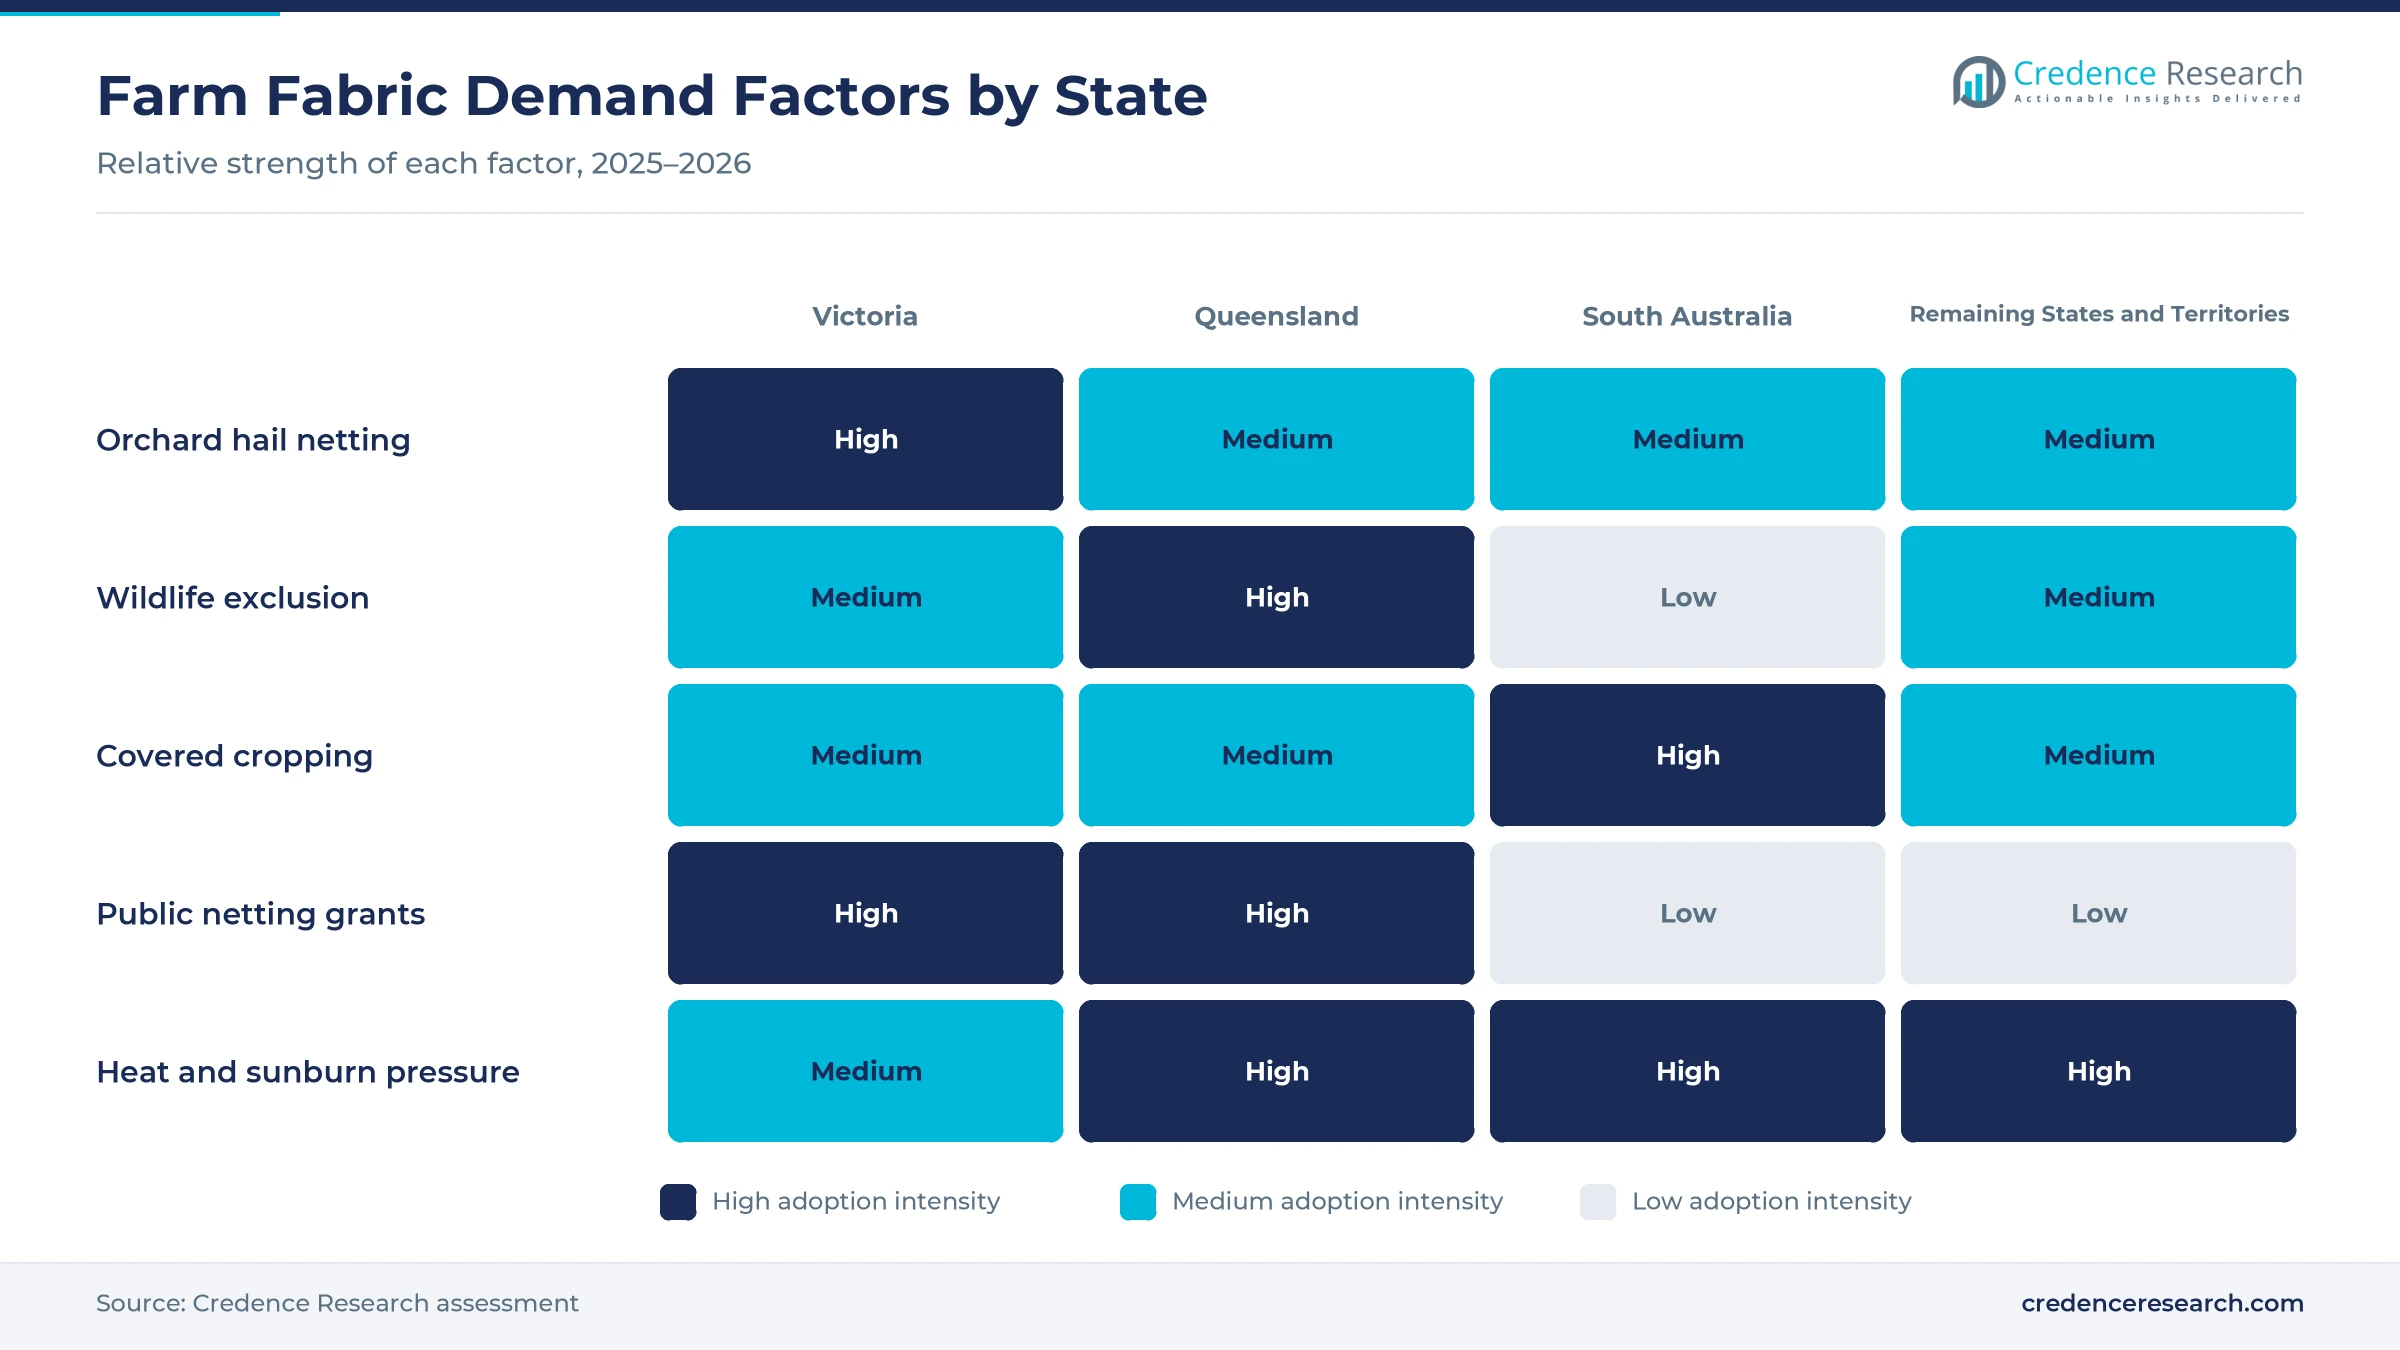
Climate risk pushes growers toward physical crop protection, because hotter seasons and severe storms cut the share of marketable fruit. Australia has warmed by 1.51°C over land since 1910, according to the national State of the Climate report, and eight of the nine warmest years on record have occurred since 2013. April to October rainfall in the south-east has also fallen by 9% since 1994, which raises sunburn and water stress in orchards. A March 2023 hailstorm in the Goulburn Valley destroyed an estimated 200,000 bins of fruit worth AUD 80 million, according to the state fruit growers body. As a result, weather protection leads applications with 43.0% of 2025 value across the country.
Why does protected-cropping renewal sustain repeat orders?
Protected-cropping renewal sustains repeat orders, because netting and shade structures wear out and need new fabric every few seasons. The first national map of protected cropping structures, launched in July 2023, counted 13,932 hectares, about 30% above earlier industry estimates. New South Wales alone held 3,005 hectares of permanent nets, while South Australia held 1,103 hectares of polyhouses, more than half of the national total. A Darling Downs apple and strawberry farm replaces its netting every five to eight years and spends about AUD 50,000 per acre on new hail structures. Consequently, protective and windbreak netting holds 52.0% of 2025 value as replacement cycles keep demand steady.
How does public co-investment speed netting installs?
Public co-investment speeds netting installs, because grants cut the upfront cost that delays most orchard projects. Victoria announced in October 2024 that it had allocated AUD 15.9 million through 190 grants to 150 producers over three rounds, with up to AUD 150,000 per producer, according to the Victorian government. The Commonwealth added AUD 11.22 million to that program, which funded up to 50% of eligible netting costs. In Queensland, the state rural finance authority paid 50% of netting purchase and installation costs, up to AUD 300,000, until applications closed on April 30, 2024. As a result, grant-backed orchard projects lift demand for shade nets and hail mesh in both states.
Why does rising horticulture value support fabric budgets?
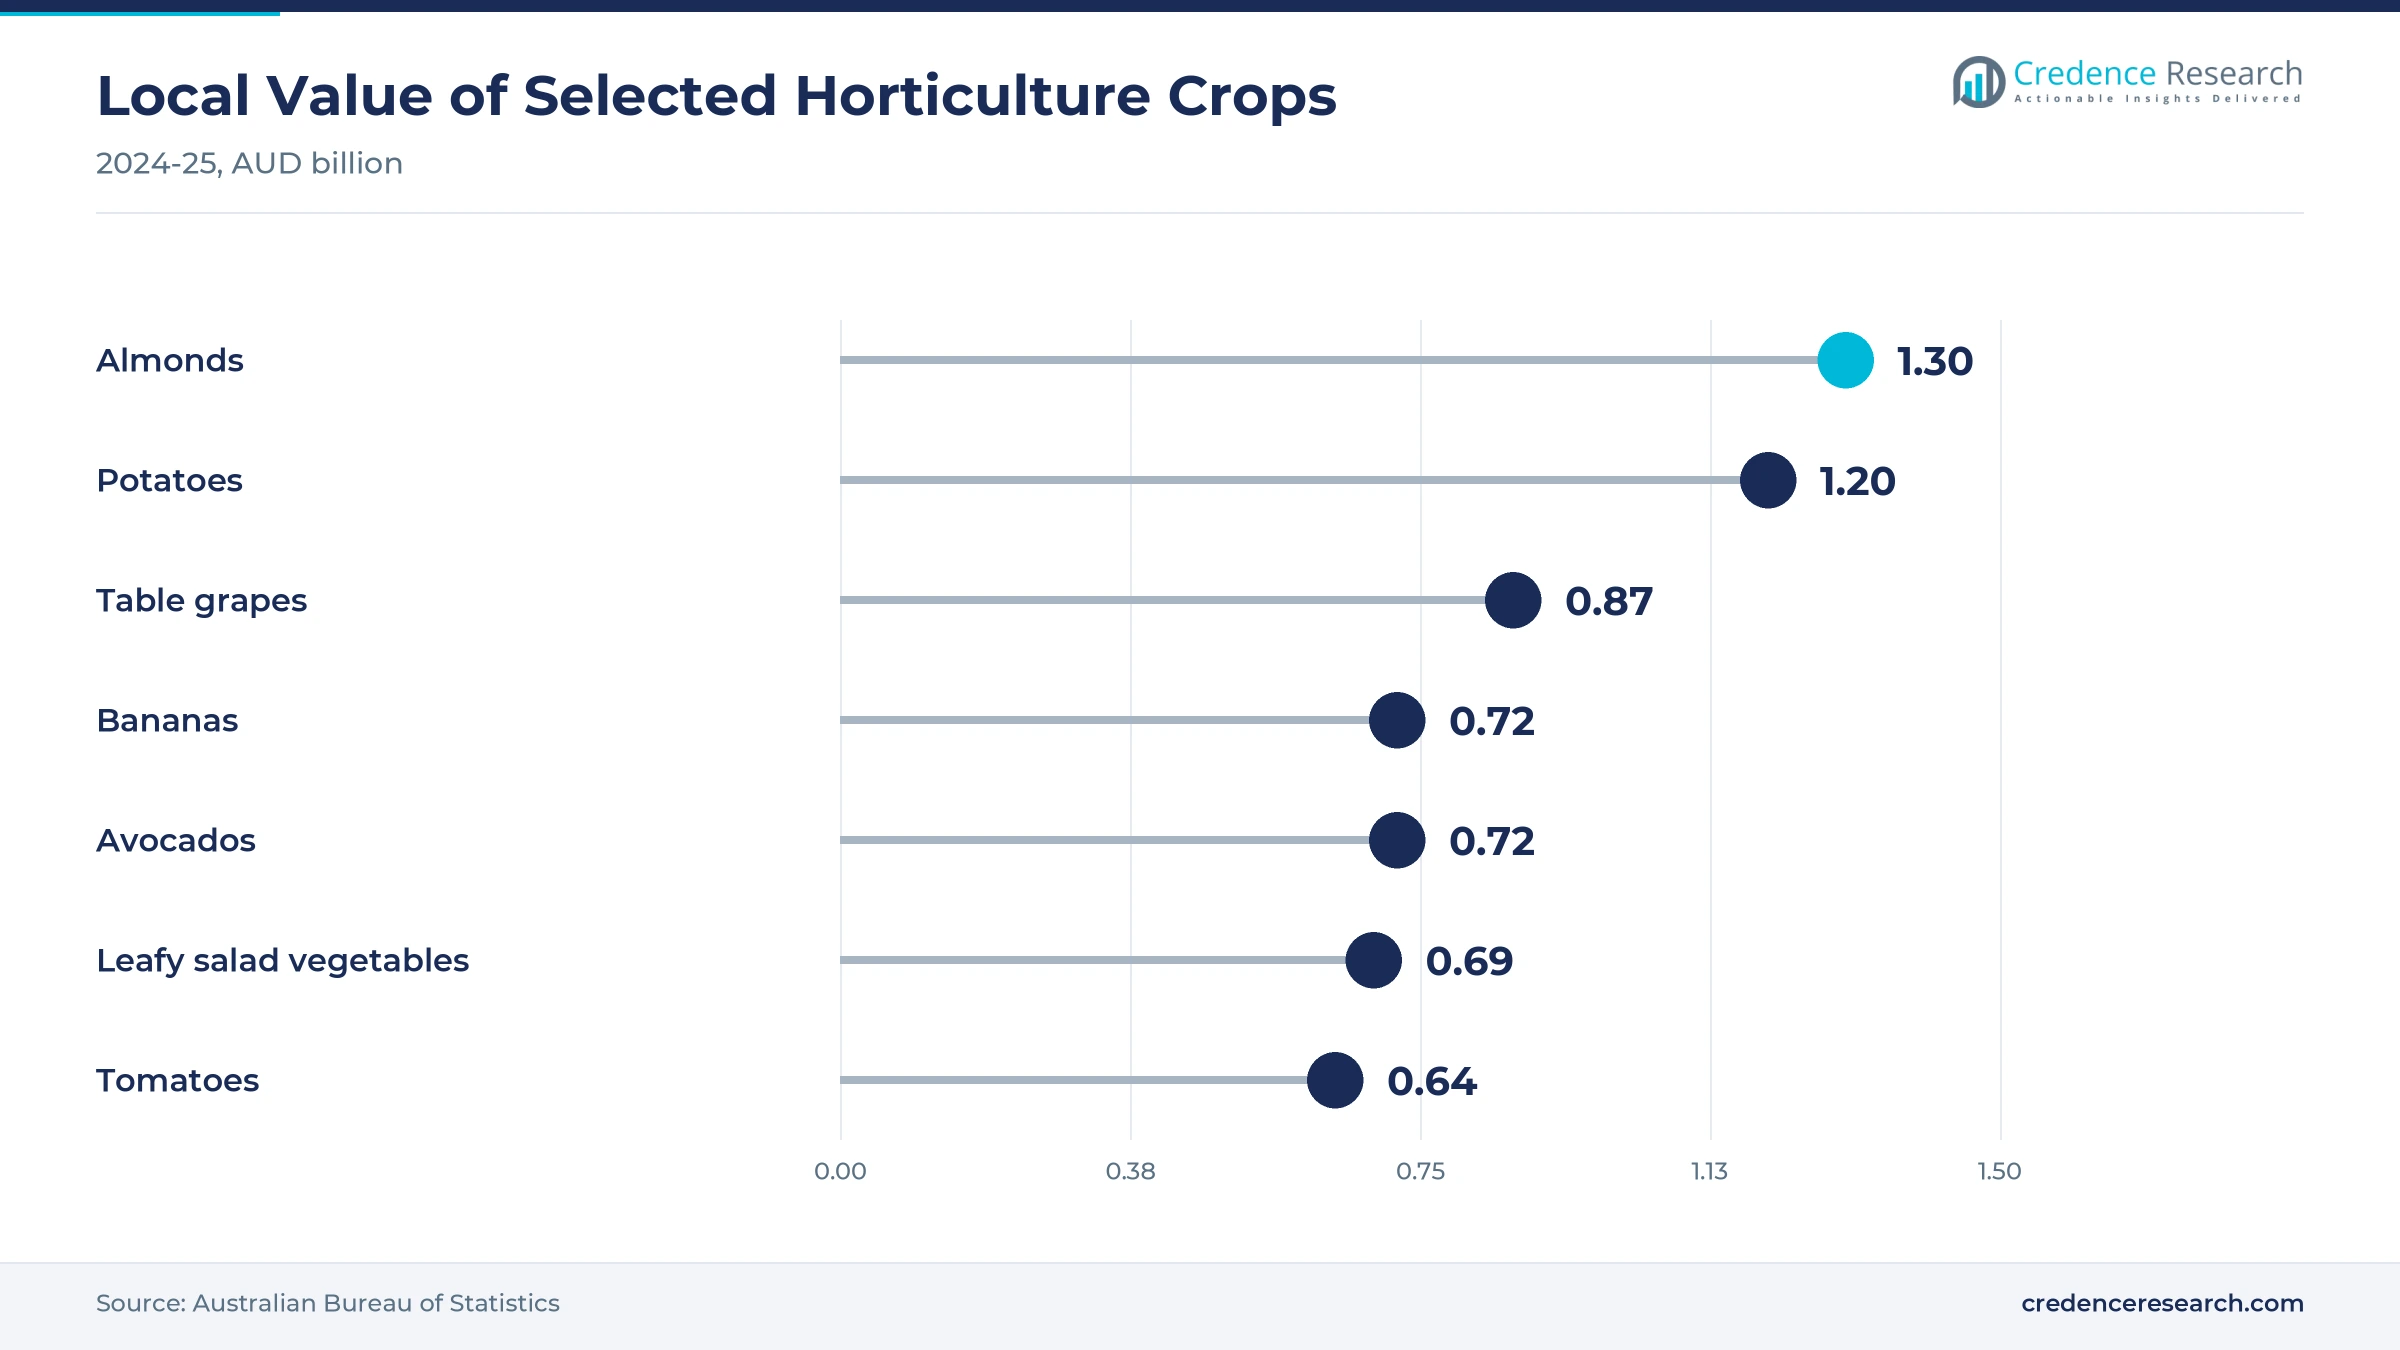
Rising horticulture value supports fabric budgets, because growers invest more in protection when crops earn more per hectare. The local value of horticulture reached AUD 19.5 billion in 2024-25, up 6.6% on the prior year, according to the Australian Bureau of Statistics. Avocados rose 22.0% to AUD 718.7 million, while table grapes rose 16.4% to AUD 874.9 million in the same year. Agriculture also lifted its share of GDP to 2.27% in 2025 from 2.04% in 2024, according to World Bank data. Higher crop returns give growers the cash to net new blocks and replace worn fabric. Consequently, orchard and vine crops lead crop types with 41.0% of 2025 value nationwide.
Exclusion netting, water saving and online supply rise
How is the rise of exclusion netting changing wildlife control?
The rise of exclusion netting is changing wildlife control, because growers want to protect fruit from flying foxes, birds and insects without lethal methods. Queensland business guidance names exclusion netting as the most effective option against wildlife damage, although it costs more than other methods. The state netting program, which closed on April 30, 2024, also funded permanent protective netting, shade cloth and throw-over netting, which widened the eligible product range. Drape Net has supplied drape systems for more than 10 years that guard tree crops against hail, sunburn, birds, bats and fruit fly. Fruit fly netting also reduces reliance on crop protection chemicals in orchards. As a result, pest exclusion gains share in the Australia agro textiles market through 2035.
Why is the shift to water-saving shade structures rising?
The shift to water-saving shade structures is rising, because drier seasons make every megaliter of irrigation more valuable to growers. Netting can reduce orchard water use by up to 20%, according to the Victorian government. April to October rainfall in the south-west has fallen by 16% since 1970, which pushes Western Australian growers toward covered cropping under fabric and greenhouse films. South Australia already holds more than half of national polyhouse area, with 1,103 hectares mapped in 2023. In turn, controlled microclimates grow fastest among applications at 5.30% a year, while crop and greenhouse fabrics post the fastest product CAGR at 5.26% during 2026–2035.
Can online small-lot supply open new demand?
Online small-lot supply opens new demand, because small orchards, market gardens and hobby farms buy netting by the meter rather than by the container. Sage Horticultural sells bird netting online in 5, 10 and 15 meter widths, with cut-to-length and pre-cut options from its Hallam factory outlet in Victoria. Its range also includes wildlife-friendly netting for fruit trees, berries and vineyards, which meets new animal welfare expectations. Victoria also paid a self-installation allowance of AUD 7,000 per hectare, capped at AUD 50,000, which encouraged growers to buy fabric directly. Consequently, digital direct sales grow fastest among channels at 6.17% a year through 2035.
Is there room to grow in recyclable and storage fabrics?
Recyclable and storage fabrics offer a clear opening, because growers and grain handlers want covers that last longer and create less plastic waste. Queensland business guidance notes that exclusion netting creates plastic waste when growers replace worn nets every 5 to eight years. Polyfab Australia, part of the Nolan Group since December 2017, markets its shade cloth as 100% recyclable and lead and phthalate free, which supports buyers with waste goals. GALE Pacific, announcing results on Aug. 29, 2025, linked its fiscal 2025 growth in Australia and New Zealand to higher coated fabric sales for grain storage. As a result, livestock and silage textiles and crop fabrics with take-back programs can win new contracts from corporate farming groups and grower cooperatives that track plastic use.
High install costs, storm damage and plastic waste
How do high install costs slow small growers?
High install costs slow small growers, because permanent hail netting needs poles, cables, anchors and contractors as well as fabric. A Darling Downs grower spends about AUD 50,000 per acre on new hail structures. As a result, growers without grants delay projects or net only their most valuable blocks. Suppliers reduce this barrier with drape systems, throw-over nets and staged installs that spread spending across several seasons and keep cash flow manageable.
Why does storm damage raise replacement risk?
Storm damage raises replacement risk, because large hailstones and strong winds can tear netting and collapse structures within minutes. The March 2023 Goulburn Valley hailstorm damaged netting as well as fruit and trees. Consequently, growers face repair costs in the same season that they lose crop income. Stronger mesh, better tensioning and insurance cover help growers limit losses, although these options raise the upfront cost of each netted hectare.
How does plastic waste affect buyer choices?
Plastic waste affects buyer choices, because worn netting, weed mat and silage wrap are hard to recycle on remote farms. Queensland guidance lists plastic waste as a drawback of exclusion netting. In turn, growers and retailers ask suppliers for longer-life fabrics and collection schemes. Suppliers that offer recyclable polymers, take-back programs and longer warranties gain an edge with corporate farming groups that report their environmental performance.
Will import reliance unsettle fabric prices?
Import reliance can unsettle fabric prices, because most knitted polyethylene netting and woven ground covers reach Australia from overseas mills. Shipping delays and currency swings can lift landed costs quickly before peak installing seasons. As a result, growers that order late face shortages or higher prices. Distributors manage this risk by holding stock in several states and by qualifying more than one mill for each mesh type and color.
Victoria leads orchard netting as Queensland grows fastest
| State | Value, 2025 (USD million) | Share, 2025 | CAGR, 2026–2035 |
|---|---|---|---|
| Victoria | 43.9 | 44.6% | 4.51% |
| Queensland | 36.3 | 36.9% | 5.01% |
| South Australia | 10.5 | 10.7% | 4.71% |
| Remaining States and Territories | 7.7 | 7.8% | 4.81% |
Why does Victoria lead orchard netting demand?
Victoria held a 44.6% share of 2025 value and grows at 4.51% a year, the largest region in the country. The state produced horticulture worth AUD 4.62 billion in 2023-24, up from AUD 4.33 billion in 2022-23, according to Agriculture Victoria. Apple, pear and stone fruit orchards in the Goulburn Valley rely on permanent hail netting. As a result, 150 Victorian producers received netting grants by October 2024, which keeps the state ahead through 2035.
How does Queensland horticulture lift fabric demand?
Queensland held a 36.9% share of 2025 value and grows fastest at 5.01% a year, because tropical and subtropical crops need protection from storms, sunburn and flying foxes. The state forecast record horticulture value of AUD 4.76 billion for 2024-25. Bananas worth AUD 676.2 million and avocados worth AUD 381.5 million came from Queensland in 2024-25. Consequently, Queensland adds the most new demand for netting and shade fabric.
Why does South Australia favor covered cropping?
South Australia held 10.7% of 2025 value and grows at 4.71% a year, because Adelaide Plains growers produce vegetables under polyhouses. The state held 1,103 hectares of polyhouses in the 2023 national map, more than half of the national total. The state also produced wine grapes worth AUD 577.4 million in 2024-25. In turn, South Australia keeps steady demand for greenhouse fabrics and vineyard netting.
How do the remaining states add demand?
The remaining states and territories held 7.8% of 2025 value and grow at 4.81% a year. New South Wales held 3,005 hectares of permanent nets in the 2023 national map, the highest of any state. Western Australia produced avocados worth AUD 236.1 million in 2024-25, which supports windbreak and shade demand. Therefore, this zone adds steady orders from orchard and avocado growers.
Netting grants and climate data shape 2024 to 2026
| Development | Status and market relevance |
|---|---|
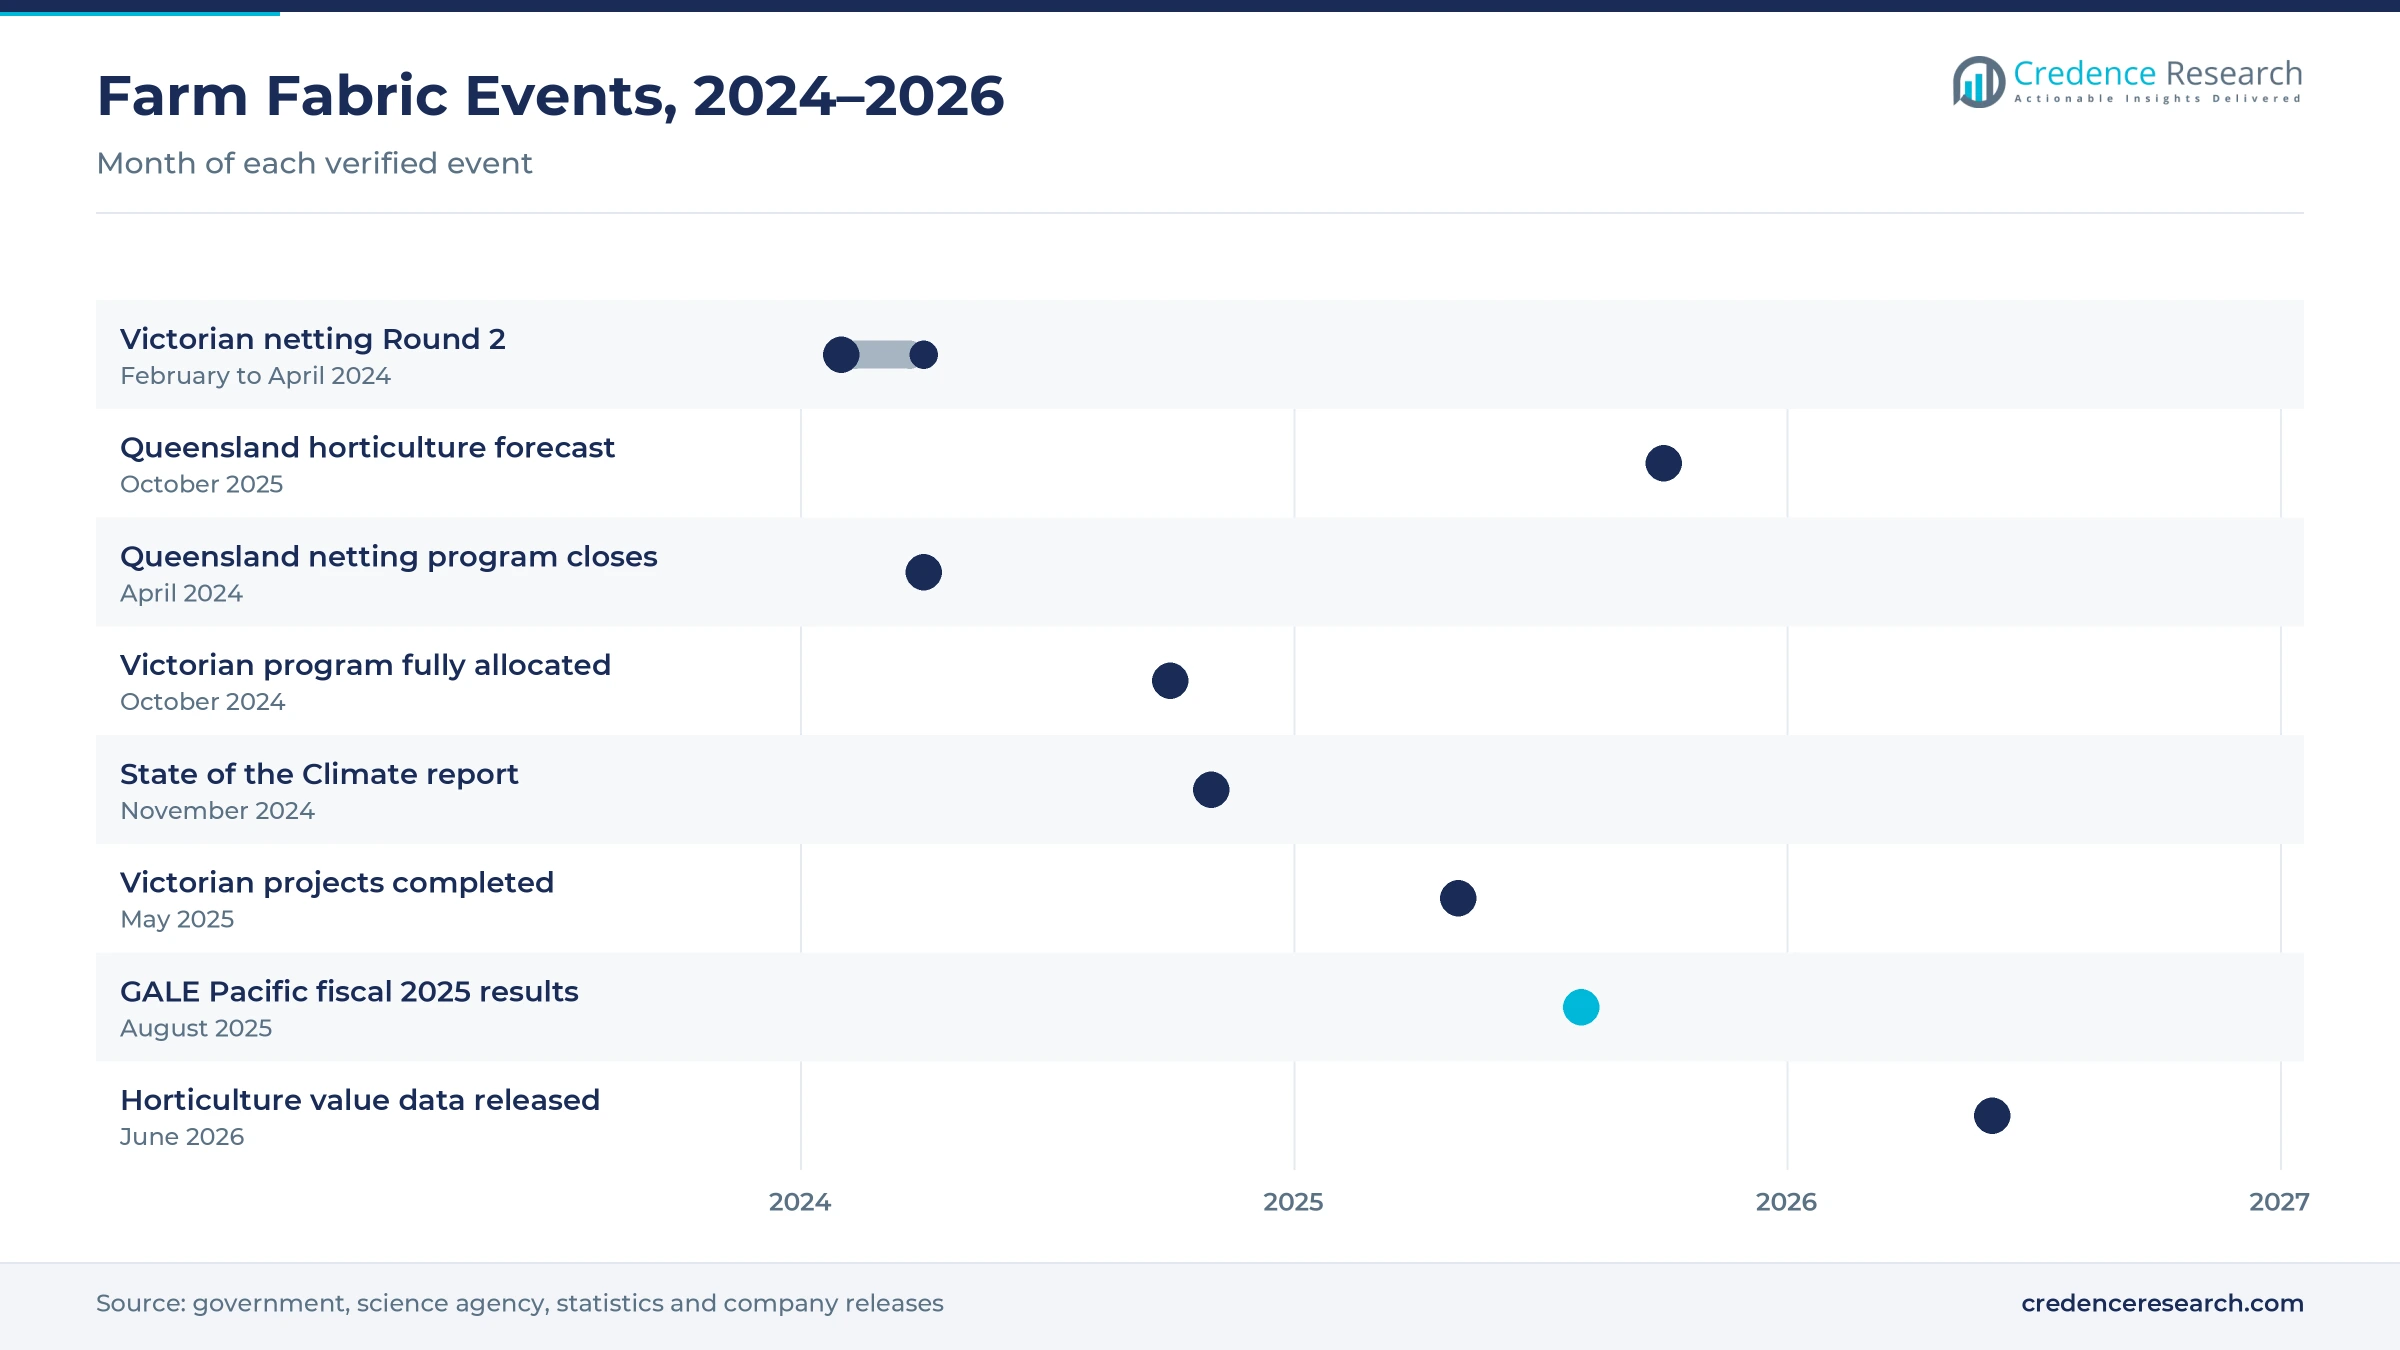
| In October 2024, the Victorian government said its AUD 15.9 million netting program was fully allocated through 190 grants. | Supports 150 producers across three rounds |
| In November 2024, the State of the Climate report found Australia had warmed by 1.51°C over land since 1910. | Raises the case for weather protection |
| In August 2025, GALE Pacific reported fiscal 2025 results citing higher coated fabric sales for grain storage. | Shows rising farm demand for coated fabrics |
| In October 2025, the Queensland government announced a record horticulture value forecast of AUD 4.76 billion for 2024-25. | Supports netting demand in the fastest-growing state |
| In June 2026, the Australian Bureau of Statistics reported horticulture value of AUD 19.5 billion for 2024-25, up 6.6%. | Higher crop value supports fabric budgets |
Knitted mesh, drape systems and recyclable fabrics
- Knitted high-density polyethylene mesh gives hail and bird netting UV resistance and strength, which lets permanent structures last about a decade in the field.
- Drape netting systems place netting directly over tree rows with machines such as the Net Wizz, which cuts install time and avoids costly poles.
- Colored and shade-rated fabrics filter light and lower canopy temperature, which reduces sunburn and water use on fruit and vegetable crops.
- Recyclable and lead-free polymers let growers and retailers meet plastic waste goals while keeping fabric strength and UV life.
Need a Custom Version of This Report?
Tailor the scope, geography, or segments to your exact requirements.
- Custom geography or segment scope
- Direct access to our analyst team
Suppliers compete on mesh range, install support and stock
Competition combines Australian fabric makers, specialist netting distributors, installers and online sellers of small lots. GALE Pacific, based in Braeside in Victoria, supplies knitted, coated and advanced polymer fabrics for agricultural and horticultural uses under its commercial brand. Polyfab Australia, part of the Nolan Group since December 2017, markets recyclable, lead and phthalate free shade cloth. Drape Net has supplied drape netting to tree crop growers for more than 10 years and helped develop the Net Wizz applicator. Sage Horticultural sells bird netting online from its Hallam outlet in Victoria. Companies compete on mesh range, UV life, local stock, install support, grant paperwork help, price and delivery speed. Larger suppliers also bundle netting with poles, cables and installation, which helps them win whole orchard projects.
Companies profiled and their roles in this market
| Company | Type | Role in the market |
|---|---|---|
| GALE Pacific | Fabric manufacturer | Knitted and coated agricultural fabrics; fiscal 2025 growth in grain storage covers |
| Polyfab Australia | Fabric supplier | Recyclable, lead and phthalate free shade cloth; part of the Nolan Group since 2017 |
| Drape Net | Netting system supplier | Drape netting for tree crops for more than 10 years; Net Wizz applicator |
| Sage Horticultural | Distributor and online seller | Bird and wildlife-friendly netting sold online from Hallam, Victoria |
Credence Research view on Australian crop fabrics
Credence Research's view is that Australian demand for farm fabrics will grow steadily through 2035, as orchard, berry and vegetable growers protect higher-value crops from hail, heat and wildlife. Protective and windbreak netting should keep the largest share, while crop and greenhouse fabrics gain most from covered cropping. Grants have pulled some Victorian demand forward, so replacement cycles will matter more after 2026. However, high install costs and plastic waste concerns will reward suppliers that offer staged installs, longer-life mesh and take-back schemes.
How the crop protection fabric estimate was built
The report uses 2025 as the base year, with values in USD million at current prices. Market values come from the Credence Research model, which combines netted and covered crop area, replacement cycles, fabric prices and import flows. State shares follow the client zone split, and segment splits by product type, crop type, application and sales channel are Credence Research estimates. Sources used are official statistics, government program pages, science agency reports, company statements and industry news, and no interviews or surveys were used.
Netted orchards and protected crops shape 2035
The market is expected to reach USD 165.4 million by 2035, a 4.74% CAGR during 2026–2035, as hail, heat and wildlife pressure keep growers investing in protection. Growth should be strongest in crop and greenhouse fabrics, controlled microclimates, digital direct sales and Queensland, while Victoria keeps the largest share. Replacement of netting installed under recent grants will support orders in the 2030s. In contrast, weak farm incomes or a pause in public co-investment could delay new orchard projects and push growers toward cheaper throw-over nets.
Frequently Asked Questions
How big is the Australia agro textiles market?
Which state leads farm fabric demand?
Which state grows fastest?
Which product type holds the largest share?
How do public grants affect demand?
Which product type grows fastest?
Who are the leading companies in this market?
What are the main risks to growth?
Table of Content
Chapter 1 Market Segmentation
- 1.1 Segmentation Framework
- 1.1.1 Product and Service Classification
- 1.1.2 Application and End-Use Classification
- 1.1.3 Technology and Solution Classification
- 1.1.4 Customer and Distribution Channel Classification
- 1.1.5 Geographic Segmentation
- 1.1.6 Market Segment Definitions and Boundaries
- 1.2 By Product Type
- 1.2.1 Protective and Windbreak Netting
- 1.2.2 Ground Management Textiles
- 1.2.3 Crop and Greenhouse Fabrics
- 1.2.4 Livestock and Silage Textiles
- 1.3 By Crop Type
- 1.3.1 Orchard and Vine Crops
- 1.3.2 Vegetable and Berry Crops
- 1.3.3 Nursery and Floriculture Crops
- 1.3.4 Pasture and Mixed Farming
- 1.4 By Application
- 1.4.1 Weather Protection
- 1.4.2 Pest Exclusion
- 1.4.3 Soil Management
- 1.4.4 Controlled Microclimates
- 1.5 By Sales Channel
- 1.5.1 Direct Manufacturer Sales
- 1.5.2 Specialist Distributors
- 1.5.3 Installer-Led Procurement
- 1.5.4 Digital Direct Sales
- 1.6 By State
- 1.6.1 Victoria
- 1.6.2 Queensland
- 1.6.3 South Australia
- 1.6.4 Remaining States and Territories
Chapter 2 Introduction
- 2.1 Report Objectives and Scope
- 2.2 Product Definition and Industry Terminology
- 2.3 Market Inclusions and Exclusions
- 2.4 Research Process
- 2.4.1 Primary Research and Expert Interviews
- 2.4.2 Secondary Research and Source Review
- 2.4.3 Top-Down and Bottom-Up Estimation
- 2.4.4 Data Triangulation and Verification
- 2.5 Market Size Measurement Basis
- 2.5.1 2025: USD 98.5 million → 2035: USD 165.4 million
- 2.6 Historical and Forecast Reference Periods
- 2.6.1 Historical Period: 2018-2025
- 2.6.2 Base Year: 2025
- 2.6.3 Forecast Period: 2025-2035
- 2.7 Research Assumptions and Limitations
Chapter 3 Executive Summary
- 3.1 Market Snapshot and Key Findings
- 3.2 Base-Year Market Size, 2025
- 3.3 Forecast Market Size, 2035
- 3.4 Revenue and Volume Growth Outlook
- 3.5 Key Demand and Supply Indicators
- 3.6 Leading Market Segments
- 3.7 Fastest-Growing Market Opportunities
- 3.8 Regional Performance Highlights
- 3.9 Technology and Industry Transformation
- 3.10 Competitive Landscape Summary
- 3.11 Analyst View and Strategic Implications
Chapter 4 Australia Agro Textiles Market Trends and Developments
- 4.1 Historical Industry Development, 2018-2025
- 4.2 Recent Market Trends and Developments
- 4.3 Demand and Customer Behavior Trends
- 4.4 Technology and Product Innovation
- 4.5 Artificial Intelligence, Automation and Digitalization
- 4.6 Local Manufacturing and Supply Chain Realignment
- 4.7 Industry Partnerships, Mergers and Acquisitions
- 4.8 Sustainability and Circular Economy Developments
- 4.9 Government and Private Sector Investment Trends
- 4.10 Emerging Business Models and Commercialization
- 4.11 Industry Developments and Announcements
Chapter 5 Australia Agro Textiles Market Production, Supply and Demand Analysis
- 5.1 Demand Trend and Consumption Analysis, 2018-2025
- 5.2 Demand Forecast, 2025-2035
- 5.3 Production and Output Trend, 2018-2025
- 5.4 Production and Output Forecast, 2025-2035
- 5.5 Installed Capacity and Capacity Utilization
- 5.6 Company-Wise Production Plants and Statistics
- 5.6.1 Installed Production Capacity
- 5.6.2 Actual Production
- 5.6.3 Planned Capacity and Expansion Targets
- 5.7 Supply Chain Structure and Procurement Trends
- 5.8 Supply-Demand Gap and Bottlenecks
- 5.9 Import Dependence and Sourcing Structure
- 5.10 Contract Manufacturing and Outsourcing
- 5.11 Regional Supply and Demand Concentration
Chapter 6 Australia Agro Textiles Market Pricing Analysis
- 6.1 Pricing Structure and Measurement
- 6.2 Historical Pricing Trends, 2018-2025
- 6.3 Pricing Outlook, 2025-2035
- 6.4 Average Selling Price and Unit Economics
- 6.5 Pricing by Product and Market Segment
- 6.6 Geographic Pricing Differences
- 6.7 Key Input, Energy, Labor and Logistics Costs
- 6.8 Contract Pricing and Purchasing Models
- 6.9 Pricing Sensitivity and Competitive Positioning
- 6.10 Price, Margin and Profitability Implications
Chapter 7 Australia Agro Textiles Market Dynamics
- 7.1 Market Growth Drivers
- 7.1.1 Demand-Side Drivers
- 7.1.2 Technology and Innovation Drivers
- 7.1.3 Infrastructure and Investment Drivers
- 7.1.4 Regulatory and Policy Drivers
- 7.2 Market Restraints
- 7.2.1 Cost and Affordability Constraints
- 7.2.2 Technology and Adoption Barriers
- 7.2.3 Supply Chain and Operational Constraints
- 7.3 Market Challenges
- 7.3.1 Competitive Pressure and Margin Erosion
- 7.3.2 Skills, Infrastructure and Implementation Gaps
- 7.4 Emerging Market Opportunities
- 7.5 Market Dynamics Impact and Time-Horizon Assessment
Chapter 8 Australia Agro Textiles Value Chain Analysis
- 8.1 Industry Value Chain Overview
- 8.2 Upstream Suppliers and Critical Inputs
- 8.3 Technology and Component Providers
- 8.4 Manufacturing or Service Delivery
- 8.5 Distribution, Channel Partners and Integrators
- 8.6 Downstream Applications and End Users
- 8.7 Value Addition and Profit Pools
- 8.8 Vertical Integration and Outsourcing
- 8.9 Supplier Concentration and Risk
- 8.10 Supply Chain Localization and Resilience
Chapter 9 Australia Agro Textiles Market Regulations and Policies
- 9.1 Relevant Laws, Standards and Compliance Frameworks
- 9.2 Product, Service, Safety and Quality Requirements
- 9.3 Government Policies, Incentives and Subsidies
- 9.4 Imports, Exports and Trade Barriers
- 9.5 Public Procurement and Local Content Requirements
- 9.6 Environmental and Sustainability Compliance
- 9.7 Upcoming Policy Changes and Market Implications
Chapter 10 Australia Agro Textiles Market Hotspots and Opportunities
- 10.1 Market Opportunity Mapping and Growth Hotspots
- 10.2 High-Growth Applications and Customer Groups
- 10.3 Underserved Markets and White-Space Opportunities
- 10.4 Emerging Technology and Product Opportunities
- 10.5 New Capacity and Investment Hotspots
- 10.6 Market Entry and Expansion Opportunities
- 10.7 Distribution and Partnership Opportunities
- 10.8 Near-Term and Long-Term Commercial Potential
- 10.9 Opportunity Attractiveness and Execution Risks
Chapter 11 Australia Agro Textiles Market Outlook, 2025-2035
- 11.1 Market Size and Analysis
- 11.1.1 Revenue (Market Measurement: 2025: USD 98.5 million → 2035: USD 165.4 million)
- 11.1.2 Market Volume and Quantity Sold
- 11.1.3 Historical Market Size, 2018-2025
- 11.1.4 Base-Year Market Size, 2025
- 11.2 Market Forecast, 2025-2035
- 11.2.1 Revenue Forecast to 2035
- 11.2.2 Volume Forecast to 2035
- 11.2.3 CAGR and Year-on-Year Growth
- 11.2.4 Incremental Revenue Opportunity
- 11.3 Forecast Assumptions and Scenario Analysis
- 11.3.1 Base-Case Forecast
- 11.3.2 Optimistic and Conservative Scenarios
- 11.3.3 Technology, Pricing and Policy Sensitivities
- 11.4 Market Attractiveness and Growth Outlook
Chapter 12 Australia Agro Textiles Market Segmentation and Outlook
- 12.1 Segmentation Summary and Market Shares, 2025
- 12.2 Largest and Fastest-Growing Segments
- 12.3 By Product Type - Market Size and Forecast, 2025-2035
- 12.3.1 Segment Definition and Scope
- 12.3.2 Historical Market Size, 2018-2025
- 12.3.3 Revenue Forecast, 2025-2035
- 12.3.4 Volume Forecast, 2025-2035
- 12.3.5 Base-Year Market Share, 2025
- 12.3.6 Segment CAGR and Growth Drivers
- 12.3.7 Subsegment Market Size and Forecast
- 12.3.7.1 Protective and Windbreak Netting
- 12.3.7.2 Ground Management Textiles
- 12.3.7.3 Crop and Greenhouse Fabrics
- 12.3.7.4 Livestock and Silage Textiles
- 12.3.8 Subsegment Pricing and Adoption Trends
- 12.3.9 Leading Suppliers and Competition
- 12.3.10 Regional Demand and Opportunities
- 12.4 By Crop Type - Market Size and Forecast, 2025-2035
- 12.4.1 Segment Definition and Scope
- 12.4.2 Historical Market Size, 2018-2025
- 12.4.3 Revenue Forecast, 2025-2035
- 12.4.4 Volume Forecast, 2025-2035
- 12.4.5 Base-Year Market Share, 2025
- 12.4.6 Segment CAGR and Growth Drivers
- 12.4.7 Subsegment Market Size and Forecast
- 12.4.7.1 Orchard and Vine Crops
- 12.4.7.2 Vegetable and Berry Crops
- 12.4.7.3 Nursery and Floriculture Crops
- 12.4.7.4 Pasture and Mixed Farming
- 12.4.8 Subsegment Pricing and Adoption Trends
- 12.4.9 Leading Suppliers and Competition
- 12.4.10 Regional Demand and Opportunities
- 12.5 By Application - Market Size and Forecast, 2025-2035
- 12.5.1 Segment Definition and Scope
- 12.5.2 Historical Market Size, 2018-2025
- 12.5.3 Revenue Forecast, 2025-2035
- 12.5.4 Volume Forecast, 2025-2035
- 12.5.5 Base-Year Market Share, 2025
- 12.5.6 Segment CAGR and Growth Drivers
- 12.5.7 Subsegment Market Size and Forecast
- 12.5.7.1 Weather Protection
- 12.5.7.2 Pest Exclusion
- 12.5.7.3 Soil Management
- 12.5.7.4 Controlled Microclimates
- 12.5.8 Subsegment Pricing and Adoption Trends
- 12.5.9 Leading Suppliers and Competition
- 12.5.10 Regional Demand and Opportunities
- 12.6 By Sales Channel - Market Size and Forecast, 2025-2035
- 12.6.1 Segment Definition and Scope
- 12.6.2 Historical Market Size, 2018-2025
- 12.6.3 Revenue Forecast, 2025-2035
- 12.6.4 Volume Forecast, 2025-2035
- 12.6.5 Base-Year Market Share, 2025
- 12.6.6 Segment CAGR and Growth Drivers
- 12.6.7 Subsegment Market Size and Forecast
- 12.6.7.1 Direct Manufacturer Sales
- 12.6.7.2 Specialist Distributors
- 12.6.7.3 Installer-Led Procurement
- 12.6.7.4 Digital Direct Sales
- 12.6.8 Subsegment Pricing and Adoption Trends
- 12.6.9 Leading Suppliers and Competition
- 12.6.10 Regional Demand and Opportunities
- 12.7 By State - Market Size and Forecast, 2025-2035
- 12.7.1 Segment Definition and Scope
- 12.7.2 Historical Market Size, 2018-2025
- 12.7.3 Revenue Forecast, 2025-2035
- 12.7.4 Volume Forecast, 2025-2035
- 12.7.5 Base-Year Market Share, 2025
- 12.7.6 Segment CAGR and Growth Drivers
- 12.7.7 Subsegment Market Size and Forecast
- 12.7.7.1 Victoria
- 12.7.7.2 Queensland
- 12.7.7.3 South Australia
- 12.7.7.4 Remaining States and Territories
- 12.7.8 Subsegment Pricing and Adoption Trends
- 12.7.9 Leading Suppliers and Competition
- 12.7.10 Regional Demand and Opportunities
- 12.8 Segment Growth Comparison
- 12.9 Segment Attractiveness and Priority Matrix
Chapter 13 Australia Agro Textiles End-Use and Application Market Outlook
- 13.1 End-Use Industry and Customer Demand Structure
- 13.2 Leading Applications and Customer Groups
- 13.3 End-Use Market Size, Share and Forecast
- 13.4 Major End-Use Industry Deep Dives
- 13.4.1 Customer Requirements and Use Cases
- 13.4.2 Demand and Replacement Cycles
- 13.4.3 Technical and Regulatory Considerations
- 13.4.4 Purchasing and Procurement Models
- 13.4.5 Leading Vendors and Distribution Channels
- 13.4.6 Forecast and Commercial Opportunities
- 13.5 Emerging Applications and Cross-Segment Demand
- 13.6 End-Use Industry Investment Priorities
Chapter 14 Australia Agro Textiles Geographic Market Outlook, 2025-2035
- 14.1 Domestic Market Distribution and Demand Clusters
- 14.2 State- or Province-Wise Market Size and Forecast, 2025-2035
- 14.3 City and Metropolitan Market Outlook
- 14.4 Industrial, Manufacturing and Commercial Clusters
- 14.5 Geographic Concentration of Key End Users
- 14.6 Local Pricing and Purchasing Differences
- 14.7 Domestic Production Facilities and Capacity Map
- 14.8 Local Infrastructure and Project Pipeline
- 14.9 State-Level Policy and Incentive Differences
- 14.10 Subnational Investment Hotspots and Opportunities
- 14.11 Distribution and Logistics Networks
- 14.12 Domestic Competitive Footprint
Chapter 15 Australia Agro Textiles Technology, Innovation and Sustainability Outlook
- 15.1 Technology Landscape and Maturity
- 15.2 Product, Process and Service Innovation
- 15.3 AI, Automation and Digital Tools in the Industry
- 15.4 Technology Adoption and Performance Benchmarking
- 15.5 Innovation Pipeline and R&D Investment
- 15.6 Patent and Intellectual Property Trends
- 15.7 Energy Efficiency and Resource Management
- 15.8 Sustainability, Recycling and Circularity
- 15.9 Technology Roadmap, 2025-2035
- 15.10 Risks of Obsolescence and Technology Substitution
Chapter 16 Australia Agro Textiles Market Key Strategic Imperatives
- 16.1 Growth and Market Entry Priorities
- 16.2 High-Return Products and Segments
- 16.3 Pricing, Profitability and Cost Optimization
- 16.4 Technology Investment and Product Differentiation
- 16.5 Supply Chain Localization and Resilience
- 16.6 Distribution and Customer Acquisition
- 16.7 Partnership, Acquisition and Capacity Strategy
- 16.8 Regional Expansion Priorities
- 16.9 Short-, Medium- and Long-Term Actions
Chapter 17 Competition Outlook
- 17.1 Industry Competition Characteristics
- 17.2 Market Structure and Concentration
- 17.3 Market Share and Competitive Positioning, 2025
- 17.4 Company-Wise Revenue and Product Benchmarking
- 17.5 Production and Service Capacity Benchmarking
- 17.6 Technology, Pricing and Differentiation
- 17.7 Regional Footprint and Distribution Strength
- 17.8 Mergers, Acquisitions and Strategic Alliances
- 17.9 New Entrants and Competitive Threats
- 17.10 Porter's Five Forces and Industry Attractiveness
- 17.11 Competitive Outlook, 2025-2035
Chapter 18 Company Profiles
- 18.1 Company Coverage and Selection Criteria
- 18.2 Netpro Group
- 18.2.1 Business Description
- 18.2.2 Company Ownership and Geographic Presence
- 18.2.3 Product and Service Portfolio
- 18.2.4 Manufacturing and Operating Footprint
- 18.2.5 Production Capacity and Expansion Plans
- 18.2.6 Financial Performance and Investment
- 18.2.7 Market Share and Competitive Position
- 18.2.8 Technology and Innovation Capabilities
- 18.2.9 Strategic Alliances or Partnerships
- 18.2.10 Recent Developments
- 18.2.11 Growth Strategy and Outlook
- 18.3 GALE Pacific
- 18.4 Polyfab Australia
- 18.5 Haverford
- 18.6 Southwest Crop Protection
- 18.7 Advanced Netting
- 18.8 G2 Netting Group
- 18.9 Sage Horticultural
- 18.10 Arborgreen
- 18.11 Drape Net
- 18.12 Other Relevant Market Participants
Note: Every listed company is profiled on the structure shown under the first company. The company list is preliminary and may change based on research findings, market developments, data availability and client requirements.
Chapter 19 Disclaimer
- 19.1 Research and Forecast Disclaimer
- 19.2 Data Source and Estimation Limitations
Note: The depth of individual sections depends on data availability for this market. Volume, capacity, trade and other unit-based metrics are included where applicable.

