
Subsidized urea and record harvests anchor nutrient demand
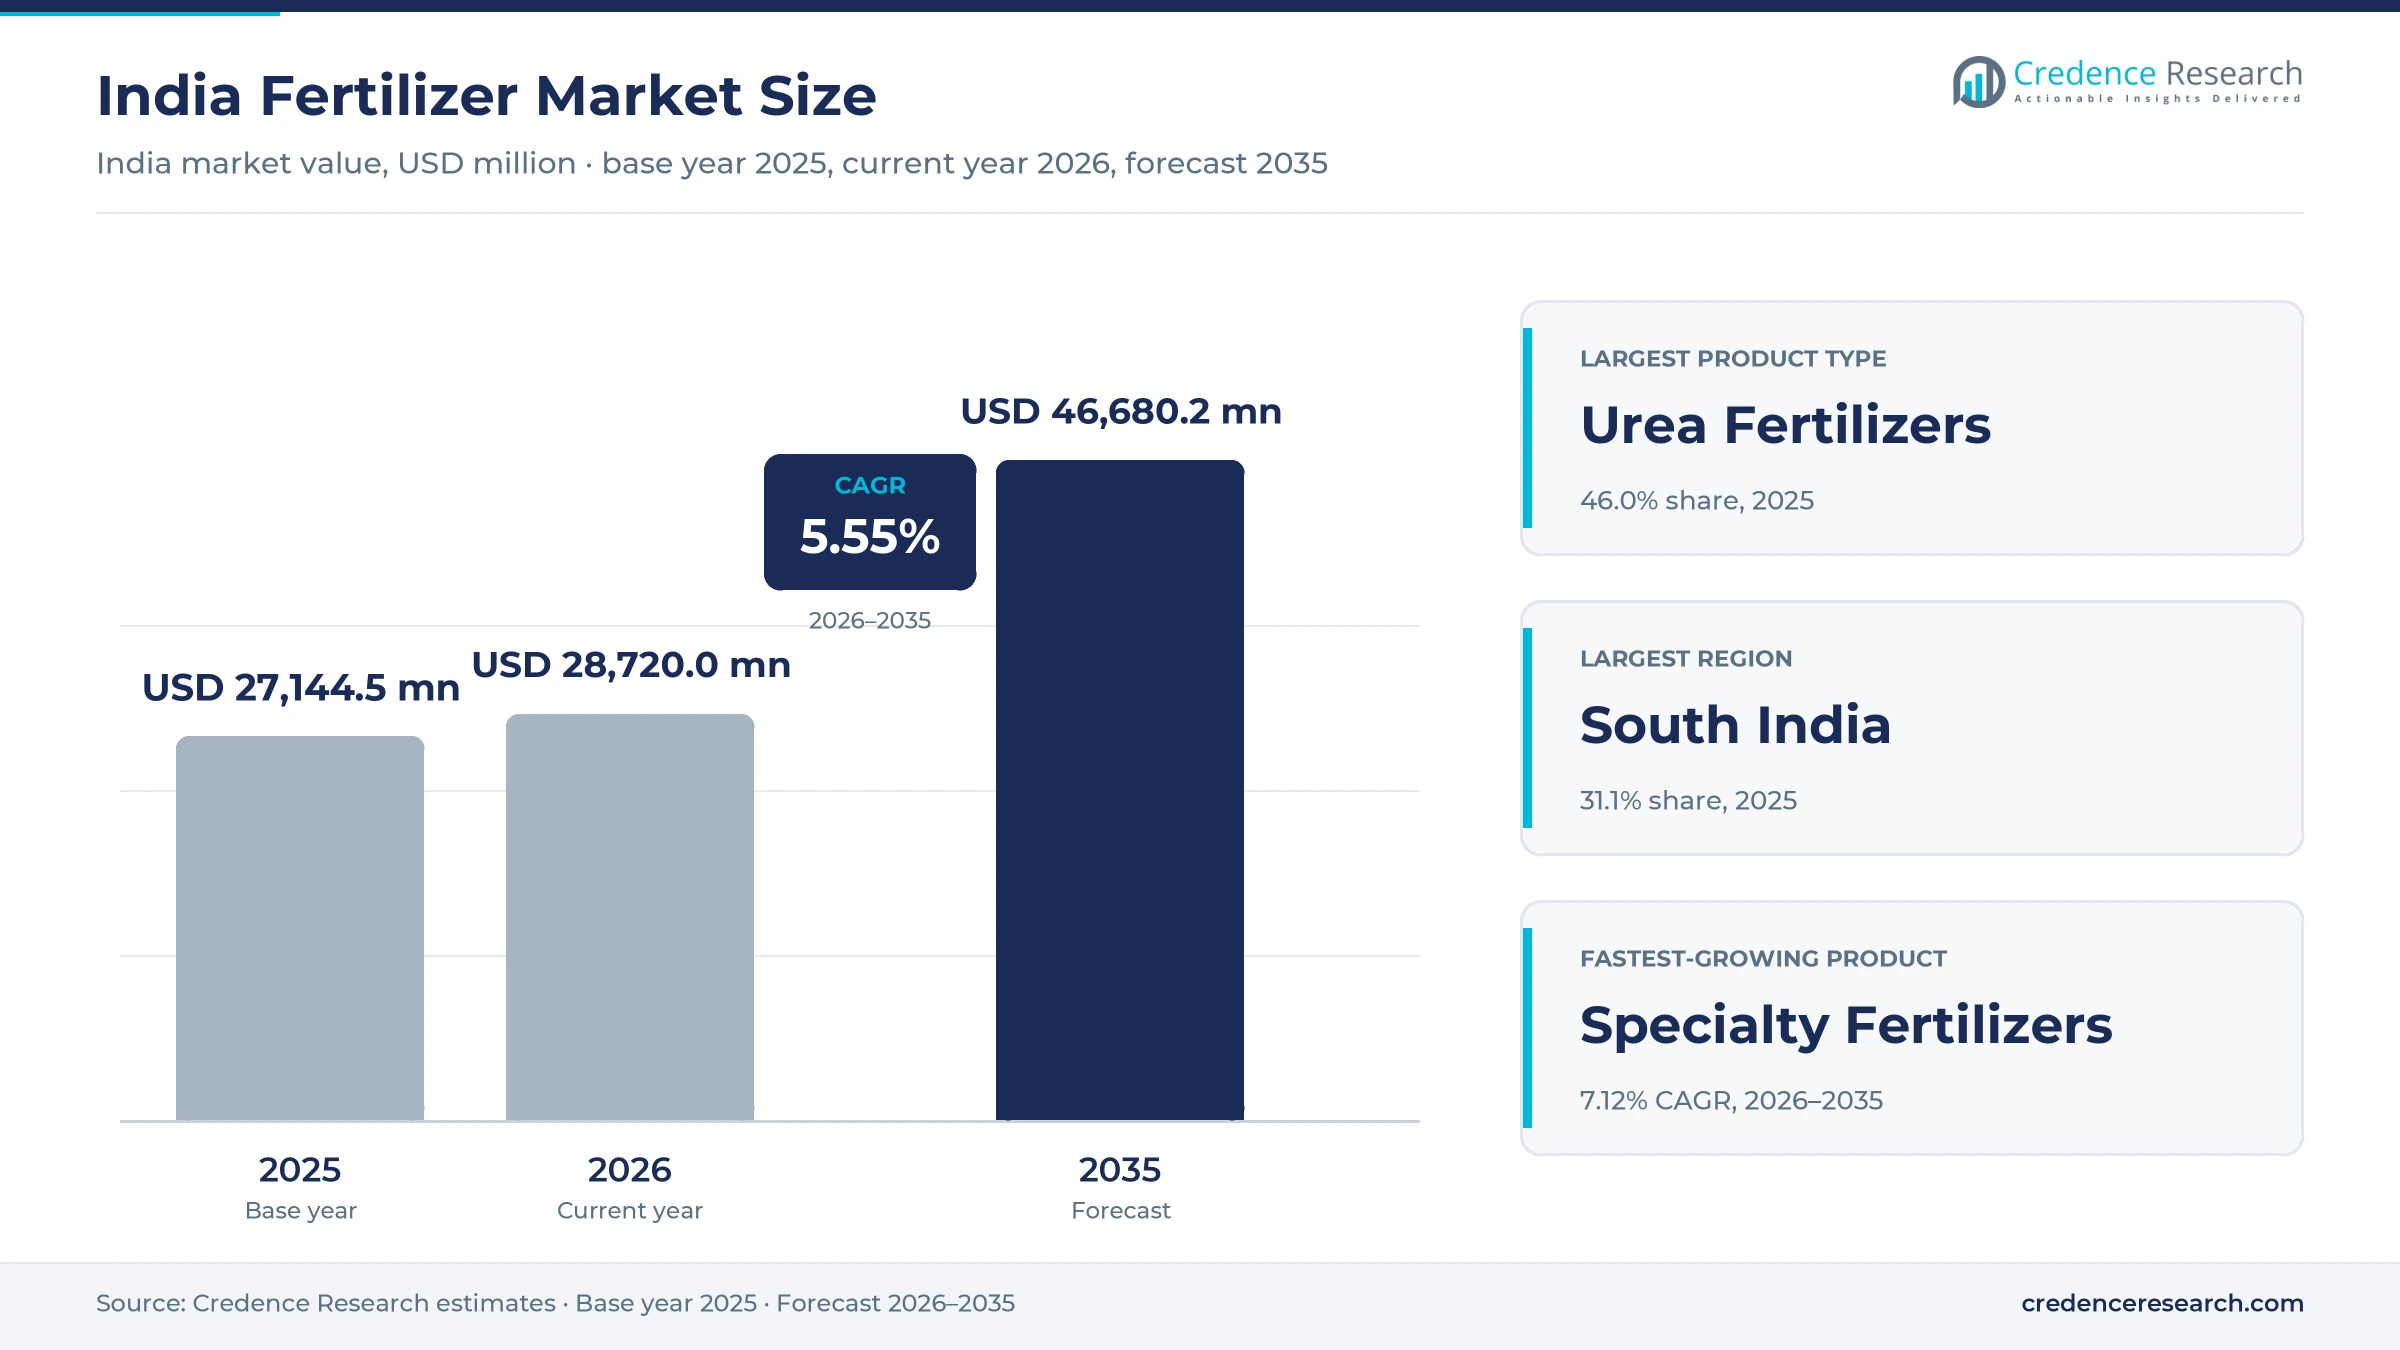
The India fertilizer market was valued at USD 27.14 billion in 2025 and is projected to increase from USD 28.72 billion in 2026 to USD 46.68 billion by 2035, registering a CAGR of 5.55% during 2026–2035. Demand comes from more than 150 million hectares of arable land, record grain harvests, double cropping on irrigated farms and a government subsidy system that keeps farm-gate prices low. South India held the largest regional share, 31.1% in 2025, because rice, cotton, chili and horticulture belts in Andhra Pradesh, Telangana, Karnataka and Tamil Nadu use complex grades heavily. East and Central India grows fastest at 6.15% a year, as farms there start from lower nutrient use per hectare. Domestic urea output reached a record 314.09 lakh metric tons in 2023-24, and new plants such as Namrup-IV in Assam aim to cut import dependence further.
Which crop nutrients are counted in India?
The estimate measures the value of chemical and specialty crop nutrients sold to farmers in India, including urea, diammonium phosphate, complex NPK grades, single superphosphate, muriate of potash, water-soluble grades, nano liquids and micronutrient blends. Values reflect the full delivered cost of products, including the portion paid through government subsidy, and are stated in USD million at current prices.
The estimate excludes crop protection chemicals, seeds and industrial uses of ammonia and nitric acid, such as explosives. The value chain runs from gas, rock phosphate, potash and sulfur suppliers through manufacturers and importers to cooperative societies, private dealers, government outlets and farmers.
India Fertilizer Market Insights
- The India fertilizer market was valued at USD 27.14 billion in 2025 and is projected to reach USD 46.68 billion by 2035, registering a CAGR of 5.55% during 2026–2035.
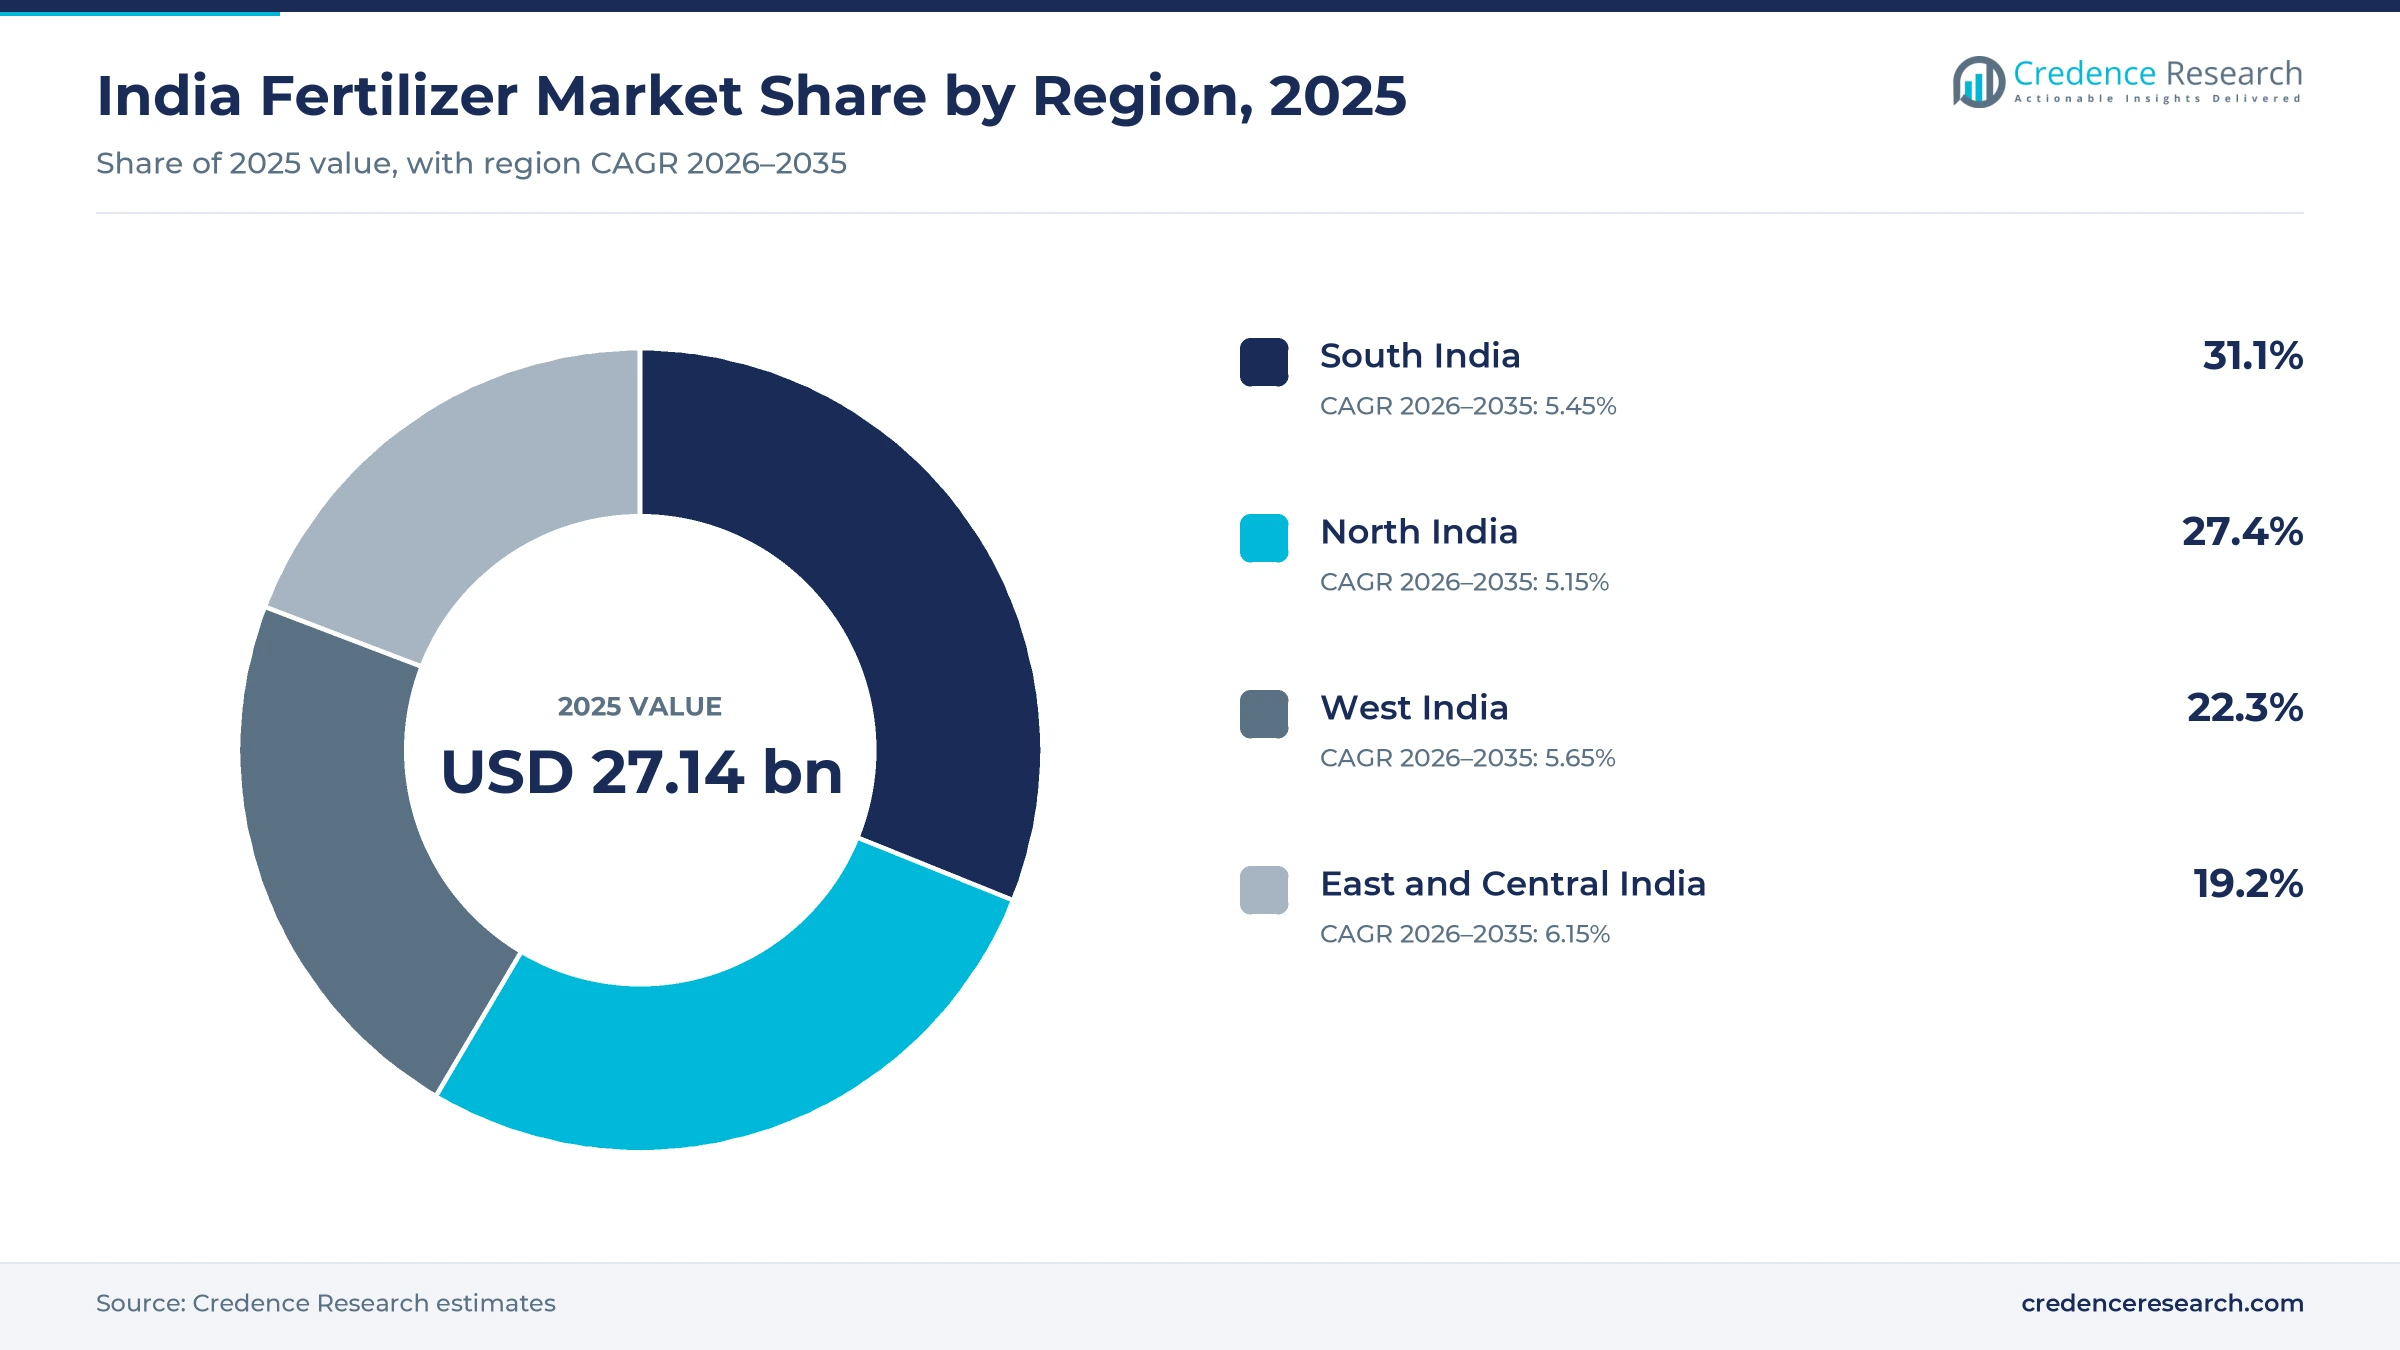
- South India held 31.1% of 2025 value, because rice, cotton and horticulture belts in the southern states rely heavily on complex grades.
- Urea led with 46.0% of 2025 value, since its controlled retail price of INR 242 per 45-kilogram bag keeps it the cheapest nitrogen source.
- The Union Cabinet approved the 12.7 lakh metric ton Namrup-IV urea complex in Assam on March 19, 2025, at a cost of INR 10,601.40 crore.
- Specialty products grow fastest at 7.12% a year during 2026–2035, as nano liquids and water-soluble grades gain among farmers.
Urea, cereals and private dealers hold the largest shares
Why does urea still dominate nutrient spending?
Based on product type, the market is categorized into urea, complex and NPK grades, phosphatic, potassic and specialty products. Urea Fertilizers led with 46.0% of 2025 value, because a fixed farm-gate price makes nitrogen far cheaper than phosphorus or potash. Specialty Fertilizers grow fastest at 7.12% a year, as nano liquids, water-soluble grades and micronutrient blends spread through cooperative and dealer channels.
How do cereals shape nutrient demand?
Based on crop type, the market is categorized into cereals and grains, oilseeds and pulses, fruits and vegetables and commercial crops. Cereals and Grains led with 54.0% of 2025 value, because rice and wheat cover the largest area and receive heavy nitrogen doses. Fruits and Vegetables grow fastest at 6.54% a year, as horticulture farms adopt drip irrigation, fertigation and water-soluble grades.
How do cooperatives and private dealers split supply?
Based on distribution channel, the market is categorized into cooperative networks, private dealer networks, government retail channels and direct and digital channels. Private Dealer Networks led with 52.0% of 2025 value, because village retailers stock several brands and offer credit. Direct and Digital Channels grow fastest at 7.56% a year, as manufacturers sell specialty grades online and through farmer producer groups.
| Segment Group | Leading Sub-segment | Share, 2025 | Fastest-growing Sub-segment | CAGR, 2026–2035 |
|---|---|---|---|---|
| By Product Type | Urea Fertilizers | 46.0% | Specialty Fertilizers | 7.12% |
| By Crop Type | Cereals and Grains | 54.0% | Fruits and Vegetables | 6.54% |
| By Distribution Channel | Private Dealer Networks | 52.0% | Direct and Digital Channels | 7.56% |
Request a Free Sample
Fill in your details and we'll send you a free sample report.
- Sample data tables & charts
- Research methodology
Balanced nutrients, higher yields and new plants lift use
How does balanced nutrient adoption lift spending?
Balanced nutrient adoption lifts spending, because farmers who test soil and add phosphorus, potash and sulfur buy more value per hectare than urea-only users. More than 25 crore soil health cards had been distributed to farmers by July 2025, and the central government released INR 1,706.18 crore to states for the scheme by February 2025. The Cabinet also approved nutrient-based subsidy support of about INR 37,952.29 crore for the 2025-26 rabi season, according to the Prime Minister's Office. That support covers 28 grades of phosphatic and potassic products, including DAP. As a result, complex and NPK grades gain share across the forecast period, while urea grows more slowly at the national level.
Why do cropping intensity and record harvests raise nutrient demand?
Cropping intensity and record harvests raise nutrient demand, because farms that grow two or three crops a year remove more nutrients from the soil. Foodgrain output reached a record 357.73 million metric tons in 2024-25, up about 8% from the previous year. Rice output reached 1,501 lakh metric tons, up from 1,378 lakh metric tons, while wheat rose by 46.53 lakh metric tons. Fertilizer use climbed to 214.1 kilograms per hectare of arable land in 2024, from 198.8 kilograms in 2023, according to World Bank data. Consequently, cereals and grains hold 54.0% of 2025 value, and rising yields keep nitrogen and phosphorus demand firm in irrigated districts each season.
How is domestic capacity expansion supporting supply?
Domestic capacity expansion supports supply, because new plants reduce shortages during peak sowing and limit exposure to import prices. Urea production rose to over 306 lakh metric tons in 2024-25 from about 227 lakh metric tons in 2013-14, according to All India Radio. Output of DAP and NPKS grades grew from over 110 lakh metric tons to more than 158 lakh metric tons over the same decade. The Cabinet approved the 12.7 lakh metric ton Namrup-IV urea complex in Assam on March 19, 2025, with a 48-month schedule, according to The Week. In turn, local supply strengthens for eastern states such as Bihar and West Bengal, where regional demand is rising from a lower base of use per hectare.
Why does budget support keep farm prices stable?
Budget support keeps farm prices stable, because the government pays most of the gap between production cost and retail price. The Union Budget for 2026-27 allocated about INR 1.71 lakh crore to the Department of Fertilizers. A 45-kilogram bag of urea retails at INR 242, while a DAP bag sells at INR 1,350 under the subsidy system. During kharif 2025, urea availability reached 183 lakh metric tons against a pro-rata requirement of 143 lakh metric tons. Consequently, farmers keep buying at steady prices even when global ammonia and phosphate costs rise. This support also explains why urea holds 46.0% of 2025 value across all regions of the country.
Nano products, soil testing and import substitution rise
How is the rise of nano liquids playing out?
Nano liquid products are rising, because a small bottle can replace part of a bag of granular nitrogen or phosphate. IFFCO sold 365.09 lakh bottles of nano products in 2024-25, up 47% from 248.95 lakh bottles a year earlier, according to AgroSpectrum. Liquid Nano DAP sales rose 118%, while Nano Urea Plus sales rose 31% in the same year. The cooperative said this volume equals about 12 lakh metric tons of conventional urea. As a result, demand for nanoscale crop nutrients widens across cooperative outlets. Specialty products grow fastest at 7.12% a year during the forecast period, led by nano and water-soluble grades.
Why is the shift toward integrated phosphate production rising?
The shift toward integrated phosphate production is rising, because producers want to reduce reliance on imported phosphoric acid and ammonia. Paradeep Phosphates completed its merger with Mangalore Chemicals and Fertilizers on Oct. 16, 2025, lifting capacity from 3.0 million to 3.7 million metric tons a year. The combined company runs plants at Paradeep in Odisha, Mangalore in Karnataka and Goa. Coromandel International reached the commissioning milestone for phosphoric and sulfuric acid plants at Kakinada in March 2026, which moved the units into trial production. Consequently, complex and phosphatic grades gain more stable supply, which also helps blends that combine phosphate with potash. Integrated producers can also hold prices steadier when global acid costs rise.
Can water-soluble grades open a horticulture opportunity?
Water-soluble and specialty grades open a clear opportunity, because fruit, vegetable and plantation farms pay more for precise feeding. IFFCO sold 1.92 lakh metric tons of water-soluble, specialty and seaweed-based granule products in 2024-25. Its liquid seaweed product sales rose 33% to 11.55 lakh liters, and granule sales rose 28% to 68,000 metric tons. In turn, fruits and vegetables grow fastest among crop types at 6.54% a year. Growers that use drip lines also buy fully soluble nutrient grades for fertigation. This mix raises value per hectare even when total tonnage grows slowly. Specialty grades therefore lift India fertilizer market value faster than volume.
Is there room to grow through biological and organic inputs?
Biological and organic inputs offer a second opening, because soil health programs encourage farmers to restore carbon and microbial activity. IFFCO bio-input sales rose 35% to 8.61 lakh liters in 2024-25, according to the cooperative. More than 25 crore soil health cards now guide farmers on nutrient gaps in their own fields. The NBS scheme also covers sulfur-containing NPKS grades that address deficiencies in many soils. Consequently, producers bundle chemical grades with organic manures and microbial products. Direct and digital channels grow fastest at 7.56% a year as these bundles reach farmer producer groups. Producers that offer agronomy advice with each bundle can build stronger loyalty among growers.
Subsidy costs, import exposure and soil damage weigh in
How does subsidy dependence strain public finances?
Subsidy dependence strains public finances, because retail prices stay fixed while global input costs move sharply. The Department of Fertilizers received about INR 1.71 lakh crore in the 2026-27 budget. In turn, delays in subsidy payments can tie up producer working capital and slow imports before sowing. Producers respond by tightening inventory planning and seeking cheaper long-term contracts for gas, rock phosphate and potash. Timely subsidy payments therefore remain central to steady supply for farmers.
Why does import exposure create supply risk?
Import exposure creates supply risk, because the country still buys urea and phosphate raw materials abroad to meet peak demand. Despite record urea output of 314.09 lakh metric tons in 2023-24, imports continued every year, PTI reported in March 2025. As a result, freight disruptions or export curbs by supplier countries can tighten availability at sowing time. New capacity at Namrup and integrated acid plants at Kakinada aim to reduce this exposure over time.
How does nutrient imbalance damage soil health?
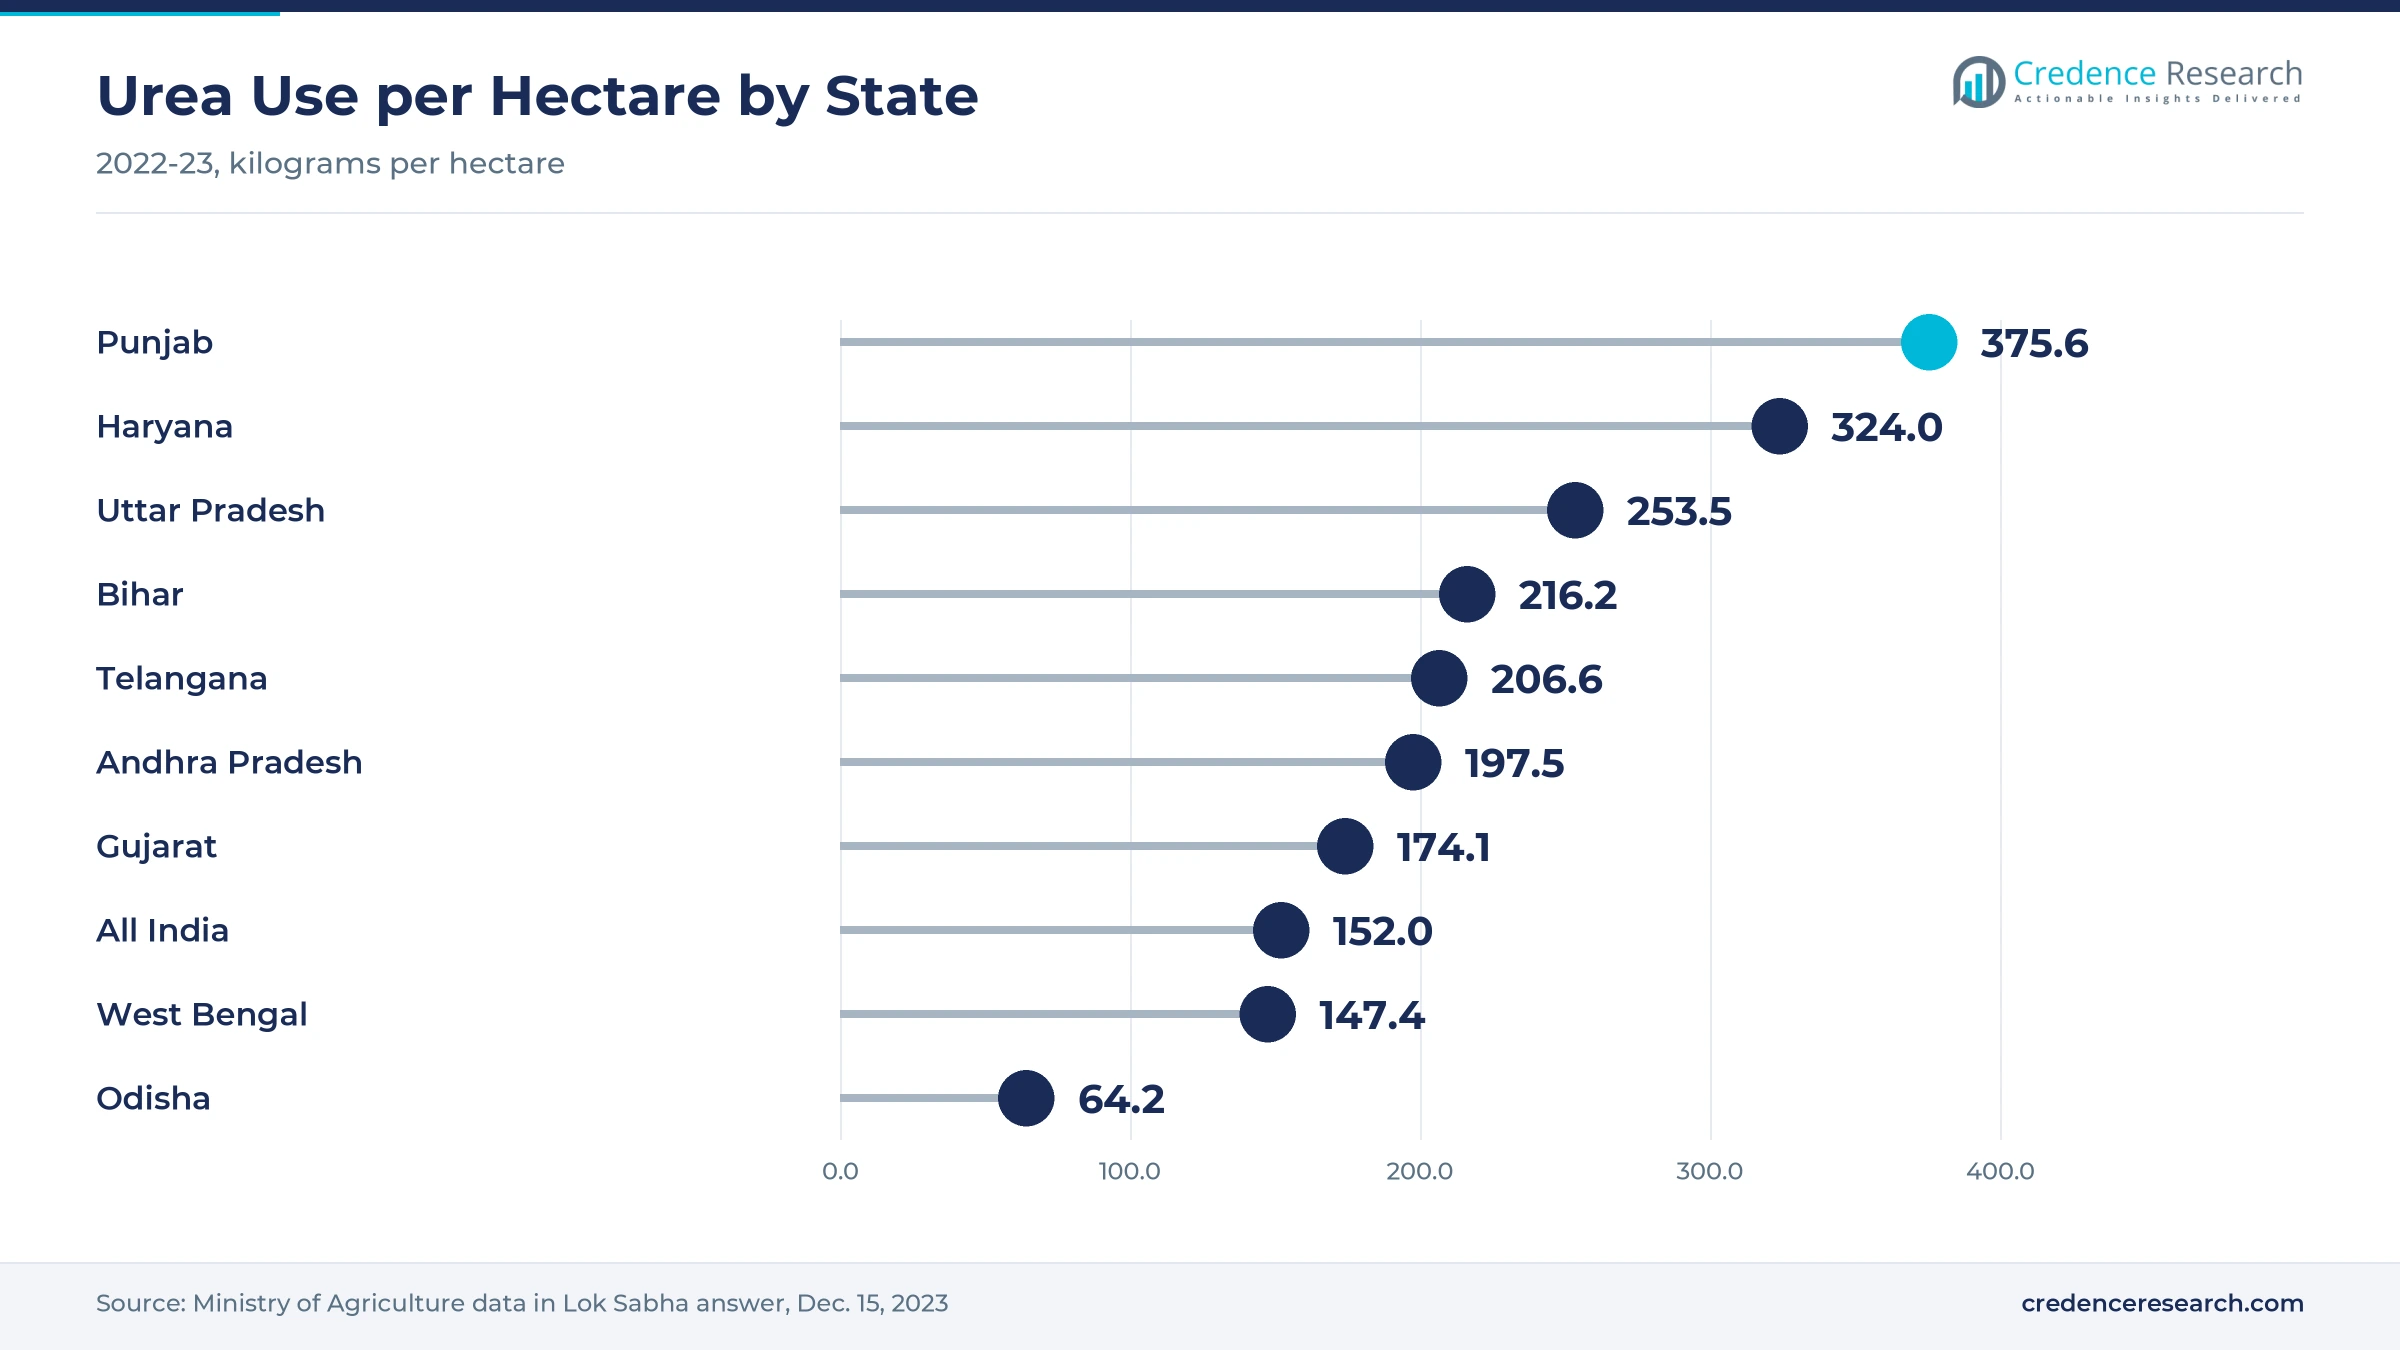
Nutrient imbalance damages soil health, because heavy urea use without enough phosphorus, potash and micronutrients lowers yields over time. Urea use reached 375.6 kilograms per hectare in Punjab in 2022-23, against a national average of 152.0 kilograms. Consequently, the government promotes soil testing and balanced grades to reduce waste and protect long-term productivity in intensive grain belts. Odisha, by contrast, used only 64.2 kilograms per hectare, which shows room for higher balanced use in eastern states.
Will project delays slow the path to self-reliance?
Project delays can slow the path to self-reliance, because large chemical plants often start later than planned. Chambal Fertilisers began ammonium nitrate production at Gadepan about eight months after the January 2026 date it had indicated earlier. The Namrup-IV urea complex carries a 48-month schedule from its March 2025 approval. Consequently, imports will still bridge supply gaps until new capacity reaches farmers in eastern states. Producers that finish projects on time gain share of regional demand first.
Southern states lead as eastern and central farms catch up
| Region | Value, 2025 (USD billion) | Share, 2025 | CAGR, 2026–2035 |
|---|---|---|---|
| South India | 8.44 | 31.1% | 5.45% |
| North India | 7.44 | 27.4% | 5.15% |
| West India | 6.05 | 22.3% | 5.65% |
| East and Central India | 5.21 | 19.2% | 6.15% |
Why does South India lead nutrient spending?
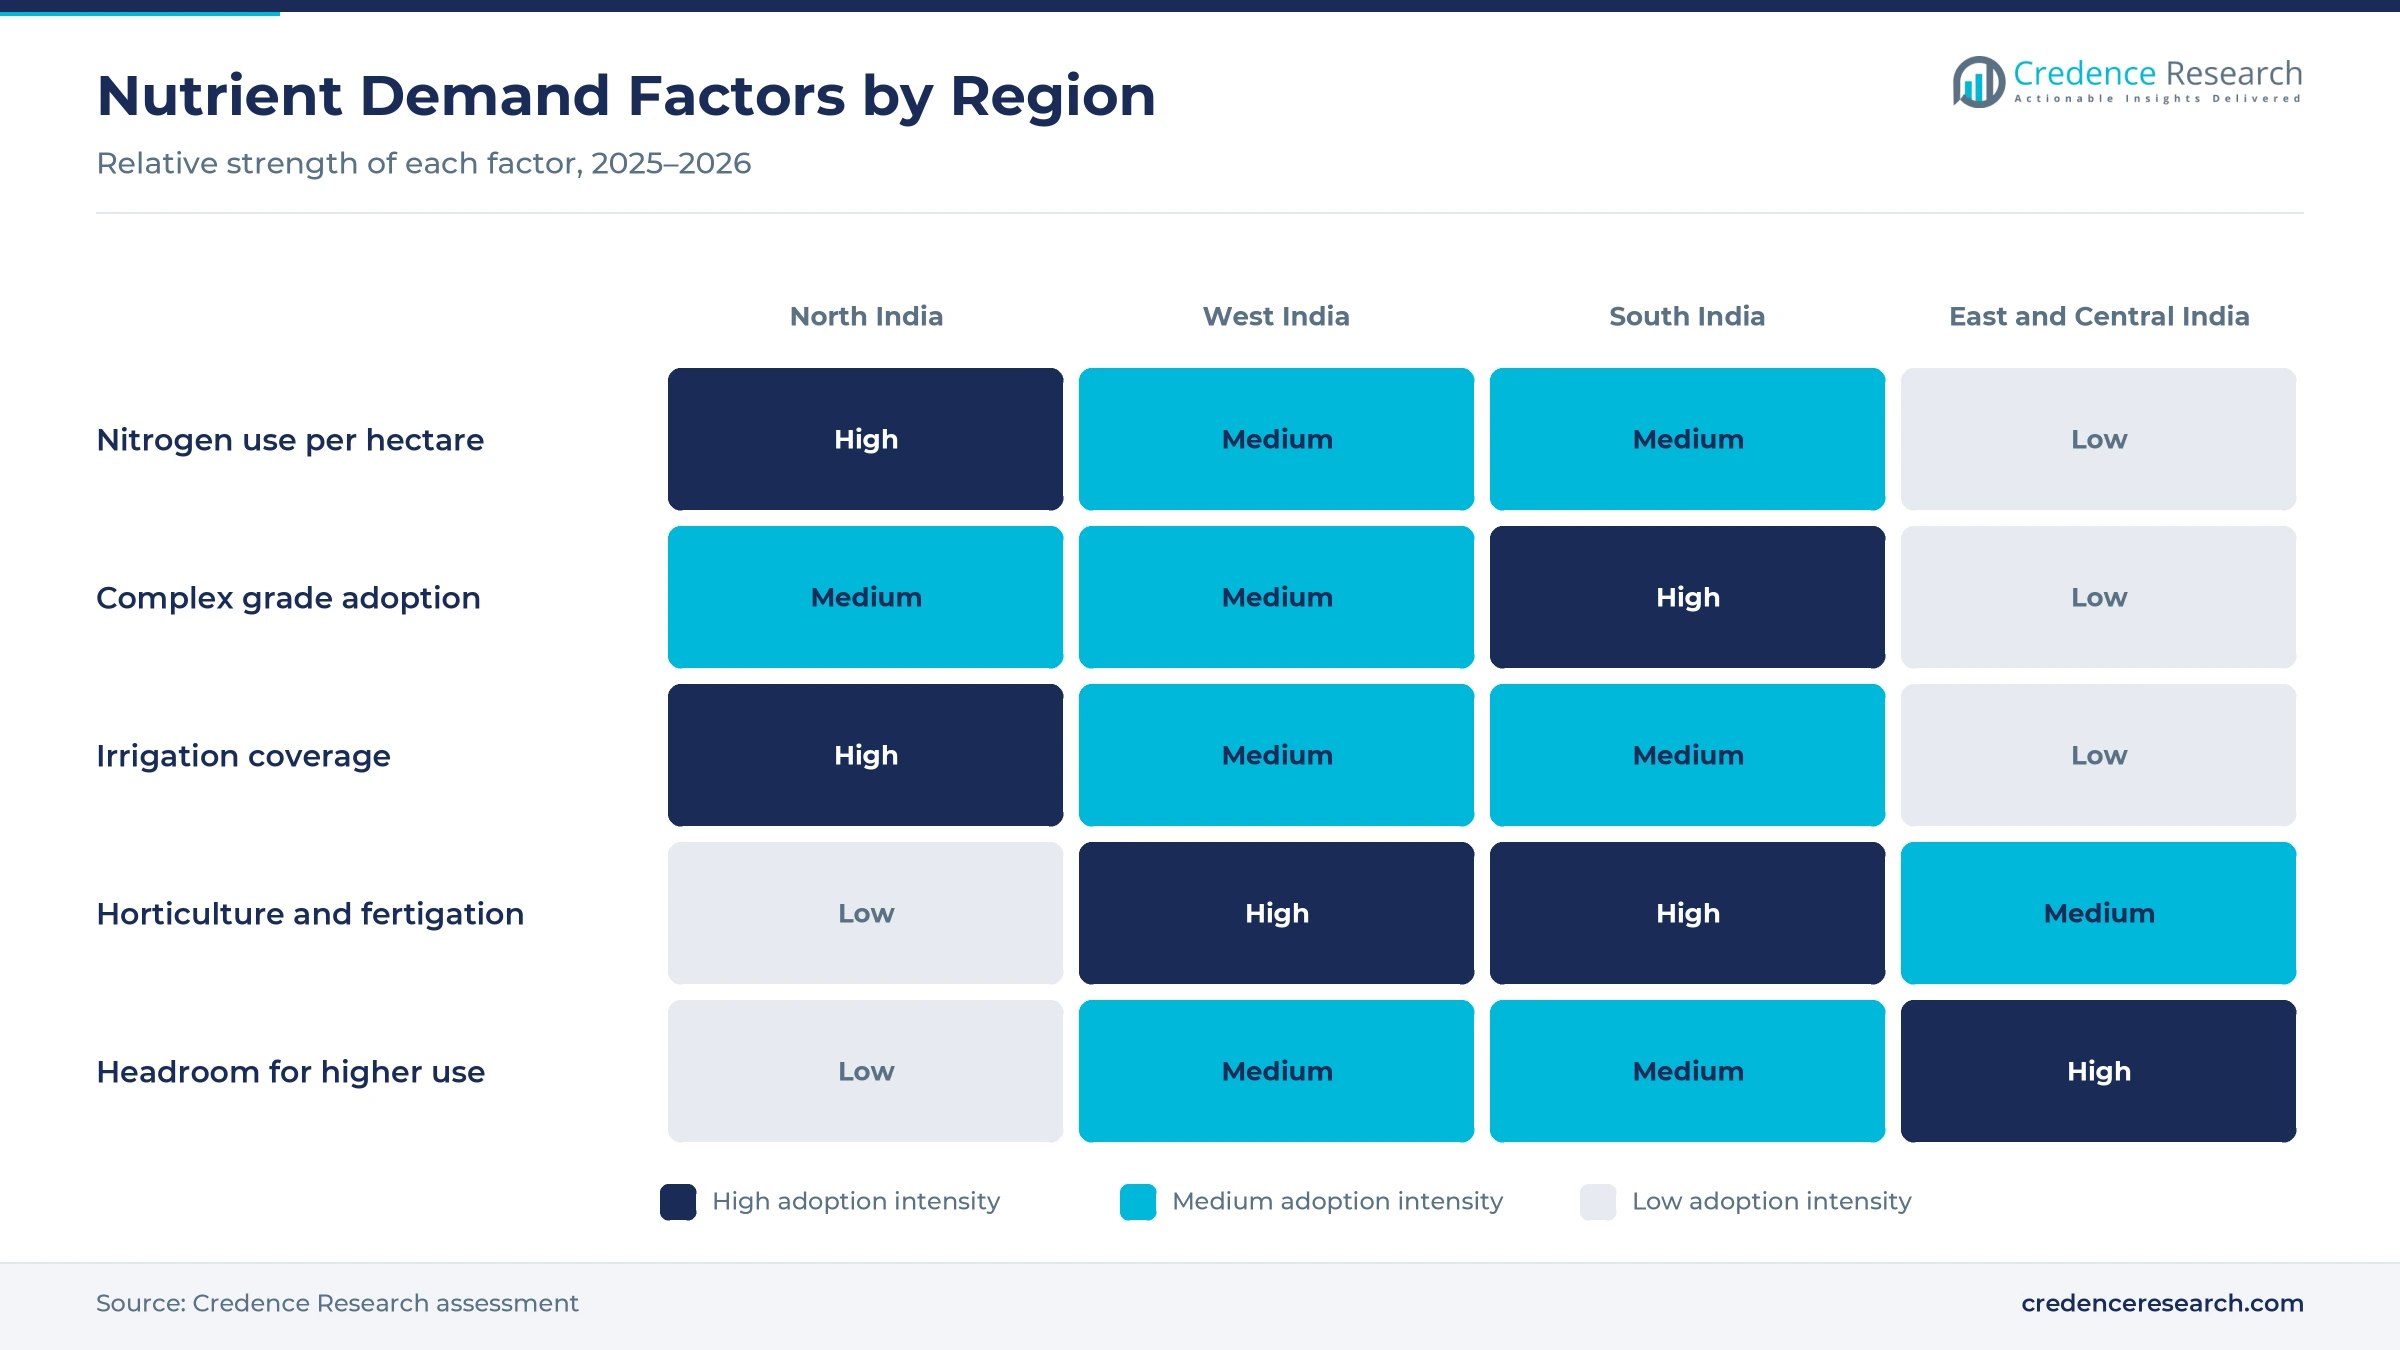
South India held 31.1% of 2025 value and grows at 5.45% a year, because rice, cotton, chili, sugarcane and horticulture belts use complex grades heavily. Urea use reached 206.6 kilograms per hectare in Telangana and 197.5 kilograms in Andhra Pradesh in 2022-23, above the national average. Paradeep Phosphates also gained a Mangalore plant through its October 2025 merger. As a result, southern farms combine high value per hectare with good access to coastal phosphate plants.
How does North India support grain-belt demand?
North India held 27.4% of 2025 value and grows at 5.15% a year, because irrigated rice and wheat farms in Punjab, Haryana and western Uttar Pradesh use the most nitrogen per hectare. Urea use reached 375.6 kilograms per hectare in Punjab and 324.0 kilograms in Haryana in 2022-23, the highest regional demand per hectare. Consequently, the region remains a core demand center, although soil health programs aim to curb excess nitrogen.
What drives demand in West India?
West India held 22.3% of 2025 value and grows at 5.65% a year, because cotton, groundnut, sugarcane and horticulture farms in Gujarat and Maharashtra use a wide range of grades. Urea use reached 174.1 kilograms per hectare in Gujarat in 2022-23, while Maharashtra used 89.8 kilograms, a gap that shapes demand across the region. In turn, drip irrigation and fertigation lift demand for specialty grades in the region.
Why does East and Central India grow fastest?
East and Central India held 19.2% of 2025 value and grows fastest at 6.15% a year, because farms there start from lower nutrient use per hectare. Urea use stood at 64.2 kilograms per hectare in Odisha in 2022-23, well below the national average of 152.0 kilograms. The Namrup-IV complex in Assam will also serve nearby states such as Bihar and West Bengal. Therefore, rising yields and better supply add demand across the region.
Plant approvals, mergers and subsidy decisions, 2025–2026
| Development | Status and market relevance |
|---|---|
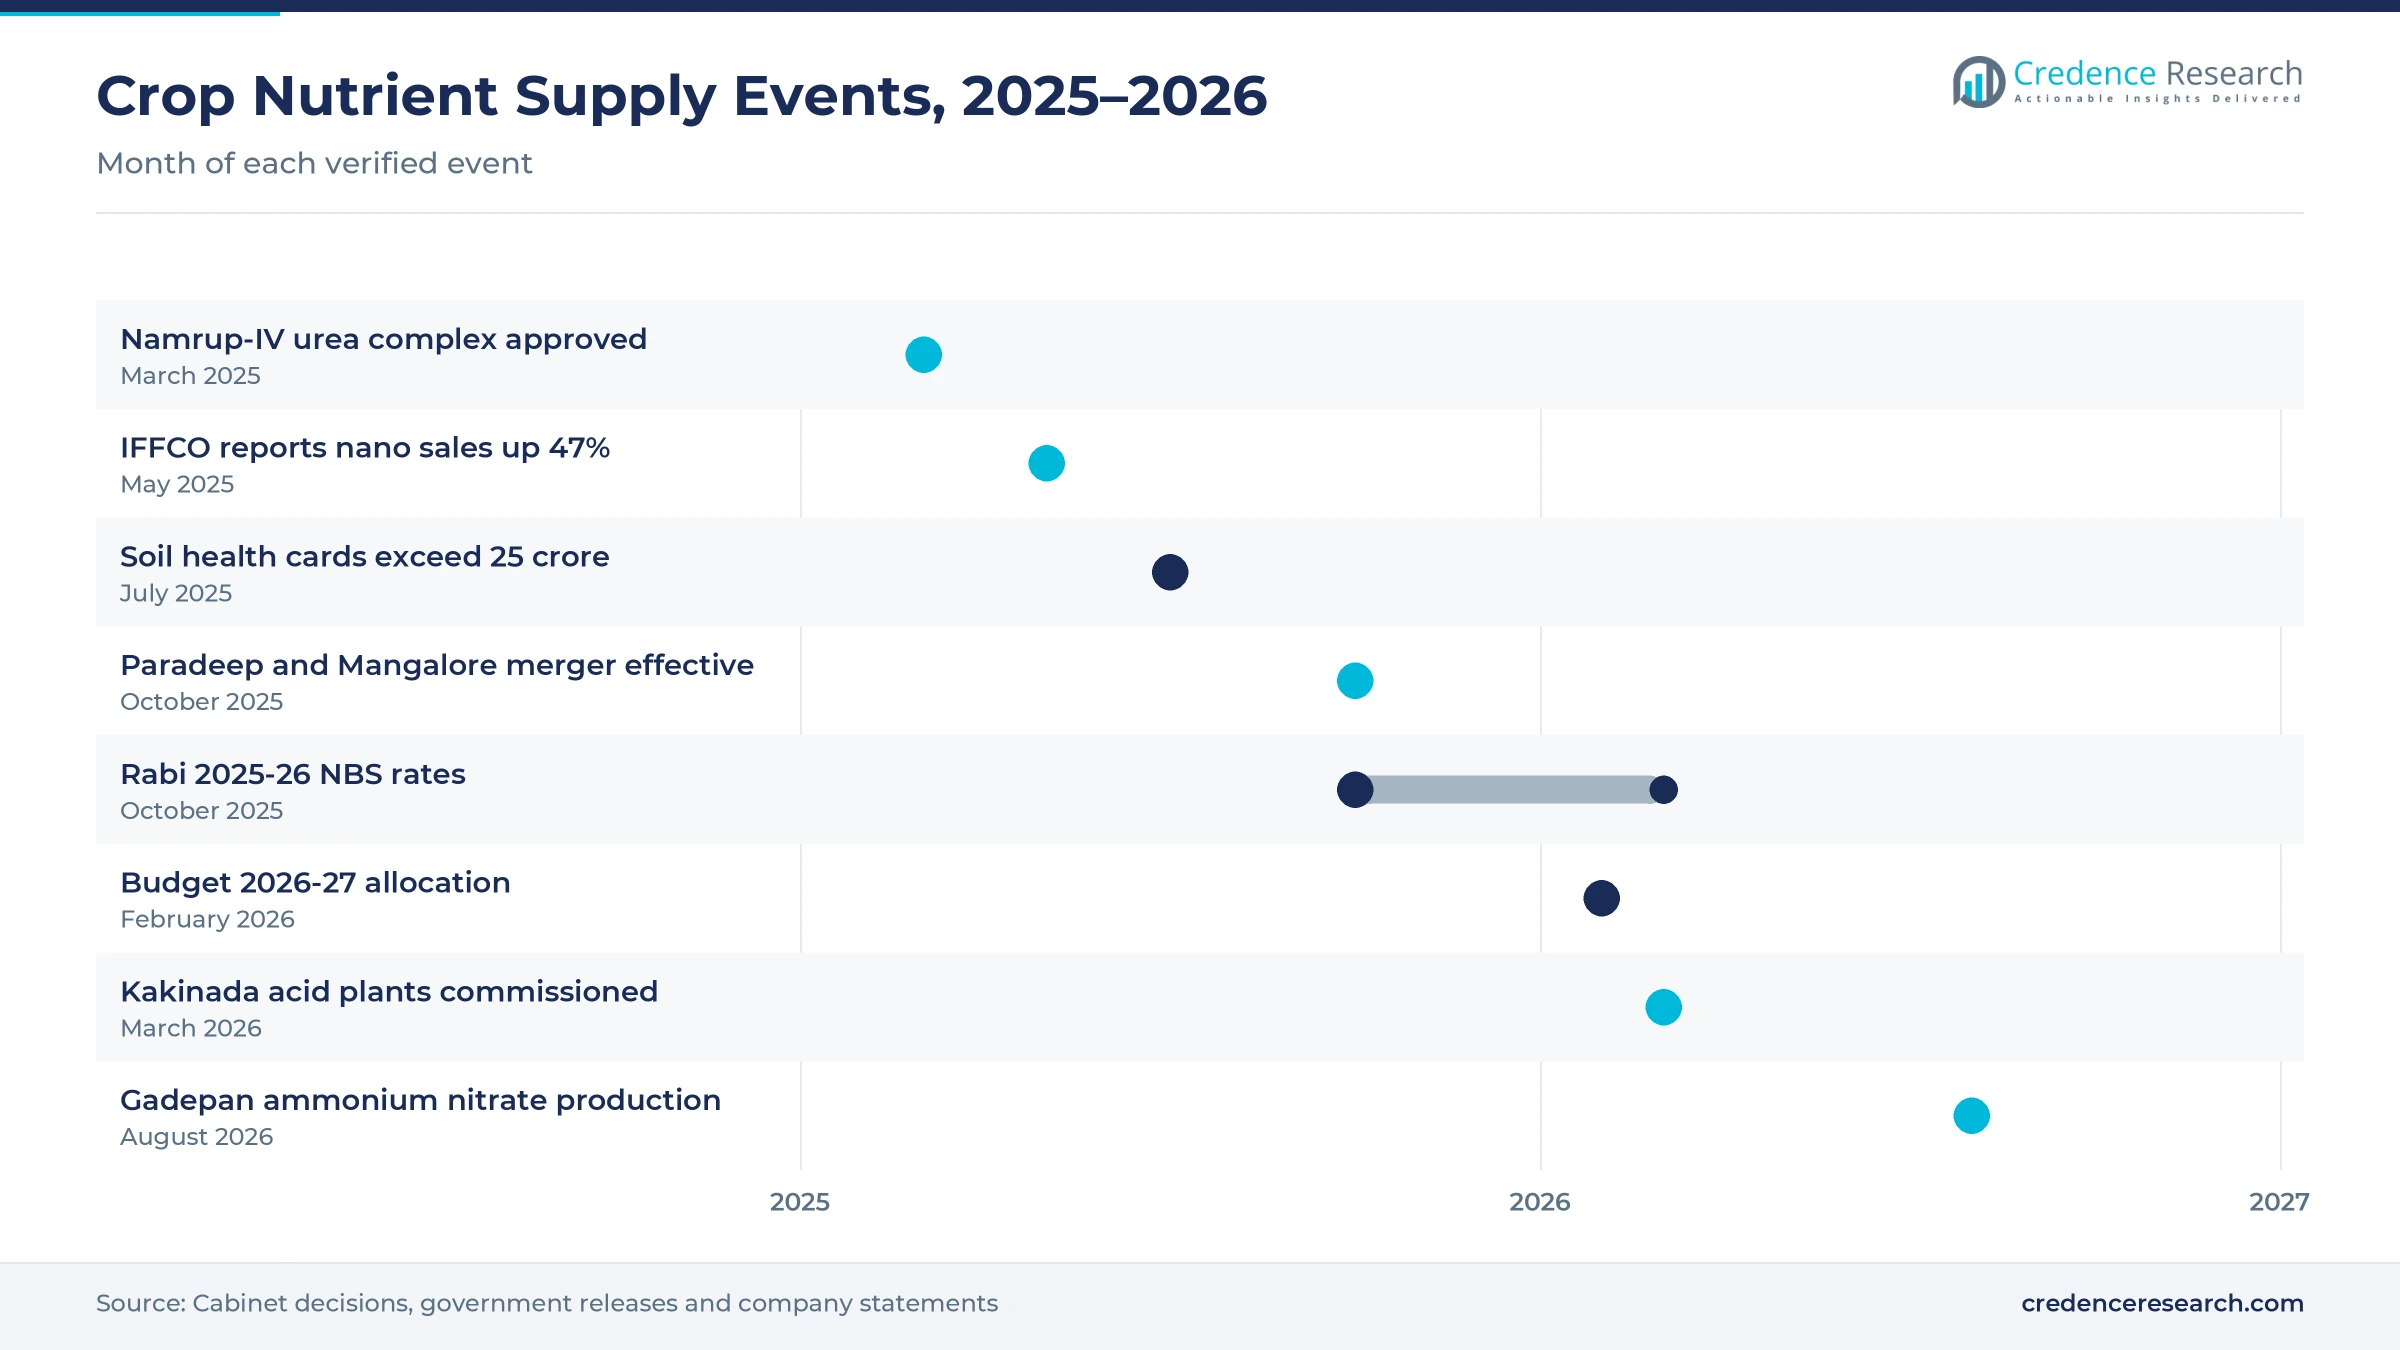
| In March 2025, the Union Cabinet approved the 12.7 lakh metric ton Namrup-IV urea complex in Assam. | Adds domestic urea capacity for eastern and northeastern states |
| In May 2025, IFFCO reported sales of 365.09 lakh bottles of nano products for 2024-25, up 47%. | Expands liquid alternatives to granular nitrogen and phosphate |
| In October 2025, Paradeep Phosphates completed its merger with Mangalore Chemicals and Fertilizers. | Lifts capacity from 3.0 million to 3.7 million metric tons a year |
| In October 2025, the Cabinet approved nutrient-based subsidy rates for the 2025-26 rabi season. | Keeps 28 phosphatic and potassic grades affordable for farmers |
| In March 2026, Coromandel International reached commissioning of acid plants at Kakinada. | Reduces reliance on imported phosphoric acid |
Nano liquids, coated grades and soil data reshape use
- Nano liquids deliver nitrogen and phosphorus as foliar sprays in small bottles, which cuts transport weight and can lower the number of bags used.
- Coated and fortified grades slow nutrient loss and add zinc, boron or sulfur, which helps correct common soil deficiencies.
- Soil health data from more than 25 crore cards guides dealers and farmers toward balanced doses for each plot.
- Drip fertigation feeds water-soluble grades through irrigation lines, which suits fruit, vegetable and plantation farms that need precise doses.
Need a Custom Version of This Report?
Tailor the scope, geography, or segments to your exact requirements.
- Custom geography or segment scope
- Direct access to our analyst team
Cooperatives and listed producers compete on supply
Competition in the India fertilizer market combines large cooperatives, public sector units and listed private producers that sell through cooperative societies and private dealers. Indian Farmers Fertiliser Cooperative Limited leads nano products, selling 365.09 lakh bottles in 2024-25. National Fertilizers Limited holds an 18% stake in the Namrup-IV urea joint venture approved in March 2025. Paradeep Phosphates expanded through its October 2025 merger with Mangalore Chemicals and Fertilizers, while Coromandel International moved acid plants at Kakinada into trial production. Chambal Fertilisers began technical ammonium nitrate production at Gadepan on Aug. 20, 2026, which diversifies its nitrogen business. Companies compete on plant efficiency, raw material security, dealer reach, product range and agronomy support for balanced nutrition.
Companies profiled and their roles in this market
| Company | Type | Role in the market |
|---|---|---|
| Indian Farmers Fertiliser Cooperative Limited | Cooperative producer | Nano product sales of 365.09 lakh bottles in 2024-25 |
| National Fertilizers Limited | Public sector producer | 18% partner in the Namrup-IV urea complex approved in March 2025 |
| Paradeep Phosphates Limited | Phosphate producer | Merged with Mangalore Chemicals and Fertilizers in October 2025 |
| Coromandel International Limited | Phosphate and complex grade producer | Kakinada acid plants in trial production from 2026 |
| Chambal Fertilisers and Chemicals Limited | Urea producer | Started technical ammonium nitrate at Gadepan in August 2026 |
Credence Research view on the shift to balanced nutrition
Credence Research's view is that the India fertilizer market will grow steadily through 2035, as farmers shift from urea-heavy feeding toward balanced grades, specialty products and soil-based dosing. Urea will keep the largest share because of its fixed retail price, but complex, specialty and nano products will gain value faster. New domestic plants and integrated phosphate units should reduce import exposure. However, subsidy budgets and global raw material prices will continue to shape supply, margins and the pace of change.
How the crop nutrient estimate was built
The report uses 2025 as the base year, with values in USD million at current prices. Market values come from the Credence Research model, which combines nutrient consumption volumes, farm-gate prices, subsidy rates and crop area data. Regional shares follow the client's regional split, and segment splits by product type, crop type and distribution channel are Credence Research estimates. Sources used are World Bank data, parliamentary answers, Cabinet decisions, government news releases and company statements, and no interviews or surveys were used.
Self-reliance and balanced use set the path to 2035
The India fertilizer market is expected to reach USD 46.68 billion by 2035, a 5.55% CAGR during 2026–2035, as record harvests and balanced feeding raise the value of nutrients applied per hectare. Growth should be strongest in specialty products and in East and Central India, while South India keeps the largest share. Domestic urea and phosphate capacity will reduce reliance on imports over time. In contrast, sharp rises in global gas or phosphate prices could strain subsidy budgets and delay supply.
Frequently Asked Questions
How big is the India fertilizer market?
Which region leads nutrient demand in India?
Which region grows fastest?
Which product type holds the largest share?
How much domestic urea does India produce?
Which product type grows fastest?
Who are the leading companies in India?
What are the main risks to growth?
Table of Content
Chapter 1 Market Segmentation
- 1.1 Segmentation Framework
- 1.1.1 Product and Service Classification
- 1.1.2 Application and End-Use Classification
- 1.1.3 Technology and Solution Classification
- 1.1.4 Customer and Distribution Channel Classification
- 1.1.5 Geographic Segmentation
- 1.1.6 Market Segment Definitions and Boundaries
- 1.2 By Product Type
- 1.2.1 Urea Fertilizers
- 1.2.2 Complex and NPK Fertilizers
- 1.2.3 Phosphatic Fertilizers
- 1.2.4 Potassic Fertilizers
- 1.2.5 Specialty Fertilizers
- 1.3 By Crop Type
- 1.3.1 Cereals and Grains
- 1.3.2 Oilseeds and Pulses
- 1.3.3 Fruits and Vegetables
- 1.3.4 Commercial Crops
Chapter 2 Introduction
- 2.1 Report Objectives and Scope
- 2.2 Product Definition and Industry Terminology
- 2.3 Market Inclusions and Exclusions
- 2.4 Research Process
- 2.4.1 Primary Research and Expert Interviews
- 2.4.2 Secondary Research and Source Review
- 2.4.3 Top-Down and Bottom-Up Estimation
- 2.4.4 Data Triangulation and Verification
- 2.5 Market Size Measurement Basis
- 2.5.1 2025: USD 27.14 billion → 2035: USD 46.68 billion
- 2.6 Historical and Forecast Reference Periods
- 2.6.1 Historical Period: 2018-2025
- 2.6.2 Base Year: 2025
- 2.6.3 Forecast Period: 2025-2035
- 2.7 Research Assumptions and Limitations
Chapter 3 Executive Summary
- 3.1 Market Snapshot and Key Findings
- 3.2 Base-Year Market Size, 2025
- 3.3 Forecast Market Size, 2035
- 3.4 Revenue and Volume Growth Outlook
- 3.5 Key Demand and Supply Indicators
- 3.6 Leading Market Segments
- 3.7 Fastest-Growing Market Opportunities
- 3.8 Regional Performance Highlights
- 3.9 Technology and Industry Transformation
- 3.10 Competitive Landscape Summary
- 3.11 Analyst View and Strategic Implications
Chapter 4 India Fertilizer Market Trends and Developments
- 4.1 Historical Industry Development, 2018-2025
- 4.2 Recent Market Trends and Developments
- 4.3 Demand and Customer Behavior Trends
- 4.4 Technology and Product Innovation
- 4.5 Artificial Intelligence, Automation and Digitalization
- 4.6 Local Manufacturing and Supply Chain Realignment
- 4.7 Industry Partnerships, Mergers and Acquisitions
- 4.8 Sustainability and Circular Economy Developments
- 4.9 Government and Private Sector Investment Trends
- 4.10 Emerging Business Models and Commercialization
- 4.11 Industry Developments and Announcements
Chapter 5 India Fertilizer Market Production, Supply and Demand Analysis
- 5.1 Demand Trend and Consumption Analysis, 2018-2025
- 5.2 Demand Forecast, 2025-2035
- 5.3 Production and Output Trend, 2018-2025
- 5.4 Production and Output Forecast, 2025-2035
- 5.5 Installed Capacity and Capacity Utilization
- 5.6 Company-Wise Production Plants and Statistics
- 5.6.1 Installed Production Capacity
- 5.6.2 Actual Production
- 5.6.3 Planned Capacity and Expansion Targets
- 5.7 Supply Chain Structure and Procurement Trends
- 5.8 Supply-Demand Gap and Bottlenecks
- 5.9 Import Dependence and Sourcing Structure
- 5.10 Contract Manufacturing and Outsourcing
- 5.11 Regional Supply and Demand Concentration
Chapter 6 India Fertilizer Market Pricing Analysis
- 6.1 Pricing Structure and Measurement
- 6.2 Historical Pricing Trends, 2018-2025
- 6.3 Pricing Outlook, 2025-2035
- 6.4 Average Selling Price and Unit Economics
- 6.5 Pricing by Product and Market Segment
- 6.6 Geographic Pricing Differences
- 6.7 Key Input, Energy, Labor and Logistics Costs
- 6.8 Contract Pricing and Purchasing Models
- 6.9 Pricing Sensitivity and Competitive Positioning
- 6.10 Price, Margin and Profitability Implications
Chapter 7 India Fertilizer Market Dynamics
- 7.1 Market Growth Drivers
- 7.1.1 Demand-Side Drivers
- 7.1.2 Technology and Innovation Drivers
- 7.1.3 Infrastructure and Investment Drivers
- 7.1.4 Regulatory and Policy Drivers
- 7.2 Market Restraints
- 7.2.1 Cost and Affordability Constraints
- 7.2.2 Technology and Adoption Barriers
- 7.2.3 Supply Chain and Operational Constraints
- 7.3 Market Challenges
- 7.3.1 Competitive Pressure and Margin Erosion
- 7.3.2 Skills, Infrastructure and Implementation Gaps
- 7.4 Emerging Market Opportunities
- 7.5 Market Dynamics Impact and Time-Horizon Assessment
Chapter 8 India Fertilizer Value Chain Analysis
- 8.1 Industry Value Chain Overview
- 8.2 Upstream Suppliers and Critical Inputs
- 8.3 Technology and Component Providers
- 8.4 Manufacturing or Service Delivery
- 8.5 Distribution, Channel Partners and Integrators
- 8.6 Downstream Applications and End Users
- 8.7 Value Addition and Profit Pools
- 8.8 Vertical Integration and Outsourcing
- 8.9 Supplier Concentration and Risk
- 8.10 Supply Chain Localization and Resilience
Chapter 9 India Fertilizer Market Regulations and Policies
- 9.1 Relevant Laws, Standards and Compliance Frameworks
- 9.2 Product, Service, Safety and Quality Requirements
- 9.3 Government Policies, Incentives and Subsidies
- 9.4 Imports, Exports and Trade Barriers
- 9.5 Public Procurement and Local Content Requirements
- 9.6 Environmental and Sustainability Compliance
- 9.7 Upcoming Policy Changes and Market Implications
Chapter 10 India Fertilizer Market Hotspots and Opportunities
- 10.1 Market Opportunity Mapping and Growth Hotspots
- 10.2 High-Growth Applications and Customer Groups
- 10.3 Underserved Markets and White-Space Opportunities
- 10.4 Emerging Technology and Product Opportunities
- 10.5 New Capacity and Investment Hotspots
- 10.6 Market Entry and Expansion Opportunities
- 10.7 Distribution and Partnership Opportunities
- 10.8 Near-Term and Long-Term Commercial Potential
- 10.9 Opportunity Attractiveness and Execution Risks
Chapter 11 India Fertilizer Market Outlook, 2025-2035
- 11.1 Market Size and Analysis
- 11.1.1 Revenue (Market Measurement: 2025: USD 27.14 billion → 2035: USD 46.68 billion)
- 11.1.2 Market Volume and Quantity Sold
- 11.1.3 Historical Market Size, 2018-2025
- 11.1.4 Base-Year Market Size, 2025
- 11.2 Market Forecast, 2025-2035
- 11.2.1 Revenue Forecast to 2035
- 11.2.2 Volume Forecast to 2035
- 11.2.3 CAGR and Year-on-Year Growth
- 11.2.4 Incremental Revenue Opportunity
- 11.3 Forecast Assumptions and Scenario Analysis
- 11.3.1 Base-Case Forecast
- 11.3.2 Optimistic and Conservative Scenarios
- 11.3.3 Technology, Pricing and Policy Sensitivities
- 11.4 Market Attractiveness and Growth Outlook
Chapter 12 India Fertilizer Market Segmentation and Outlook
- 12.1 Segmentation Summary and Market Shares, 2025
- 12.2 Largest and Fastest-Growing Segments
- 12.3 By Product Type - Market Size and Forecast, 2025-2035
- 12.3.1 Segment Definition and Scope
- 12.3.2 Historical Market Size, 2018-2025
- 12.3.3 Revenue Forecast, 2025-2035
- 12.3.4 Volume Forecast, 2025-2035
- 12.3.5 Base-Year Market Share, 2025
- 12.3.6 Segment CAGR and Growth Drivers
- 12.3.7 Subsegment Market Size and Forecast
- 12.3.7.1 Urea Fertilizers
- 12.3.7.2 Complex and NPK Fertilizers
- 12.3.7.3 Phosphatic Fertilizers
- 12.3.7.4 Potassic Fertilizers
- 12.3.7.5 Specialty Fertilizers
- 12.3.8 Subsegment Pricing and Adoption Trends
- 12.3.9 Leading Suppliers and Competition
- 12.3.10 Regional Demand and Opportunities
- 12.4 By Crop Type - Market Size and Forecast, 2025-2035
- 12.4.1 Segment Definition and Scope
- 12.4.2 Historical Market Size, 2018-2025
- 12.4.3 Revenue Forecast, 2025-2035
- 12.4.4 Volume Forecast, 2025-2035
- 12.4.5 Base-Year Market Share, 2025
- 12.4.6 Segment CAGR and Growth Drivers
- 12.4.7 Subsegment Market Size and Forecast
- 12.4.7.1 Cereals and Grains
- 12.4.7.2 Oilseeds and Pulses
- 12.4.7.3 Fruits and Vegetables
- 12.4.7.4 Commercial Crops
- 12.4.8 Subsegment Pricing and Adoption Trends
- 12.4.9 Leading Suppliers and Competition
- 12.4.10 Regional Demand and Opportunities
- 12.5 Segment Growth Comparison
- 12.6 Segment Attractiveness and Priority Matrix
Chapter 13 India Fertilizer Geographic Market Outlook, 2025-2035
- 13.1 Domestic Market Distribution and Demand Clusters
- 13.2 State- or Province-Wise Market Size and Forecast, 2025-2035
- 13.3 City and Metropolitan Market Outlook
- 13.4 Industrial, Manufacturing and Commercial Clusters
- 13.5 Geographic Concentration of Key End Users
- 13.6 Local Pricing and Purchasing Differences
- 13.7 Domestic Production Facilities and Capacity Map
- 13.8 Local Infrastructure and Project Pipeline
- 13.9 State-Level Policy and Incentive Differences
- 13.10 Subnational Investment Hotspots and Opportunities
- 13.11 Distribution and Logistics Networks
- 13.12 Domestic Competitive Footprint
Chapter 14 India Fertilizer Technology, Innovation and Sustainability Outlook
- 14.1 Technology Landscape and Maturity
- 14.2 Product, Process and Service Innovation
- 14.3 AI, Automation and Digital Tools in the Industry
- 14.4 Technology Adoption and Performance Benchmarking
- 14.5 Innovation Pipeline and R&D Investment
- 14.6 Patent and Intellectual Property Trends
- 14.7 Energy Efficiency and Resource Management
- 14.8 Sustainability, Recycling and Circularity
- 14.9 Technology Roadmap, 2025-2035
- 14.10 Risks of Obsolescence and Technology Substitution
Chapter 15 India Fertilizer Market Key Strategic Imperatives
- 15.1 Growth and Market Entry Priorities
- 15.2 High-Return Products and Segments
- 15.3 Pricing, Profitability and Cost Optimization
- 15.4 Technology Investment and Product Differentiation
- 15.5 Supply Chain Localization and Resilience
- 15.6 Distribution and Customer Acquisition
- 15.7 Partnership, Acquisition and Capacity Strategy
- 15.8 Regional Expansion Priorities
- 15.9 Short-, Medium- and Long-Term Actions
Chapter 16 Competition Outlook
- 16.1 Industry Competition Characteristics
- 16.2 Market Structure and Concentration
- 16.3 Market Share and Competitive Positioning, 2025
- 16.4 Company-Wise Revenue and Product Benchmarking
- 16.5 Production and Service Capacity Benchmarking
- 16.6 Technology, Pricing and Differentiation
- 16.7 Regional Footprint and Distribution Strength
- 16.8 Mergers, Acquisitions and Strategic Alliances
- 16.9 New Entrants and Competitive Threats
- 16.10 Porter's Five Forces and Industry Attractiveness
- 16.11 Competitive Outlook, 2025-2035
Chapter 17 Company Profiles
- 17.1 Company Coverage and Selection Criteria
- 17.2 Indian Farmers Fertiliser Cooperative Limited
- 17.2.1 Business Description
- 17.2.2 Company Ownership and Geographic Presence
- 17.2.3 Product and Service Portfolio
- 17.2.4 Manufacturing and Operating Footprint
- 17.2.5 Production Capacity and Expansion Plans
- 17.2.6 Financial Performance and Investment
- 17.2.7 Market Share and Competitive Position
- 17.2.8 Technology and Innovation Capabilities
- 17.2.9 Strategic Alliances or Partnerships
- 17.2.10 Recent Developments
- 17.2.11 Growth Strategy and Outlook
- 17.3 Coromandel International Limited
- 17.4 National Fertilizers Limited
- 17.5 Chambal Fertilisers and Chemicals Limited
- 17.6 Rashtriya Chemicals and Fertilizers Limited
- 17.7 Paradeep Phosphates Limited
- 17.8 Krishak Bharati Cooperative Limited
- 17.9 Gujarat State Fertilizers & Chemicals Limited
- 17.10 Deepak Fertilisers and Petrochemicals Corporation Limited
- 17.11 Gujarat Narmada Valley Fertilizers & Chemicals Limited
- 17.12 Other Relevant Market Participants
Note: Every listed company is profiled on the structure shown under the first company. The company list is preliminary and may change based on research findings, market developments, data availability and client requirements.
Chapter 18 Disclaimer
- 18.1 Research and Forecast Disclaimer
- 18.2 Data Source and Estimation Limitations
Note: The depth of individual sections depends on data availability for this market. Volume, capacity, trade and other unit-based metrics are included where applicable.

