
Water-hungry farms turn to connected sensing and control
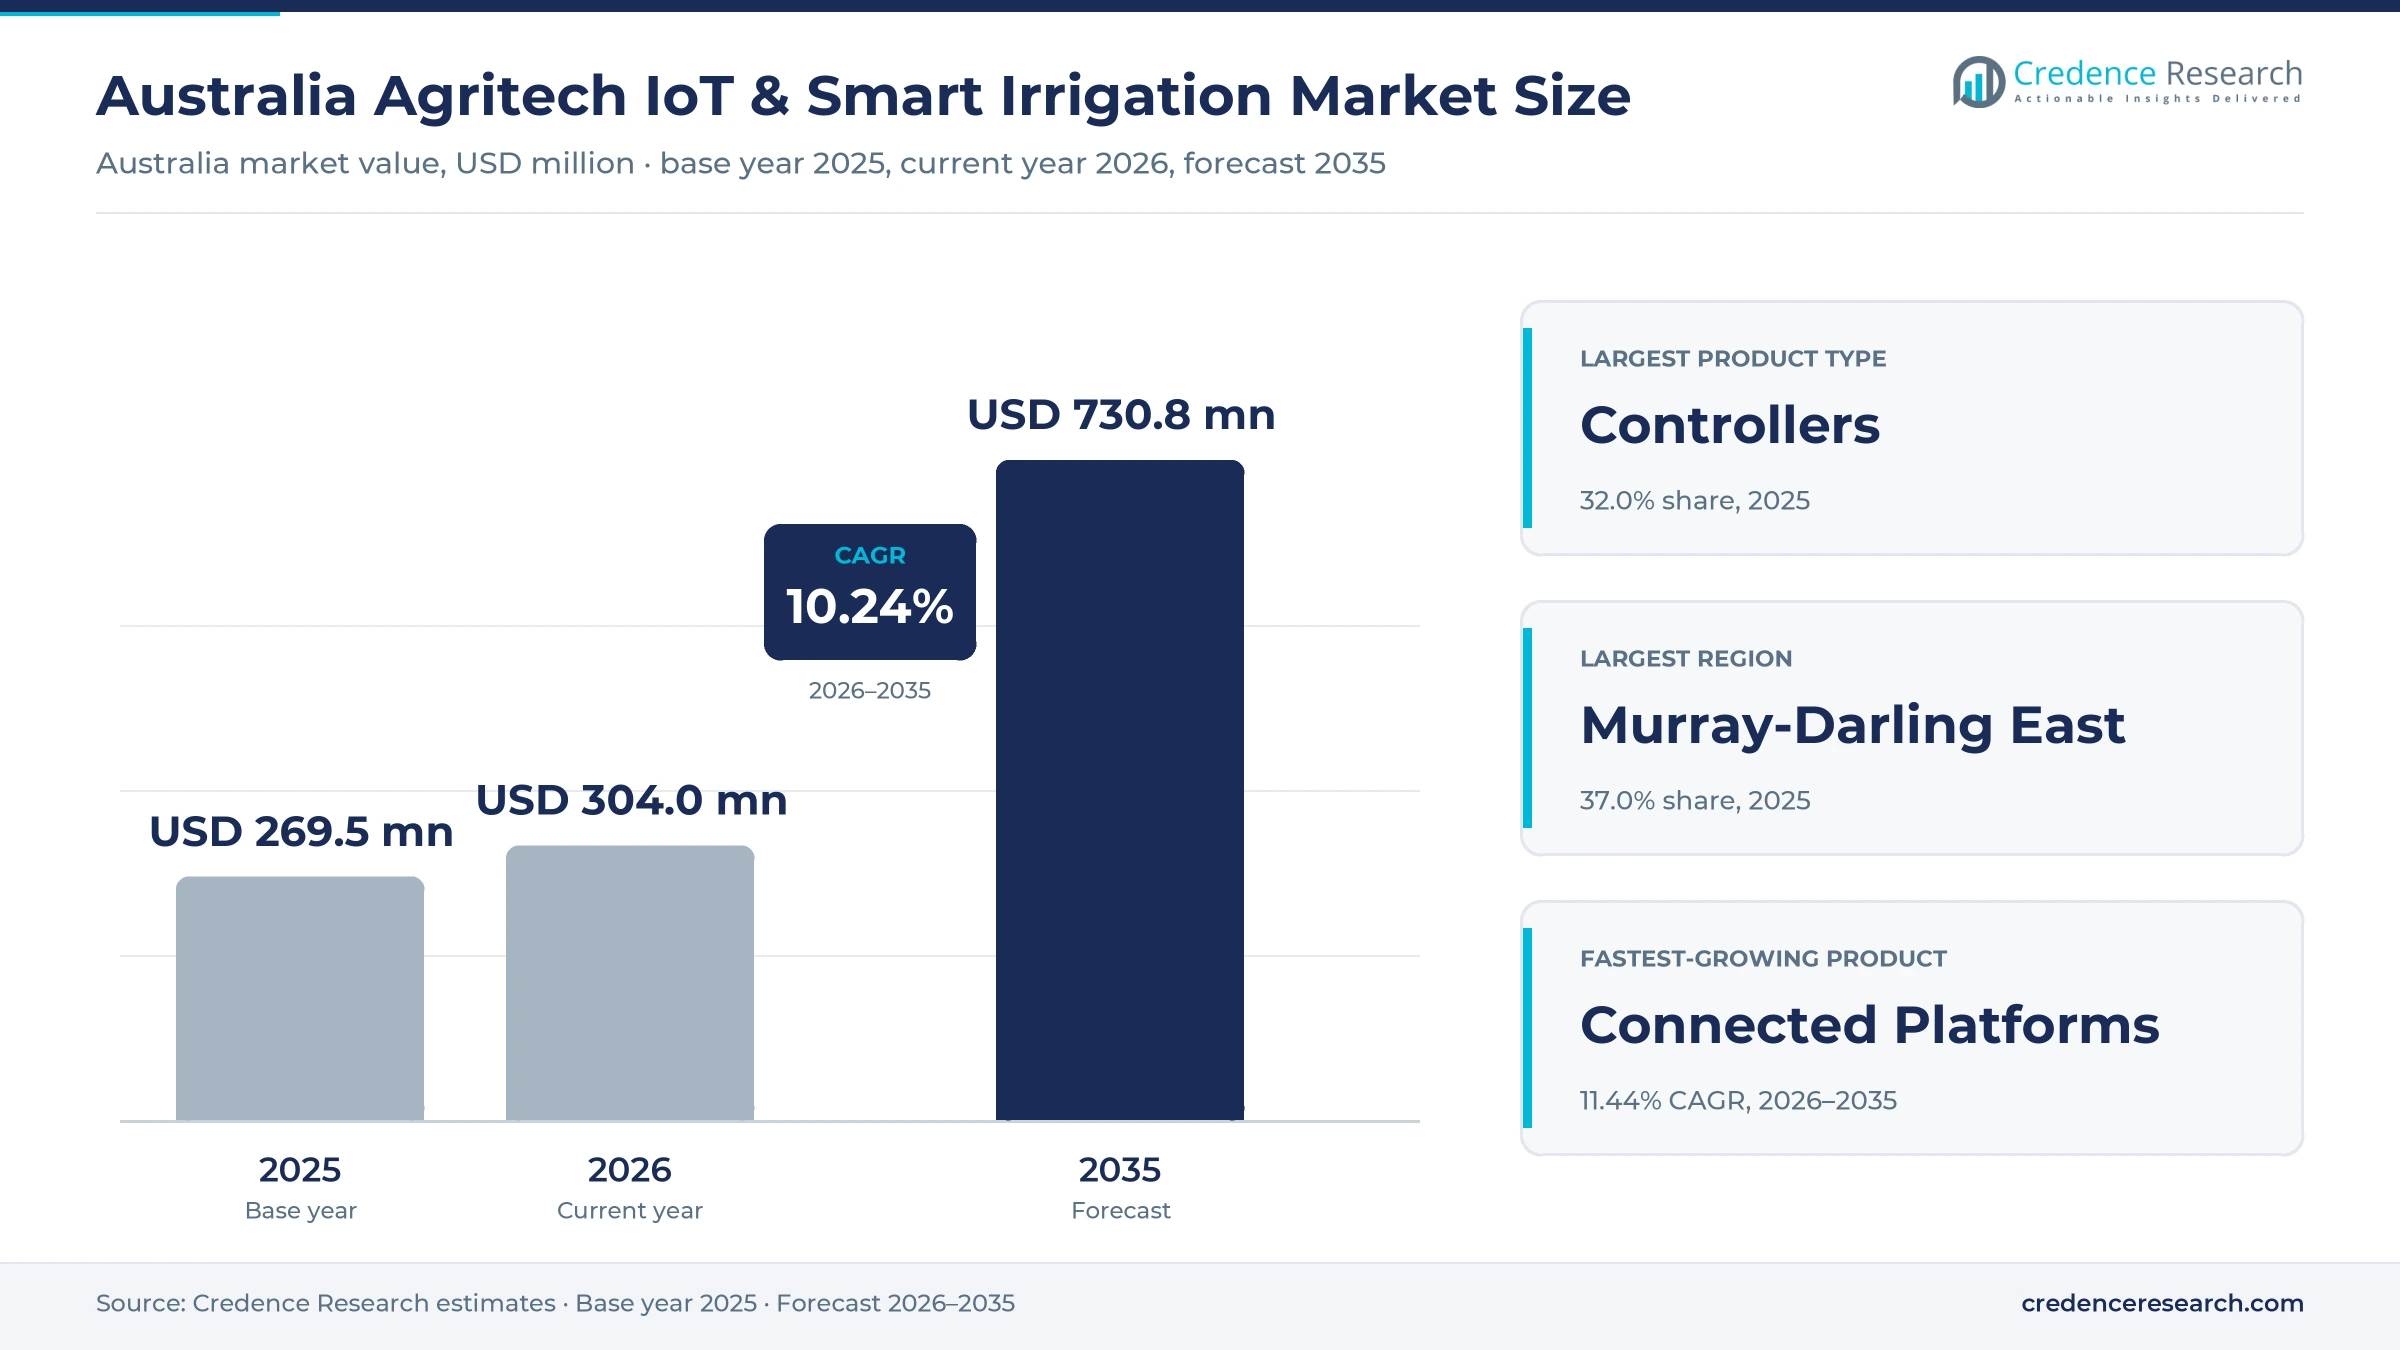
The Australia agritech IoT and smart irrigation market was valued at USD 269.5 million in 2025 and is projected to increase from USD 304.0 million in 2026 to USD 730.8 million by 2035, registering a CAGR of 10.24% during 2026–2035. Demand comes from irrigators who need to stretch tight water allocations across cotton, horticulture, vines and pasture, and from water authorities that must meter and automate delivery. Murray-Darling East held the largest regional share, 37.0% in 2025, because New South Wales valleys consume the most agricultural water in the country. Western & Northern Australia is the fastest-growing region at 11.45% a year, as new horticulture and remote stations adopt satellite-linked monitoring. Meanwhile, the commercial launch of low-orbit 5G satellite IoT services in December 2025 widened coverage for farms beyond mobile networks. As a result, spending is shifting from stand-alone controllers toward connected platforms that combine sensors, valves and software.
What does the market count in Australian irrigation?
The estimate counts spending on smart irrigation controllers, soil and climate sensors, connected valves and flow devices, and the software platforms that tie them together on Australian farms and irrigation schemes. It covers hardware, connectivity subscriptions and platform fees paid by growers, corporate farm operators, scheme operators and government or research buyers. All values in this report are stated in USD million at current prices.
The estimate excludes conventional pipes, pumps, sprinklers and center pivots sold without connected control, along with civil works for channels and dams. It also excludes livestock tracking and general farm telematics that do not manage water. The value chain runs from device makers and satellite or cellular carriers through dealers, integrators and agronomists to the irrigator.
Australia Agritech IoT & Smart Irrigation Market Insights
- The market was valued at USD 269.5 million in 2025 and is projected to reach USD 730.8 million by 2035, registering a CAGR of 10.24% during 2026–2035.
- Murray-Darling East held 37.0% of Australian demand in 2025, because New South Wales farms used 4,679 GL of agricultural water in 2023-24.
- Smart irrigation controllers led with 32.0% of 2025 value, as growers automate pumps, valves and scheduling before adding analytics.
- Agriculture consumed 11,760 GL of water in 2023-24, or 68.3% of national consumption, which keeps water efficiency at the center of farm investment.
- CropX bought Adelaide-based Green Brain in December 2023, adding more than 1,500 local customers to a global soil sensing platform.
Controllers lead while connected platforms grow fastest
Why do irrigation controllers hold the largest share?
Based on product type, the market is categorized into smart irrigation controllers, soil and climate sensors, connected valves and flow devices, and connected irrigation platforms. Smart Irrigation Controllers led with 32.0% of 2025 value, because automating pumps and valves delivers the quickest labor savings. Connected Irrigation Platforms grow fastest at 11.44% a year, as growers move data from several devices into one dashboard and pay recurring subscription fees.
Which crops spend most on connected water control?
Based on crop type, the market is categorized into broadacre field crops, horticulture and orchards, cotton and viticulture and protected crops. Horticulture & Orchards led with 30.0% of 2025 value, because high-value fruit and nut trees justify dense sensor networks. Viticulture & Protected Crops grow fastest at 10.80% a year, as vineyards and greenhouses adopt precise drip scheduling to protect quality during hot and dry seasons.
How do scheduling and fertigation compare?
Based on application, the market is categorized into irrigation scheduling, soil moisture monitoring, water allocation and flow metering, and fertigation and crop water optimization. Irrigation Scheduling led with 34.0% of 2025 value, because it is the first task growers automate. Fertigation & Crop Water Optimization grows fastest at 11.09% a year, as growers link fertigation control systems to soil data to cut nutrient losses.
Who buys connected systems in Australia?
Based on customer type, the market is categorized into commercial growers, corporate farm operators, irrigation scheme operators and government and research buyers. Commercial Growers led with 46.0% of 2025 value, because family-owned irrigated farms make up most installed sites. Corporate Farm Operators grow fastest at 10.85% a year, as large aggregations standardize monitoring across many properties and water licenses.
| Segment Group | Leading Sub-segment | Share, 2025 | Fastest-growing Sub-segment | CAGR, 2026–2035 |
|---|---|---|---|---|
| By Product Type | Smart Irrigation Controllers | 32.0% | Connected Irrigation Platforms | 11.44% |
| By Crop Type | Horticulture & Orchards | 30.0% | Viticulture & Protected Crops | 10.80% |
| By Application | Irrigation Scheduling | 34.0% | Fertigation & Crop Water Optimization | 11.09% |
| By Customer Type | Commercial Growers | 46.0% | Corporate Farm Operators | 10.85% |
Request a Free Sample
Fill in your details and we'll send you a free sample report.
- Sample data tables & charts
- Research methodology
Water intensity, grants and payback drive adoption
How does high agricultural water use lift demand?
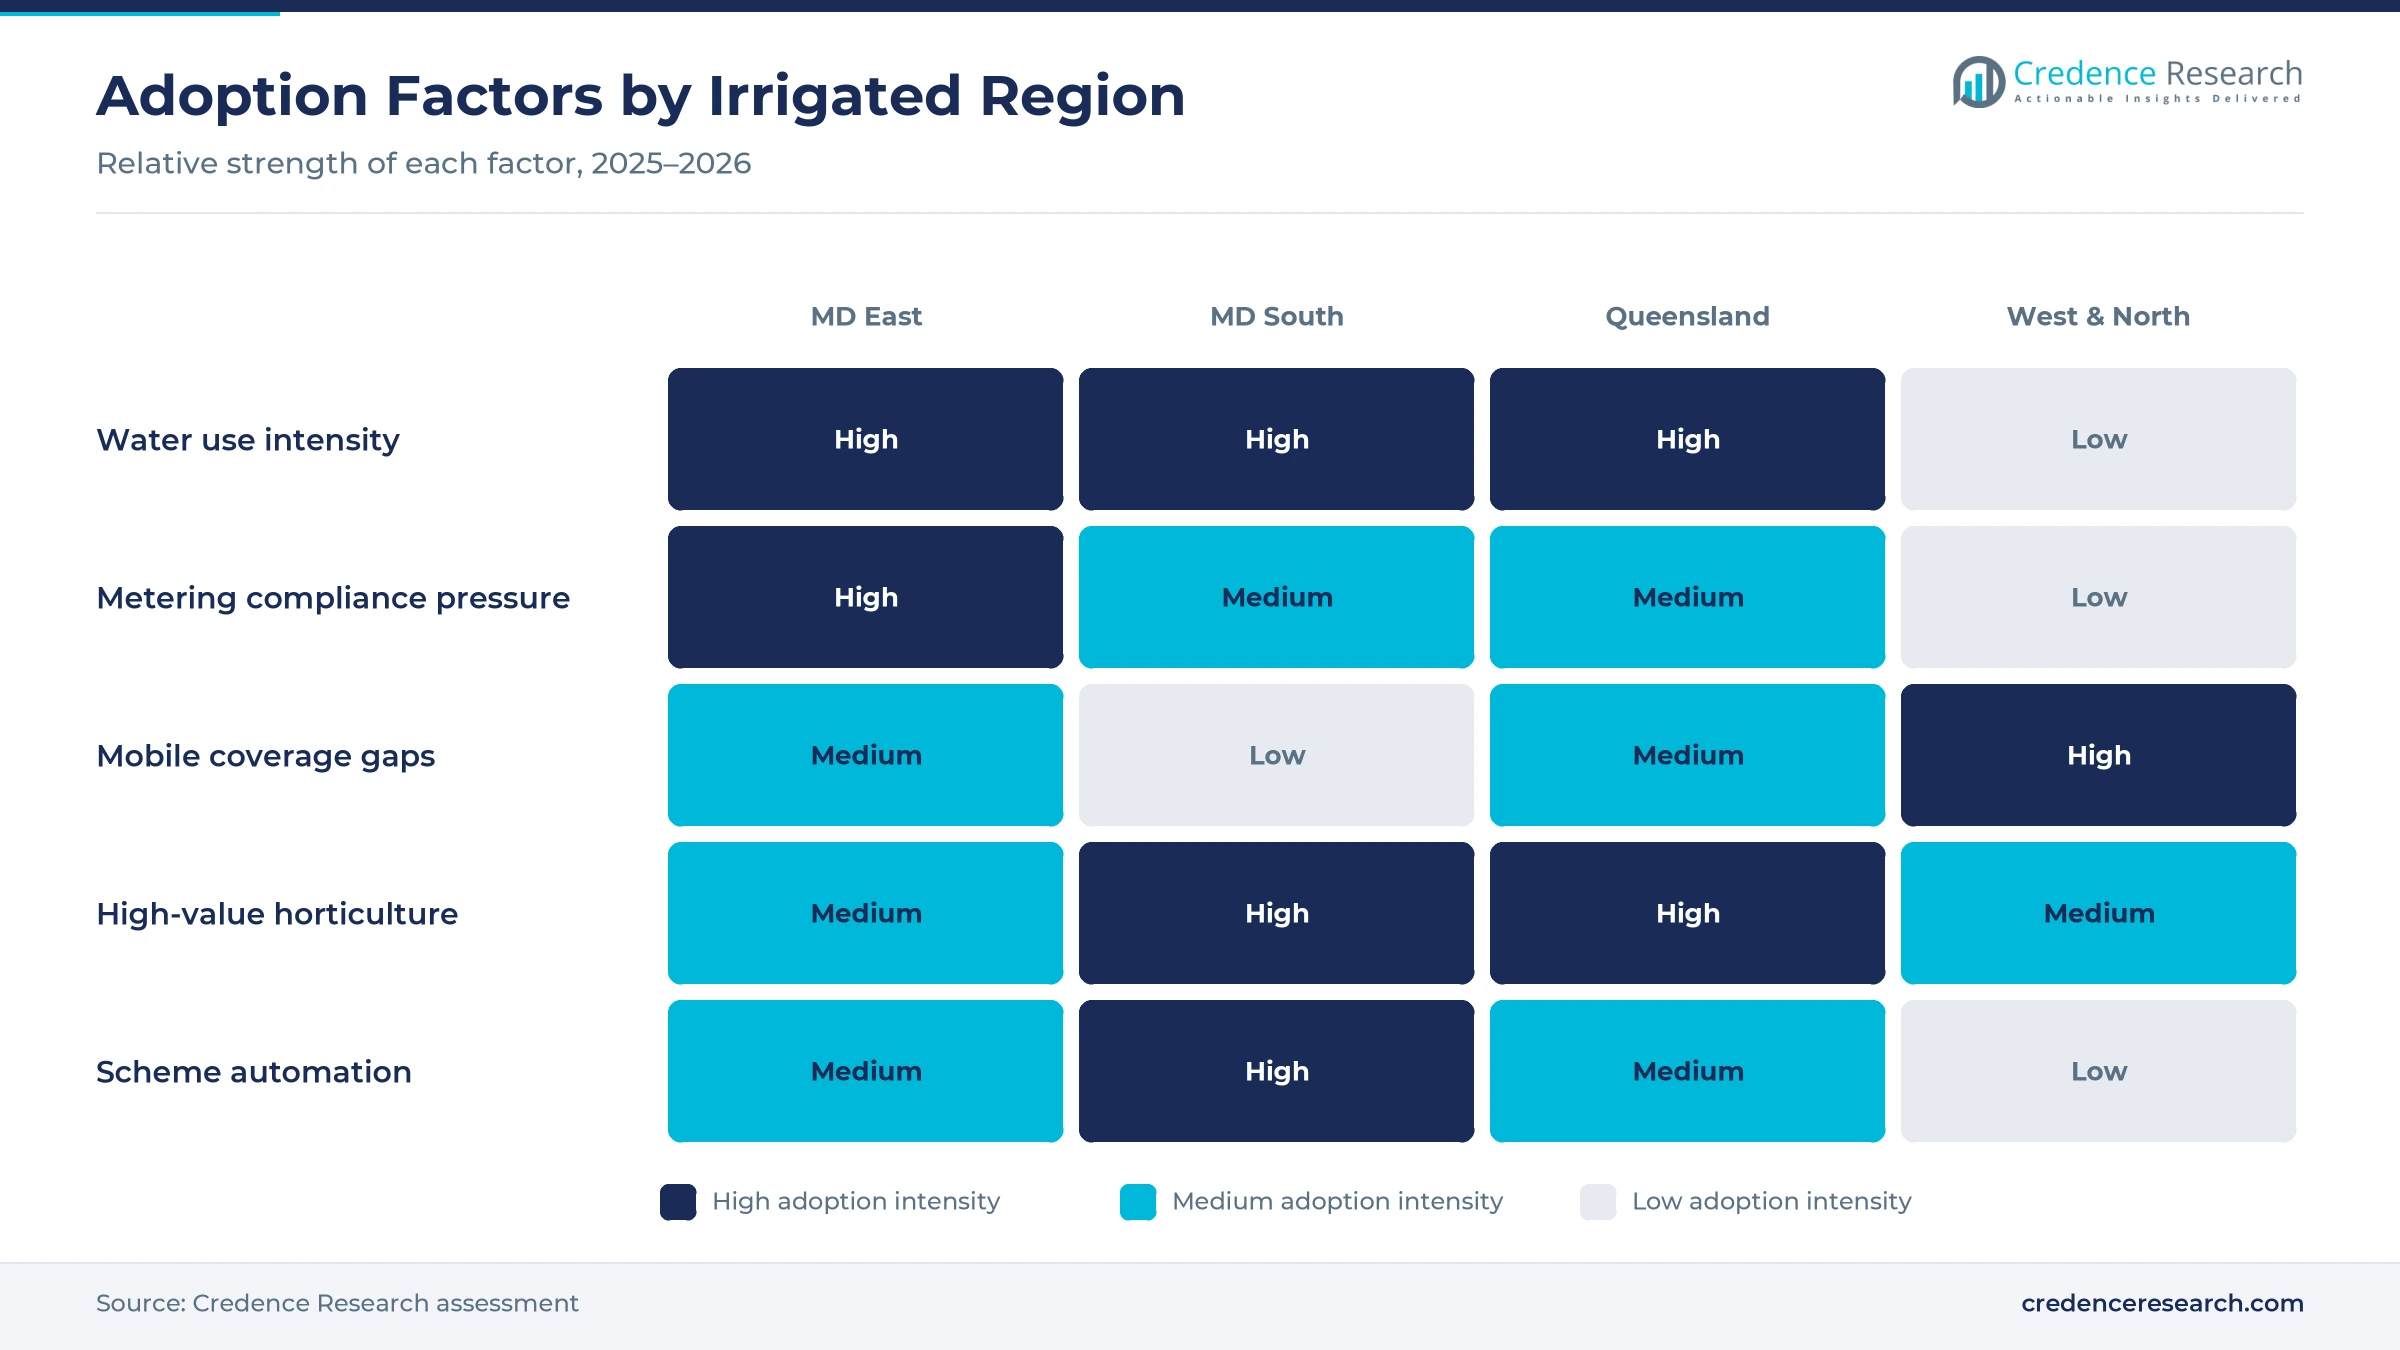
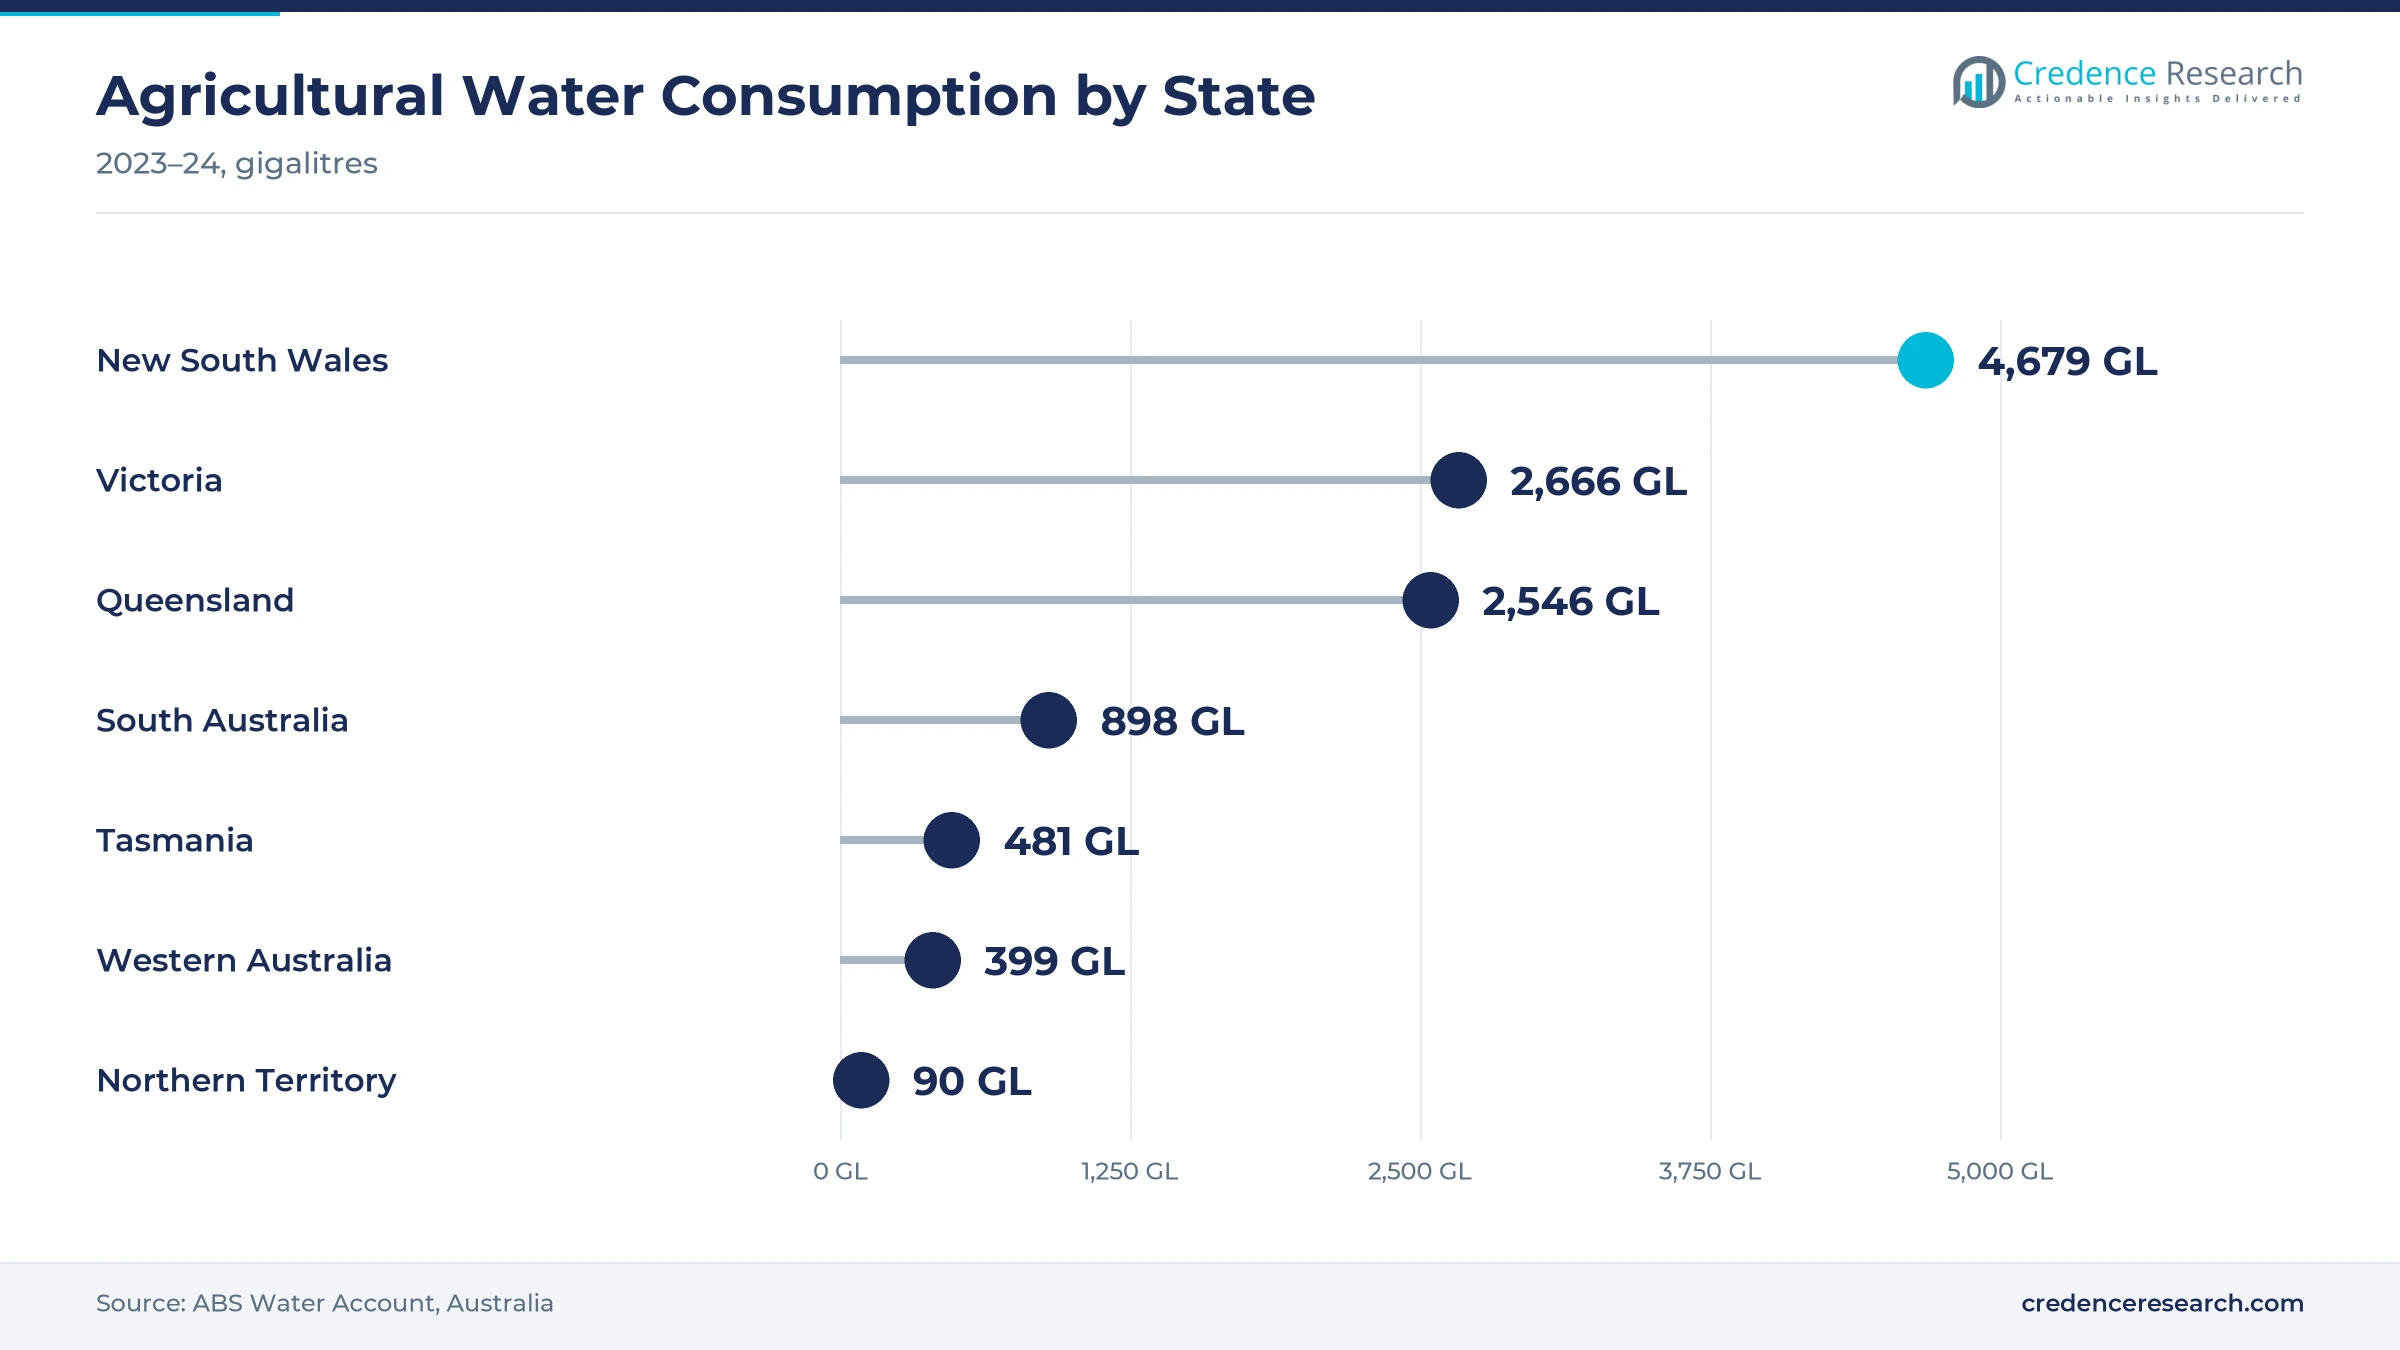
High agricultural water intensity is the core driver, because every megalitre saved can be used on more hectares or sold. Agriculture, forestry and fishing consumed 11,760 GL in 2023-24, or 68.3% of national water consumption, according to the ABS Water Account. New South Wales used 4,679 GL, Victoria 2,666 GL and Queensland 2,546 GL, which places demand in the large irrigated valleys. Earlier ABS farm data showed 7.8 million megalitres applied to 1.9 million hectares on 20,700 farms in 2020-21. As a result, Murray-Darling East leads regional demand, because the largest water users have the strongest reason to measure and control each irrigation event.
Why does government support for digital farming matter?
Government support for climate-smart and digital agriculture lowers the upfront cost of connected equipment. The On Farm Connectivity Program committed $53 million over 2023-24 to 2025-26 for rebates on farm connectivity equipment. Round 1 provided $13.8 million in rebates to more than 1,500 primary producers, and a further $20 million Round 3 was announced on Jan. 14, 2025. In addition, the draft National Water Agreement published in December 2024 sets an objective of judicious and efficient water use. Because rebates cover gateways and antennas, growers can then add sensors and controllers to the same network, which supports demand for connected irrigation platforms.
Does remote monitoring deliver a clear return?
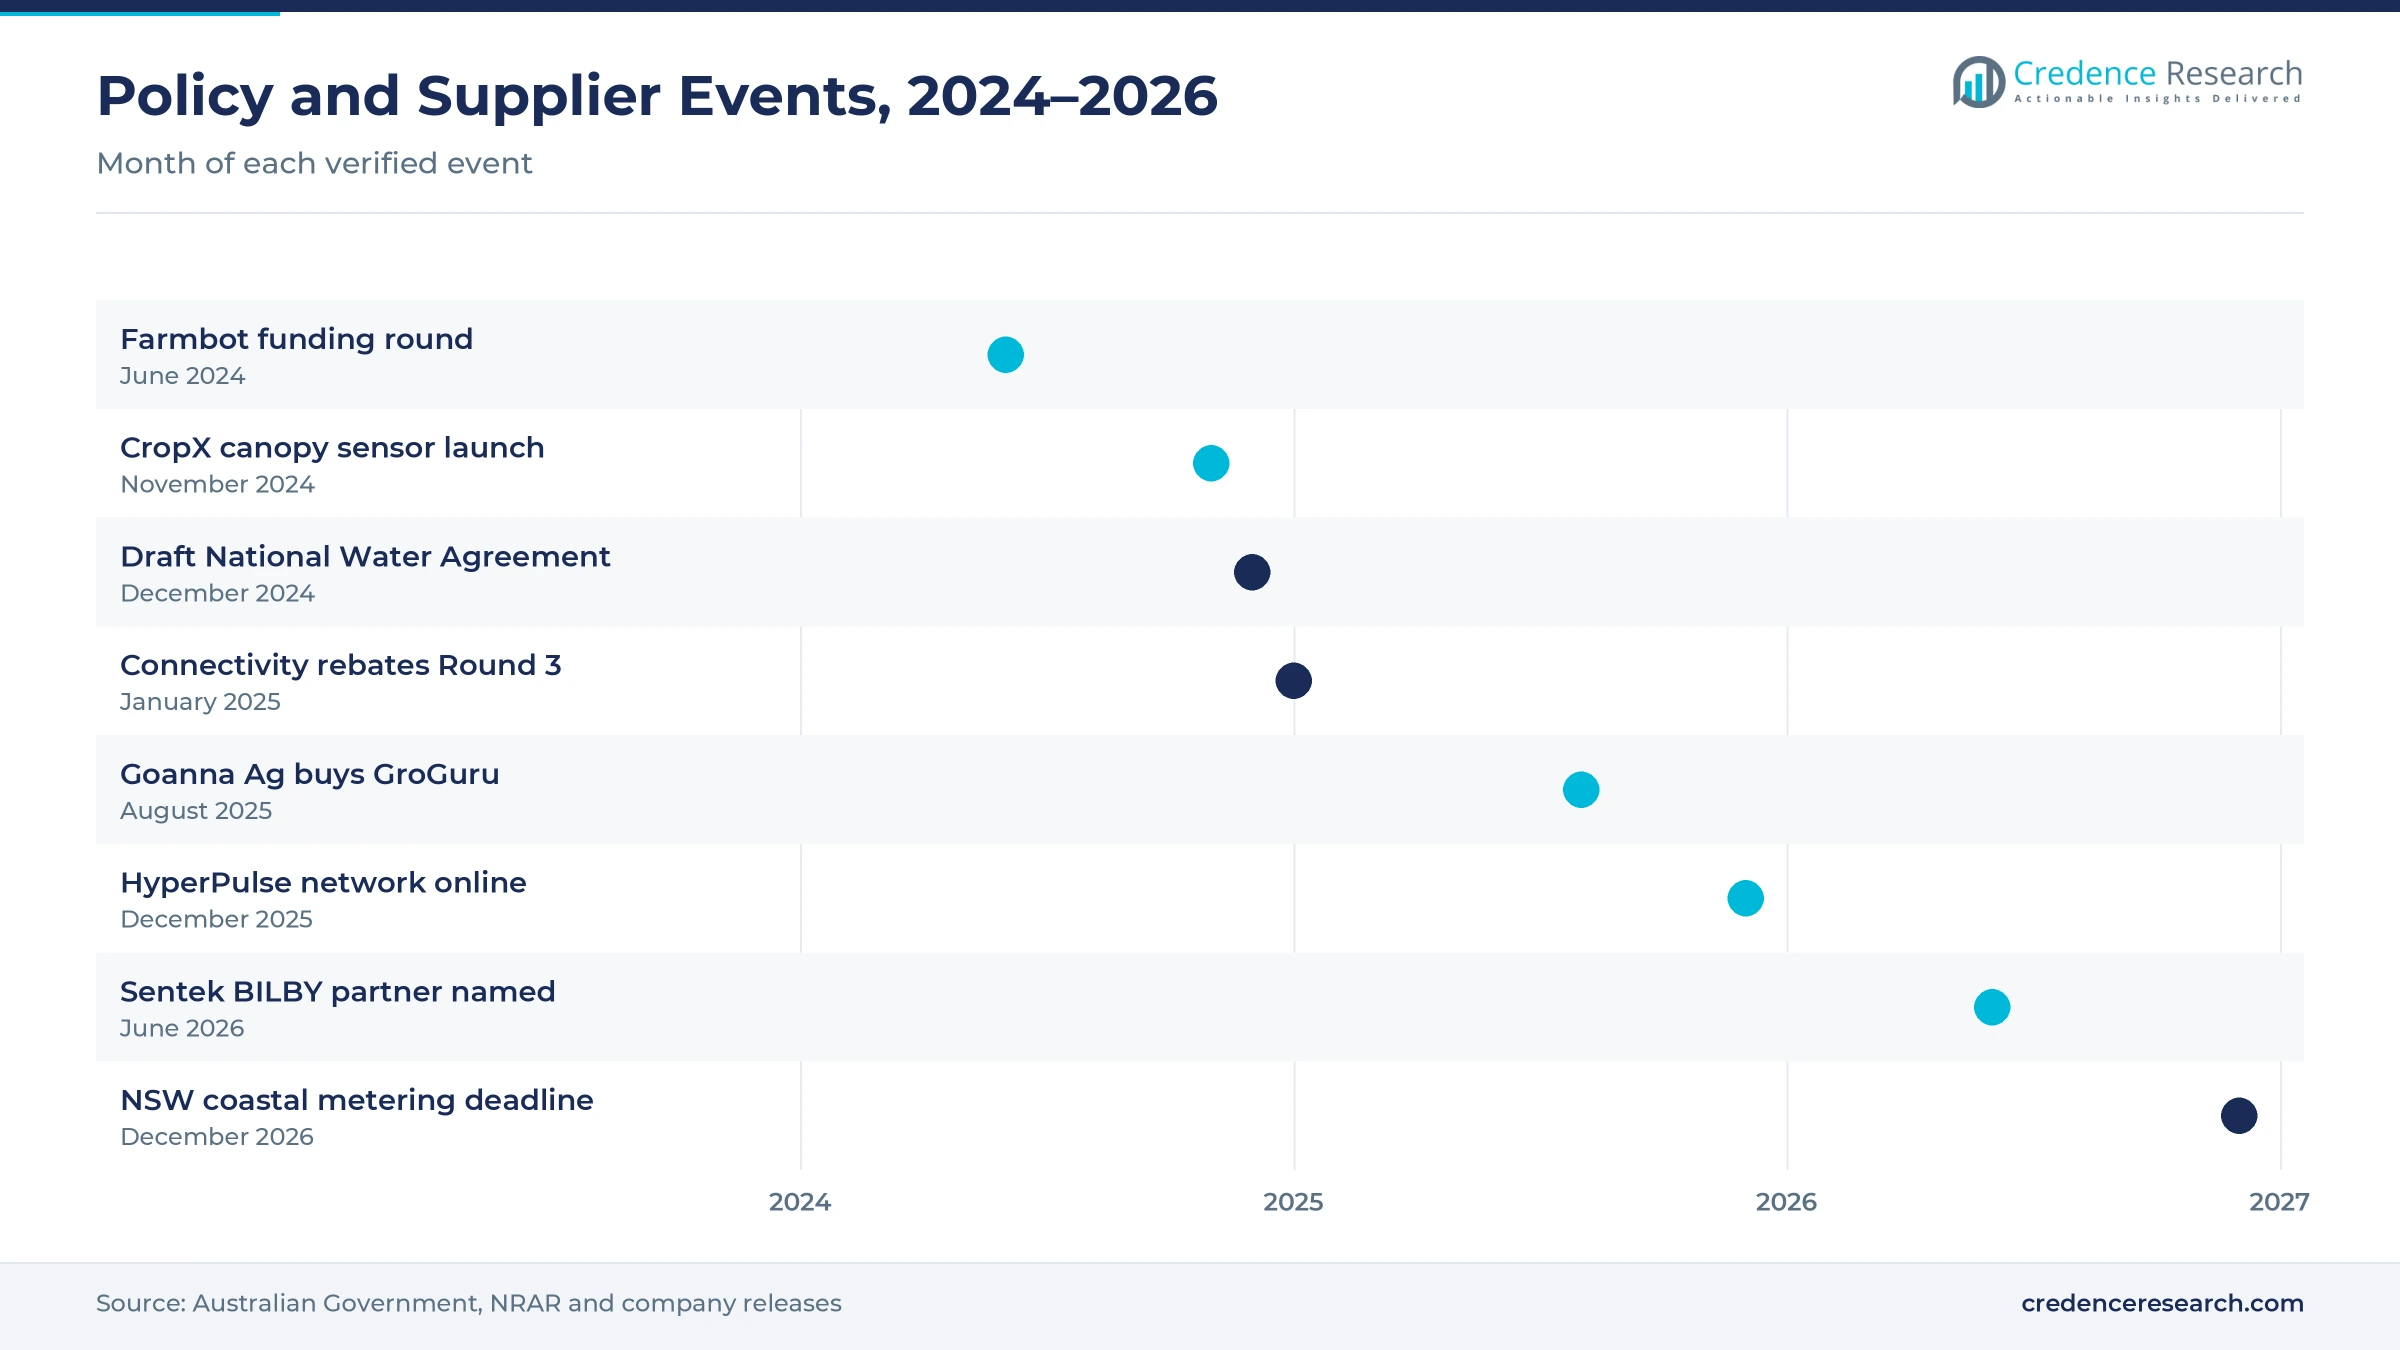
Demonstrated returns from remote monitoring and optimization persuade growers to scale beyond trial sites. CropX says its above-canopy evapotranspiration sensor, launched across Australasia in November 2024, can cut irrigation water by up to 50% while maintaining field productivity. Farmbot monitors tanks, bores and dams on more than 3,500 farms and stations and raised $4.6 million in June 2024, according to Agriculture Dive. Green Brain already served more than 1,500 Australian customers when CropX acquired it in December 2023. Therefore, connected platforms grow at 11.44% a year, because proven savings in water, fuel and travel time turn single sensors into farm-wide systems.
How do metering rules push demand for telemetry?
Non-urban metering rules add a compliance driver, because many water takes must now be measured and reported automatically. Under New South Wales rules summarized in the NRAR metering fact sheet, inland works with entitlements of 100 ML and above are already overdue, coastal works face a Dec. 1, 2026 deadline, and works of 15 to 100 ML follow by Dec. 1, 2027. Each site needs an approved meter, an intelligence device and telemetry that sends data to a central system, with revalidation after 10 years. In turn, water allocation and flow metering becomes a steady application, as installers pair flow meters with loggers and connectivity on thousands of licensed works.
Satellite links and consolidation reshape supply
Why is satellite IoT emerging as farm backhaul?
Satellite connectivity is emerging as the default link for remote paddocks, because mobile coverage still misses large parts of irrigated and grazing land. Myriota brought its HyperPulse 5G satellite network online on Dec. 15, 2025 in Australia and four other countries, offering higher data allowances for agriculture and water monitoring. Goanna Ag had already partnered with Myriota for satellite rain gauges and tank monitors, with each unit bundling three years of connectivity. Farmbot serves more than 3,500 farms and stations with similar remote alerts. As a result, Western & Northern Australia is the fastest-growing region, because remote horticulture and stations depend most on satellite links.
How is consolidation shifting the supplier base?
Consolidation is shifting the supplier base from small local specialists toward global platforms with Australian service teams. CropX bought Adelaide-based Green Brain in December 2023, its first Australian acquisition, and kept all nine staff and the local brand. Valmont, owner of Valley Irrigation, agreed in July 2023 to buy Perth-based HR Products, which runs six warehouses and about 100 employees. Goanna Ag moved the other way in August 2025, acquiring California soil sensing firm GroGuru in its fifth U.S. season. In turn, Australian growers gain access to broader product ranges, and dealers carry more farm management software alongside sensors, controllers and valves.
Can buried wireless sensor nodes open a new segment?
Below-ground wireless sensing is an opening, because buried nodes avoid damage from machinery, livestock and sunlight. The Soil CRC appointed Sentek as commercialization partner for its BILBY wireless node in June 2026, with launch expected in the second half of 2026. The node was developed by the Tasmanian Institute of Agriculture with Soil CRC support since 2018 and was field tested at one grazing pasture and two irrigated vegetable sites in Tasmania and other states. Therefore, suppliers of soil moisture sensors can sell permanent installations that report for several seasons without being removed at harvest, which lowers the cost of each reading for the Australia agritech IoT and smart irrigation market.
Will scheme-level automation create larger contracts?
Scheme-level automation offers a second opening, because irrigation channels and pipelines deliver the largest share of farm water. ABS data show that channels and pipelines supplied 3.4 million ML in 2020-21, up 51%, out of 8.1 million ML drawn from all sources. Rubicon Water, founded in Australia in 1995, saw a joint venture bid using its gates and NeuroFlo software selected in Morocco in September 2026, with about A$12 million of Rubicon technology. Because export references strengthen local credibility, irrigation scheme operators can modernize older networks and link farm outlets to grower platforms on thousands of farms.
Coverage gaps and seasonal cash flow slow uptake
Why do coverage gaps still limit rollouts?
Coverage gaps limit rollouts, because many irrigated farms sit in valleys or remote districts where mobile signals are weak or absent. New South Wales even grants temporary telemetry exemptions for properties in blackspots, which shows how common the problem remains. As a result, growers must add repeaters, private radio networks or satellite terminals, which raises installed cost per site. Suppliers respond with bundled connectivity and low-power devices that send small data packets several times a day.
How does seasonal water availability affect spending?
Seasonal water availability makes spending volatile, because irrigators cut capital outlays in dry years when allocations fall. ABS data showed irrigated area falling 22% in 2019-20 before rising 28% in 2020-21 as allocations recovered. Therefore, device sales and new contracts swing with storage levels and commodity prices, especially for cotton and rice growers. Subscription pricing and leasing help suppliers smooth revenue across wet and dry seasons.
Why is data integration still difficult for growers?
Data integration remains difficult, because many farms run sensors, controllers and meters from different brands with separate apps. Growers then spend time reconciling readings instead of acting on them, which weakens the case for further investment. In turn, agronomists and dealers must build custom links between systems, which adds service cost. Open interfaces and platforms that accept third-party devices are the main way suppliers address this barrier.
Do skills shortages slow adoption on farms?
Skills shortages slow adoption, because installing, calibrating and maintaining probes and telemetry needs trained technicians in regional towns. Water is also a contested resource, since agriculture accounted for 66.9% of freshwater withdrawals in 2022 according to World Bank data, which keeps pressure on irrigators to prove efficient use. Without local support, equipment can sit idle after one season, so suppliers invest in dealer training and remote diagnostics.
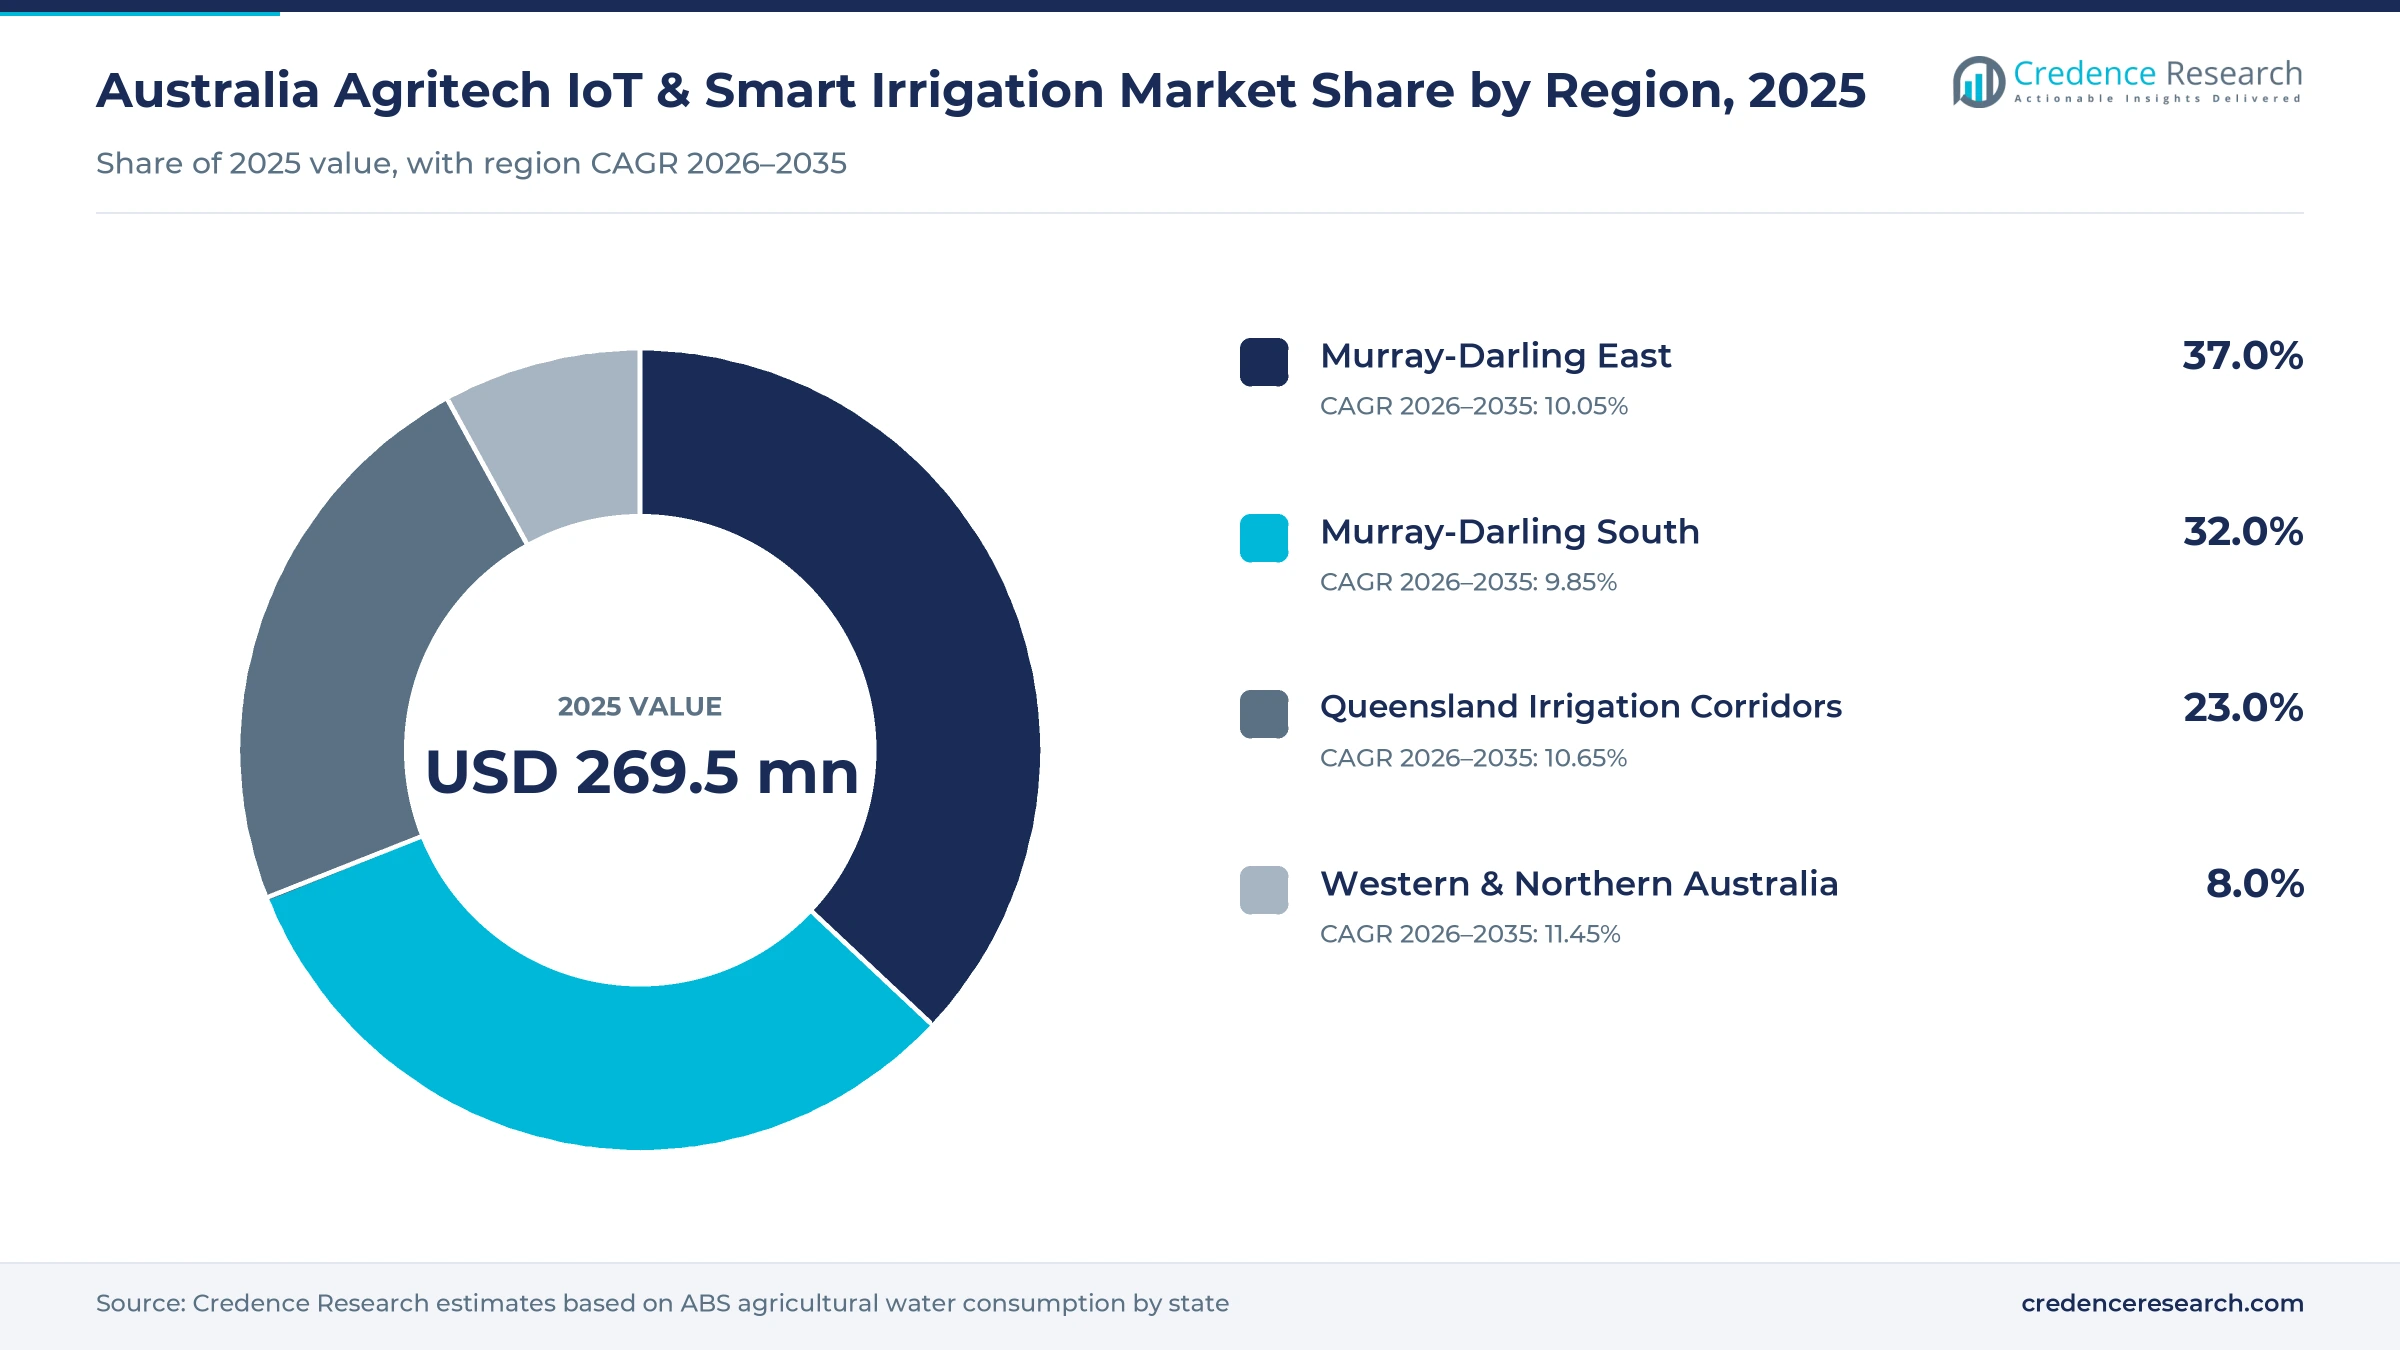
Murray-Darling valleys hold most installed demand
| Region | Value, 2025 (USD million) | Share, 2025 | CAGR, 2026–2035 |
|---|---|---|---|
| Murray-Darling East | 99.7 | 37.0% | 10.05% |
| Murray-Darling South | 86.2 | 32.0% | 9.85% |
| Queensland Irrigation Corridors | 62.0 | 23.0% | 10.65% |
| Western & Northern Australia | 21.6 | 8.0% | 11.45% |
Why does Murray-Darling East lead installed demand?
Murray-Darling East held a 37.0% share of 2025 regional value and grows at 10.05% a year. This lead exists because the New South Wales valleys of the Murrumbidgee, Murray, Lachlan, Namoi and Gwydir hold most of the country's irrigated cotton and rice. New South Wales used 4,679 GL of agricultural water in 2023-24, the highest of any state. Metering deadlines and large corporate cotton farms make this region the main market for telemetry, flow devices and scheduling platforms.
How does Murray-Darling South differ in crop mix?
Murray-Darling South held a 32.0% share of 2025 regional value and grows at 9.85% a year. This reflects how northern Victoria and the South Australian Riverland run dense horticulture, dairy pasture and vineyards. Victoria used 2,666 GL and South Australia 898 GL of agricultural water in 2023-24. Modernized channel networks in this region already rely on automated gates, which helps growers connect on-farm controllers to scheme delivery orders. Therefore, irrigation scheme operators and horticulture growers in this region buy more connected valves and platforms than broadacre farms elsewhere.
What drives demand in Queensland irrigation corridors?
Queensland Irrigation Corridors held a 23.0% share of 2025 regional value and grow at 10.65% a year. Demand comes from sugar cane, cotton and horticulture along the Burdekin, Darling Downs and Bundaberg districts need careful scheduling. Queensland used 2,546 GL of agricultural water in 2023-24, the third-highest total among the states. Growers there also face strict runoff rules near the reef, which supports fertigation and soil moisture monitoring on cane and vegetable farms. As a result, Queensland spending on connected scheduling tools rises faster than the national average through 2035.
Why is Western & Northern Australia growing fastest?
Western & Northern Australia accounted for 8.0% of 2025 regional share and grows at 11.45% a year, the fastest of the four regions. Western Australia used 399 GL and the Northern Territory 90 GL of agricultural water in 2023-24, so the base is small. However, new horticulture, remote stations and satellite-linked monitoring are expanding quickly in these areas.
Sensor launches and deals marked 2024 to 2026
| Development | Status and market relevance |
|---|---|
| In June 2024, Farmbot Monitoring Solutions raised $4.6 million from investors including Telstra and Macdoch Ventures. | Supports remote water monitoring on more than 3,500 farms and stations and expansion into the United States |
| In November 2024, CropX launched an above-canopy evapotranspiration sensor across Australasia, sold through local dealers. | Links canopy water use to the CropX platform for irrigation scheduling |
| In August 2025, Goanna Ag acquired California-based soil moisture firm GroGuru to expand its U.S. footprint. | Adds permanent underground sensors to an Australian scheduling platform |
| In December 2025, Myriota brought its HyperPulse 5G satellite network online in Australia and four other countries. | Widens low-cost IoT coverage for remote water and agriculture monitoring |
| In June 2026, the Soil CRC appointed Sentek as commercialization partner for the BILBY below-ground wireless node. | Market launch expected in the second half of 2026 |
Wireless soil nodes and canopy sensing ahead
- Buried wireless nodes send soil moisture readings from below the surface, which protects devices from machinery and lets probes stay in the ground for several seasons.
- Canopy evapotranspiration sensors measure actual crop water use from above the plants, which complements soil probes and improves scheduling on center pivots.
- Direct-to-satellite IoT sends small data packets from remote paddocks without mobile coverage, which lowers the cost of monitoring tanks, bores and channels.
- Automated channel control links scheme gates and farm outlets to software that matches deliveries to orders, which reduces losses across large gravity networks.
Need a Custom Version of This Report?
Tailor the scope, geography, or segments to your exact requirements.
- Custom geography or segment scope
- Direct access to our analyst team
Local specialists compete with global equipment makers
Competition combines Australian specialists with global irrigation and agtech groups. Rubicon Water, founded in Australia in 1995, leads in automating gravity-fed channel networks for scheme operators. Goanna Ag focuses on irrigation scheduling for cotton growers and has expanded into the United States. Sentek, based in Adelaide, supplies capacitance soil moisture probes and is commercializing the BILBY wireless node. CropX entered the local market by buying Green Brain in December 2023. Farmbot and Myriota compete on remote water monitoring and satellite connectivity. Netafim has operated in Australia and New Zealand since 1993, while Valley Irrigation's owner Valmont expanded its parts distribution with HR Products. Suppliers compete on sensor accuracy, connectivity in remote areas, dealer support and the ability to combine many devices in one platform.
Companies profiled and their roles in this market
| Company | Type | Role in the market |
|---|---|---|
| Rubicon Water | Australian specialist | Automates gravity-fed irrigation networks with gates, communications and NeuroFlo software |
| Goanna Ag | Australian specialist | Irrigation scheduling tools for cotton and other crops, with satellite-linked sensors |
| Sentek Technologies | Australian specialist | Soil moisture probes and commercialization partner for the BILBY wireless node |
| CropX | Global agtech platform | Owns Green Brain in Adelaide and sells soil and canopy sensors through local dealers |
| Farmbot Monitoring Solutions | Australian specialist | Remote monitoring of tanks, bores and dams on more than 3,500 farms and stations |
| Myriota | Satellite IoT provider | Operates the HyperPulse network used by farm water monitoring devices |
| Netafim | Global irrigation maker | Drip systems and digital farming, active in Australia and New Zealand since 1993 |
| Valley Irrigation | Global irrigation maker | Center pivots and controls; owner Valmont acquired Perth-based HR Products |
Credence Research view on adoption pace
Credence Research's view is that adoption in Australia will follow water scarcity and compliance more than device prices. Metering deadlines in New South Wales and the spread of satellite IoT will add many new connected sites before 2028. However, growers will only expand from a few probes to whole-farm systems where platforms combine data from several brands and prove savings each season. Suppliers that bundle connectivity, local service and subscription pricing are best placed to win share as the market moves toward recurring revenue.
How the Australian estimate was built
The report uses 2025 as the base year on a calendar basis, with values in USD million at current prices. Market values come from the Credence Research model, which links irrigated area, water use, installed devices and replacement cycles to typical system prices. Regional and segment splits are Credence Research estimates; the client did not supply regional shares, so they were built from ABS agricultural water consumption by state and adjusted for crop mix. Sources used are ABS statistics, World Bank data, government program pages, regulator fact sheets and company releases, and no interviews or surveys were used.
Metering rules and satellite IoT shape growth to 2035
Spending is expected to reach USD 730.8 million by 2035, a 10.24% CAGR during 2026–2035, as connected control becomes standard on medium and large irrigated farms. Growth should be strongest in the late 2020s, when metering deadlines and new satellite coverage add sites quickly. After that, platforms and subscriptions will make up a rising share of spending as hardware prices fall. Drought years may slow purchases, but they also sharpen the case for measuring every megalitre, which keeps the long-term outlook positive.
Frequently Asked Questions
How big is the Australia agritech IoT and smart irrigation market?
Which region leads demand in Australia?
Which product type holds the largest share?
Why is water efficiency so important for Australian farms?
How do government programs support adoption?
What do New South Wales metering rules require?
Which companies compete in this market?
Which region grows fastest through 2035?
Table of Content
Chapter 1 Market Segmentation
- 1.1 Segmentation Framework
- 1.1.1 Product and Service Classification
- 1.1.2 Application and End-Use Classification
- 1.1.3 Technology and Solution Classification
- 1.1.4 Customer and Distribution Channel Classification
- 1.1.5 Geographic Segmentation
- 1.1.6 Market Segment Definitions and Boundaries
- 1.2 By Product Type
- 1.2.1 Smart Irrigation Controllers
- 1.2.2 Soil & Climate Sensors
- 1.2.3 Connected Valves & Flow Devices
- 1.2.4 Connected Irrigation Platforms
- 1.3 By Crop Type
- 1.3.1 Horticulture & Orchards
- 1.3.2 Broadacre Field Crops
- 1.3.3 Cotton
- 1.3.4 Viticulture & Protected Crops
- 1.4 By Application
- 1.4.1 Irrigation Scheduling
- 1.4.2 Soil Moisture Monitoring
- 1.4.3 Water Allocation & Flow Metering
- 1.4.4 Fertigation & Crop Water Optimization
- 1.5 By Customer Type
- 1.5.1 Commercial Growers
- 1.5.2 Corporate Farm Operators
- 1.5.3 Irrigation Scheme Operators
- 1.5.4 Government & Research Users
Chapter 2 Introduction
- 2.1 Report Objectives and Scope
- 2.2 Product Definition and Industry Terminology
- 2.3 Market Inclusions and Exclusions
- 2.4 Research Process
- 2.4.1 Primary Research and Expert Interviews
- 2.4.2 Secondary Research and Source Review
- 2.4.3 Top-Down and Bottom-Up Estimation
- 2.4.4 Data Triangulation and Verification
- 2.5 Market Size Measurement Basis
- 2.5.1 2025: USD 269.5 million → 2035: USD 730.8 million
- 2.6 Historical and Forecast Reference Periods
- 2.6.1 Historical Period: 2018-2025
- 2.6.2 Base Year: 2025
- 2.6.3 Forecast Period: 2025-2035
- 2.7 Research Assumptions and Limitations
Chapter 3 Executive Summary
- 3.1 Market Snapshot and Key Findings
- 3.2 Base-Year Market Size, 2025
- 3.3 Forecast Market Size, 2035
- 3.4 Revenue and Volume Growth Outlook
- 3.5 Key Demand and Supply Indicators
- 3.6 Leading Market Segments
- 3.7 Fastest-Growing Market Opportunities
- 3.8 Regional Performance Highlights
- 3.9 Technology and Industry Transformation
- 3.10 Competitive Landscape Summary
- 3.11 Analyst View and Strategic Implications
Chapter 4 Australia Agritech IoT & Smart Irrigation Market Trends and Developments
- 4.1 Historical Industry Development, 2018-2025
- 4.2 Recent Market Trends and Developments
- 4.3 Demand and Customer Behavior Trends
- 4.4 Technology and Product Innovation
- 4.5 Artificial Intelligence, Automation and Digitalization
- 4.6 Local Manufacturing and Supply Chain Realignment
- 4.7 Industry Partnerships, Mergers and Acquisitions
- 4.8 Sustainability and Circular Economy Developments
- 4.9 Government and Private Sector Investment Trends
- 4.10 Emerging Business Models and Commercialization
- 4.11 Industry Developments and Announcements
Chapter 5 Australia Agritech IoT & Smart Irrigation Market Production, Supply and Demand Analysis
- 5.1 Demand Trend and Consumption Analysis, 2018-2025
- 5.2 Demand Forecast, 2025-2035
- 5.3 Production and Output Trend, 2018-2025
- 5.4 Production and Output Forecast, 2025-2035
- 5.5 Installed Capacity and Capacity Utilization
- 5.6 Company-Wise Production Plants and Statistics
- 5.6.1 Installed Production Capacity
- 5.6.2 Actual Production
- 5.6.3 Planned Capacity and Expansion Targets
- 5.7 Supply Chain Structure and Procurement Trends
- 5.8 Supply-Demand Gap and Bottlenecks
- 5.9 Import Dependence and Sourcing Structure
- 5.10 Contract Manufacturing and Outsourcing
- 5.11 Regional Supply and Demand Concentration
Chapter 6 Australia Agritech IoT & Smart Irrigation Market Pricing Analysis
- 6.1 Pricing Structure and Measurement
- 6.2 Historical Pricing Trends, 2018-2025
- 6.3 Pricing Outlook, 2025-2035
- 6.4 Average Selling Price and Unit Economics
- 6.5 Pricing by Product and Market Segment
- 6.6 Geographic Pricing Differences
- 6.7 Key Input, Energy, Labor and Logistics Costs
- 6.8 Contract Pricing and Purchasing Models
- 6.9 Pricing Sensitivity and Competitive Positioning
- 6.10 Price, Margin and Profitability Implications
Chapter 7 Australia Agritech IoT & Smart Irrigation Market Dynamics
- 7.1 Market Growth Drivers
- 7.1.1 Demand-Side Drivers
- 7.1.2 Technology and Innovation Drivers
- 7.1.3 Infrastructure and Investment Drivers
- 7.1.4 Regulatory and Policy Drivers
- 7.2 Market Restraints
- 7.2.1 Cost and Affordability Constraints
- 7.2.2 Technology and Adoption Barriers
- 7.2.3 Supply Chain and Operational Constraints
- 7.3 Market Challenges
- 7.3.1 Competitive Pressure and Margin Erosion
- 7.3.2 Skills, Infrastructure and Implementation Gaps
- 7.4 Emerging Market Opportunities
- 7.5 Market Dynamics Impact and Time-Horizon Assessment
Chapter 8 Australia Agritech IoT & Smart Irrigation Value Chain Analysis
- 8.1 Industry Value Chain Overview
- 8.2 Upstream Suppliers and Critical Inputs
- 8.3 Technology and Component Providers
- 8.4 Manufacturing or Service Delivery
- 8.5 Distribution, Channel Partners and Integrators
- 8.6 Downstream Applications and End Users
- 8.7 Value Addition and Profit Pools
- 8.8 Vertical Integration and Outsourcing
- 8.9 Supplier Concentration and Risk
- 8.10 Supply Chain Localization and Resilience
Chapter 9 Australia Agritech IoT & Smart Irrigation Market Regulations and Policies
- 9.1 Relevant Laws, Standards and Compliance Frameworks
- 9.2 Product, Service, Safety and Quality Requirements
- 9.3 Government Policies, Incentives and Subsidies
- 9.4 Imports, Exports and Trade Barriers
- 9.5 Public Procurement and Local Content Requirements
- 9.6 Environmental and Sustainability Compliance
- 9.7 Upcoming Policy Changes and Market Implications
Chapter 10 Australia Agritech IoT & Smart Irrigation Market Hotspots and Opportunities
- 10.1 Market Opportunity Mapping and Growth Hotspots
- 10.2 High-Growth Applications and Customer Groups
- 10.3 Underserved Markets and White-Space Opportunities
- 10.4 Emerging Technology and Product Opportunities
- 10.5 New Capacity and Investment Hotspots
- 10.6 Market Entry and Expansion Opportunities
- 10.7 Distribution and Partnership Opportunities
- 10.8 Near-Term and Long-Term Commercial Potential
- 10.9 Opportunity Attractiveness and Execution Risks
Chapter 11 Australia Agritech IoT & Smart Irrigation Market Outlook, 2025-2035
- 11.1 Market Size and Analysis
- 11.1.1 Revenue (Market Measurement: 2025: USD 269.5 million → 2035: USD 730.8 million)
- 11.1.2 Market Volume and Quantity Sold
- 11.1.3 Historical Market Size, 2018-2025
- 11.1.4 Base-Year Market Size, 2025
- 11.2 Market Forecast, 2025-2035
- 11.2.1 Revenue Forecast to 2035
- 11.2.2 Volume Forecast to 2035
- 11.2.3 CAGR and Year-on-Year Growth
- 11.2.4 Incremental Revenue Opportunity
- 11.3 Forecast Assumptions and Scenario Analysis
- 11.3.1 Base-Case Forecast
- 11.3.2 Optimistic and Conservative Scenarios
- 11.3.3 Technology, Pricing and Policy Sensitivities
- 11.4 Market Attractiveness and Growth Outlook
Chapter 12 Australia Agritech IoT & Smart Irrigation Market Segmentation and Outlook
- 12.1 Segmentation Summary and Market Shares, 2025
- 12.2 Largest and Fastest-Growing Segments
- 12.3 By Product Type - Market Size and Forecast, 2025-2035
- 12.3.1 Segment Definition and Scope
- 12.3.2 Historical Market Size, 2018-2025
- 12.3.3 Revenue Forecast, 2025-2035
- 12.3.4 Volume Forecast, 2025-2035
- 12.3.5 Base-Year Market Share, 2025
- 12.3.6 Segment CAGR and Growth Drivers
- 12.3.7 Subsegment Market Size and Forecast
- 12.3.7.1 Smart Irrigation Controllers
- 12.3.7.2 Soil & Climate Sensors
- 12.3.7.3 Connected Valves & Flow Devices
- 12.3.7.4 Connected Irrigation Platforms
- 12.3.8 Subsegment Pricing and Adoption Trends
- 12.3.9 Leading Suppliers and Competition
- 12.3.10 Regional Demand and Opportunities
- 12.4 By Crop Type - Market Size and Forecast, 2025-2035
- 12.4.1 Segment Definition and Scope
- 12.4.2 Historical Market Size, 2018-2025
- 12.4.3 Revenue Forecast, 2025-2035
- 12.4.4 Volume Forecast, 2025-2035
- 12.4.5 Base-Year Market Share, 2025
- 12.4.6 Segment CAGR and Growth Drivers
- 12.4.7 Subsegment Market Size and Forecast
- 12.4.7.1 Horticulture & Orchards
- 12.4.7.2 Broadacre Field Crops
- 12.4.7.3 Cotton
- 12.4.7.4 Viticulture & Protected Crops
- 12.4.8 Subsegment Pricing and Adoption Trends
- 12.4.9 Leading Suppliers and Competition
- 12.4.10 Regional Demand and Opportunities
- 12.5 By Application - Market Size and Forecast, 2025-2035
- 12.5.1 Segment Definition and Scope
- 12.5.2 Historical Market Size, 2018-2025
- 12.5.3 Revenue Forecast, 2025-2035
- 12.5.4 Volume Forecast, 2025-2035
- 12.5.5 Base-Year Market Share, 2025
- 12.5.6 Segment CAGR and Growth Drivers
- 12.5.7 Subsegment Market Size and Forecast
- 12.5.7.1 Irrigation Scheduling
- 12.5.7.2 Soil Moisture Monitoring
- 12.5.7.3 Water Allocation & Flow Metering
- 12.5.7.4 Fertigation & Crop Water Optimization
- 12.5.8 Subsegment Pricing and Adoption Trends
- 12.5.9 Leading Suppliers and Competition
- 12.5.10 Regional Demand and Opportunities
- 12.6 By Customer Type - Market Size and Forecast, 2025-2035
- 12.6.1 Segment Definition and Scope
- 12.6.2 Historical Market Size, 2018-2025
- 12.6.3 Revenue Forecast, 2025-2035
- 12.6.4 Volume Forecast, 2025-2035
- 12.6.5 Base-Year Market Share, 2025
- 12.6.6 Segment CAGR and Growth Drivers
- 12.6.7 Subsegment Market Size and Forecast
- 12.6.7.1 Commercial Growers
- 12.6.7.2 Corporate Farm Operators
- 12.6.7.3 Irrigation Scheme Operators
- 12.6.7.4 Government & Research Users
- 12.6.8 Subsegment Pricing and Adoption Trends
- 12.6.9 Leading Suppliers and Competition
- 12.6.10 Regional Demand and Opportunities
- 12.7 Segment Growth Comparison
- 12.8 Segment Attractiveness and Priority Matrix
Chapter 13 Australia Agritech IoT & Smart Irrigation End-Use and Application Market Outlook
- 13.1 End-Use Industry and Customer Demand Structure
- 13.2 Leading Applications and Customer Groups
- 13.3 End-Use Market Size, Share and Forecast
- 13.4 Major End-Use Industry Deep Dives
- 13.4.1 Customer Requirements and Use Cases
- 13.4.2 Demand and Replacement Cycles
- 13.4.3 Technical and Regulatory Considerations
- 13.4.4 Purchasing and Procurement Models
- 13.4.5 Leading Vendors and Distribution Channels
- 13.4.6 Forecast and Commercial Opportunities
- 13.5 Emerging Applications and Cross-Segment Demand
- 13.6 End-Use Industry Investment Priorities
Chapter 14 Australia Agritech IoT & Smart Irrigation Geographic Market Outlook, 2025-2035
- 14.1 Regional Market Size and Country-Level Shares, 2025
- 14.2 Country Market Size Comparison, 2025
- 14.3 Country Market Forecasts, 2025-2035
- 14.4 Subregional Industrial and Demand Clusters
- 14.5 Intra-Regional Pricing and Cost Differences
- 14.6 Cross-Border Trade and Supply Networks
- 14.7 Regional Supply and Demand Balances
- 14.8 Country Opportunity Comparison and Prioritization
Note: Every listed country is covered on the structure shown under the first country.
Chapter 15 Australia Agritech IoT & Smart Irrigation Technology, Innovation and Sustainability Outlook
- 15.1 Technology Landscape and Maturity
- 15.2 Product, Process and Service Innovation
- 15.3 AI, Automation and Digital Tools in the Industry
- 15.4 Technology Adoption and Performance Benchmarking
- 15.5 Innovation Pipeline and R&D Investment
- 15.6 Patent and Intellectual Property Trends
- 15.7 Energy Efficiency and Resource Management
- 15.8 Sustainability, Recycling and Circularity
- 15.9 Technology Roadmap, 2025-2035
- 15.10 Risks of Obsolescence and Technology Substitution
Chapter 16 Australia Agritech IoT & Smart Irrigation Market Key Strategic Imperatives
- 16.1 Growth and Market Entry Priorities
- 16.2 High-Return Products and Segments
- 16.3 Pricing, Profitability and Cost Optimization
- 16.4 Technology Investment and Product Differentiation
- 16.5 Supply Chain Localization and Resilience
- 16.6 Distribution and Customer Acquisition
- 16.7 Partnership, Acquisition and Capacity Strategy
- 16.8 Regional Expansion Priorities
- 16.9 Short-, Medium- and Long-Term Actions
Chapter 17 Competition Outlook
- 17.1 Industry Competition Characteristics
- 17.2 Market Structure and Concentration
- 17.3 Market Share and Competitive Positioning, 2025
- 17.4 Company-Wise Revenue and Product Benchmarking
- 17.5 Production and Service Capacity Benchmarking
- 17.6 Technology, Pricing and Differentiation
- 17.7 Regional Footprint and Distribution Strength
- 17.8 Mergers, Acquisitions and Strategic Alliances
- 17.9 New Entrants and Competitive Threats
- 17.10 Porter's Five Forces and Industry Attractiveness
- 17.11 Competitive Outlook, 2025-2035
Chapter 18 Company Profiles
- 18.1 Company Coverage and Selection Criteria
- 18.2 Rubicon Water
- 18.2.1 Business Description
- 18.2.2 Company Ownership and Geographic Presence
- 18.2.3 Product and Service Portfolio
- 18.2.4 Manufacturing and Operating Footprint
- 18.2.5 Production Capacity and Expansion Plans
- 18.2.6 Financial Performance and Investment
- 18.2.7 Market Share and Competitive Position
- 18.2.8 Technology and Innovation Capabilities
- 18.2.9 Strategic Alliances or Partnerships
- 18.2.10 Recent Developments
- 18.2.11 Growth Strategy and Outlook
- 18.3 CropX
- 18.4 Goanna Ag
- 18.5 SWAN Systems
- 18.6 Netafim
- 18.7 Sentek Technologies
- 18.8 Farmbot Monitoring Solutions
- 18.9 Myriota
- 18.10 Valley Irrigation
- 18.11 Lindsay Corporation
- 18.12 Other Relevant Market Participants
Note: Every listed company is profiled on the structure shown under the first company. The company list is preliminary and may change based on research findings, market developments, data availability and client requirements.
Chapter 19 Disclaimer
- 19.1 Research and Forecast Disclaimer
- 19.2 Data Source and Estimation Limitations
Note: The depth of individual sections depends on data availability for this market. Volume, capacity, trade and other unit-based metrics are included where applicable.

