
Brazilian farmers move input buying and grain sales online
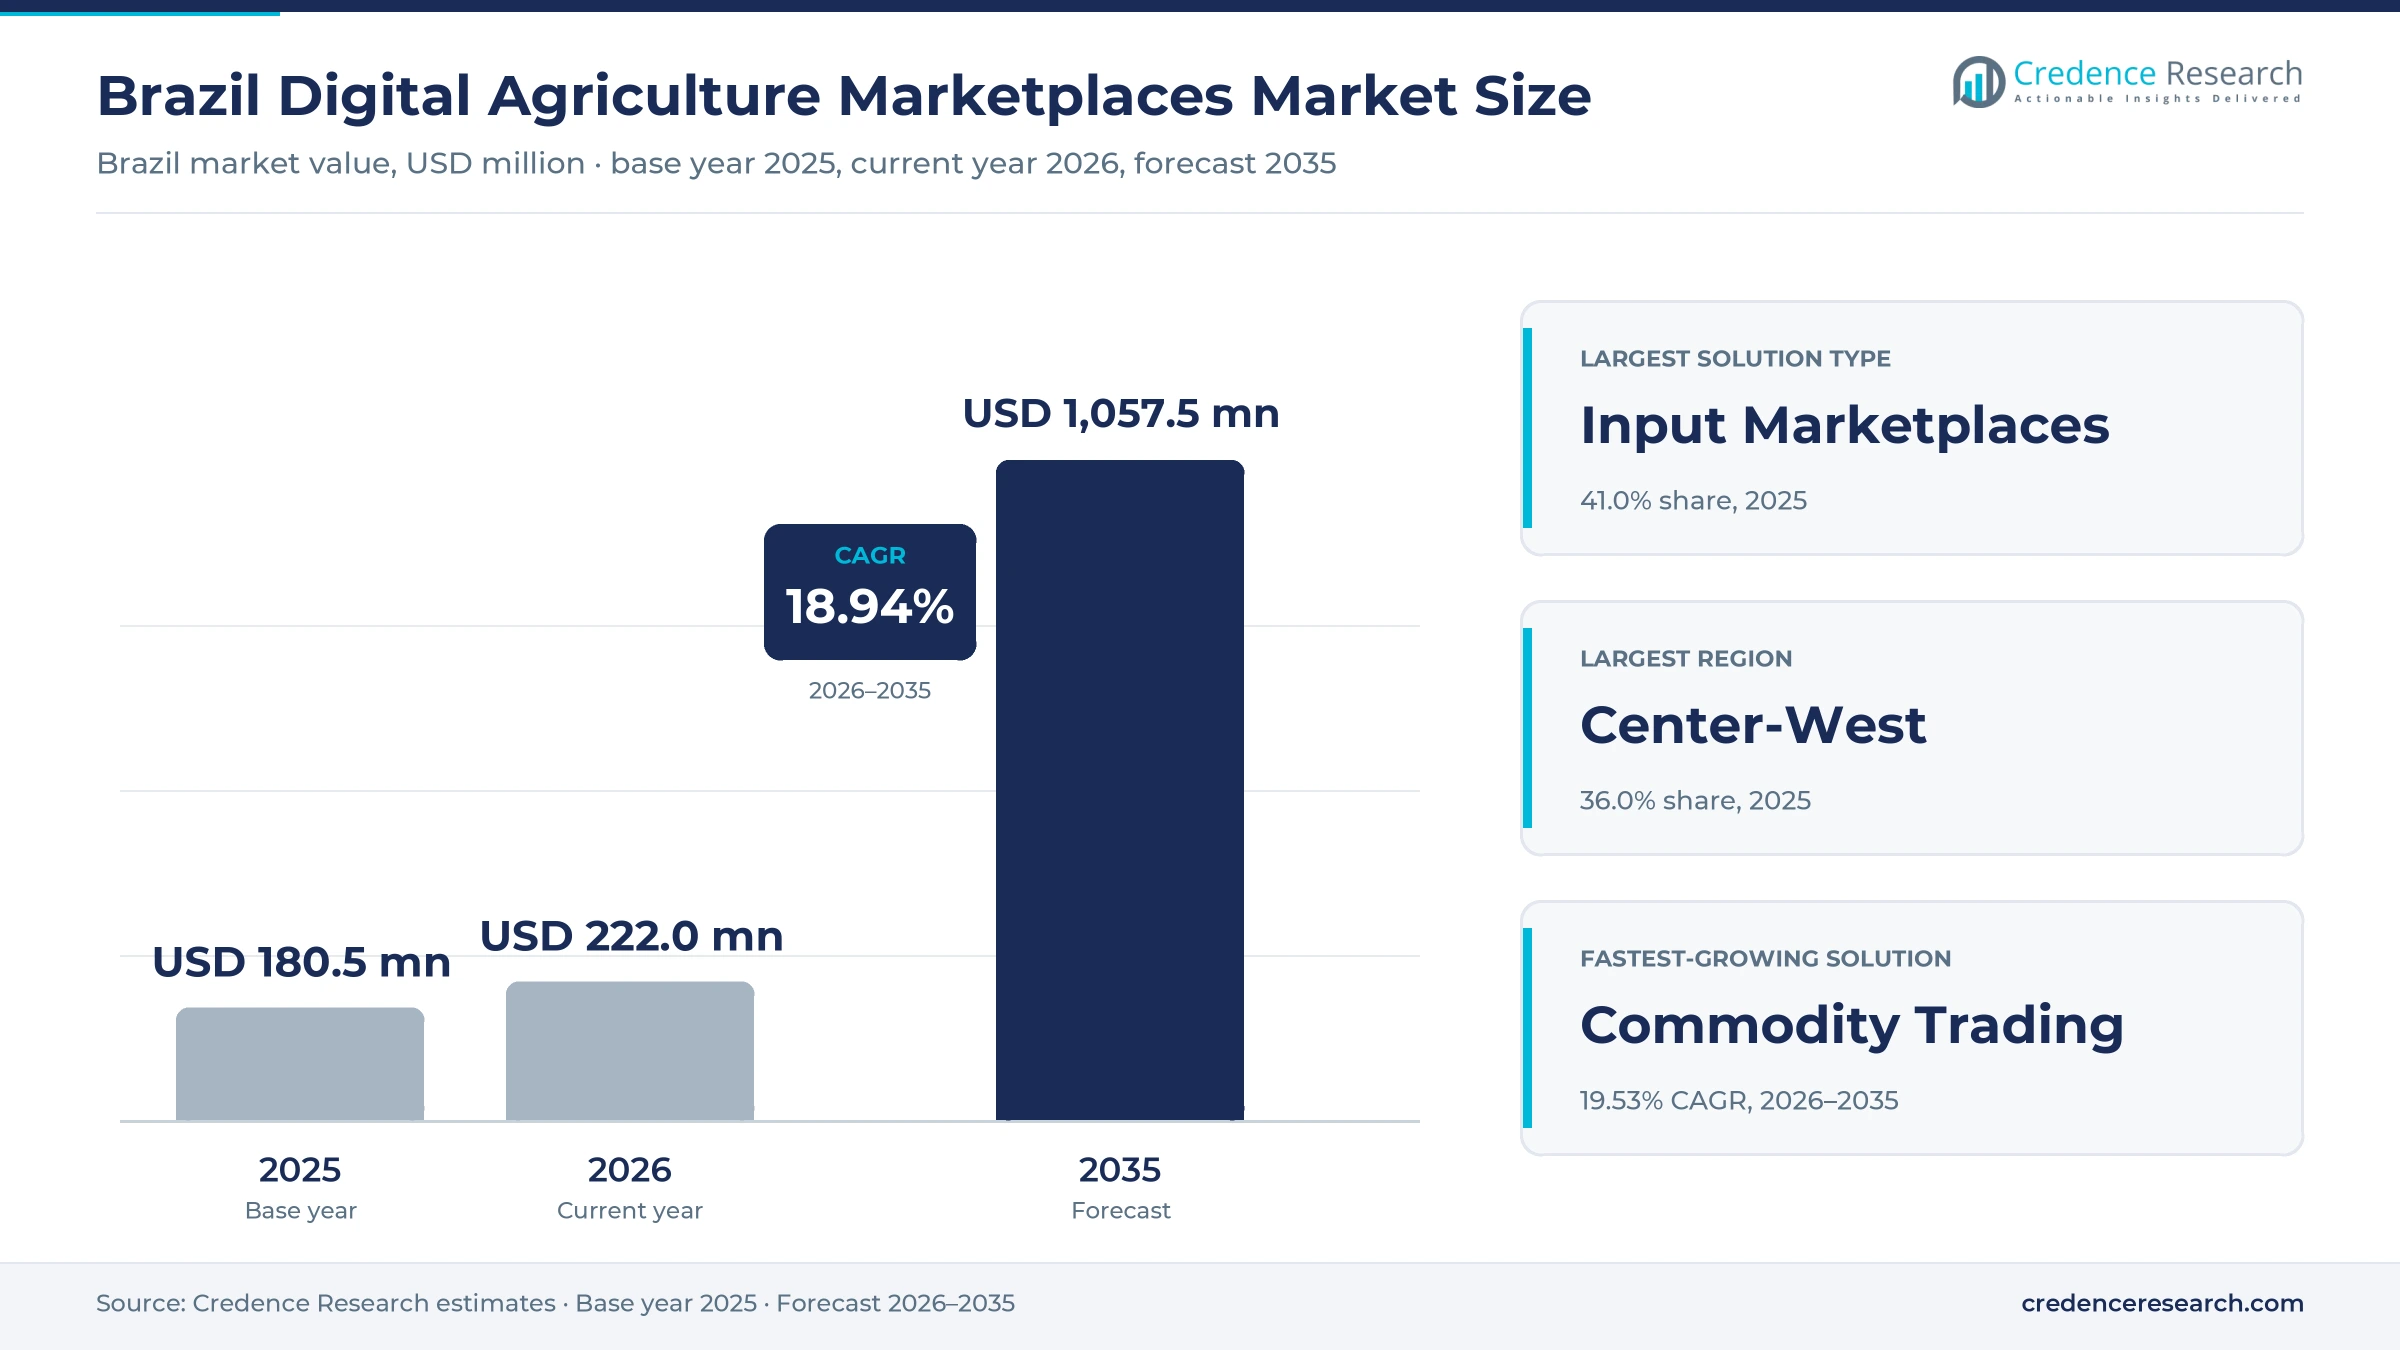
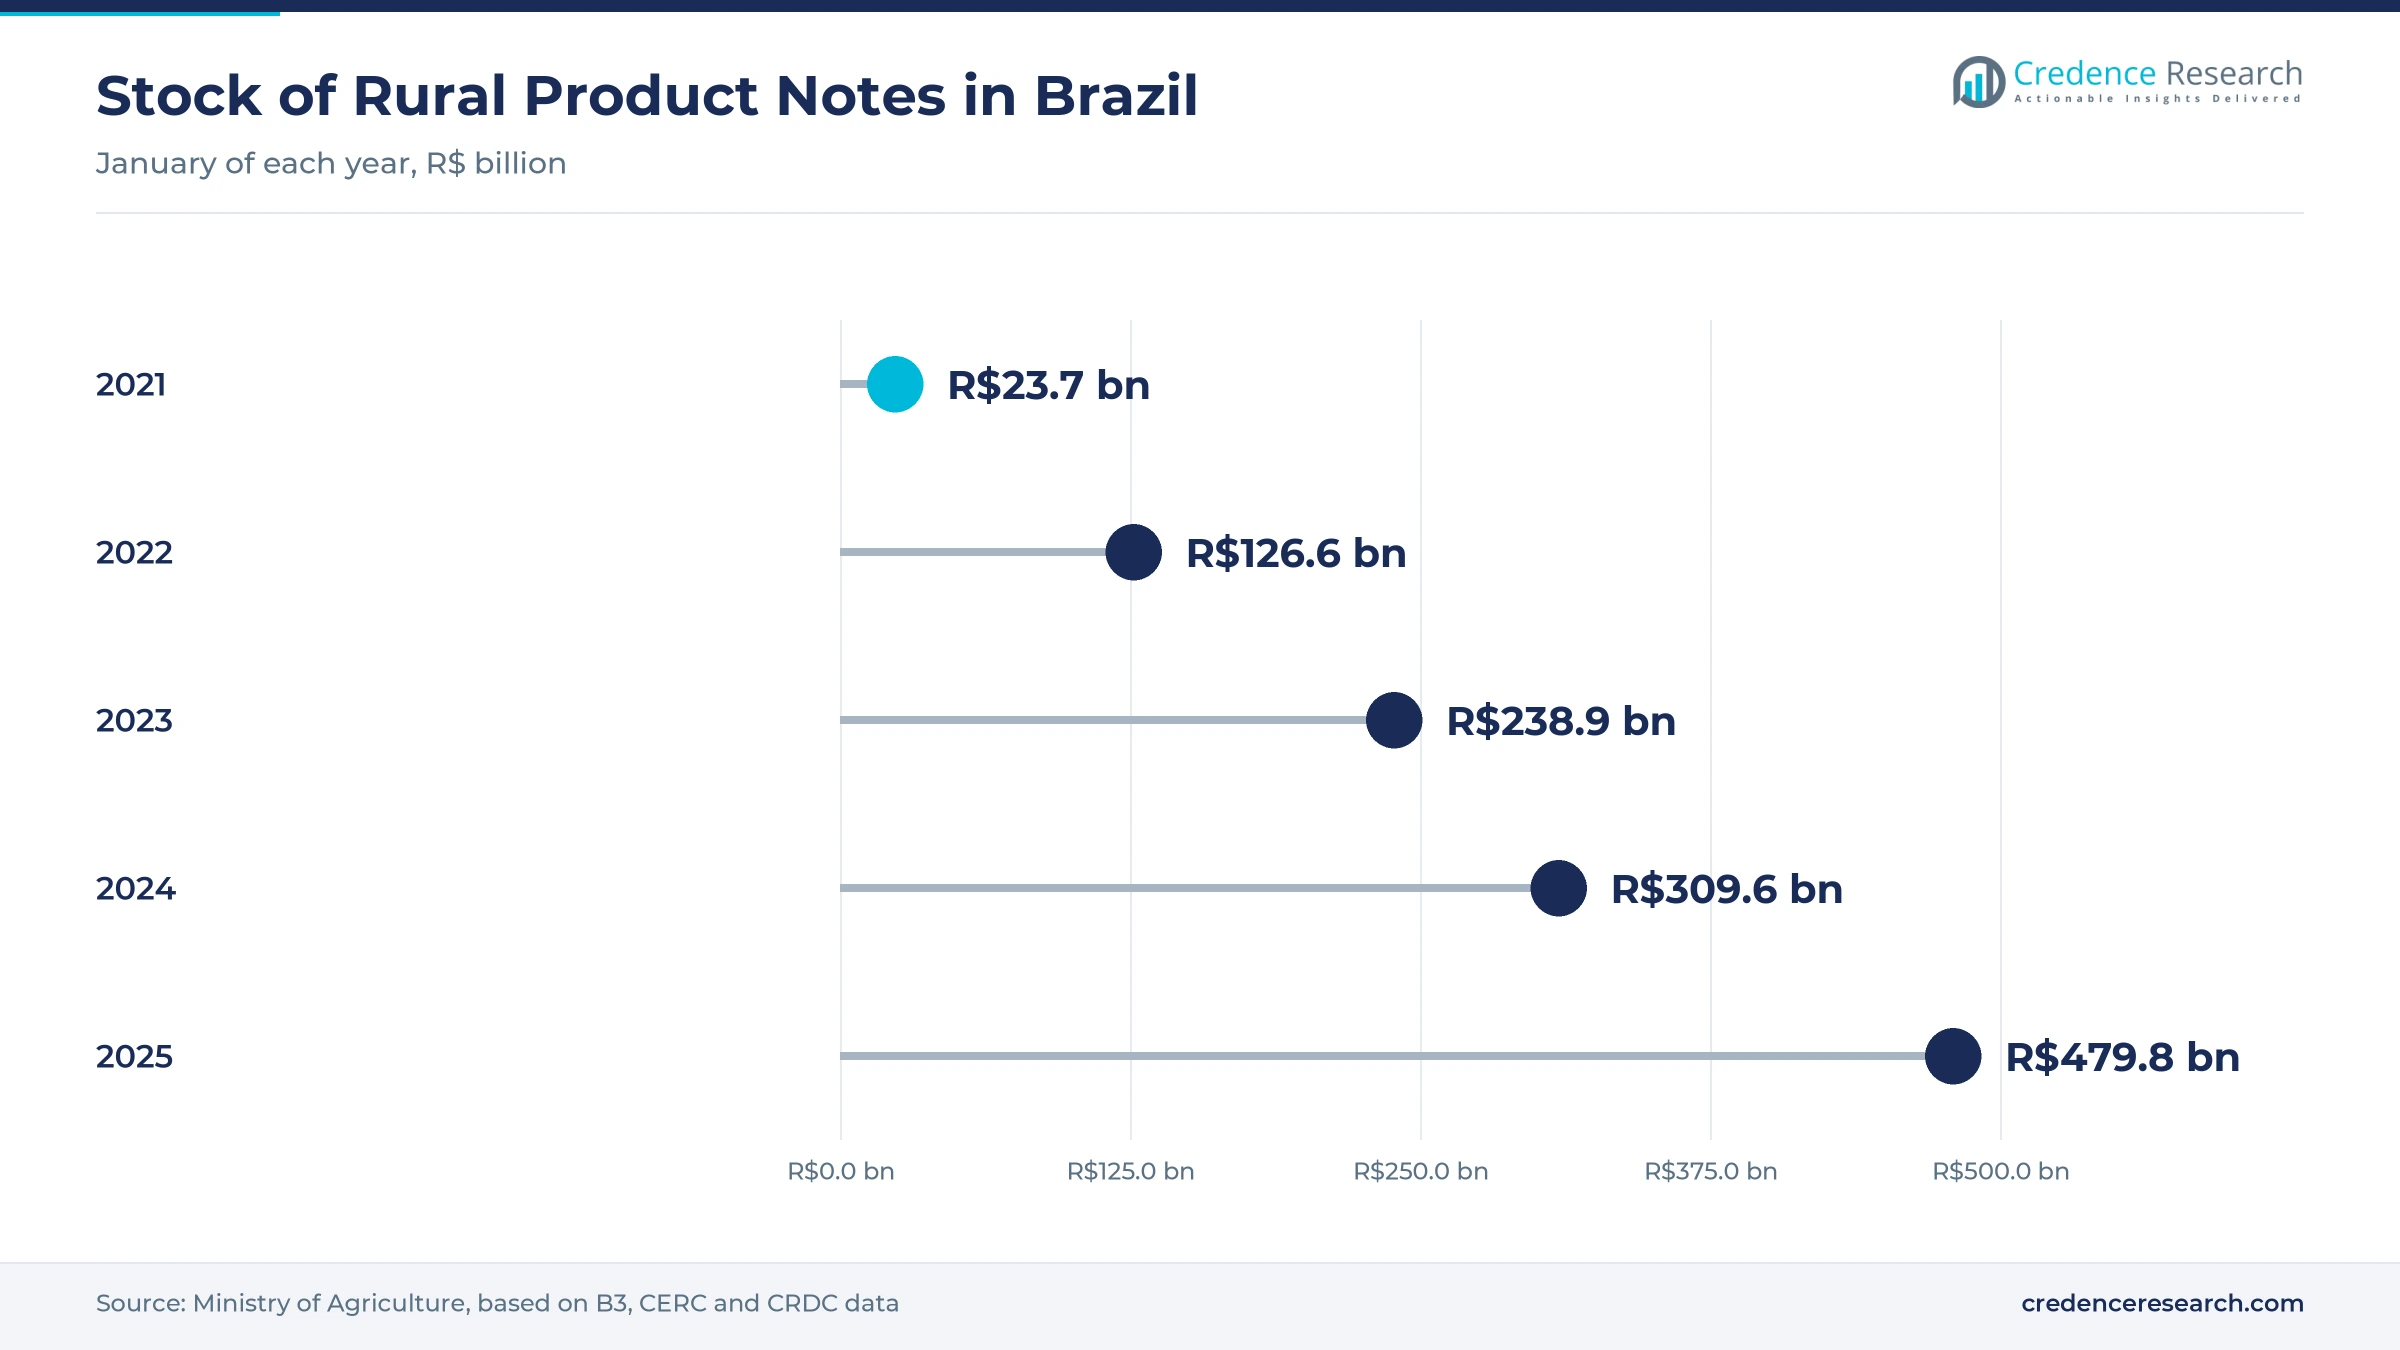
The Brazil digital agriculture marketplaces market was valued at USD 180.5 million in 2025 and is projected to increase from USD 222.0 million in 2026 to USD 1.06 billion by 2035, registering a CAGR of 18.94% during 2026–2035. Demand comes from grain, coffee, sugarcane and livestock producers that compare input prices, sell crops and arrange credit on web and mobile platforms. Center-West held the largest regional share, 36.0% in 2025, because Mato Grosso, Goiás and Mato Grosso do Sul produce most of the soybeans and corn traded online. North is the fastest-growing region at 20.38% a year, as farms on the agricultural frontier gain mobile coverage and join trading apps. Meanwhile, the outstanding stock of rural product notes reached R$479.77 billion in January 2025, which gives platforms a formal tool to link input sales with future harvests. As a result, revenue is shifting from listing fees toward commissions and financial services.
What do Brazilian agriculture marketplaces include?
The estimate counts revenue earned by online platforms that connect Brazilian farmers with input sellers, grain buyers, machinery dealers and service providers. It covers transaction commissions, subscription and software fees, advertising and lead generation, and referral fees for credit and insurance. Platforms operate through websites, mobile apps, WhatsApp-assisted sales and omnichannel models that combine digital orders with field sales teams.
The estimate excludes the gross value of goods sold, because the platform keeps only its fee or margin. It also excludes farm management software sold without a trading function, along with physical retail stores. The value chain runs from input makers, traders and banks through the platform to producers, cooperatives and buyers across Brazil.
Brazil Digital Agriculture Marketplaces Market Insights
- The market was valued at USD 180.5 million in 2025 and is projected to reach USD 1.06 billion by 2035, registering a CAGR of 18.94% during 2026–2035.
- Center-West held 36.0% of Brazilian platform revenue in 2025, because the grain belt supplies most soybean and corn trades.
- Input marketplaces led with 41.0% of 2025 value, as farmers buy seeds, fertilizers and crop protection through bundled offers.
- Grão Direto traded 12 million metric tons of grain in 2025, up from 1 million metric tons in 2021, showing rapid adoption of online origination.
- Orbia passed R$7 billion in cumulative transactions in July 2026 and counts about 290,000 registered producers, covering roughly 75% of planted area.
Input platforms lead while grain trading grows fastest
Why do input marketplaces hold the largest share?
Based on solution type, the market is categorized into input marketplaces, commodity trading platforms, machinery and equipment marketplaces, and multi-category agro marketplaces. Input Marketplaces led with 41.0% of 2025 value, because seeds, fertilizers and pesticides are bought every season. Commodity Trading Platforms grow fastest at 19.53% a year, while listings for farm machinery grow more slowly.
How do farmers reach platforms in Brazil?
Based on deployment model, the market is categorized into web-first platforms, mobile app-first platforms, WhatsApp-assisted commerce and omnichannel integrated platforms. Mobile App-first Platforms led with 38.0% of 2025 value, because producers check prices and close deals from the field. Omnichannel Integrated Platforms grow fastest at 19.78% a year, as companies combine apps with sales agents and messaging.
Which crops generate most platform revenue?
Based on end-use industry, the market is categorized into grains and oilseeds, sugarcane and bioenergy, coffee and horticulture, and livestock and dairy. Grains and Oilseeds led with 54.0% of 2025 value, because soybeans and corn dominate input spending and online sales. Livestock and Dairy grow fastest at 19.55% a year, while cane mills tied to ethanol buy mostly through direct contracts.
Which farm sizes buy most online?
Based on customer type, the market is categorized into large commercial farms, mid-sized producers, small and family farms, cooperatives and producer groups, and agribusiness buyers and distributors. Large Commercial Farms led with 37.0% of 2025 value, because they buy inputs in large lots. Small and Family Farms grow fastest at 19.85% a year, as rural internet access widens and simple apps reach smaller producers.
| Segment Group | Leading Sub-segment | Share, 2025 | Fastest-growing Sub-segment | CAGR, 2026–2035 |
|---|---|---|---|---|
| By Solution Type | Input Marketplaces | 41.0% | Commodity Trading Platforms | 19.53% |
| By Deployment Model | Mobile App-first Platforms | 38.0% | Omnichannel Integrated Platforms | 19.78% |
| By End-Use Industry | Grains and Oilseeds | 54.0% | Livestock and Dairy | 19.55% |
| By Customer Type | Large Commercial Farms | 37.0% | Small and Family Farms | 19.85% |
Request a Free Sample
Fill in your details and we'll send you a free sample report.
- Sample data tables & charts
- Research methodology
Connectivity, farmer migration and credit lift demand
How does rural connectivity lift platform use?
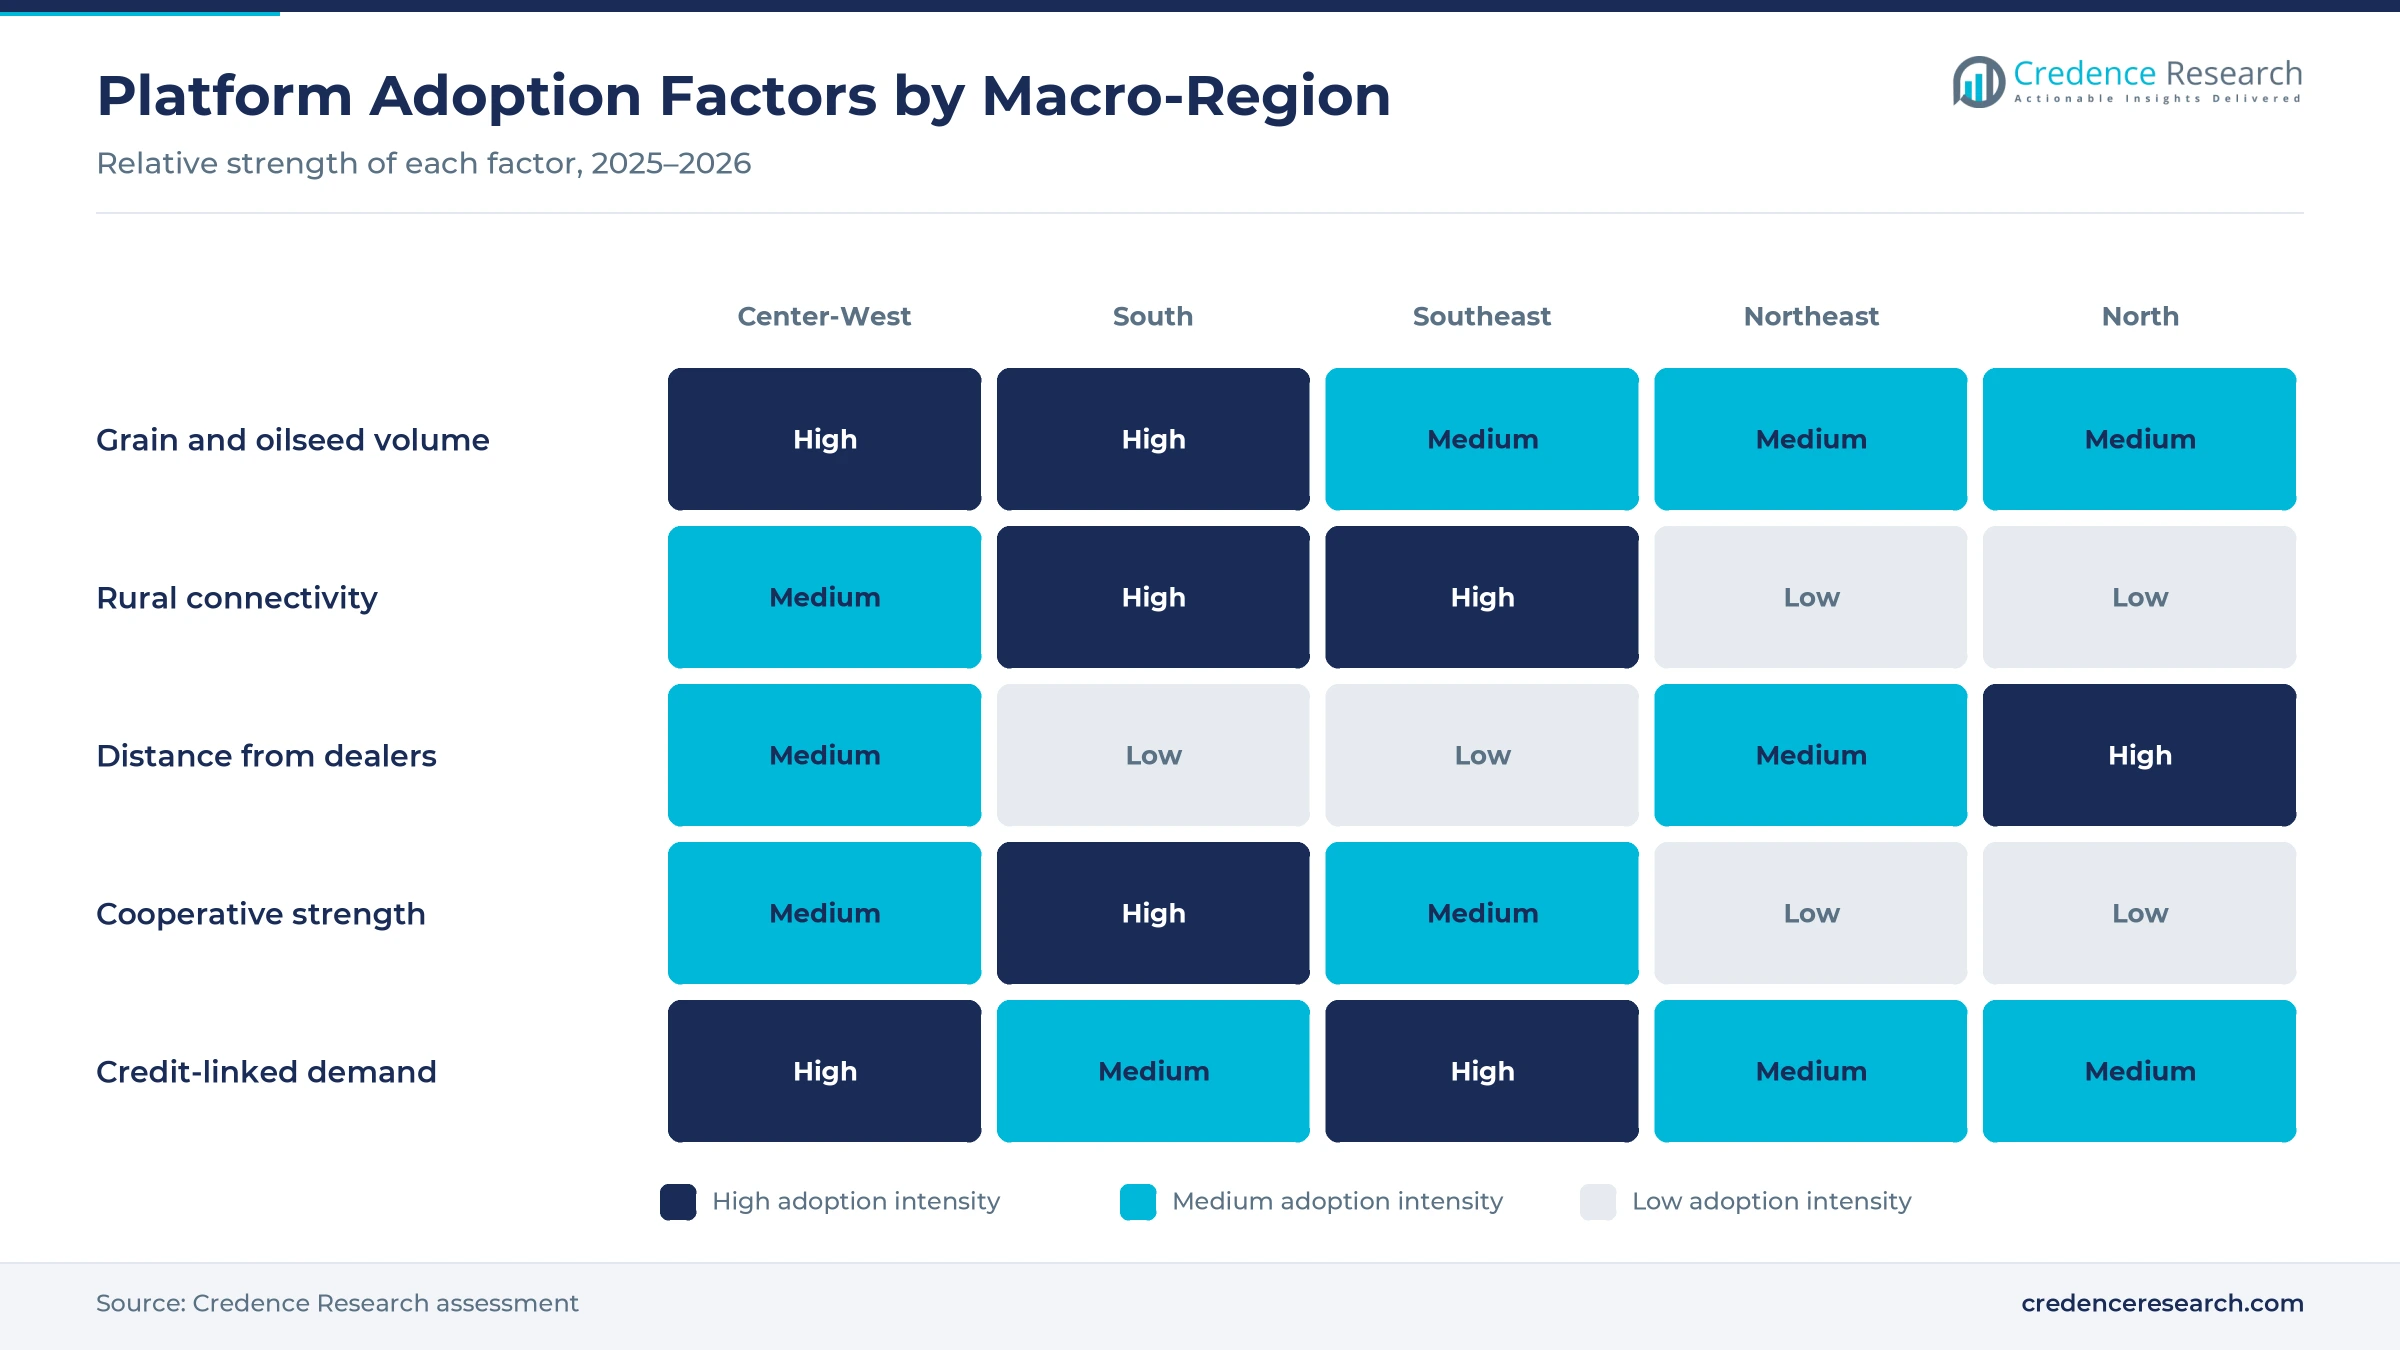
Expanding rural digital connectivity is the base driver, because farmers can only trade online where signals reach the farm. IBGE data show that 84.8% of rural households had internet access in 2024, against 94.7% of urban homes, as reported by Teletime. Nationally, internet reached 93.6% of households, or about 74.9 million homes. World Bank data also put internet users at 84.5% of the population in 2024. Grão Direto reported that 48% of its users accessed accounts outside trading hours, which shows how often producers check prices from phones. As a result, mobile app-first platforms led with 38.0% of 2025 value, because most farm decisions now start on a smartphone.
Why are producers moving to digital commerce?
Producers are migrating to digital commerce, because online platforms let them compare input prices and sell grain without long phone negotiations. Orbia counted about 290,000 registered producers in July 2026, covering roughly 75% of planted area, according to Bloomberg Línea. Broto reported about 250,000 registered producers and more than 1,000 companies on its marketplace in March 2025. Grão Direto lifted traded volume from 1 million metric tons in 2021 to 12 million metric tons in 2025. An Embrapa survey in 2020 also found that 40.5% of producers used digital tools to buy inputs or sell crops. Therefore, input marketplaces held 41.0% of 2025 value in the Brazil digital agriculture marketplaces market.
How do payments, credit and formal rules help?
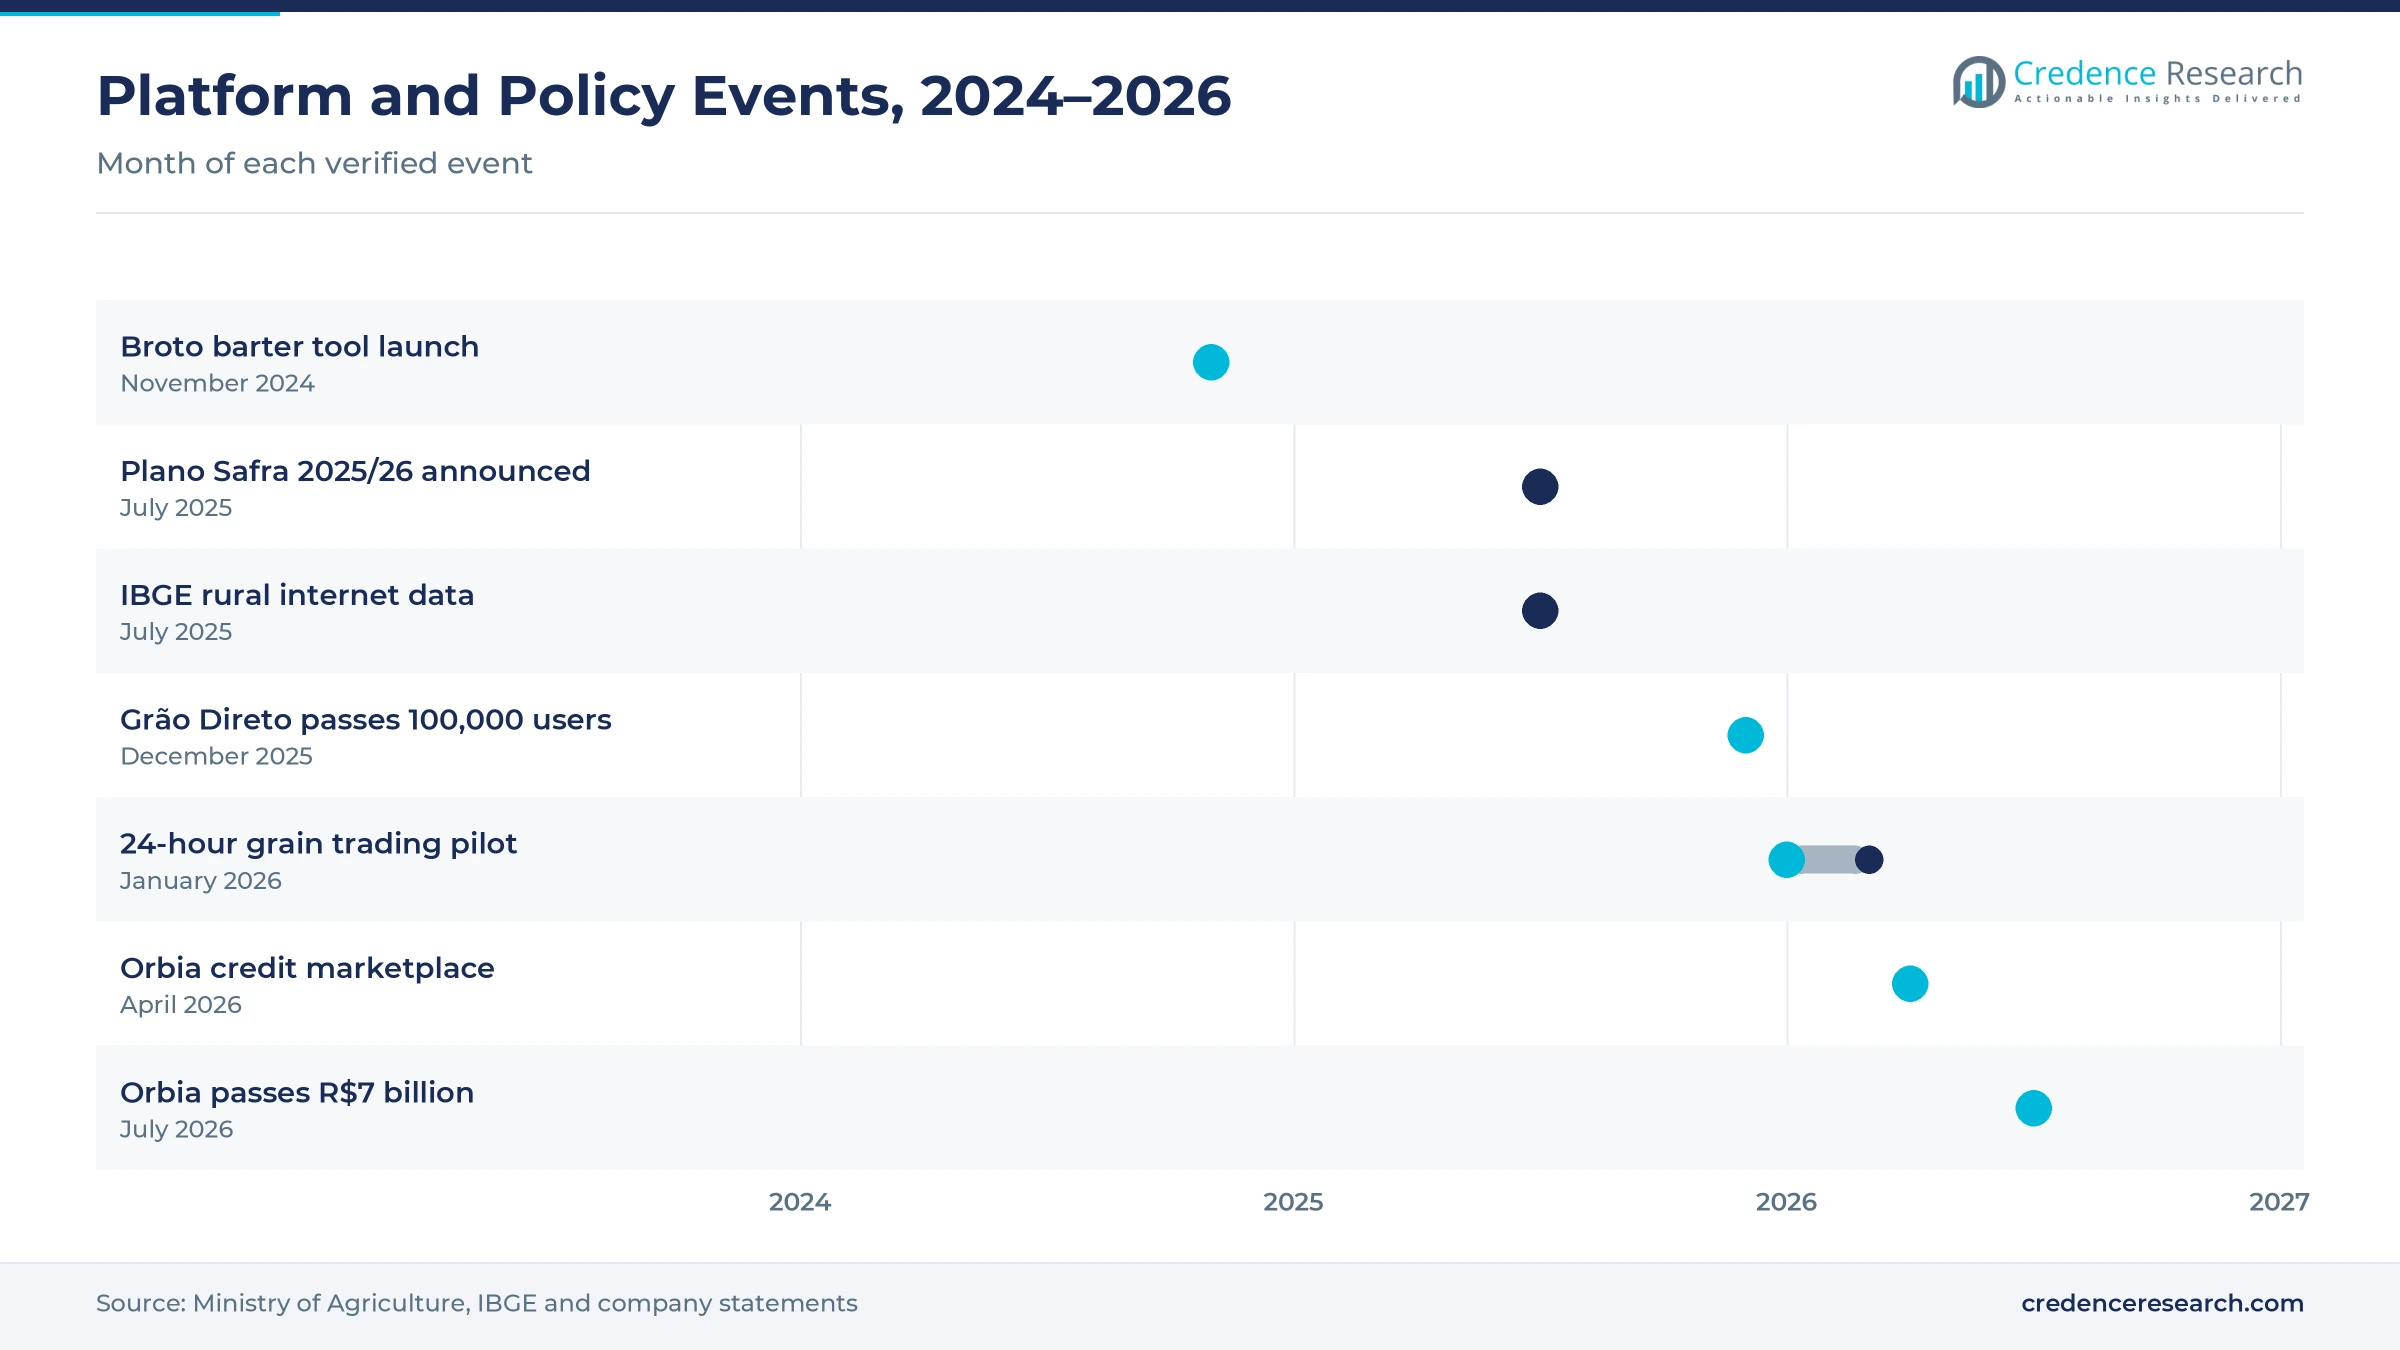
Digital payments, credit and policy formalization support the market, because platforms can now bundle finance with each input order. The stock of rural product notes reached R$479.77 billion in January 2025, up 55% in a year, according to the Ministry of Agriculture. The number of registered contracts rose to 349,000 from 218,000 a year earlier. Registration of notes worth R$50,000 or more became mandatory on Jan. 1, 2023 under CMN Resolution 4927. Orbia said about 90% of its input sales come with financing and launched a credit marketplace in April 2026. In turn, platforms add embedded finance tools that earn referral fees alongside commissions.
Does the scale of farm output support growth?
The sheer scale of Brazilian farm output supports platform growth, because larger harvests create more input orders and grain sales to intermediate. The government announced R$516.2 billion in rural credit for the 2025/26 Plano Safra on July 1, 2025. Conab estimated the 2024/25 grain crop at 322.25 million metric tons, up 8.1% from the previous season. World Bank data show that agriculture, forestry and fishing added 6.1% of GDP in 2025, and food made up 40.7% of merchandise exports. Consequently, grains and oilseeds held 54.0% of 2025 value, as soybean and corn growers use platforms for both procurement and crop marketing.
Barter, round-the-clock trading and logistics expand
Why is digital barter rising on platforms?
Digital barter is rising, because producers want to pay for inputs with future grain instead of cash before planting. Broto launched a barter tool in November 2024 that tokenizes soybeans, corn and coffee, according to AgFeed. The transactions are backed by Banco do Brasil credit lines and rural product notes, which shift credit risk away from input sellers. Ten companies had signed barter contracts by March 2025, and 30 more were in negotiation. Grão Direto added barter for inputs and machinery in late 2024. As a result, sellers of crop protection chemicals reach farmers who would otherwise wait for harvest.
How is round-the-clock grain trading emerging?
Round-the-clock grain trading is emerging, because producers want to react to prices and exchange rates outside banking hours. Grão Direto began a pilot in January 2026 that extends price viewing and deal closing from a 10:30 to 15:30 window to 24 hours on weekdays, according to The AgriBiz. The pilot started with about 5,000 clients and was planned for the full user base by the end of March 2026. ADM do Brasil was the first major trader to join, and the platform passed 100,000 users in December 2025. The company targets 18 million to 20 million metric tons in 2026. Therefore, commodity trading platforms grow at 19.53% a year, the fastest solution type in the market.
Can logistics and fulfillment services open new revenue?
Logistics and fulfillment coordination is an opening, because many input makers cannot serve small orders through their own distribution. Orbia said in July 2026 that it is starting a logistics operation in São Paulo and Mato Grosso, with Toniato as a partner, so manufacturers can sell smaller volumes directly. Products will be held in general warehouses, while the platform handles purchase, resale, invoicing and delivery. In April 2026, Orbia also structured a credit marketplace, and its relaunched affiliate program has 35 independent sales representatives. In addition, about 100 sellers offer products for soy, corn, sugarcane, coffee and winter cereals on the platform. These services link farm management software data to orders, which raises fees per farmer.
Will smaller farms become the next growth market?
Small and family farms are a large opening, because most of them still buy inputs through local stores and traders. Broto said in March 2025 that about 70% of producers use digital tools, but only 11% buy on its platform. The company expects at least 16% of transactions to be digital by 2028. Orbia estimated in 2023 that at least 650,000 Brazilian producers use digital technology, more than double its active base at that time. Meanwhile, rural internet access reached 84.8% of households in 2024. As a result, small and family farms grow at 19.85% a year, the fastest customer group in the market.
Trust, coverage and credit risk slow digital sales
Why does trust still limit online purchases?
Trust remains a barrier, because many farmers have long relationships with local dealers who offer credit, advice and fast delivery. Producers worry about product authenticity, delivery delays and after-sales support when they buy from unknown sellers online. As a result, platforms must invest in seller vetting, guarantees and field teams, which raises customer acquisition costs. Ratings, verified distributors and hybrid sales models are the main ways to close this gap.
How do coverage gaps affect remote producers?
Coverage gaps still affect remote producers, because rural household internet access trails urban access by about 10 percentage points. Many farms in the North and Northeast depend on weak mobile signals or satellite links in parts of the property. Consequently, apps must work offline or through WhatsApp, which limits complex functions such as live trading. Lighter apps and assisted sales by agents help platforms serve these farmers.
Why does credit risk weigh on platform growth?
Credit risk weighs on growth, because most input orders come with financing that depends on weather and crop prices. High interest rates in 2025 raised the cost of rural loans and made some producers delay purchases. Therefore, platforms that carry receivables or guarantee barter deals face losses when harvests fail. Partnerships with banks and the use of registered rural product notes help spread this risk.
Do commissions squeeze margins for sellers?
Commission levels can squeeze margins, because input distributors already operate on thin spreads and volatile prices. Sellers may keep their best prices for direct channels, which weakens the appeal of the platform for buyers. In turn, platforms must prove that they bring new customers rather than shifting existing ones. Clear fee structures, advertising tools and data services help balance the interests of sellers and farmers.
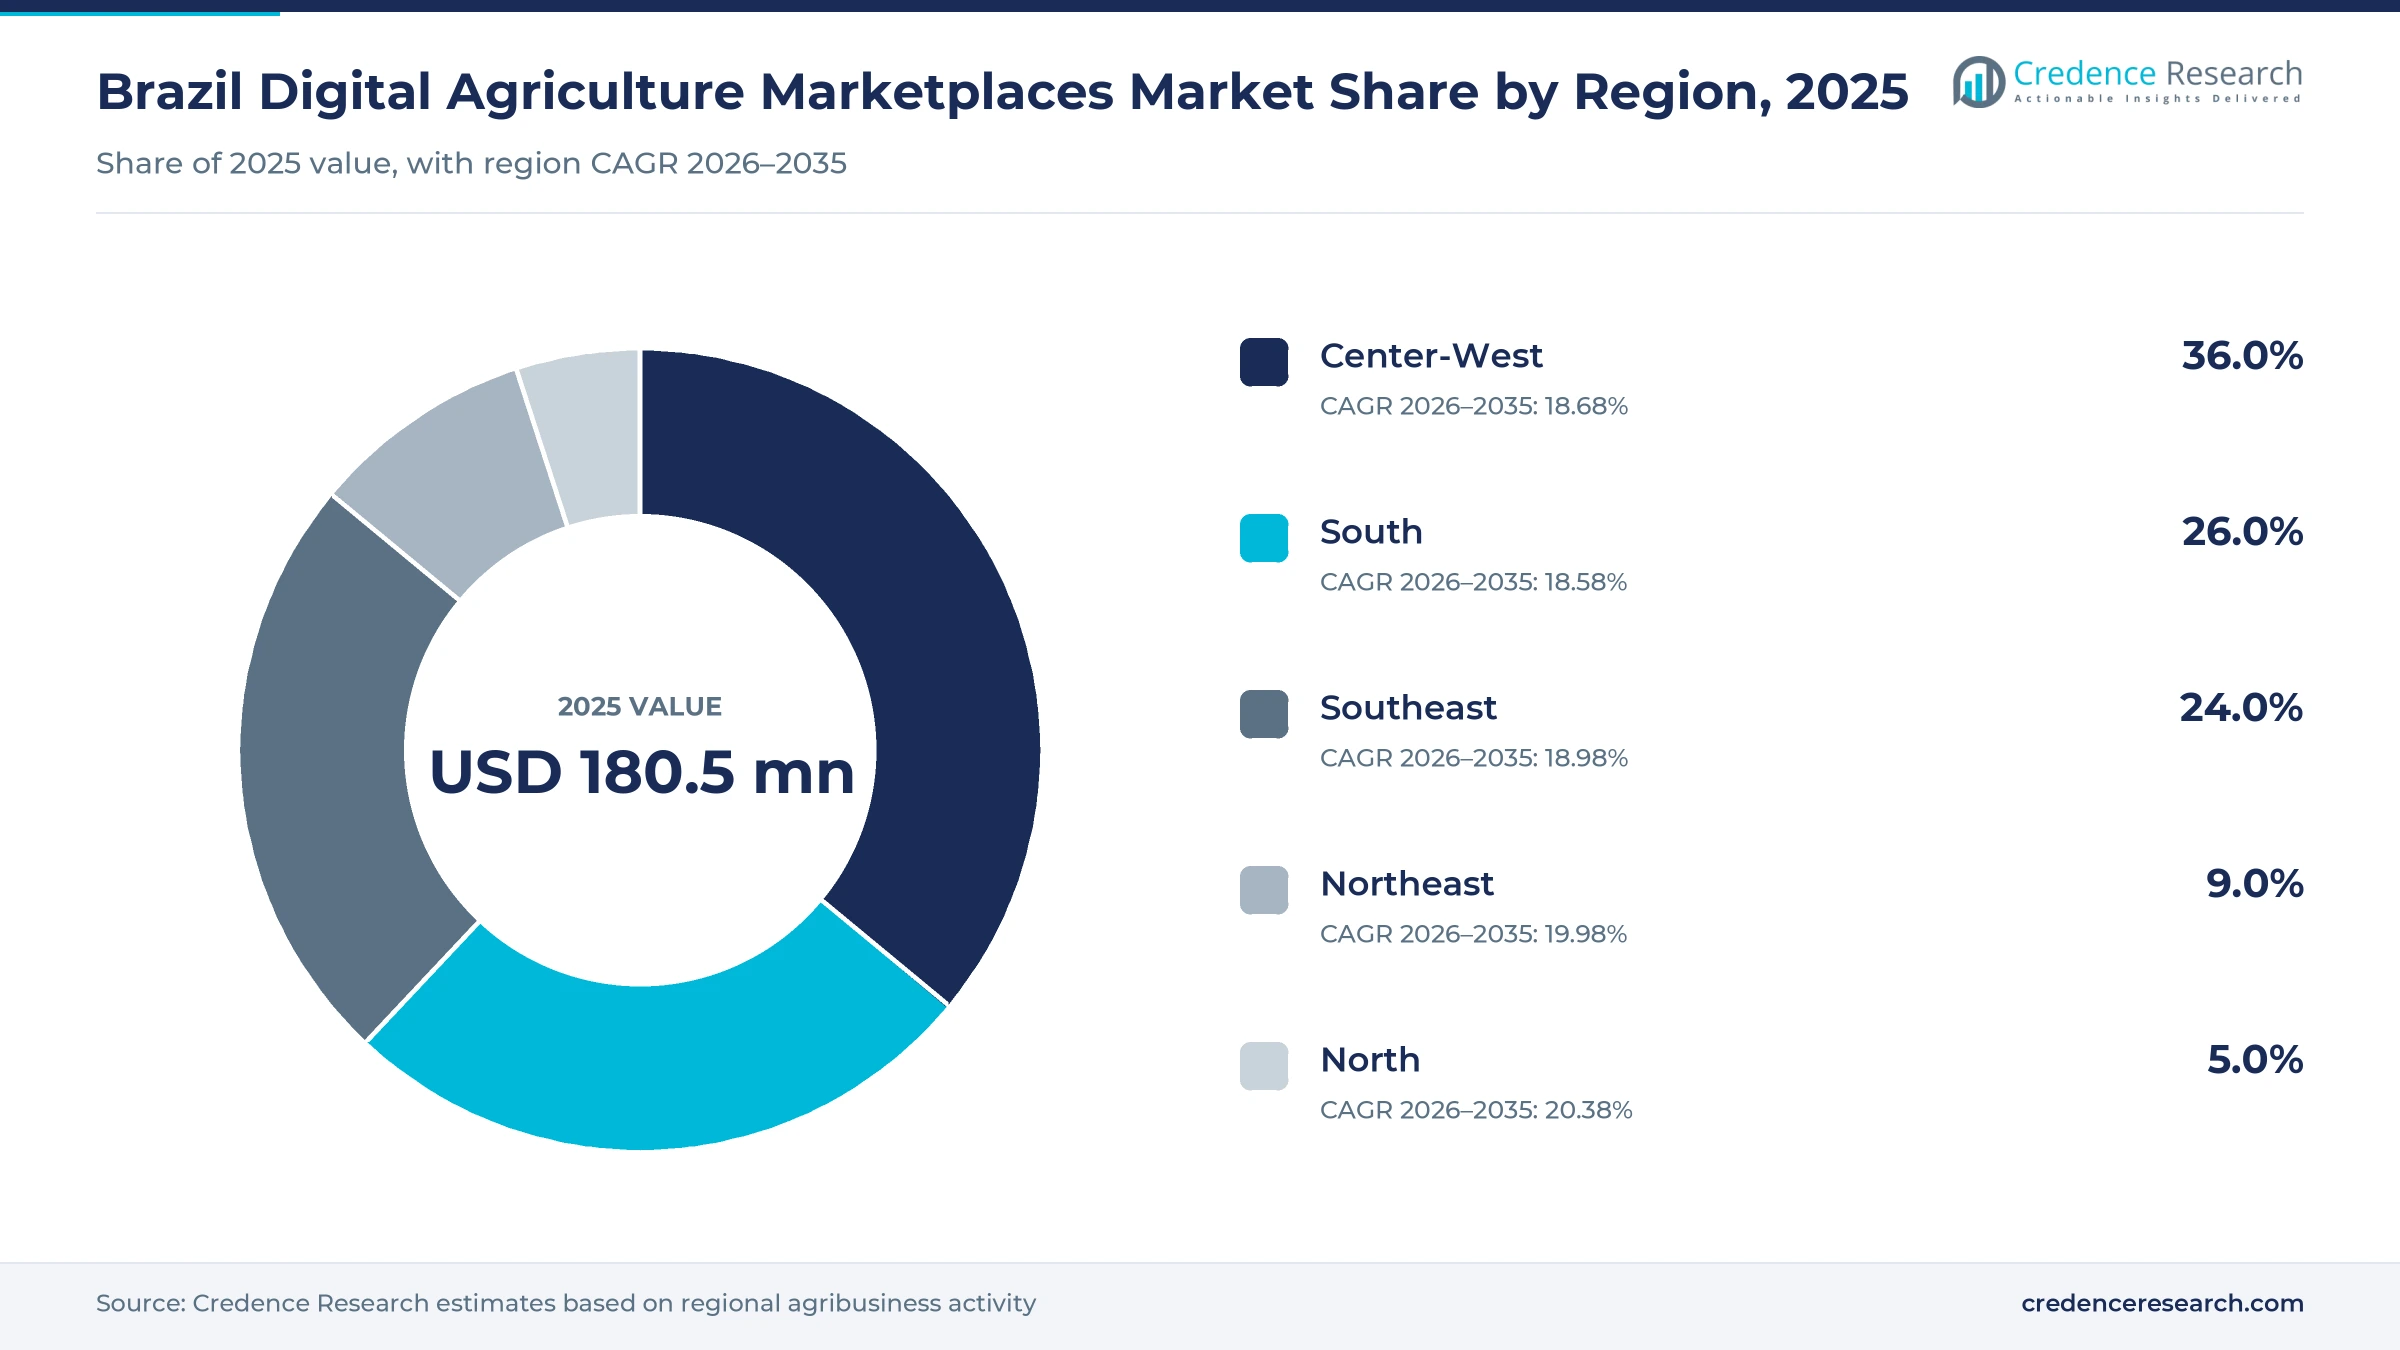
Center-West grain belt holds the largest share
| Region | Value, 2025 (USD million) | Share, 2025 | CAGR, 2026–2035 |
|---|---|---|---|
| Center-West | 65.0 | 36.0% | 18.68% |
| South | 46.9 | 26.0% | 18.58% |
| Southeast | 43.3 | 24.0% | 18.98% |
| Northeast | 16.2 | 9.0% | 19.98% |
| North | 9.0 | 5.0% | 20.38% |
Why does the Center-West lead platform revenue?
Center-West held 36.0% of 2025 value and grows at 18.68% a year. Mato Grosso, Goiás and Mato Grosso do Sul hold large soybean, corn and cotton farms that buy inputs in volume and sell grain to traders. The region was expected to be the only one to accelerate economic growth in 2025, mainly because of agriculture. Orbia is also starting a logistics operation in Mato Grosso, which brings direct input deliveries closer to farmers.
How does the South use agriculture marketplaces?
South held 26.0% of 2025 value and grows at 18.58% a year. Paraná, Santa Catarina and Rio Grande do Sul combine grain farms with strong cooperatives, poultry and pork integrators and dairy producers. Many cooperatives already run their own digital ordering tools, which creates competition for independent platforms. Therefore, marketplaces in the South grow mainly through partnerships with cooperatives and through services for mid-sized family farms.
What drives demand in the Southeast?
Southeast held 24.0% of 2025 value and grows at 18.98% a year. São Paulo and Minas Gerais combine sugarcane, coffee, citrus and grain farms with the headquarters of many input makers and banks. Grão Direto was founded in Uberaba, Minas Gerais in 2018, and Orbia is starting a logistics operation in São Paulo. As a result, the region hosts much of the platform industry as well as many of its customers.
Why is the Northeast growing quickly?
Northeast held 9.0% of 2025 value and grows at 19.98% a year. Grain farms in western Bahia and the Matopiba frontier buy large volumes of inputs, while fruit growers in irrigated valleys need specialized supplies. Rural connectivity is improving from a lower base, which lets more producers use mobile apps for purchases and sales. Consequently, the Northeast gains share of national platform revenue steadily through 2035.
How fast is the North adopting digital trade?
North held 5.0% of 2025 value and grows at 20.38% a year, the fastest of the five regions. Soybean, corn and cattle production is expanding in Pará, Tocantins and Rondônia, where farms are far from traditional dealers. Platforms that offer remote buying, credit and delivery fill this gap, although weak coverage still limits some functions.
Platform launches and credit tools from 2024 to 2026
| Development | Status and market relevance |
|---|---|
| In November 2024, Broto launched a barter tool that tokenizes soybeans, corn and coffee, backed by Banco do Brasil credit lines. | Ten companies had signed barter contracts by March 2025 |
| In July 2025, the federal government announced R$516.2 billion in rural credit for the 2025/26 Plano Safra. | Supports input purchases and crop marketing financed through platforms |
| In January 2026, Grão Direto began a pilot of 24-hour weekday grain trading with about 5,000 clients. | ADM do Brasil was the first major trader to join |
| In April 2026, Orbia structured a credit marketplace linked to its input platform. | About 90% of its input sales come with a financing solution |
| In July 2026, Orbia reported more than R$7 billion in cumulative transactions and about 290,000 registered producers. | Plans logistics operations in São Paulo and Mato Grosso |
Tokenized barter and mobile trading reshape deals
- Tokenized barter turns future soybean, corn and coffee volumes into digital tokens, which lets farmers pay for inputs with crops at a fixed exchange rate.
- Mobile price discovery shows live bids from traders on smartphones, which helps producers decide when to sell outside office hours.
- Embedded credit scoring uses purchase history and registered rural product notes to approve financing at checkout, which shortens the sales cycle.
- Logistics orchestration links orders to warehouses and carriers, which allows manufacturers to serve small orders without their own distribution.
Need a Custom Version of This Report?
Tailor the scope, geography, or segments to your exact requirements.
- Custom geography or segment scope
- Direct access to our analyst team
Input makers, banks and agtechs compete for farmers
Competition combines platforms backed by input makers, banks and traders with independent agtechs and classified sites. Orbia, owned by Bayer, Bravium, Itaú BBA and Yara, focuses on inputs, loyalty and credit. Broto, owned by Banco do Brasil and Brasilseg, links its marketplace with bank credit, insurance and barter. Grão Direto specializes in grain origination and counts ADM do Brasil as a minority investor. Agrofy and MF Rural compete in machinery, vehicles and classified listings, and the companies list also includes eBarn, Villa Verde Agro, Rural Deals, Mercadão do Agro and ANBrazil. Platforms compete on the number of active farmers, the depth of seller catalogs, the quality of credit offers and the ability to handle delivery.
Companies profiled and their roles in this market
| Company | Type | Role in the market |
|---|---|---|
| Orbia | Input and credit marketplace | About 290,000 registered producers and more than R$7 billion in cumulative transactions |
| Broto | Bank-backed marketplace | Banco do Brasil platform with about 250,000 producers and a barter tool launched in November 2024 |
| Grão Direto | Grain trading platform | Traded 12 million metric tons in 2025 and runs a 24-hour trading pilot |
| MF Rural | Classified marketplace | Agricultural portal created in 2004 with 28 listing categories |
| Agrofy | Multi-category marketplace | Machinery, vehicles and input listings with digital stores in Brazil |
Credence Research view on platform growth
Credence Research's view is that Brazilian farm platforms will grow mainly by attaching credit and logistics to each sale. Connectivity and smartphone use already reach most producers, so the main barrier is now trust and the quality of financing offers. Platforms backed by banks and input makers hold an advantage in credit, while specialists such as Grão Direto lead in grain origination. Over the forecast period, the companies that combine barter, payments and delivery will capture the largest share of farmer spending moved online.
Platform take rates and farm data behind the estimate
The report uses 2025 as the base year on a calendar basis, with values in USD million at current prices. Market values come from the Credence Research model, which links platform transaction volumes, take rates and fee types to farm input and grain markets. Regional and segment splits are Credence Research estimates; the client did not supply regional shares, so they were built from grain output and agribusiness activity by macro-region. Sources used are Ministry of Agriculture bulletins, IBGE and World Bank data, Conab estimates and company statements reported in trade media, and no interviews or surveys were used.
Credit-linked commerce shapes growth to 2035
Revenue is expected to reach USD 1.06 billion by 2035, an 18.94% CAGR during 2026–2035, as more input purchases, grain sales and credit move online. In the Brazil digital agriculture marketplaces market, omnichannel integrated platforms grow at 19.78% a year as apps join field sales teams. Growth should be strongest in the late 2020s, when barter, round-the-clock trading and embedded credit scale across the grain belt. After that, small and family farms in the North and Northeast will add new users as connectivity improves. Credit cycles and crop prices may slow some years, but the shift to digital channels keeps the long-term outlook positive.
Frequently Asked Questions
How big is the Brazil digital agriculture marketplaces market?
Which region leads platform revenue in Brazil?
Which solution type holds the largest share?
How much grain does Grão Direto trade?
How do rural product notes support the market?
How many rural households have internet access?
Which companies compete in this market?
Which region grows fastest through 2035?
Table of Content
Chapter 1 Market Segmentation
- 1.1 Segmentation Framework
- 1.1.1 Product and Service Classification
- 1.1.2 Application and End-Use Classification
- 1.1.3 Technology and Solution Classification
- 1.1.4 Customer and Distribution Channel Classification
- 1.1.5 Geographic Segmentation
- 1.1.6 Market Segment Definitions and Boundaries
- 1.2 By Solution Type
- 1.2.1 Input Marketplaces
- 1.2.2 Commodity Trading Platforms
- 1.2.3 Machinery and Equipment Marketplaces
- 1.2.4 Multi-category Agro Marketplaces
- 1.3 By Deployment Model
- 1.3.1 Mobile App-first Platforms
- 1.3.2 Web-first Platforms
- 1.3.3 WhatsApp-assisted Commerce
- 1.3.4 Omnichannel Integrated Platforms
- 1.4 By End-Use Industry
- 1.4.1 Grains and Oilseeds
- 1.4.2 Coffee and Horticulture
- 1.4.3 Sugarcane and Bioenergy
- 1.4.4 Livestock and Dairy
- 1.5 By Customer Type
- 1.5.1 Large Commercial Farms
- 1.5.2 Mid-sized Producers
- 1.5.3 Agribusiness Buyers and Distributors
- 1.5.4 Small and Family Farms
- 1.5.5 Cooperatives and Producer Groups
Chapter 2 Introduction
- 2.1 Report Objectives and Scope
- 2.2 Product Definition and Industry Terminology
- 2.3 Market Inclusions and Exclusions
- 2.4 Research Process
- 2.4.1 Primary Research and Expert Interviews
- 2.4.2 Secondary Research and Source Review
- 2.4.3 Top-Down and Bottom-Up Estimation
- 2.4.4 Data Triangulation and Verification
- 2.5 Market Size Measurement Basis
- 2.5.1 2025: USD 180.5 million → 2035: USD 1.06 billion
- 2.6 Historical and Forecast Reference Periods
- 2.6.1 Historical Period: 2018-2025
- 2.6.2 Base Year: 2025
- 2.6.3 Forecast Period: 2025-2035
- 2.7 Research Assumptions and Limitations
Chapter 3 Executive Summary
- 3.1 Market Snapshot and Key Findings
- 3.2 Base-Year Market Size, 2025
- 3.3 Forecast Market Size, 2035
- 3.4 Revenue and Volume Growth Outlook
- 3.5 Key Demand and Supply Indicators
- 3.6 Leading Market Segments
- 3.7 Fastest-Growing Market Opportunities
- 3.8 Regional Performance Highlights
- 3.9 Technology and Industry Transformation
- 3.10 Competitive Landscape Summary
- 3.11 Analyst View and Strategic Implications
Chapter 4 Brazil Digital Agriculture Marketplaces Market Trends and Developments
- 4.1 Historical Industry Development, 2018-2025
- 4.2 Recent Market Trends and Developments
- 4.3 Demand and Customer Behavior Trends
- 4.4 Technology and Product Innovation
- 4.5 Artificial Intelligence, Automation and Digitalization
- 4.6 Local Manufacturing and Supply Chain Realignment
- 4.7 Industry Partnerships, Mergers and Acquisitions
- 4.8 Sustainability and Circular Economy Developments
- 4.9 Government and Private Sector Investment Trends
- 4.10 Emerging Business Models and Commercialization
- 4.11 Industry Developments and Announcements
Chapter 5 Brazil Digital Agriculture Marketplaces Market Production, Supply and Demand Analysis
- 5.1 Demand Trend and Consumption Analysis, 2018-2025
- 5.2 Demand Forecast, 2025-2035
- 5.3 Production and Output Trend, 2018-2025
- 5.4 Production and Output Forecast, 2025-2035
- 5.5 Installed Capacity and Capacity Utilization
- 5.6 Company-Wise Production Plants and Statistics
- 5.6.1 Installed Production Capacity
- 5.6.2 Actual Production
- 5.6.3 Planned Capacity and Expansion Targets
- 5.7 Supply Chain Structure and Procurement Trends
- 5.8 Supply-Demand Gap and Bottlenecks
- 5.9 Import Dependence and Sourcing Structure
- 5.10 Contract Manufacturing and Outsourcing
- 5.11 Regional Supply and Demand Concentration
Chapter 6 Brazil Digital Agriculture Marketplaces Market Pricing Analysis
- 6.1 Pricing Structure and Measurement
- 6.2 Historical Pricing Trends, 2018-2025
- 6.3 Pricing Outlook, 2025-2035
- 6.4 Average Selling Price and Unit Economics
- 6.5 Pricing by Product and Market Segment
- 6.6 Geographic Pricing Differences
- 6.7 Key Input, Energy, Labor and Logistics Costs
- 6.8 Contract Pricing and Purchasing Models
- 6.9 Pricing Sensitivity and Competitive Positioning
- 6.10 Price, Margin and Profitability Implications
Chapter 7 Brazil Digital Agriculture Marketplaces Market Dynamics
- 7.1 Market Growth Drivers
- 7.1.1 Demand-Side Drivers
- 7.1.2 Technology and Innovation Drivers
- 7.1.3 Infrastructure and Investment Drivers
- 7.1.4 Regulatory and Policy Drivers
- 7.2 Market Restraints
- 7.2.1 Cost and Affordability Constraints
- 7.2.2 Technology and Adoption Barriers
- 7.2.3 Supply Chain and Operational Constraints
- 7.3 Market Challenges
- 7.3.1 Competitive Pressure and Margin Erosion
- 7.3.2 Skills, Infrastructure and Implementation Gaps
- 7.4 Emerging Market Opportunities
- 7.5 Market Dynamics Impact and Time-Horizon Assessment
Chapter 8 Brazil Digital Agriculture Marketplaces Value Chain Analysis
- 8.1 Industry Value Chain Overview
- 8.2 Upstream Suppliers and Critical Inputs
- 8.3 Technology and Component Providers
- 8.4 Manufacturing or Service Delivery
- 8.5 Distribution, Channel Partners and Integrators
- 8.6 Downstream Applications and End Users
- 8.7 Value Addition and Profit Pools
- 8.8 Vertical Integration and Outsourcing
- 8.9 Supplier Concentration and Risk
- 8.10 Supply Chain Localization and Resilience
Chapter 9 Brazil Digital Agriculture Marketplaces Market Regulations and Policies
- 9.1 Relevant Laws, Standards and Compliance Frameworks
- 9.2 Product, Service, Safety and Quality Requirements
- 9.3 Government Policies, Incentives and Subsidies
- 9.4 Imports, Exports and Trade Barriers
- 9.5 Public Procurement and Local Content Requirements
- 9.6 Environmental and Sustainability Compliance
- 9.7 Upcoming Policy Changes and Market Implications
Chapter 10 Brazil Digital Agriculture Marketplaces Market Hotspots and Opportunities
- 10.1 Market Opportunity Mapping and Growth Hotspots
- 10.2 High-Growth Applications and Customer Groups
- 10.3 Underserved Markets and White-Space Opportunities
- 10.4 Emerging Technology and Product Opportunities
- 10.5 New Capacity and Investment Hotspots
- 10.6 Market Entry and Expansion Opportunities
- 10.7 Distribution and Partnership Opportunities
- 10.8 Near-Term and Long-Term Commercial Potential
- 10.9 Opportunity Attractiveness and Execution Risks
Chapter 11 Brazil Digital Agriculture Marketplaces Market Outlook, 2025-2035
- 11.1 Market Size and Analysis
- 11.1.1 Revenue (Market Measurement: 2025: USD 180.5 million → 2035: USD 1.06 billion)
- 11.1.2 Market Volume and Quantity Sold
- 11.1.3 Historical Market Size, 2018-2025
- 11.1.4 Base-Year Market Size, 2025
- 11.2 Market Forecast, 2025-2035
- 11.2.1 Revenue Forecast to 2035
- 11.2.2 Volume Forecast to 2035
- 11.2.3 CAGR and Year-on-Year Growth
- 11.2.4 Incremental Revenue Opportunity
- 11.3 Forecast Assumptions and Scenario Analysis
- 11.3.1 Base-Case Forecast
- 11.3.2 Optimistic and Conservative Scenarios
- 11.3.3 Technology, Pricing and Policy Sensitivities
- 11.4 Market Attractiveness and Growth Outlook
Chapter 12 Brazil Digital Agriculture Marketplaces Market Segmentation and Outlook
- 12.1 Segmentation Summary and Market Shares, 2025
- 12.2 Largest and Fastest-Growing Segments
- 12.3 By Solution Type - Market Size and Forecast, 2025-2035
- 12.3.1 Segment Definition and Scope
- 12.3.2 Historical Market Size, 2018-2025
- 12.3.3 Revenue Forecast, 2025-2035
- 12.3.4 Volume Forecast, 2025-2035
- 12.3.5 Base-Year Market Share, 2025
- 12.3.6 Segment CAGR and Growth Drivers
- 12.3.7 Subsegment Market Size and Forecast
- 12.3.7.1 Input Marketplaces
- 12.3.7.2 Commodity Trading Platforms
- 12.3.7.3 Machinery and Equipment Marketplaces
- 12.3.7.4 Multi-category Agro Marketplaces
- 12.3.8 Subsegment Pricing and Adoption Trends
- 12.3.9 Leading Suppliers and Competition
- 12.3.10 Regional Demand and Opportunities
- 12.4 By Deployment Model - Market Size and Forecast, 2025-2035
- 12.4.1 Segment Definition and Scope
- 12.4.2 Historical Market Size, 2018-2025
- 12.4.3 Revenue Forecast, 2025-2035
- 12.4.4 Volume Forecast, 2025-2035
- 12.4.5 Base-Year Market Share, 2025
- 12.4.6 Segment CAGR and Growth Drivers
- 12.4.7 Subsegment Market Size and Forecast
- 12.4.7.1 Mobile App-first Platforms
- 12.4.7.2 Web-first Platforms
- 12.4.7.3 WhatsApp-assisted Commerce
- 12.4.7.4 Omnichannel Integrated Platforms
- 12.4.8 Subsegment Pricing and Adoption Trends
- 12.4.9 Leading Suppliers and Competition
- 12.4.10 Regional Demand and Opportunities
- 12.5 By End-Use Industry - Market Size and Forecast, 2025-2035
- 12.5.1 Segment Definition and Scope
- 12.5.2 Historical Market Size, 2018-2025
- 12.5.3 Revenue Forecast, 2025-2035
- 12.5.4 Volume Forecast, 2025-2035
- 12.5.5 Base-Year Market Share, 2025
- 12.5.6 Segment CAGR and Growth Drivers
- 12.5.7 Subsegment Market Size and Forecast
- 12.5.7.1 Grains and Oilseeds
- 12.5.7.2 Coffee and Horticulture
- 12.5.7.3 Sugarcane and Bioenergy
- 12.5.7.4 Livestock and Dairy
- 12.5.8 Subsegment Pricing and Adoption Trends
- 12.5.9 Leading Suppliers and Competition
- 12.5.10 Regional Demand and Opportunities
- 12.6 By Customer Type - Market Size and Forecast, 2025-2035
- 12.6.1 Segment Definition and Scope
- 12.6.2 Historical Market Size, 2018-2025
- 12.6.3 Revenue Forecast, 2025-2035
- 12.6.4 Volume Forecast, 2025-2035
- 12.6.5 Base-Year Market Share, 2025
- 12.6.6 Segment CAGR and Growth Drivers
- 12.6.7 Subsegment Market Size and Forecast
- 12.6.7.1 Large Commercial Farms
- 12.6.7.2 Mid-sized Producers
- 12.6.7.3 Agribusiness Buyers and Distributors
- 12.6.7.4 Small and Family Farms
- 12.6.7.5 Cooperatives and Producer Groups
- 12.6.8 Subsegment Pricing and Adoption Trends
- 12.6.9 Leading Suppliers and Competition
- 12.6.10 Regional Demand and Opportunities
- 12.7 Segment Growth Comparison
- 12.8 Segment Attractiveness and Priority Matrix
Chapter 13 Brazil Digital Agriculture Marketplaces End-Use and Application Market Outlook
- 13.1 End-Use Industry and Customer Demand Structure
- 13.2 Leading Applications and Customer Groups
- 13.3 End-Use Market Size, Share and Forecast
- 13.4 Major End-Use Industry Deep Dives
- 13.4.1 Customer Requirements and Use Cases
- 13.4.2 Demand and Replacement Cycles
- 13.4.3 Technical and Regulatory Considerations
- 13.4.4 Purchasing and Procurement Models
- 13.4.5 Leading Vendors and Distribution Channels
- 13.4.6 Forecast and Commercial Opportunities
- 13.5 Emerging Applications and Cross-Segment Demand
- 13.6 End-Use Industry Investment Priorities
Chapter 14 Brazil Digital Agriculture Marketplaces Geographic Market Outlook, 2025-2035
- 14.1 Regional Market Size and Country-Level Shares, 2025
- 14.2 Country Market Size Comparison, 2025
- 14.3 Country Market Forecasts, 2025-2035
- 14.4 Subregional Industrial and Demand Clusters
- 14.5 Intra-Regional Pricing and Cost Differences
- 14.6 Cross-Border Trade and Supply Networks
- 14.7 Regional Supply and Demand Balances
- 14.8 Country Opportunity Comparison and Prioritization
Note: Every listed country is covered on the structure shown under the first country.
Chapter 15 Brazil Digital Agriculture Marketplaces Technology, Innovation and Sustainability Outlook
- 15.1 Technology Landscape and Maturity
- 15.2 Product, Process and Service Innovation
- 15.3 AI, Automation and Digital Tools in the Industry
- 15.4 Technology Adoption and Performance Benchmarking
- 15.5 Innovation Pipeline and R&D Investment
- 15.6 Patent and Intellectual Property Trends
- 15.7 Energy Efficiency and Resource Management
- 15.8 Sustainability, Recycling and Circularity
- 15.9 Technology Roadmap, 2025-2035
- 15.10 Risks of Obsolescence and Technology Substitution
Chapter 16 Brazil Digital Agriculture Marketplaces Market Key Strategic Imperatives
- 16.1 Growth and Market Entry Priorities
- 16.2 High-Return Products and Segments
- 16.3 Pricing, Profitability and Cost Optimization
- 16.4 Technology Investment and Product Differentiation
- 16.5 Supply Chain Localization and Resilience
- 16.6 Distribution and Customer Acquisition
- 16.7 Partnership, Acquisition and Capacity Strategy
- 16.8 Regional Expansion Priorities
- 16.9 Short-, Medium- and Long-Term Actions
Chapter 17 Competition Outlook
- 17.1 Industry Competition Characteristics
- 17.2 Market Structure and Concentration
- 17.3 Market Share and Competitive Positioning, 2025
- 17.4 Company-Wise Revenue and Product Benchmarking
- 17.5 Production and Service Capacity Benchmarking
- 17.6 Technology, Pricing and Differentiation
- 17.7 Regional Footprint and Distribution Strength
- 17.8 Mergers, Acquisitions and Strategic Alliances
- 17.9 New Entrants and Competitive Threats
- 17.10 Porter's Five Forces and Industry Attractiveness
- 17.11 Competitive Outlook, 2025-2035
Chapter 18 Company Profiles
- 18.1 Company Coverage and Selection Criteria
- 18.2 Orbia
- 18.2.1 Business Description
- 18.2.2 Company Ownership and Geographic Presence
- 18.2.3 Product and Service Portfolio
- 18.2.4 Manufacturing and Operating Footprint
- 18.2.5 Production Capacity and Expansion Plans
- 18.2.6 Financial Performance and Investment
- 18.2.7 Market Share and Competitive Position
- 18.2.8 Technology and Innovation Capabilities
- 18.2.9 Strategic Alliances or Partnerships
- 18.2.10 Recent Developments
- 18.2.11 Growth Strategy and Outlook
- 18.3 Broto
- 18.4 Grão Direto
- 18.5 Agrofy
- 18.6 MF Rural
- 18.7 eBarn
- 18.8 Villa Verde Agro
- 18.9 Rural Deals
- 18.10 Mercadão do Agro
- 18.11 ANBrazil
- 18.12 Other Relevant Market Participants
Note: Every listed company is profiled on the structure shown under the first company. The company list is preliminary and may change based on research findings, market developments, data availability and client requirements.
Chapter 19 Disclaimer
- 19.1 Research and Forecast Disclaimer
- 19.2 Data Source and Estimation Limitations
Note: The depth of individual sections depends on data availability for this market. Volume, capacity, trade and other unit-based metrics are included where applicable.

