
Pet ownership and herd protection keep vet demand rising
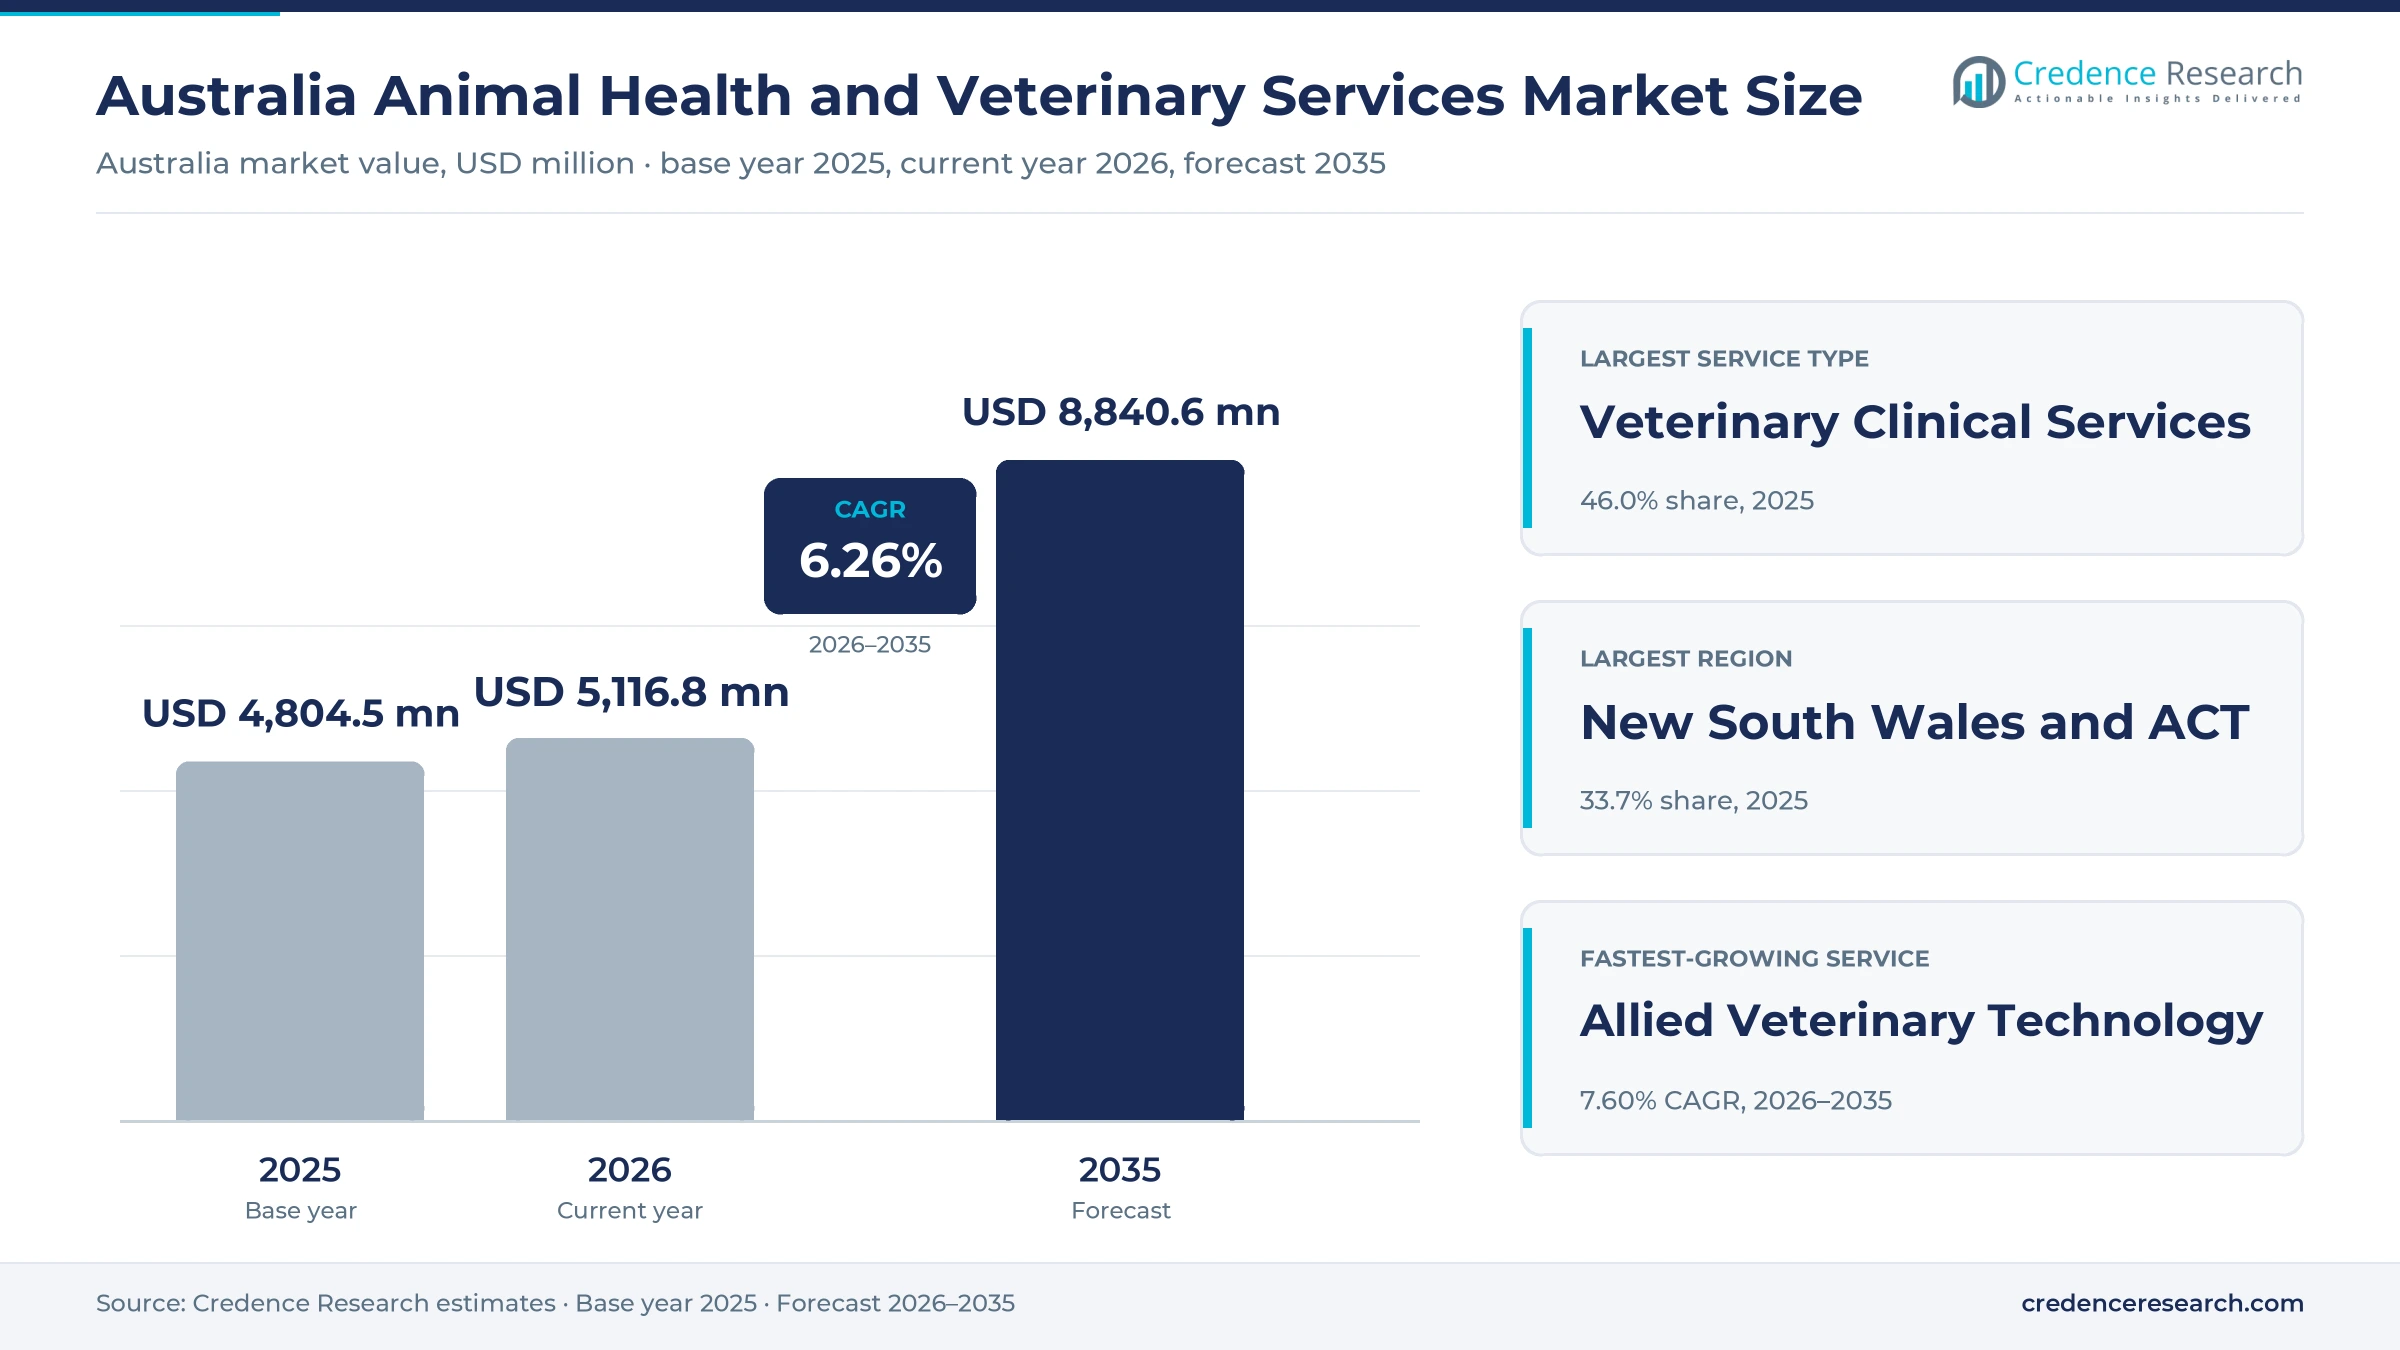
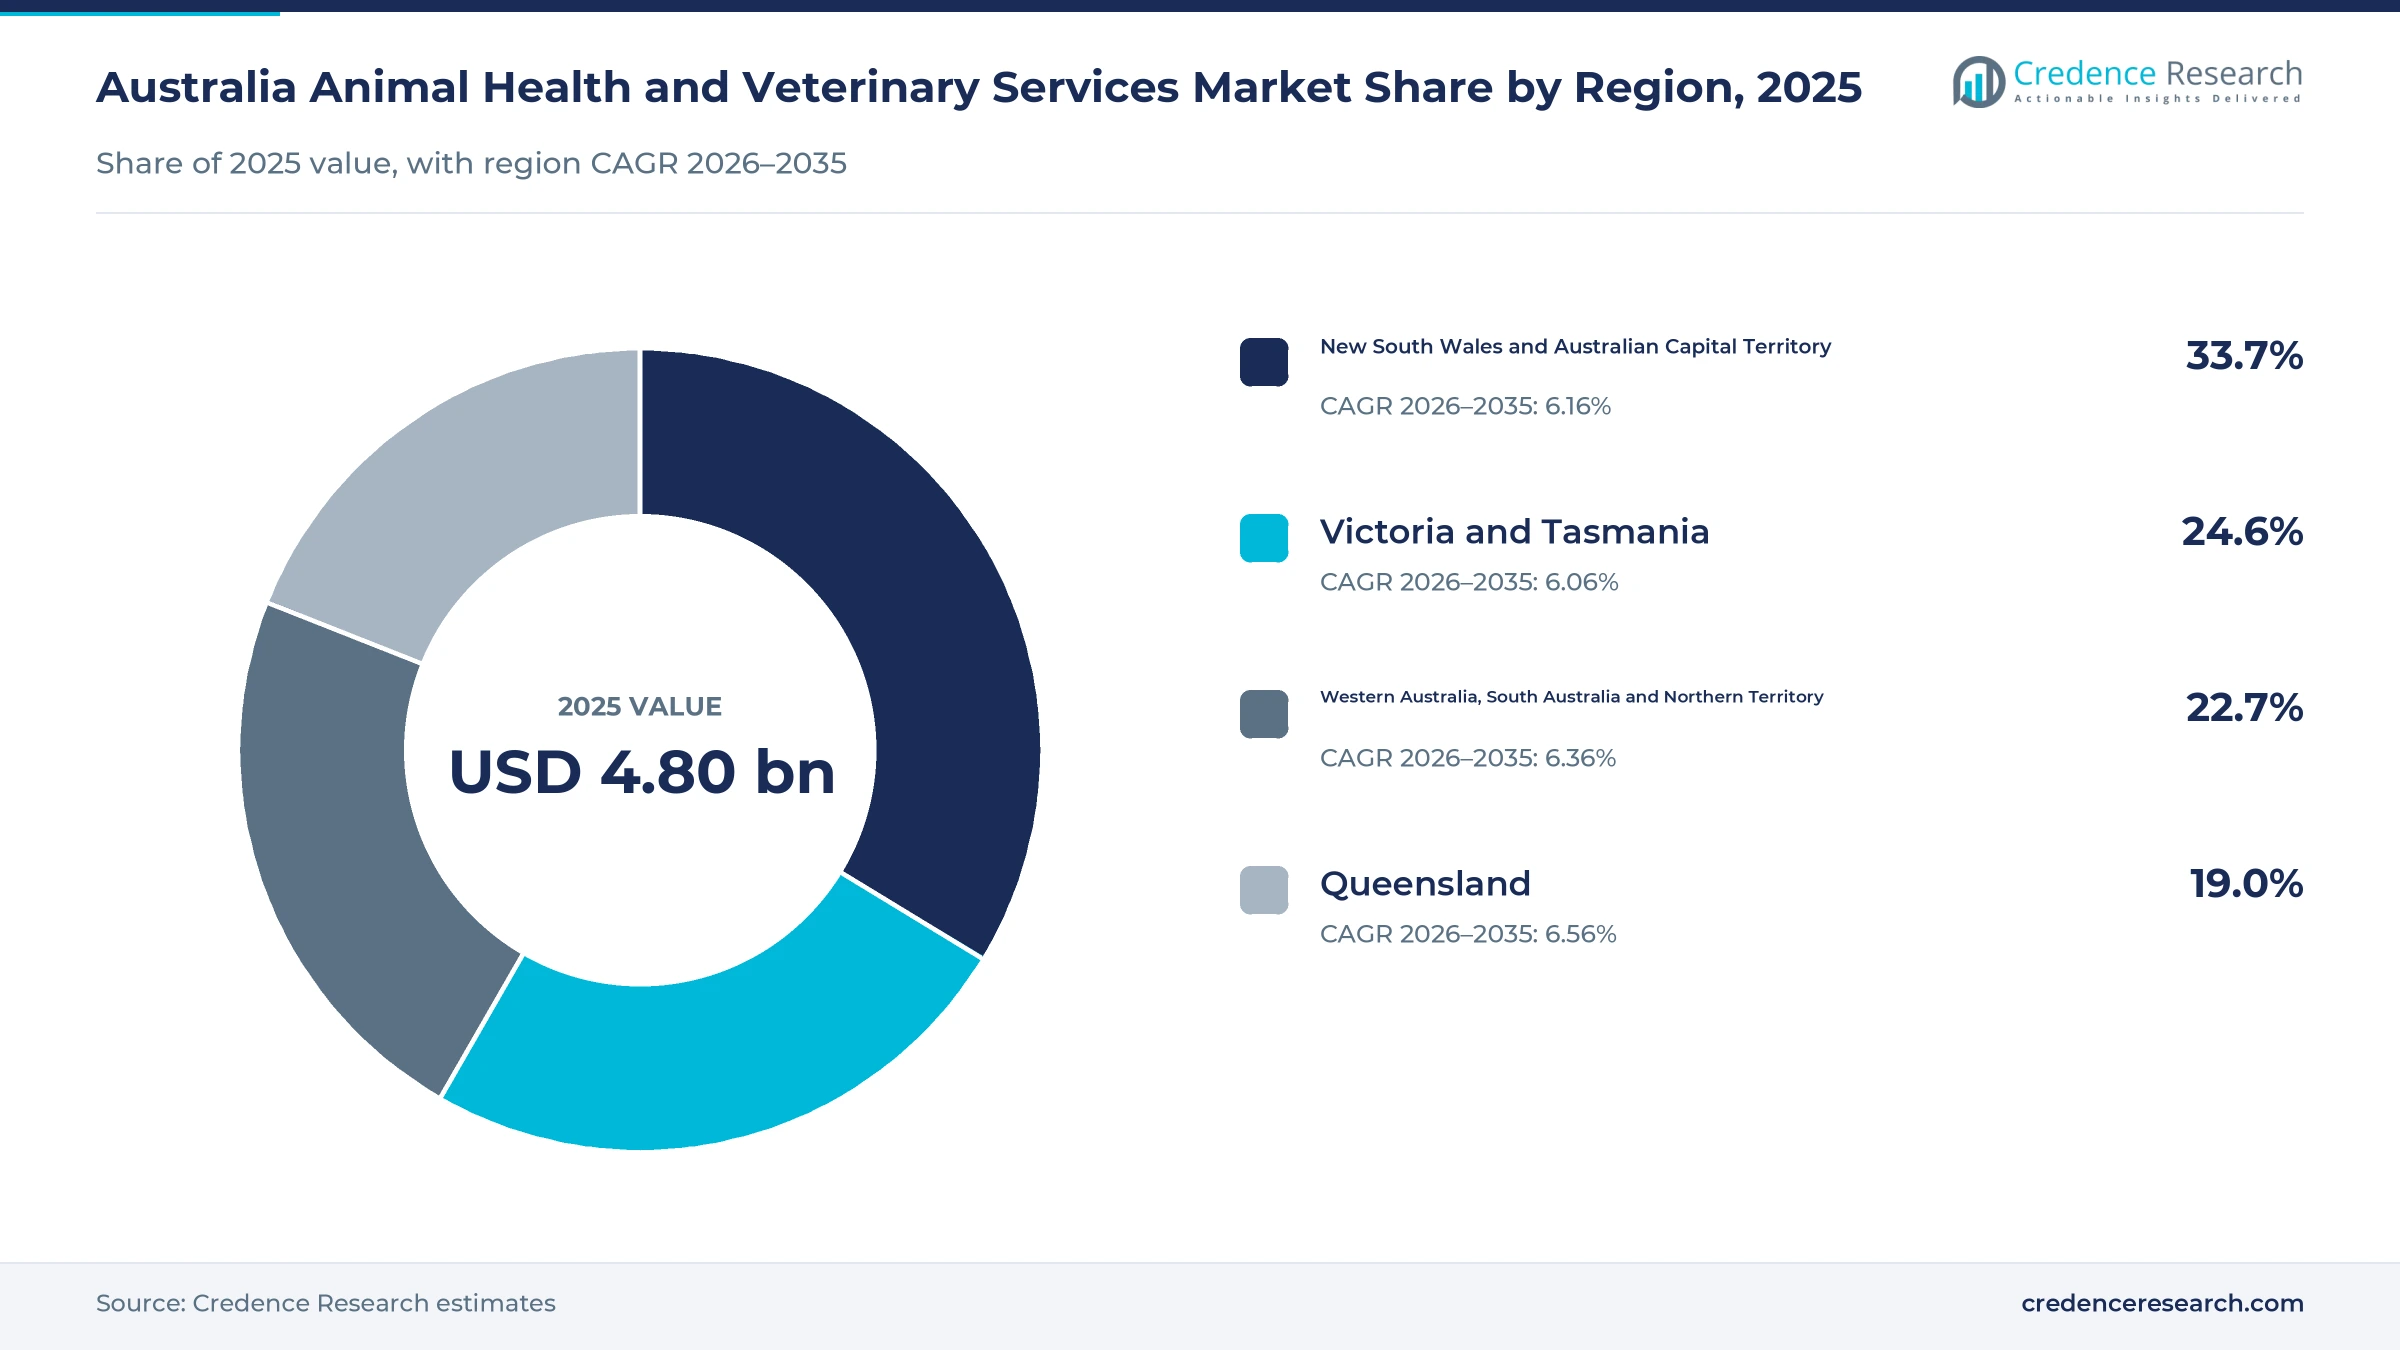
The Australia animal health and veterinary services market was valued at USD 4.80 billion in 2025 and is projected to increase from USD 5.12 billion in 2026 to USD 8.84 billion by 2035, registering a CAGR of 6.26% during 2026–2035. Demand comes from pet owners, cattle and sheep producers, horse owners and veterinary groups that pay for consultations, surgery, vaccines, parasite control, diagnostics and insurance. New South Wales and the Australian Capital Territory held the largest regional share, 33.7% in 2025, because Sydney has the densest network of general practices and specialty hospitals. Queensland is the fastest-growing region at 6.56% a year, as population growth and a large beef herd lift both companion and livestock care. In turn, Zoetis committed A$350 million in May 2024 to expand its Melbourne vaccine and medicine plant, which adds local supply for livestock and pets.
Which animal care services and products are counted in Australia?
The estimate measures spending in Australia on veterinary clinical services, animal health products such as vaccines, parasiticides and medicines, pet insurance premiums and allied veterinary technology such as diagnostics and practice software. It covers companion animal owners, livestock producers, equine owners and veterinary organizations that buy through practices, rural suppliers, pet retailers, pharmacies and direct digital channels. Values are stated in USD million at current prices and exclude goods and services tax.
The estimate excludes pet food, accessories, grooming, boarding and animal feed additives sold without a health claim. The value chain runs from animal medicine makers, diagnostic suppliers and insurers through distributors, rural merchants and clinic groups to pet owners and farmers in every state.
Australia Animal Health and Veterinary Services Market Insights
- The Australia animal health and veterinary services market was valued at USD 4.80 billion in 2025 and is projected to reach USD 8.84 billion by 2035, at a 6.26% CAGR during 2026–2035.
- New South Wales and the Australian Capital Territory held 33.7% of 2025 value, as Sydney has the densest clinic network.
- Veterinary clinical services led service types with 46.0% of 2025 value, because most pet owners take dogs and cats for yearly check-ups.
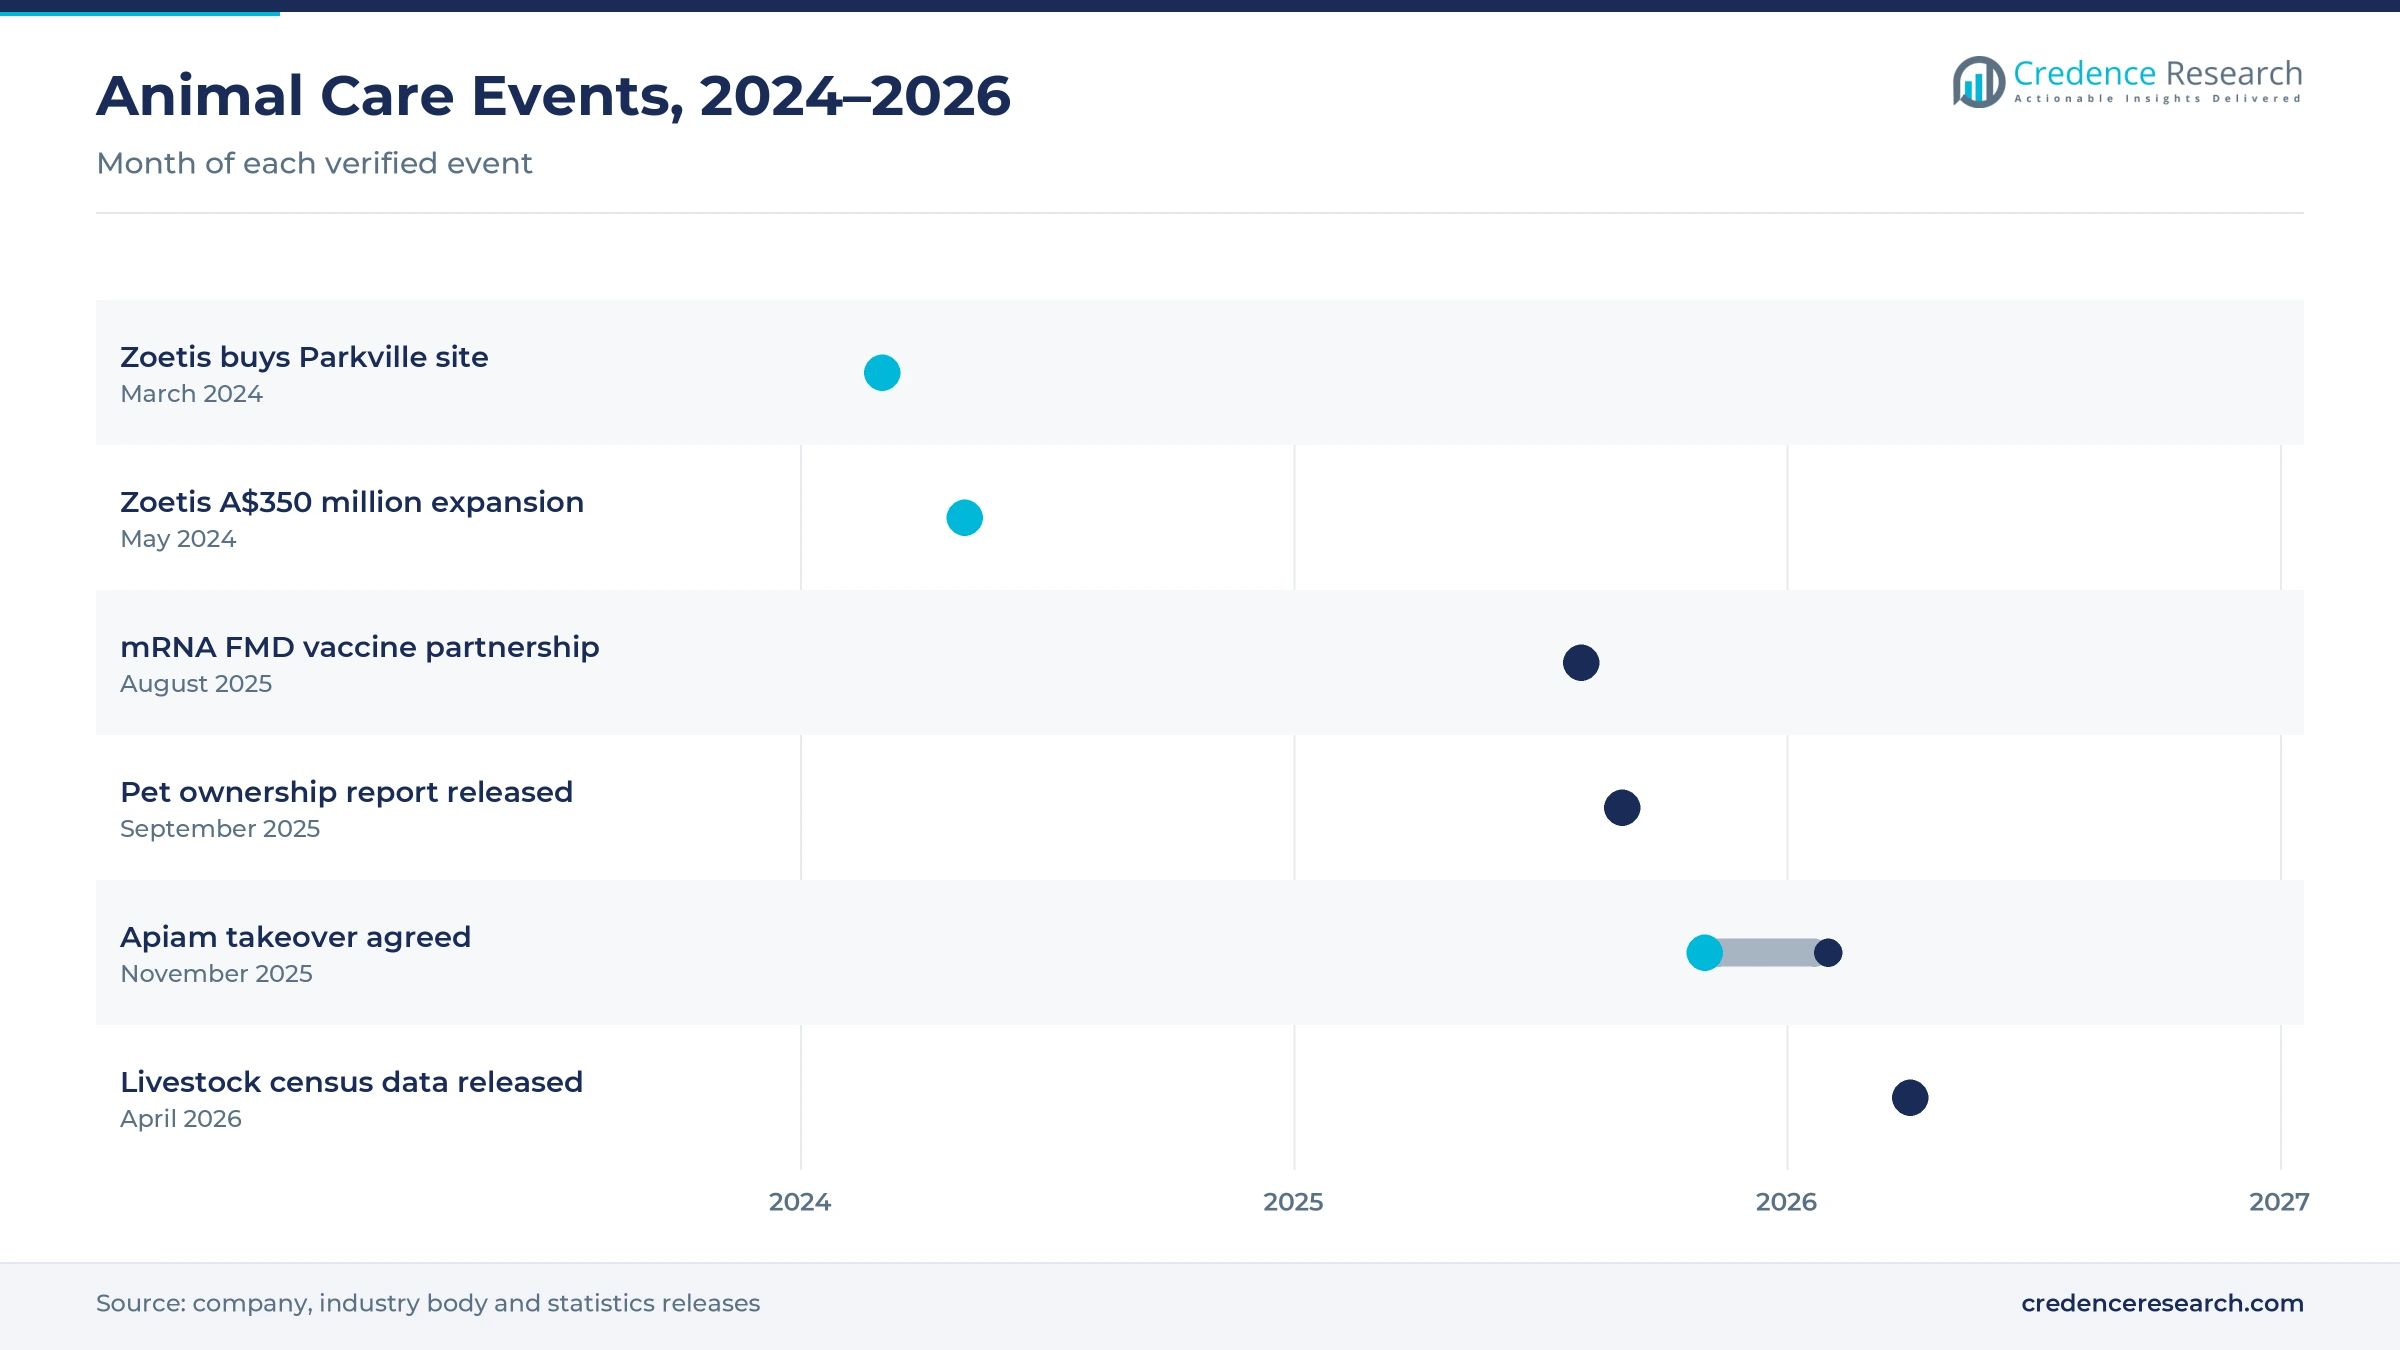
- Zoetis committed A$350 million in May 2024 to expand its Melbourne site, raising its footprint there fivefold and creating 95 jobs.
- Allied veterinary technology grows fastest at 7.60% a year during 2026–2035, as clinics add in-house diagnostics, practice software and telehealth tools.
Clinics lead while allied technology grows fastest
Why do clinical services lead animal care spending?
Based on service type, the market is categorized into veterinary clinical services, animal health products, pet insurance and allied veterinary technology. Veterinary Clinical Services led with 46.0% of 2025 value, because consultations, vaccinations, surgery and dental work happen inside practices. Allied Veterinary Technology grows fastest at 7.60% a year, as clinics invest in diagnostics and software.
Which customers spend the most on animal care?
Based on customer type, the market is categorized into companion animal owners, livestock producers, equine owners and veterinary organizations. Companion Animal Owners led with 68.0% of 2025 value, because 73% of households now own a pet. Companion Animal Owners also grow fastest at 6.51% a year, as owners spend more on preventive and specialty care.
How do owners and farmers use animal care?
Based on application, the market is categorized into preventive health, acute treatment, chronic disease management and care enablement. Preventive Health led with 38.0% of 2025 value, because vaccines, parasite control and check-ups drive most visits. Chronic Disease Management grows fastest at 6.98% a year, as pets live longer with arthritis, kidney disease and skin conditions.
Where do buyers purchase animal care?
Based on channel, the market is categorized into the veterinary practice channel, rural supplier channel, pet retail and pharmacy channel and direct and digital channel. Veterinary Practice Channel led with 52.0% of 2025 value, because prescription medicines and services flow through clinics. Direct and Digital Channel grows fastest at 7.83% a year, as owners order parasite control and insurance online.
| Segment Group | Leading Sub-segment | Share, 2025 | Fastest-growing Sub-segment | CAGR, 2026–2035 |
|---|---|---|---|---|
| By Service Type | Veterinary Clinical Services | 46.0% | Allied Veterinary Technology | 7.60% |
| By Customer Type | Companion Animal Owners | 68.0% | Companion Animal Owners | 6.51% |
| By Application | Preventive Health | 38.0% | Chronic Disease Management | 6.98% |
| By Channel | Veterinary Practice Channel | 52.0% | Direct and Digital Channel | 7.83% |
Request a Free Sample
Fill in your details and we'll send you a free sample report.
- Sample data tables & charts
- Research methodology
Pet care, vaccine plants and clinic networks lift demand
How does recurring companion-animal care lift spending?
Recurring companion-animal care lifts spending, because dogs and cats need yearly check-ups, vaccines and parasite control through long lives. About 73% of households, or 7.7 million homes, owned a pet in 2025, and the national pet population reached 31.6 million, according to the national animal medicines industry body. Owners spent AUD 1.9 billion on veterinary services and AUD 1.0 billion on pet insurance in the same survey. Dog households also rose to 49% in 2025 from 40% in 2019, while 89% of dogs saw a vet in the past year. As a result, companion animal owners lead customer types with 68.0% of 2025 value.
Why does livestock vaccine capacity support growth?
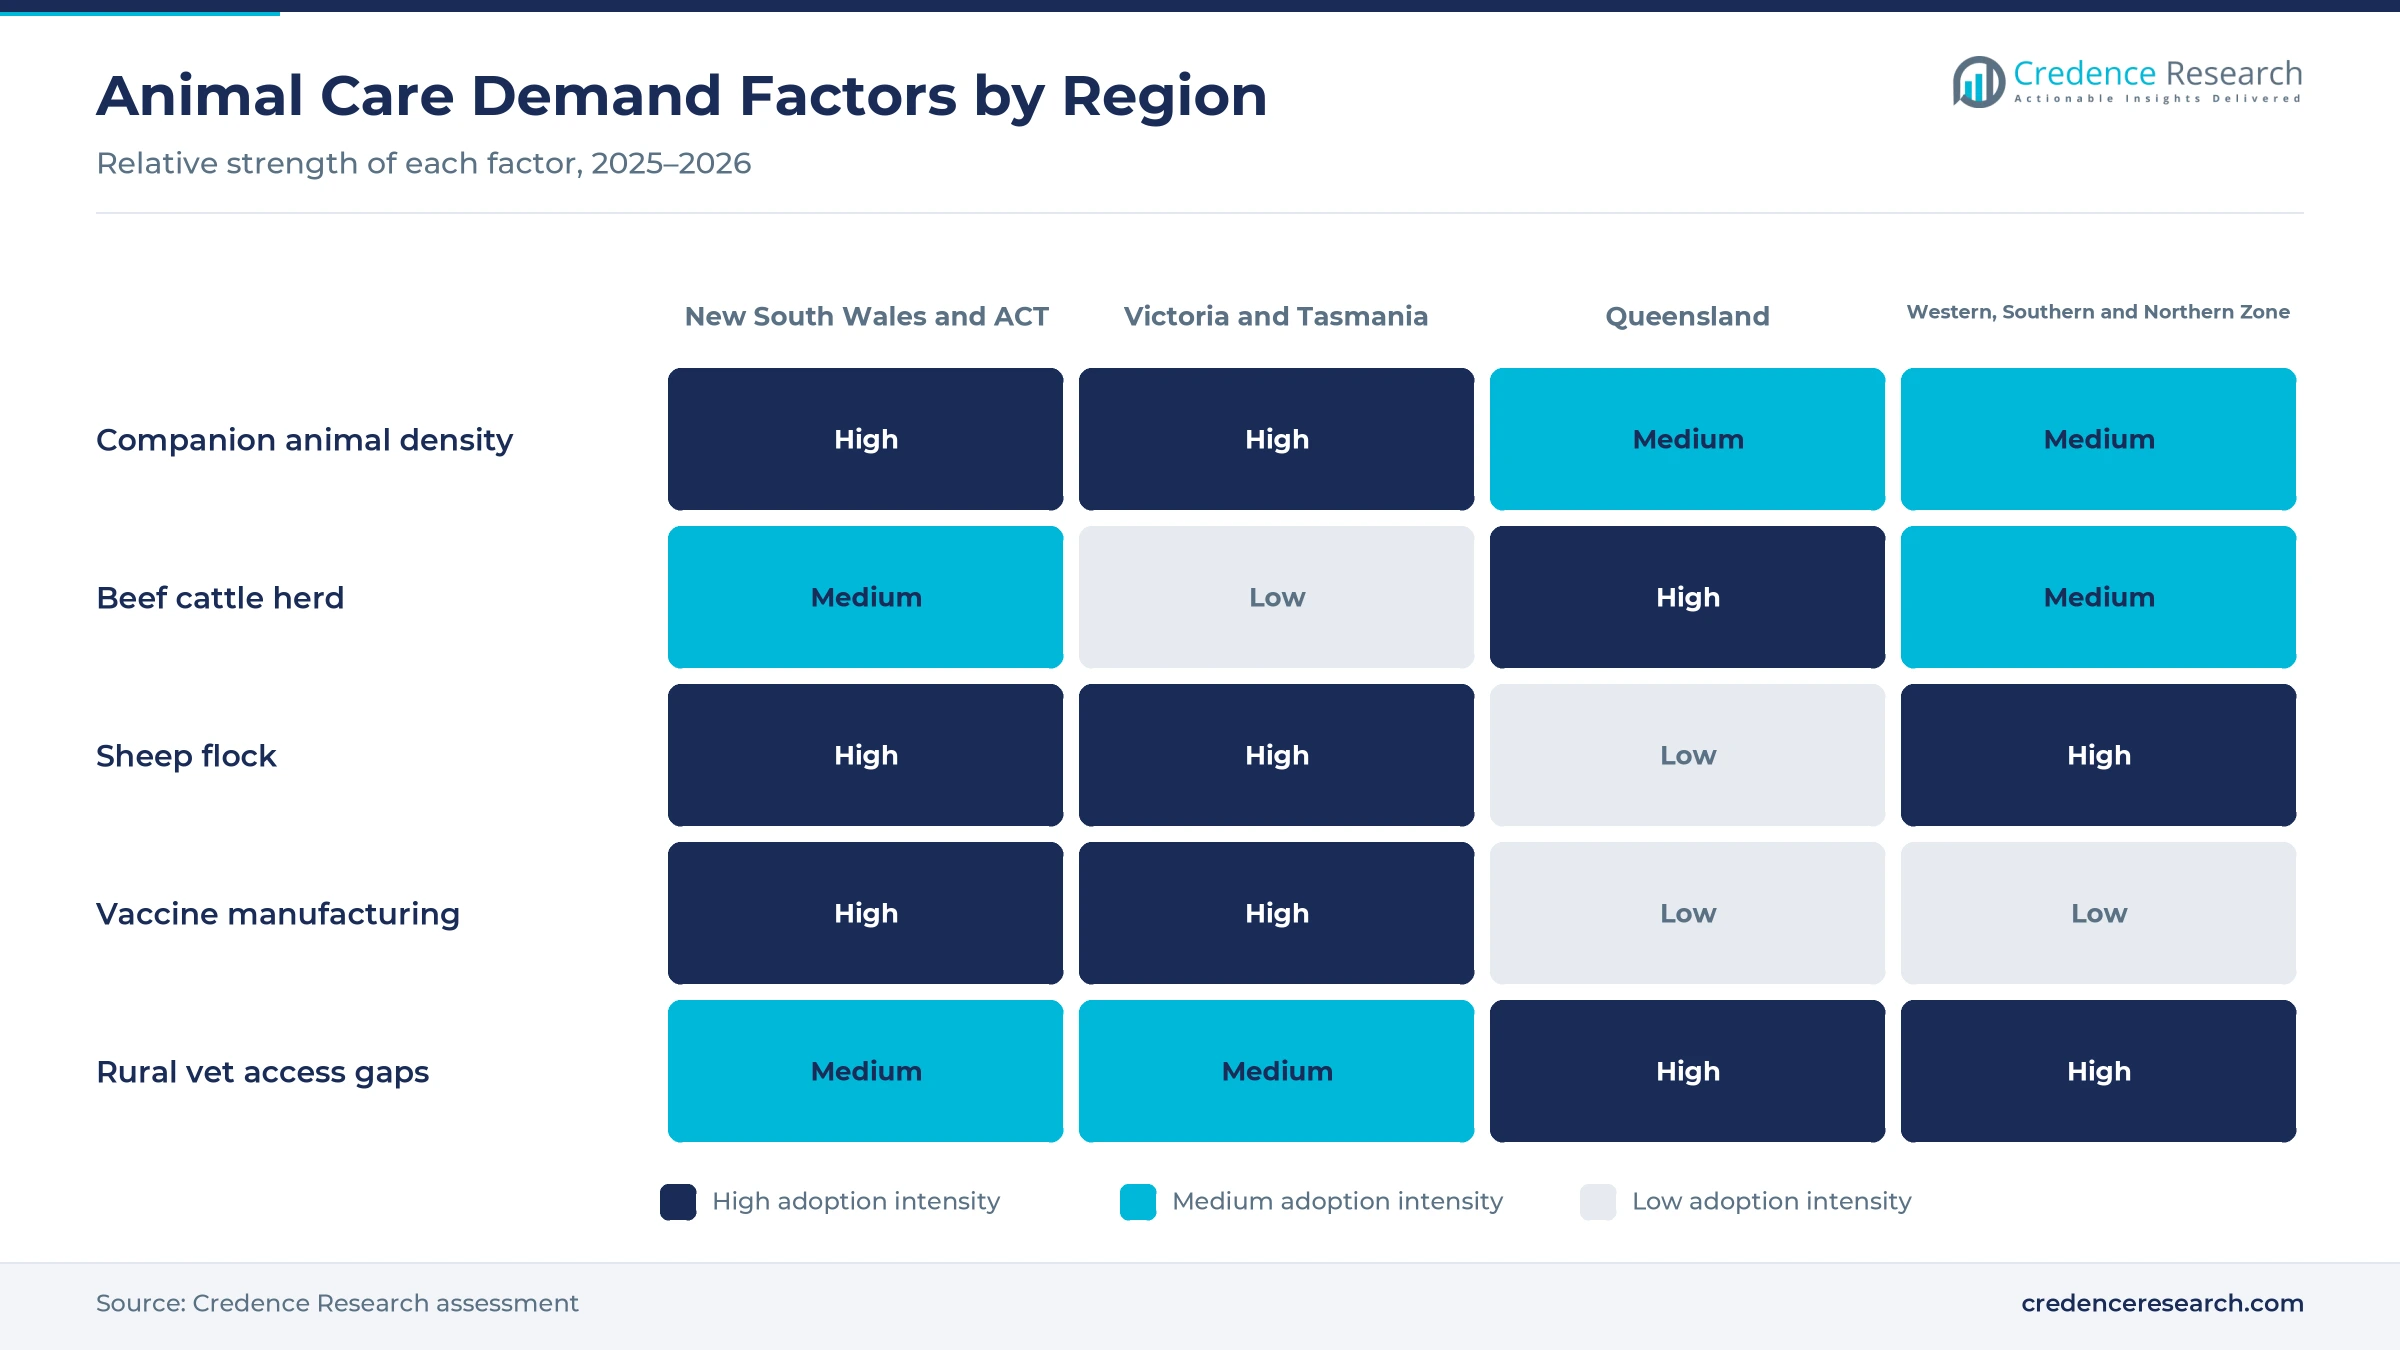
Livestock vaccine capacity supports growth, because local plants shorten supply chains for cattle, sheep and horse vaccines. Zoetis committed A$350 million to expand its Melbourne site fivefold and create 95 jobs, according to the national trade and investment agency. Around 130 million vaccines are made each year in Australia, and the Parkville site produces Ultravac, Pestigard and Glanvac vaccines. Virbac Australia also runs three manufacturing sites in New South Wales, at Crookwell, Penrith and Macquarie Park. Virbac employs more than 100 people in manufacturing and makes most products it sells locally, which steadies vaccine demand for 2026 onward. Consequently, animal health products remain the second-largest service type for clinics, rural suppliers and farmers.
How does clinical network investment widen access?
Clinical network investment widens access, because larger groups fund new equipment, specialist hospitals and staff training. EQT agreed in October 2023 to acquire VetPartners, which runs 267 general practices and specialty hospitals with more than 1,300 vets and more than 3.2 million visits a year. Adamantem Capital completed its takeover of Apiam Animal Health on Feb. 23, 2026, adding more than 80 rural clinics and business sites to private equity ownership. Both owners planned spending on equipment, digital tools and recruitment. Larger networks also give some 4,300 VetPartners staff shared training and specialist referral routes that lift demand for complex care. As a result, veterinary clinical services lead service types with 46.0% of 2025 value nationwide.
Why does livestock output keep farm vet demand steady?
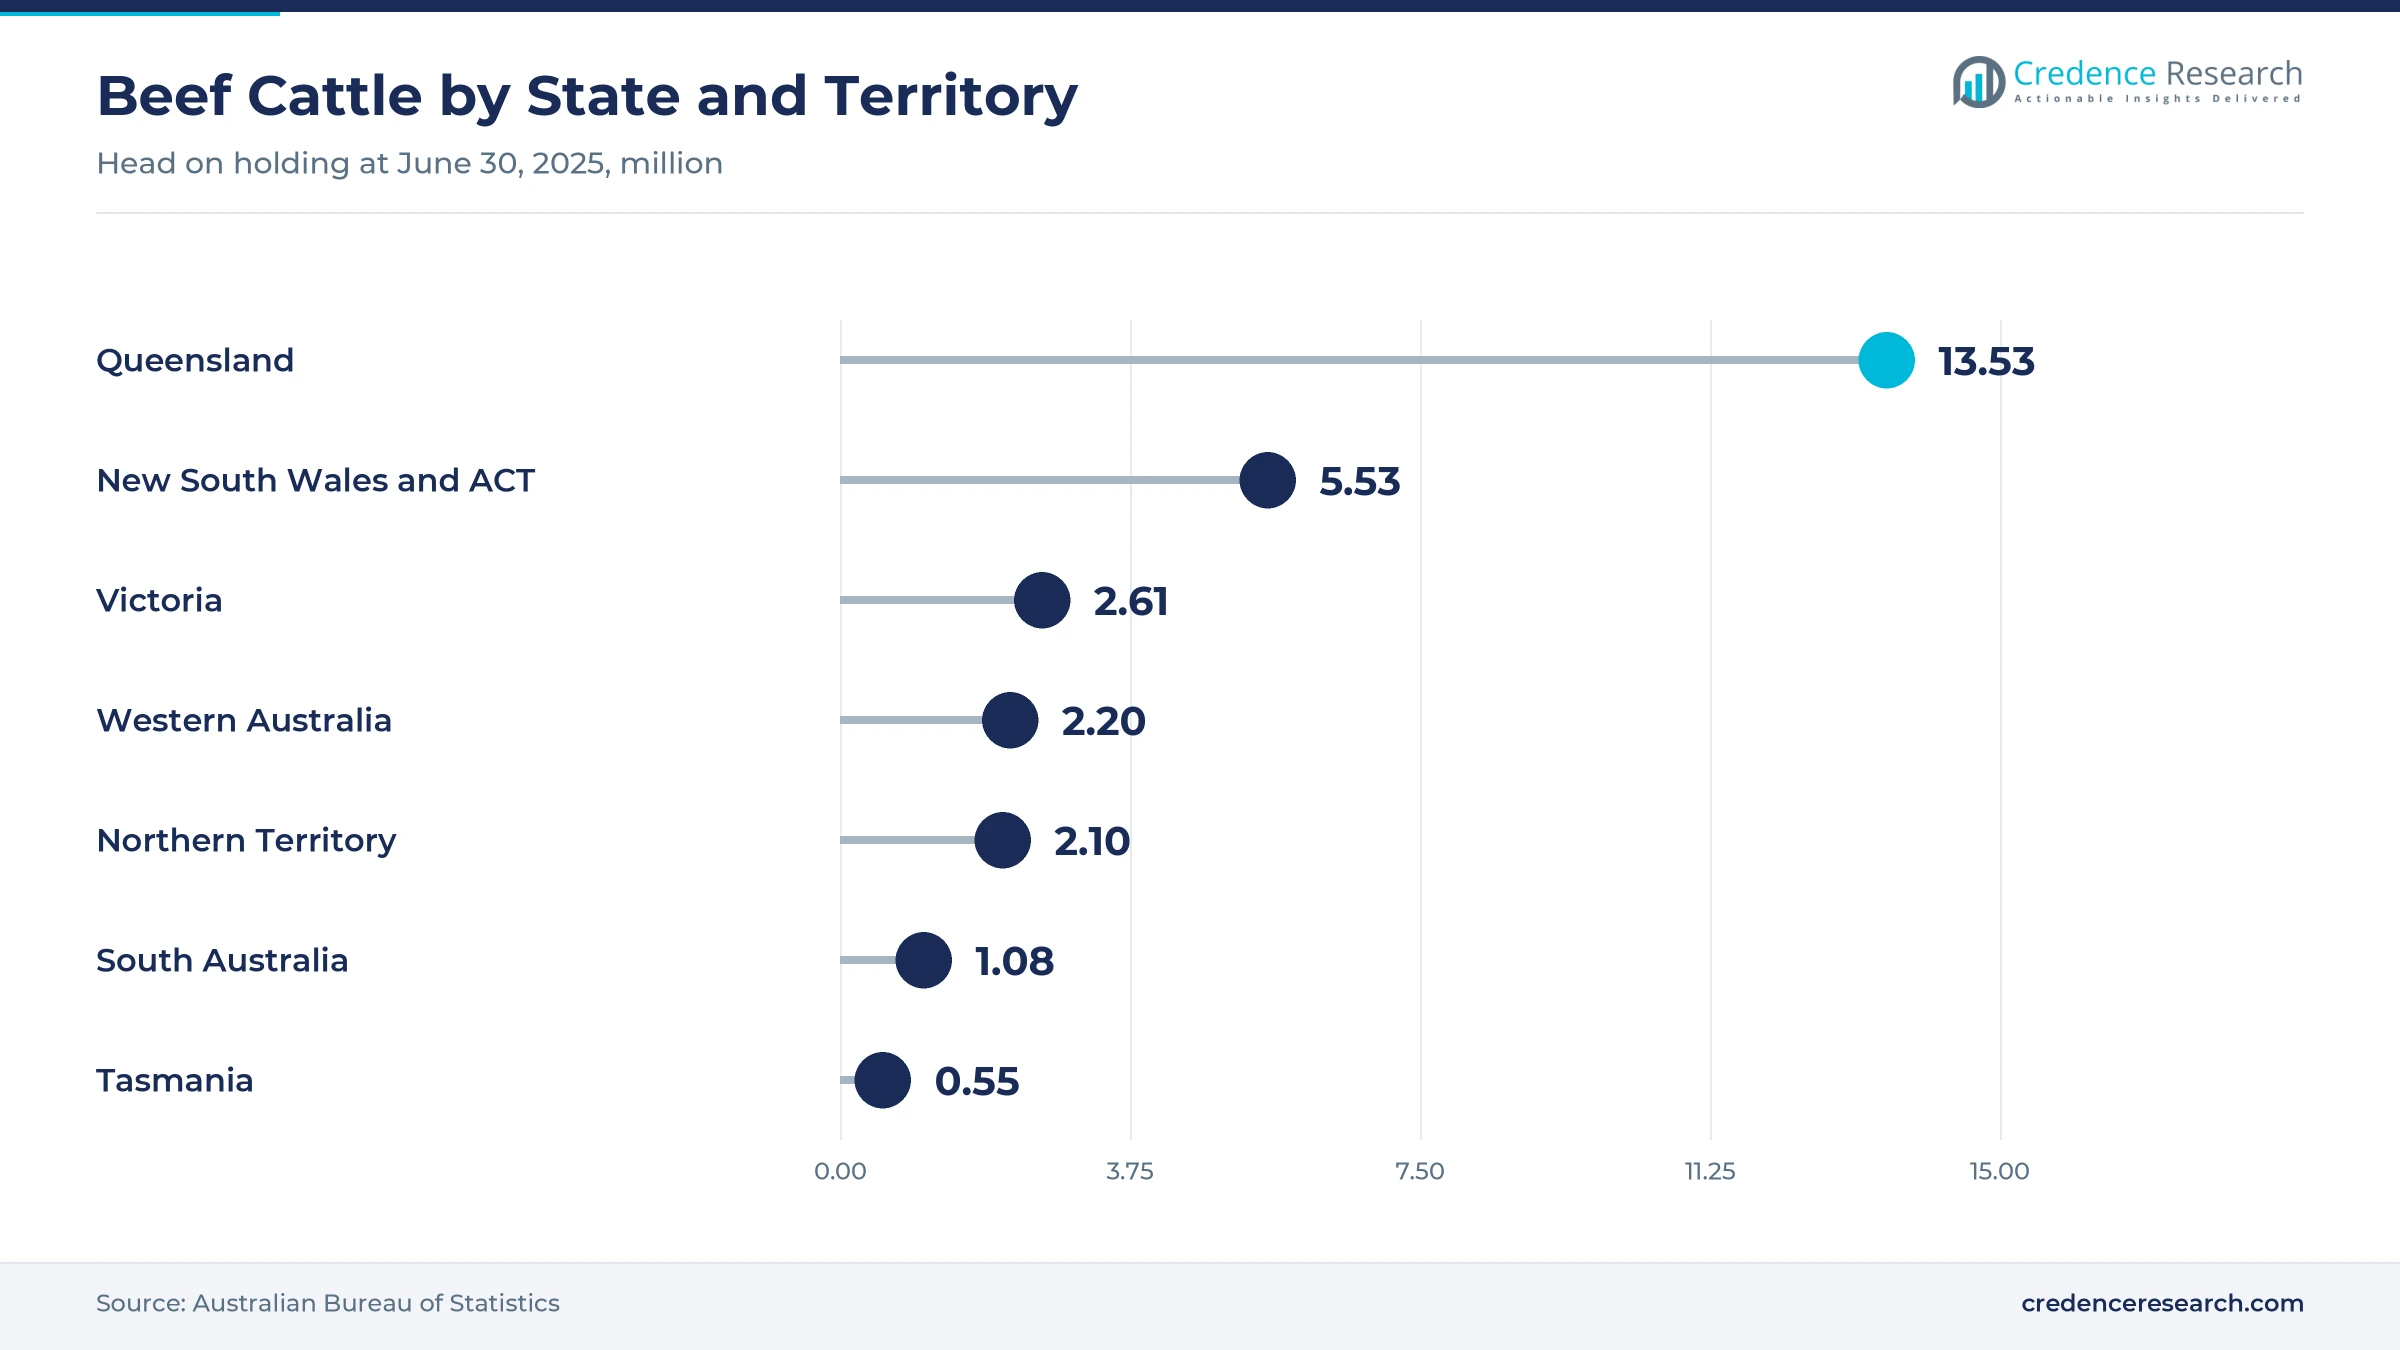
Livestock output keeps farm vet demand steady, because producers rely on vaccines, parasite control and herd health visits to protect stock value. The livestock production index reached 106.67 in 2024, up from 97.75 in 2023, according to World Bank data. Australia held 29.7 million cattle and 65.8 million sheep and lambs at June 30, 2025, according to the Australian Bureau of Statistics. Queensland alone carried 13.5 million beef cattle, up 0.7% over the year, while the national beef herd stood at 27.6 million head. Consequently, Queensland posts the fastest regional growth through 2035, supported by demand for livestock identification and herd health programs.
Biosecurity vaccines, insurance and digital care rise
How is the rise of mRNA vaccines changing biosecurity?
The rise of mRNA vaccines is changing biosecurity planning, because Australia wants faster protection against exotic livestock diseases. On Aug. 4, 2025, the national red meat research body announced a A$20 million, five-year partnership with Tiba Biotech and the NSW government on a foot-and-mouth disease vaccine. Vaccinated cattle in German trials did not contract the disease when exposed and did not shed the virus. The vaccine still needs evaluation by the national veterinary medicines regulator, and emergency registration is being explored. As a result, livestock vaccine makers and farm vets gain a larger role in national biosecurity preparedness through 2035.
Why is the shift to insured pet care rising?
The shift to insured pet care is rising, because surgery, imaging and cancer care now cost more than many owners can pay at once. Owners spent AUD 1.0 billion on pet insurance in 2025, while 12% of owners needed financial help for vet care in the past year. PetSure became the first licensed general insurer dedicated to pet health in March 2023 and serves 28 partner brands. Owners who already budget for pet food and preventive products increasingly add cover for unexpected bills. Consequently, pet insurance grows faster than clinical services through 2035 as more owners use cover to manage large bills.
Can digital care and online ordering open new demand?
Digital care and online ordering open new demand, because busy owners want reminders, repeat parasite control and remote advice. Some 30% of dog owners and 22% of cat owners who cut vet visits cited cost, which pushes clinics toward lower-cost remote check-ins. Owners spent AUD 21.3 billion on pets in 2025, so even small shifts online move large sums. VetPartners recorded more than 3.2 million visits a year, which gives large groups data for online booking and reminders. Clinics that add online pharmacies also keep 2025 parasite control demand inside the practice rather than losing it to retailers. As a result, the direct and digital channel grows fastest at 7.83% a year through 2035.
Is there room to grow in precision herd health?
Precision herd health offers a clear opening, because large cattle and sheep operations want to treat animals before losses spread. The national sheep and lamb flock fell 8.0% to 65.8 million in 2025, which raises the value of each remaining animal. Virbac runs three research laboratories in Sydney focused on parasiticides and vaccines for ruminants. Beef cattle numbers in New South Wales fell 7.1% in 2025, which shows how quickly herd demand can swing. Apiam brought more than 80 rural clinics and sites into one network that serves livestock producers. In turn, vets that combine herd visits with precision livestock farming data can sell health plans to corporate farms across 2026 and beyond.
Vet shortages, cost pressure and herd swings
How do vet shortages limit service growth?
Vet shortages limit service growth, because practices cannot add appointments without enough vets and nurses. Rural clinics find recruitment hardest, as many graduates prefer city practices with larger teams and shorter on-call rosters. As a result, farmers wait longer for herd visits and some clinics close after-hours services. Groups respond with graduate programs, mental health support and telehealth, although these steps take years to rebuild the workforce.
Why do cost pressures reduce pet visits?
Cost pressures reduce pet visits, because rising living costs force owners to delay check-ups and elective care. Some 12% of owners needed financial help for vet care in the past year. Consequently, renters and financially stretched households skip preventive care, which leads to more costly acute cases later. Clinics manage this with payment plans, wellness subscriptions and insurance partners that spread costs across the year.
How do herd swings unsettle farm demand?
Herd swings unsettle farm demand, because drought and prices change how many cattle and sheep producers keep. The national sheep and lamb flock fell 8.0% in the year to June 2025, while New South Wales beef numbers fell 7.1%. In turn, rural clinics and suppliers face lower vaccine and drench volumes in lean years. Diversified practices that also treat pets and horses manage these swings better than farm-only clinics.
Will biosecurity threats strain the system?
Biosecurity threats could strain the system, because an outbreak of foot-and-mouth or lumpy skin disease would need fast diagnosis, movement controls and vaccines at scale. Exotic disease preparedness depends on vets in remote areas where staff are already scarce. As a result, an outbreak could divert vets from routine work for months. Government and industry vaccine research and surge workforce plans help reduce this risk.
Sydney practices lead as Queensland grows fastest
| Region | Value, 2025 (USD billion) | Share, 2025 | CAGR, 2026–2035 |
|---|---|---|---|
| New South Wales and Australian Capital Territory | 1.62 | 33.7% | 6.16% |
| Victoria and Tasmania | 1.18 | 24.6% | 6.06% |
| Western Australia, South Australia and Northern Territory | 1.09 | 22.7% | 6.36% |
| Queensland | 0.91 | 19.0% | 6.56% |
Why do New South Wales and the ACT lead animal care?
New South Wales and the Australian Capital Territory held 33.7% of 2025 value and grow at 6.16% a year, as the largest region. Sydney has the densest network of general practices and specialty hospitals. The state also held 25.9 million sheep and lambs at June 30, 2025, the largest flock in the country. Virbac makes animal medicines at three New South Wales sites.
How do Victoria and Tasmania support vaccine supply?
Victoria and Tasmania held 24.6% of 2025 value and grow at 6.06% a year, because Melbourne hosts both large clinic groups and vaccine production. Zoetis has operated its Parkville site since 2004 and plans a fivefold expansion. Victoria also carried a 1.3 million dairy herd and 14.7 million sheep and lambs at June 30, 2025. As a result, the zone combines strong companion and dairy demand.
Why is Queensland the fastest-growing zone?
Queensland held 19.0% of 2025 value and grows fastest at 6.56% a year, because it carries the largest beef herd and a fast-growing population. The state held 13.5 million beef cattle at June 30, 2025, almost half the national herd. Growing coastal cities also add pet owners and new practices. Consequently, Queensland adds the most new demand for both farm and companion care.
How do the western, southern and northern zones add demand?
Western Australia, South Australia and the Northern Territory held 22.7% of 2025 value and grow at 6.36% a year. Western Australia held 10.6 million sheep and lambs, while the Northern Territory carried 2.1 million beef cattle at June 30, 2025. Therefore, this zone relies heavily on rural practices, livestock vaccines and mobile vet services.
Vaccine plants and clinic buyouts from 2024 to 2026
| Development | Status and market relevance |
|---|---|
| In May 2024, Zoetis committed A$350 million to expand its Melbourne manufacturing site for livestock and pet vaccines. | Raises the site footprint fivefold and adds 95 jobs |
| In August 2025, Meat and Livestock Australia announced a A$20 million partnership on a foot-and-mouth disease mRNA vaccine. | Vaccine awaits evaluation by the national regulator |
| In September 2025, the national animal medicines body released its pet ownership report showing 73% of households own a pet. | Confirms rising companion-animal demand |
| In November 2025, Apiam Animal Health agreed to be acquired by Adamantem Capital through a scheme of arrangement. | Covers more than 80 rural clinics and sites |
| In February 2026, Adamantem Capital completed its acquisition of Apiam Animal Health, which then delisted. | Scheme implemented on Feb. 23, 2026 |
MRNA vaccines, in-clinic tests and telehealth
- mRNA livestock vaccines trigger immunity without live virus, which could speed protection against foot-and-mouth disease if regulators approve them.
- In-clinic diagnostic analyzers return blood and urine results during the visit, which lets vets start treatment the same day.
- Telehealth and practice software support remote check-ins, reminders and online ordering, which widens access for rural owners.
- Long-acting parasiticides protect pets and livestock for months from one dose, which improves compliance and lowers handling costs.
Need a Custom Version of This Report?
Tailor the scope, geography, or segments to your exact requirements.
- Custom geography or segment scope
- Direct access to our analyst team
Clinic groups and drug makers compete on reach
Competition combines corporate clinic groups, rural vet networks, animal medicine makers, diagnostic suppliers and pet insurers. VetPartners runs 267 general practices and specialty hospitals with more than 1,300 vets after its sale to EQT. Apiam Animal Health operates more than 80 rural clinics and sites and became part of Adamantem Capital in February 2026. Zoetis is expanding its Parkville vaccine plant, while Virbac Australia makes most of the products it sells at three local sites. PetSure administers pet insurance for 28 partner brands under its own general insurance licence. Companies compete on clinic reach, vet recruitment, product range, local manufacturing, diagnostic speed and insurance partnerships. Larger groups also bundle wellness plans, diagnostics and insurance, which keeps owners loyal across many visits.
Companies profiled and their roles in this market
| Company | Type | Role in the market |
|---|---|---|
| VetPartners Australia | Clinic group | 267 practices and hospitals; more than 1,300 vets; acquired by EQT |
| Apiam Animal Health | Rural clinic group | More than 80 rural clinics and sites; acquired by Adamantem Capital in 2026 |
| Zoetis Australia | Animal medicine maker | A$350 million Parkville expansion for livestock and pet vaccines |
| Virbac Australia | Animal medicine maker | Three manufacturing sites in New South Wales; ruminant vaccines and parasiticides |
| PetSure | Pet insurer | Licensed pet health insurer serving 28 partner brands |
Credence Research view on Australian animal care
Credence Research's view is that Australian spending on animal care will grow steadily through 2035, as pet ownership stays high and producers protect herds against disease. Clinical services should keep the largest share, while allied technology and insurance gain most from diagnostics and larger bills. Private equity ownership of clinic groups will speed equipment and software spending. However, vet shortages and cost pressure on households will reward groups that offer payment plans, telehealth and strong graduate programs.
How the animal care spending estimate was built
The report uses 2025 as the base year, with values in USD million at current prices. Market values come from the Credence Research model, which combines pet and livestock numbers, visit rates, product use and price tiers. Regional shares follow the client zone split, and segment splits by service type, customer type, application and channel are Credence Research estimates. Sources used are official statistics, industry body reports, company and investor releases and agency pages, and no interviews or surveys were used.
Companion care and biosecurity shape 2035
The market is expected to reach USD 8.84 billion by 2035, a 6.26% CAGR during 2026–2035, as pet care, livestock protection and clinic investment keep demand rising. Growth should be strongest in allied veterinary technology, chronic disease management, direct and digital channels and Queensland, while New South Wales and the ACT keep the largest share. Local vaccine capacity and new mRNA vaccines will strengthen biosecurity after 2026. In contrast, a major exotic disease outbreak or a deeper cost-of-living squeeze could slow elective care.
Frequently Asked Questions
How big is the Australia animal health and veterinary services market?
Which region leads animal care spending?
Which region grows fastest?
Which service type holds the largest share?
How many Australian households own a pet?
Which service type grows fastest?
Who are the leading companies in this market?
What are the main risks to growth?
Table of Content
Chapter 1 Market Segmentation
- 1.1 Segmentation Framework
- 1.1.1 Product and Service Classification
- 1.1.2 Application and End-Use Classification
- 1.1.3 Technology and Solution Classification
- 1.1.4 Customer and Distribution Channel Classification
- 1.1.5 Geographic Segmentation
- 1.1.6 Market Segment Definitions and Boundaries
- 1.2 By Service Type
- 1.2.1 Veterinary Clinical Services
- 1.2.2 Animal Health Products
- 1.2.3 Pet Insurance
- 1.2.4 Allied Veterinary Technology
- 1.3 By Customer Type
- 1.3.1 Companion Animal Owners
- 1.3.2 Livestock Producers
- 1.3.3 Equine Owners
- 1.3.4 Veterinary Organizations
- 1.4 By Application
- 1.4.1 Preventive Health
- 1.4.2 Acute Treatment
- 1.4.3 Chronic Disease Management
- 1.4.4 Care Enablement
- 1.5 By Channel
- 1.5.1 Veterinary Practice Channel
- 1.5.2 Rural Supplier Channel
- 1.5.3 Pet Retail and Pharmacy Channel
- 1.5.4 Direct and Digital Channel
Chapter 2 Introduction
- 2.1 Report Objectives and Scope
- 2.2 Product Definition and Industry Terminology
- 2.3 Market Inclusions and Exclusions
- 2.4 Research Process
- 2.4.1 Primary Research and Expert Interviews
- 2.4.2 Secondary Research and Source Review
- 2.4.3 Top-Down and Bottom-Up Estimation
- 2.4.4 Data Triangulation and Verification
- 2.5 Market Size Measurement Basis
- 2.5.1 2025: USD 4.80 billion → 2035: USD 8.84 billion
- 2.6 Historical and Forecast Reference Periods
- 2.6.1 Historical Period: 2018-2025
- 2.6.2 Base Year: 2025
- 2.6.3 Forecast Period: 2025-2035
- 2.7 Research Assumptions and Limitations
Chapter 3 Executive Summary
- 3.1 Market Snapshot and Key Findings
- 3.2 Base-Year Market Size, 2025
- 3.3 Forecast Market Size, 2035
- 3.4 Revenue and Volume Growth Outlook
- 3.5 Key Demand and Supply Indicators
- 3.6 Leading Market Segments
- 3.7 Fastest-Growing Market Opportunities
- 3.8 Regional Performance Highlights
- 3.9 Technology and Industry Transformation
- 3.10 Competitive Landscape Summary
- 3.11 Analyst View and Strategic Implications
Chapter 4 Australia Animal Health and Veterinary Services Market Trends and Developments
- 4.1 Historical Industry Development, 2018-2025
- 4.2 Recent Market Trends and Developments
- 4.3 Demand and Customer Behavior Trends
- 4.4 Technology and Product Innovation
- 4.5 Artificial Intelligence, Automation and Digitalization
- 4.6 Local Manufacturing and Supply Chain Realignment
- 4.7 Industry Partnerships, Mergers and Acquisitions
- 4.8 Sustainability and Circular Economy Developments
- 4.9 Government and Private Sector Investment Trends
- 4.10 Emerging Business Models and Commercialization
- 4.11 Industry Developments and Announcements
Chapter 5 Australia Animal Health and Veterinary Services Market Supply and Demand Analysis
- 5.1 Demand Trend and Consumption Analysis, 2018-2025
- 5.2 Demand Forecast, 2025-2035
- 5.3 Supply Chain Structure and Procurement Trends
- 5.4 Supply-Demand Gap and Bottlenecks
- 5.5 Import Dependence and Sourcing Structure
- 5.6 Regional Supply and Demand Concentration
Chapter 6 Australia Animal Health and Veterinary Services Market Pricing Analysis
- 6.1 Pricing Structure and Measurement
- 6.2 Historical Pricing Trends, 2018-2025
- 6.3 Pricing Outlook, 2025-2035
- 6.4 Pricing by Product and Market Segment
- 6.5 Geographic Pricing Differences
- 6.6 Key Input, Energy, Labor and Logistics Costs
- 6.7 Contract Pricing and Purchasing Models
- 6.8 Pricing Sensitivity and Competitive Positioning
- 6.9 Price, Margin and Profitability Implications
Chapter 7 Australia Animal Health and Veterinary Services Market Dynamics
- 7.1 Market Growth Drivers
- 7.1.1 Demand-Side Drivers
- 7.1.2 Technology and Innovation Drivers
- 7.1.3 Infrastructure and Investment Drivers
- 7.1.4 Regulatory and Policy Drivers
- 7.2 Market Restraints
- 7.2.1 Cost and Affordability Constraints
- 7.2.2 Technology and Adoption Barriers
- 7.2.3 Supply Chain and Operational Constraints
- 7.3 Market Challenges
- 7.3.1 Competitive Pressure and Margin Erosion
- 7.3.2 Skills, Infrastructure and Implementation Gaps
- 7.4 Emerging Market Opportunities
- 7.5 Market Dynamics Impact and Time-Horizon Assessment
Chapter 8 Australia Animal Health and Veterinary Services Value Chain Analysis
- 8.1 Industry Value Chain Overview
- 8.2 Upstream Suppliers and Critical Inputs
- 8.3 Technology and Component Providers
- 8.4 Manufacturing or Service Delivery
- 8.5 Distribution, Channel Partners and Integrators
- 8.6 Downstream Applications and End Users
- 8.7 Value Addition and Profit Pools
- 8.8 Vertical Integration and Outsourcing
- 8.9 Supplier Concentration and Risk
- 8.10 Supply Chain Localization and Resilience
Chapter 9 Australia Animal Health and Veterinary Services Market Regulations and Policies
- 9.1 Relevant Laws, Standards and Compliance Frameworks
- 9.2 Product, Service, Safety and Quality Requirements
- 9.3 Government Policies, Incentives and Subsidies
- 9.4 Imports, Exports and Trade Barriers
- 9.5 Public Procurement and Local Content Requirements
- 9.6 Data Protection, AI and Cybersecurity Compliance
- 9.7 Upcoming Policy Changes and Market Implications
Chapter 10 Australia Animal Health and Veterinary Services Market Hotspots and Opportunities
- 10.1 Market Opportunity Mapping and Growth Hotspots
- 10.2 High-Growth Applications and Customer Groups
- 10.3 Underserved Markets and White-Space Opportunities
- 10.4 Emerging Technology and Product Opportunities
- 10.5 New Capacity and Investment Hotspots
- 10.6 Market Entry and Expansion Opportunities
- 10.7 Distribution and Partnership Opportunities
- 10.8 Near-Term and Long-Term Commercial Potential
- 10.9 Opportunity Attractiveness and Execution Risks
Chapter 11 Australia Animal Health and Veterinary Services Market Outlook, 2025-2035
- 11.1 Market Size and Analysis
- 11.1.1 Revenue (Market Measurement: 2025: USD 4.80 billion → 2035: USD 8.84 billion)
- 11.1.2 Historical Market Size, 2018-2025
- 11.1.3 Base-Year Market Size, 2025
- 11.2 Market Forecast, 2025-2035
- 11.2.1 Revenue Forecast to 2035
- 11.2.2 CAGR and Year-on-Year Growth
- 11.2.3 Incremental Revenue Opportunity
- 11.3 Forecast Assumptions and Scenario Analysis
- 11.3.1 Base-Case Forecast
- 11.3.2 Optimistic and Conservative Scenarios
- 11.3.3 Technology, Pricing and Policy Sensitivities
- 11.4 Market Attractiveness and Growth Outlook
Chapter 12 Australia Animal Health and Veterinary Services Market Segmentation and Outlook
- 12.1 Segmentation Summary and Market Shares, 2025
- 12.2 Largest and Fastest-Growing Segments
- 12.3 By Service Type - Market Size and Forecast, 2025-2035
- 12.3.1 Segment Definition and Scope
- 12.3.2 Historical Market Size, 2018-2025
- 12.3.3 Revenue Forecast, 2025-2035
- 12.3.4 Base-Year Market Share, 2025
- 12.3.5 Segment CAGR and Growth Drivers
- 12.3.6 Subsegment Market Size and Forecast
- 12.3.6.1 Veterinary Clinical Services
- 12.3.6.2 Animal Health Products
- 12.3.6.3 Pet Insurance
- 12.3.6.4 Allied Veterinary Technology
- 12.3.7 Subsegment Pricing and Adoption Trends
- 12.3.8 Leading Suppliers and Competition
- 12.3.9 Regional Demand and Opportunities
- 12.4 By Customer Type - Market Size and Forecast, 2025-2035
- 12.4.1 Segment Definition and Scope
- 12.4.2 Historical Market Size, 2018-2025
- 12.4.3 Revenue Forecast, 2025-2035
- 12.4.4 Base-Year Market Share, 2025
- 12.4.5 Segment CAGR and Growth Drivers
- 12.4.6 Subsegment Market Size and Forecast
- 12.4.6.1 Companion Animal Owners
- 12.4.6.2 Livestock Producers
- 12.4.6.3 Equine Owners
- 12.4.6.4 Veterinary Organizations
- 12.4.7 Subsegment Pricing and Adoption Trends
- 12.4.8 Leading Suppliers and Competition
- 12.4.9 Regional Demand and Opportunities
- 12.5 By Application - Market Size and Forecast, 2025-2035
- 12.5.1 Segment Definition and Scope
- 12.5.2 Historical Market Size, 2018-2025
- 12.5.3 Revenue Forecast, 2025-2035
- 12.5.4 Base-Year Market Share, 2025
- 12.5.5 Segment CAGR and Growth Drivers
- 12.5.6 Subsegment Market Size and Forecast
- 12.5.6.1 Preventive Health
- 12.5.6.2 Acute Treatment
- 12.5.6.3 Chronic Disease Management
- 12.5.6.4 Care Enablement
- 12.5.7 Subsegment Pricing and Adoption Trends
- 12.5.8 Leading Suppliers and Competition
- 12.5.9 Regional Demand and Opportunities
- 12.6 By Channel - Market Size and Forecast, 2025-2035
- 12.6.1 Segment Definition and Scope
- 12.6.2 Historical Market Size, 2018-2025
- 12.6.3 Revenue Forecast, 2025-2035
- 12.6.4 Base-Year Market Share, 2025
- 12.6.5 Segment CAGR and Growth Drivers
- 12.6.6 Subsegment Market Size and Forecast
- 12.6.6.1 Veterinary Practice Channel
- 12.6.6.2 Rural Supplier Channel
- 12.6.6.3 Pet Retail and Pharmacy Channel
- 12.6.6.4 Direct and Digital Channel
- 12.6.7 Subsegment Pricing and Adoption Trends
- 12.6.8 Leading Suppliers and Competition
- 12.6.9 Regional Demand and Opportunities
- 12.7 Segment Growth Comparison
- 12.8 Segment Attractiveness and Priority Matrix
Chapter 13 Australia Animal Health and Veterinary Services End-Use and Application Market Outlook
- 13.1 End-Use Industry and Customer Demand Structure
- 13.2 Leading Applications and Customer Groups
- 13.3 End-Use Market Size, Share and Forecast
- 13.4 Major End-Use Industry Deep Dives
- 13.4.1 Customer Requirements and Use Cases
- 13.4.2 Demand and Replacement Cycles
- 13.4.3 Technical and Regulatory Considerations
- 13.4.4 Purchasing and Procurement Models
- 13.4.5 Leading Vendors and Distribution Channels
- 13.4.6 Forecast and Commercial Opportunities
- 13.5 Emerging Applications and Cross-Segment Demand
- 13.6 End-Use Industry Investment Priorities
Chapter 14 Australia Animal Health and Veterinary Services Geographic Market Outlook, 2025-2035
- 14.1 Domestic Market Distribution and Demand Clusters
- 14.2 State- or Province-Wise Market Size and Forecast, 2025-2035
- 14.3 City and Metropolitan Market Outlook
- 14.4 Industrial, Manufacturing and Commercial Clusters
- 14.5 Geographic Concentration of Key End Users
- 14.6 Local Pricing and Purchasing Differences
- 14.7 Domestic Production Facilities and Capacity Map
- 14.8 Local Infrastructure and Project Pipeline
- 14.9 State-Level Policy and Incentive Differences
- 14.10 Subnational Investment Hotspots and Opportunities
- 14.11 Distribution and Logistics Networks
- 14.12 Domestic Competitive Footprint
Chapter 15 Australia Animal Health and Veterinary Services Technology, Innovation and Sustainability Outlook
- 15.1 Technology Landscape and Maturity
- 15.2 Product, Process and Service Innovation
- 15.3 AI, Automation and Digital Tools in the Industry
- 15.4 Technology Adoption and Performance Benchmarking
- 15.5 Innovation Pipeline and R&D Investment
- 15.6 Energy Efficiency and Resource Management
- 15.7 Sustainability, Recycling and Circularity
- 15.8 Technology Roadmap, 2025-2035
- 15.9 Risks of Obsolescence and Technology Substitution
Chapter 16 Australia Animal Health and Veterinary Services Market Key Strategic Imperatives
- 16.1 Growth and Market Entry Priorities
- 16.2 High-Return Products and Segments
- 16.3 Pricing, Profitability and Cost Optimization
- 16.4 Technology Investment and Product Differentiation
- 16.5 Supply Chain Localization and Resilience
- 16.6 Distribution and Customer Acquisition
- 16.7 Partnership, Acquisition and Capacity Strategy
- 16.8 Regional Expansion Priorities
- 16.9 Short-, Medium- and Long-Term Actions
Chapter 17 Competition Outlook
- 17.1 Industry Competition Characteristics
- 17.2 Market Structure and Concentration
- 17.3 Market Share and Competitive Positioning, 2025
- 17.4 Company-Wise Revenue and Product Benchmarking
- 17.5 Production and Service Capacity Benchmarking
- 17.6 Technology, Pricing and Differentiation
- 17.7 Regional Footprint and Distribution Strength
- 17.8 Mergers, Acquisitions and Strategic Alliances
- 17.9 New Entrants and Competitive Threats
- 17.10 Porter's Five Forces and Industry Attractiveness
- 17.11 Competitive Outlook, 2025-2035
Chapter 18 Company Profiles
- 18.1 Company Coverage and Selection Criteria
- 18.2 Greencross Vets
- 18.2.1 Business Description
- 18.2.2 Company Ownership and Geographic Presence
- 18.2.3 Product and Service Portfolio
- 18.2.4 Manufacturing and Operating Footprint
- 18.2.5 Financial Performance and Investment
- 18.2.6 Market Share and Competitive Position
- 18.2.7 Technology and Innovation Capabilities
- 18.2.8 Strategic Alliances or Partnerships
- 18.2.9 Recent Developments
- 18.2.10 Growth Strategy and Outlook
- 18.3 VetPartners Australia
- 18.4 Zoetis Australia
- 18.5 Boehringer Ingelheim Animal Health Australia
- 18.6 Apiam Animal Health
- 18.7 MSD Animal Health Australia
- 18.8 Virbac Australia
- 18.9 IDEXX Laboratories Australia
- 18.10 Elanco Animal Health Australia
- 18.11 PetSure
- 18.12 Other Relevant Market Participants
Note: Every listed company is profiled on the structure shown under the first company. The company list is preliminary and may change based on research findings, market developments, data availability and client requirements.
Chapter 19 Disclaimer
- 19.1 Research and Forecast Disclaimer
- 19.2 Data Source and Estimation Limitations
Note: The depth of individual sections depends on data availability for this market. Volume, capacity, trade and other unit-based metrics are included where applicable.

