
New hospitals and aged care reform widen support work
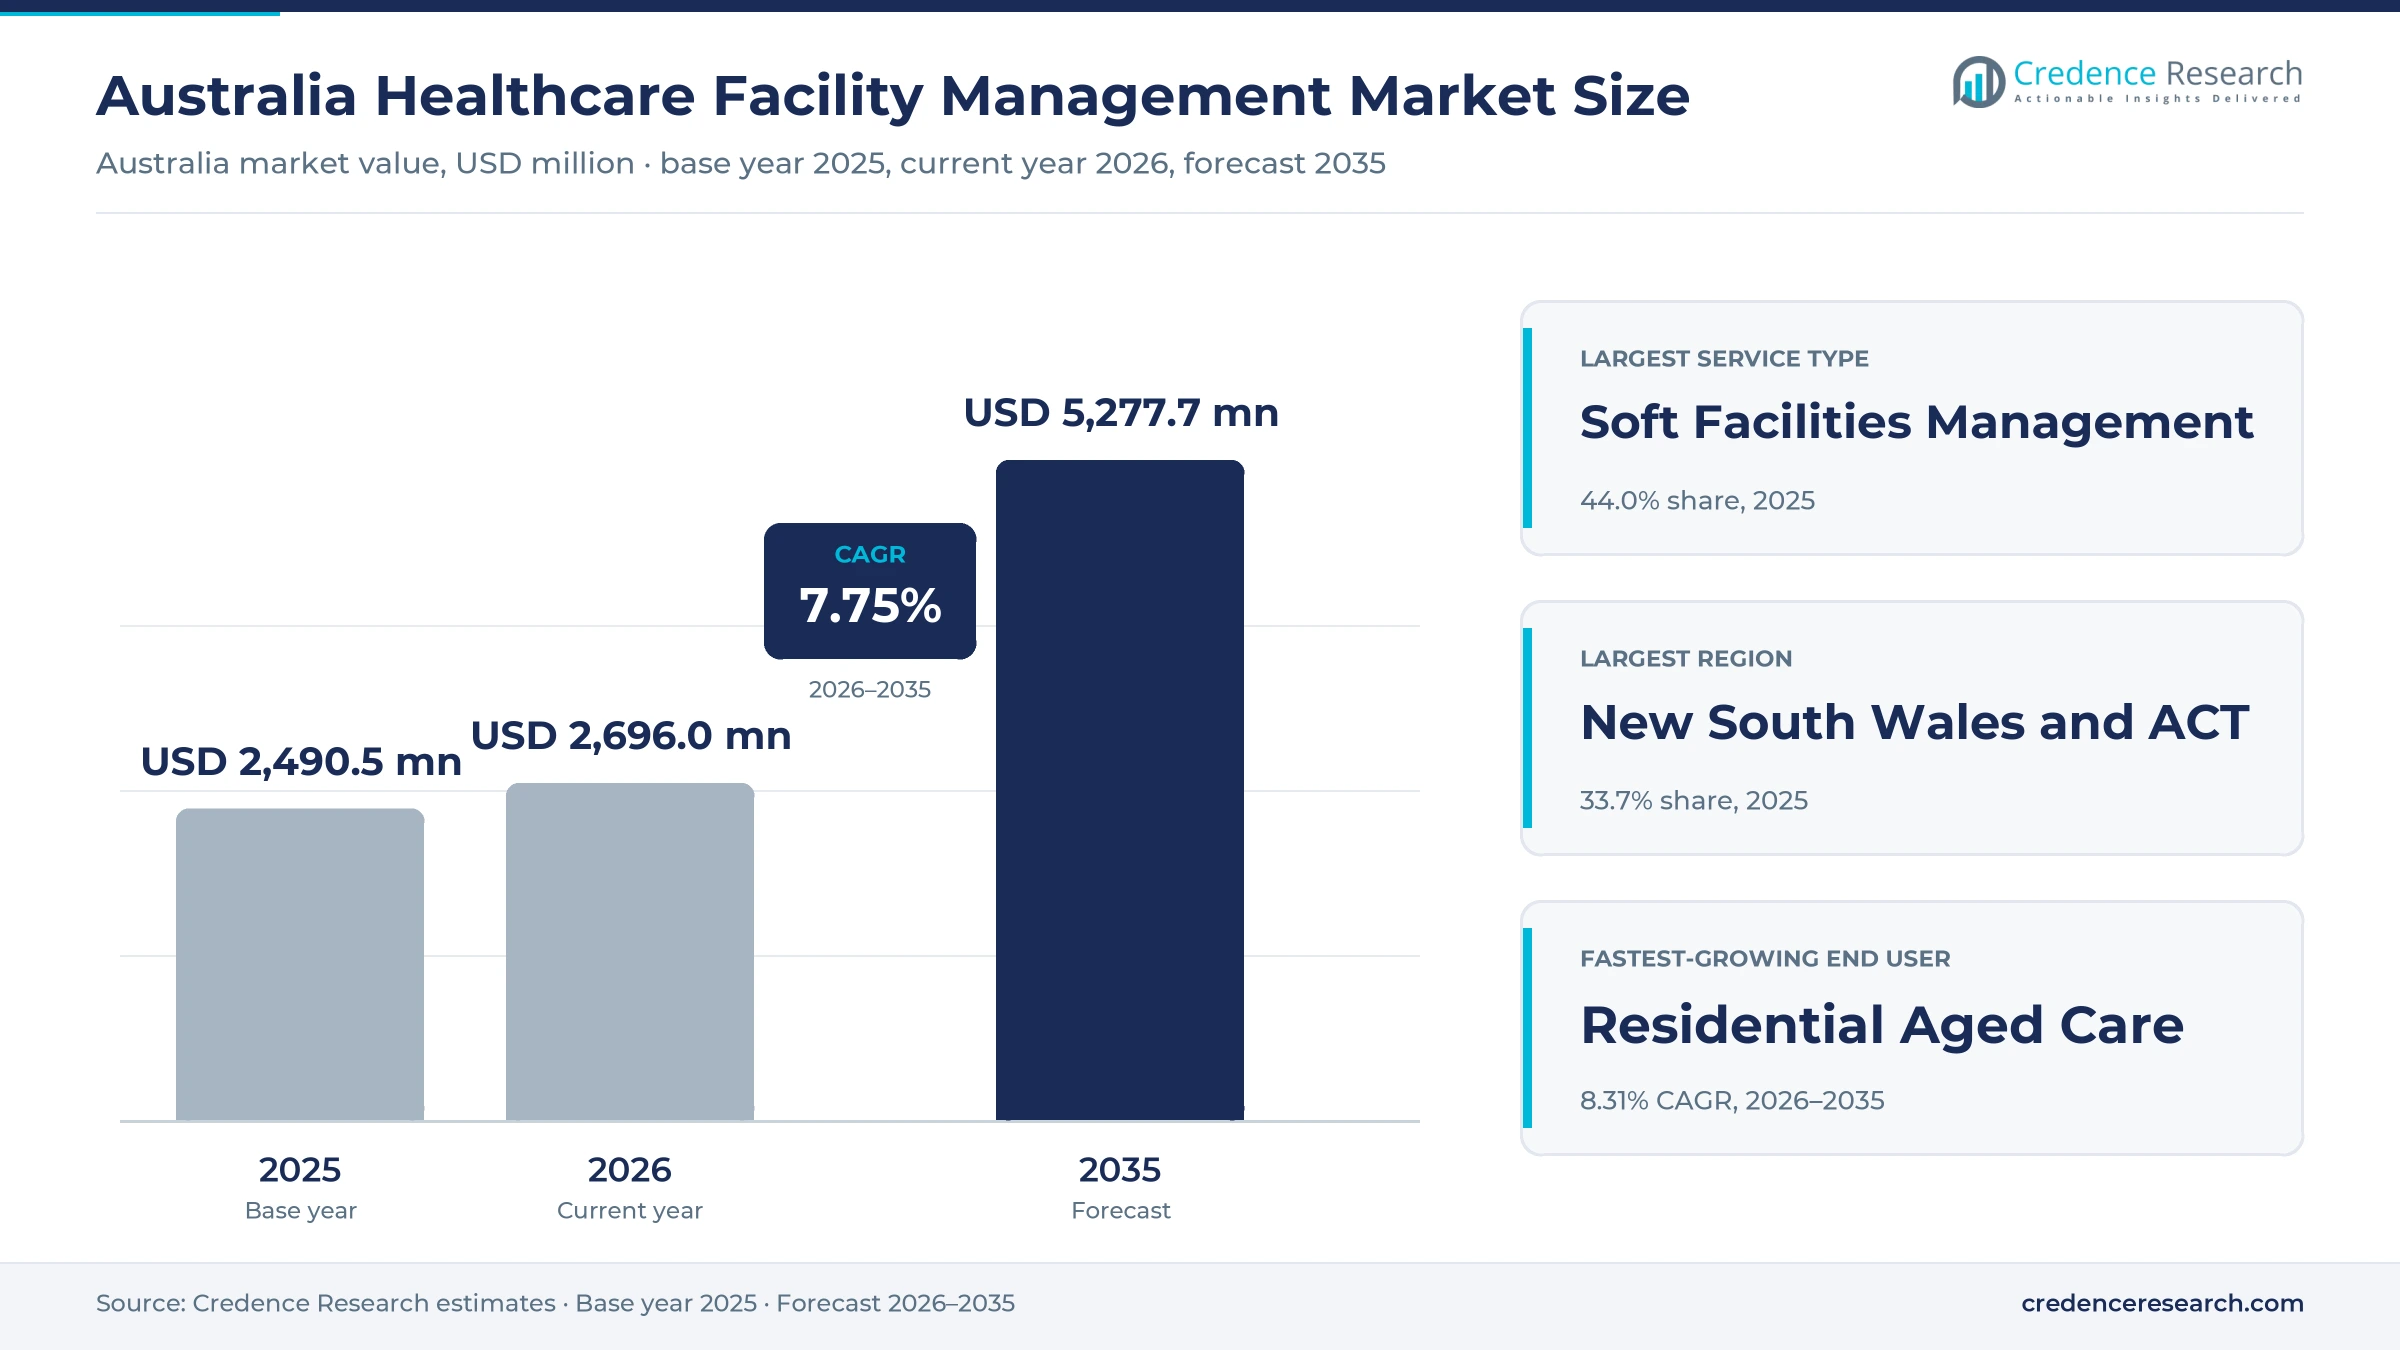
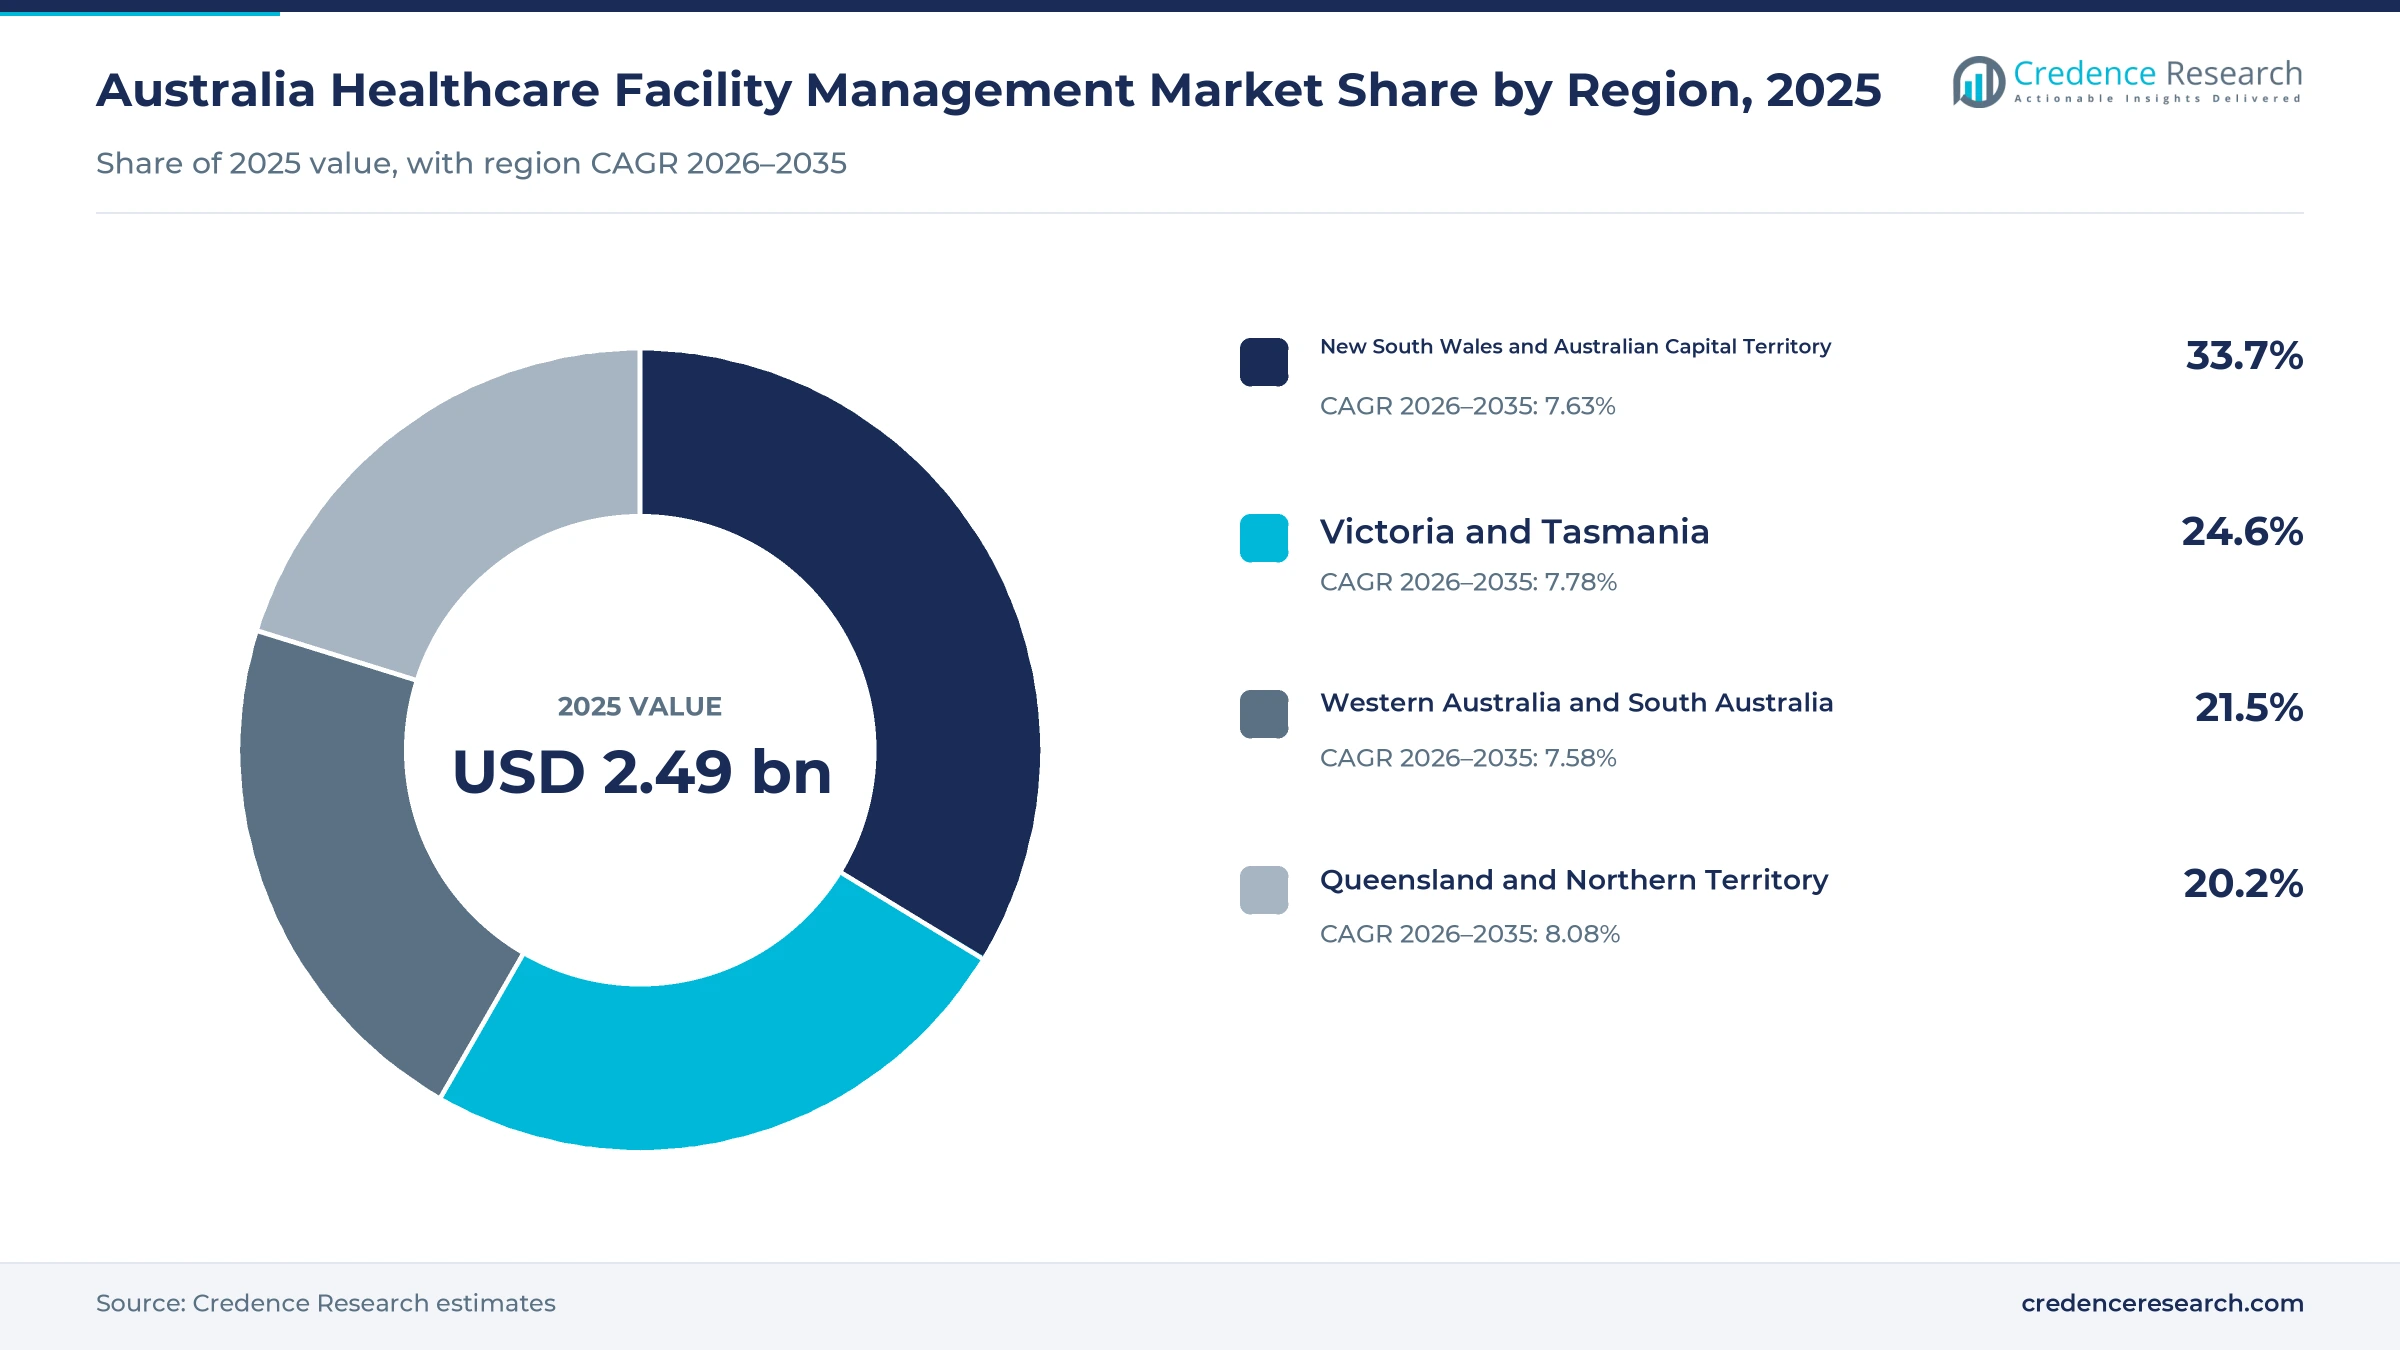
The Australia healthcare facility management market was valued at USD 2.49 billion in 2025 and is projected to increase from USD 2.70 billion in 2026 to USD 5.28 billion by 2035, registering a CAGR of 7.75% during 2026–2035. Demand comes from public and private hospitals, aged care homes and community clinics that buy cleaning, food, portering, security, maintenance and asset services to keep patient areas safe. New South Wales and the Australian Capital Territory held the largest regional share, 33.7% in 2025, because Sydney and Canberra concentrate the largest hospital estates. Queensland and the Northern Territory grow fastest at 8.08% a year, as new hospitals and wards open across growing coastal cities. Public hospitals spend heavily on support services, while aged care homes now work to strengthened quality standards. In turn, health agencies are signing longer contracts that bundle hard and soft services under one provider across many sites.
Which hospital support services are counted in Australia?
The estimate measures spending in Australia on soft services such as cleaning, food, linen, portering and security, hard services such as mechanical, electrical, fire and medical gas maintenance, integrated contracts and specialized services such as sterilization support and clinical waste handling. It covers public and private hospitals, residential aged care homes and ambulatory and community facilities that buy these services through tenders, negotiated contracts and long-term concessions. Values are stated in USD million at current prices and exclude goods and services tax.
The estimate excludes clinical care, medical equipment purchases, new construction capital works and services that hospitals deliver with their own employees. The value chain runs from equipment makers and specialist contractors through integrated service providers and concession consortia to health agencies, hospital operators and aged care providers.
Australia Healthcare Facility Management Market Insights
- The Australia healthcare facility management market was valued at USD 2.49 billion in 2025 and is projected to reach USD 5.28 billion by 2035, at a 7.75% CAGR during 2026–2035.
- New South Wales and the Australian Capital Territory held 33.7% of 2025 value, as Sydney and Canberra concentrate large hospital estates.
- Soft facilities management led service types with 44.0% of 2025 value, because cleaning, food and portering run every hour in patient areas.
- The new Footscray Hospital opened on Feb. 18, 2026, with more than 500 inpatient beds planned and maintenance under a 25-year partnership.
- Residential aged care grows fastest among end users at 8.31% a year, as homes meet strengthened quality standards from November 2025.
Soft services lead as integrated contracts grow fastest
Why do soft services lead hospital support spending?
Based on service type, the market is categorized into soft facilities management, hard facilities management, integrated facilities management and specialised healthcare facilities management. Soft Facilities Management led with 44.0% of 2025 value, because cleaning, food, linen and portering run around the clock in every ward. Integrated Facilities Management grows fastest at 8.80% a year, as health agencies merge hard and soft services under one accountable provider.
Which care settings buy the most support services?
Based on end user, the market is categorized into public hospitals, private hospitals, residential aged care and ambulatory and community facilities. Public Hospitals led with 52.0% of 2025 value, because large public campuses run emergency, surgical and inpatient services every day of the year. Residential Aged Care grows fastest at 8.31% a year, as homes upgrade cleaning, food and building upkeep under strengthened quality standards.
How do health agencies buy support services?
Based on sales channel, the market is categorized into public open tender, private competitive tender, negotiated contracting and concession procurement. Public Open Tender led with 47.0% of 2025 value, because state health agencies and local health districts must test the market for large service contracts. Concession Procurement grows fastest at 8.35% a year, as new hospitals use long partnerships that bundle maintenance and services.
| Segment Group | Leading Sub-segment | Share, 2025 | Fastest-growing Sub-segment | CAGR, 2026–2035 |
|---|---|---|---|---|
| By Service Type | Soft Facilities Management | 44.0% | Integrated Facilities Management | 8.80% |
| By End User | Public Hospitals | 52.0% | Residential Aged Care | 8.31% |
| By Sales Channel | Public Open Tender | 47.0% | Concession Procurement | 8.35% |
Request a Free Sample
Fill in your details and we'll send you a free sample report.
- Sample data tables & charts
- Research methodology
Hospital builds, patient activity and care rules lift demand
How does hospital capacity expansion lift service demand?
Hospital capacity expansion lifts service demand, because every new ward, theater and emergency department needs cleaning, food, security and maintenance from its first day. The state government will invest AUD 12.4 billion in health infrastructure over four years, including AUD 3.3 billion in 2025-26, according to the New South Wales budget. The New Bankstown Hospital alone now has total investment of AUD 2.0 billion. Queensland plans about 2,200 additional beds between 2024 and 2028 across 15 key hospital projects, including about 404 beds at Coomera. As a result, public hospitals lead end users with 52.0% of 2025 value across the country.
Why do patient activity and asset intensity raise spending?
Healthcare activity and asset intensity raise spending, because busier hospitals need more cleaning cycles, meals, patient moves and plant upkeep. There were 704 public hospitals in 2023-24, four more than a year earlier, with 67,280 available beds, according to the Productivity Commission. Total recurrent expenditure on public hospitals reached AUD 103.1 billion in 2023-24, with 94% funded by governments. Public hospitals recorded 252.4 separations per 1,000 people, and 56.1% of these were same-day patients. Consequently, soft facilities management holds the largest service share at 44.0% of 2025 value, because high turnover of beds and theaters needs frequent cleaning and portering.
How does aged care quality reform widen service scope?
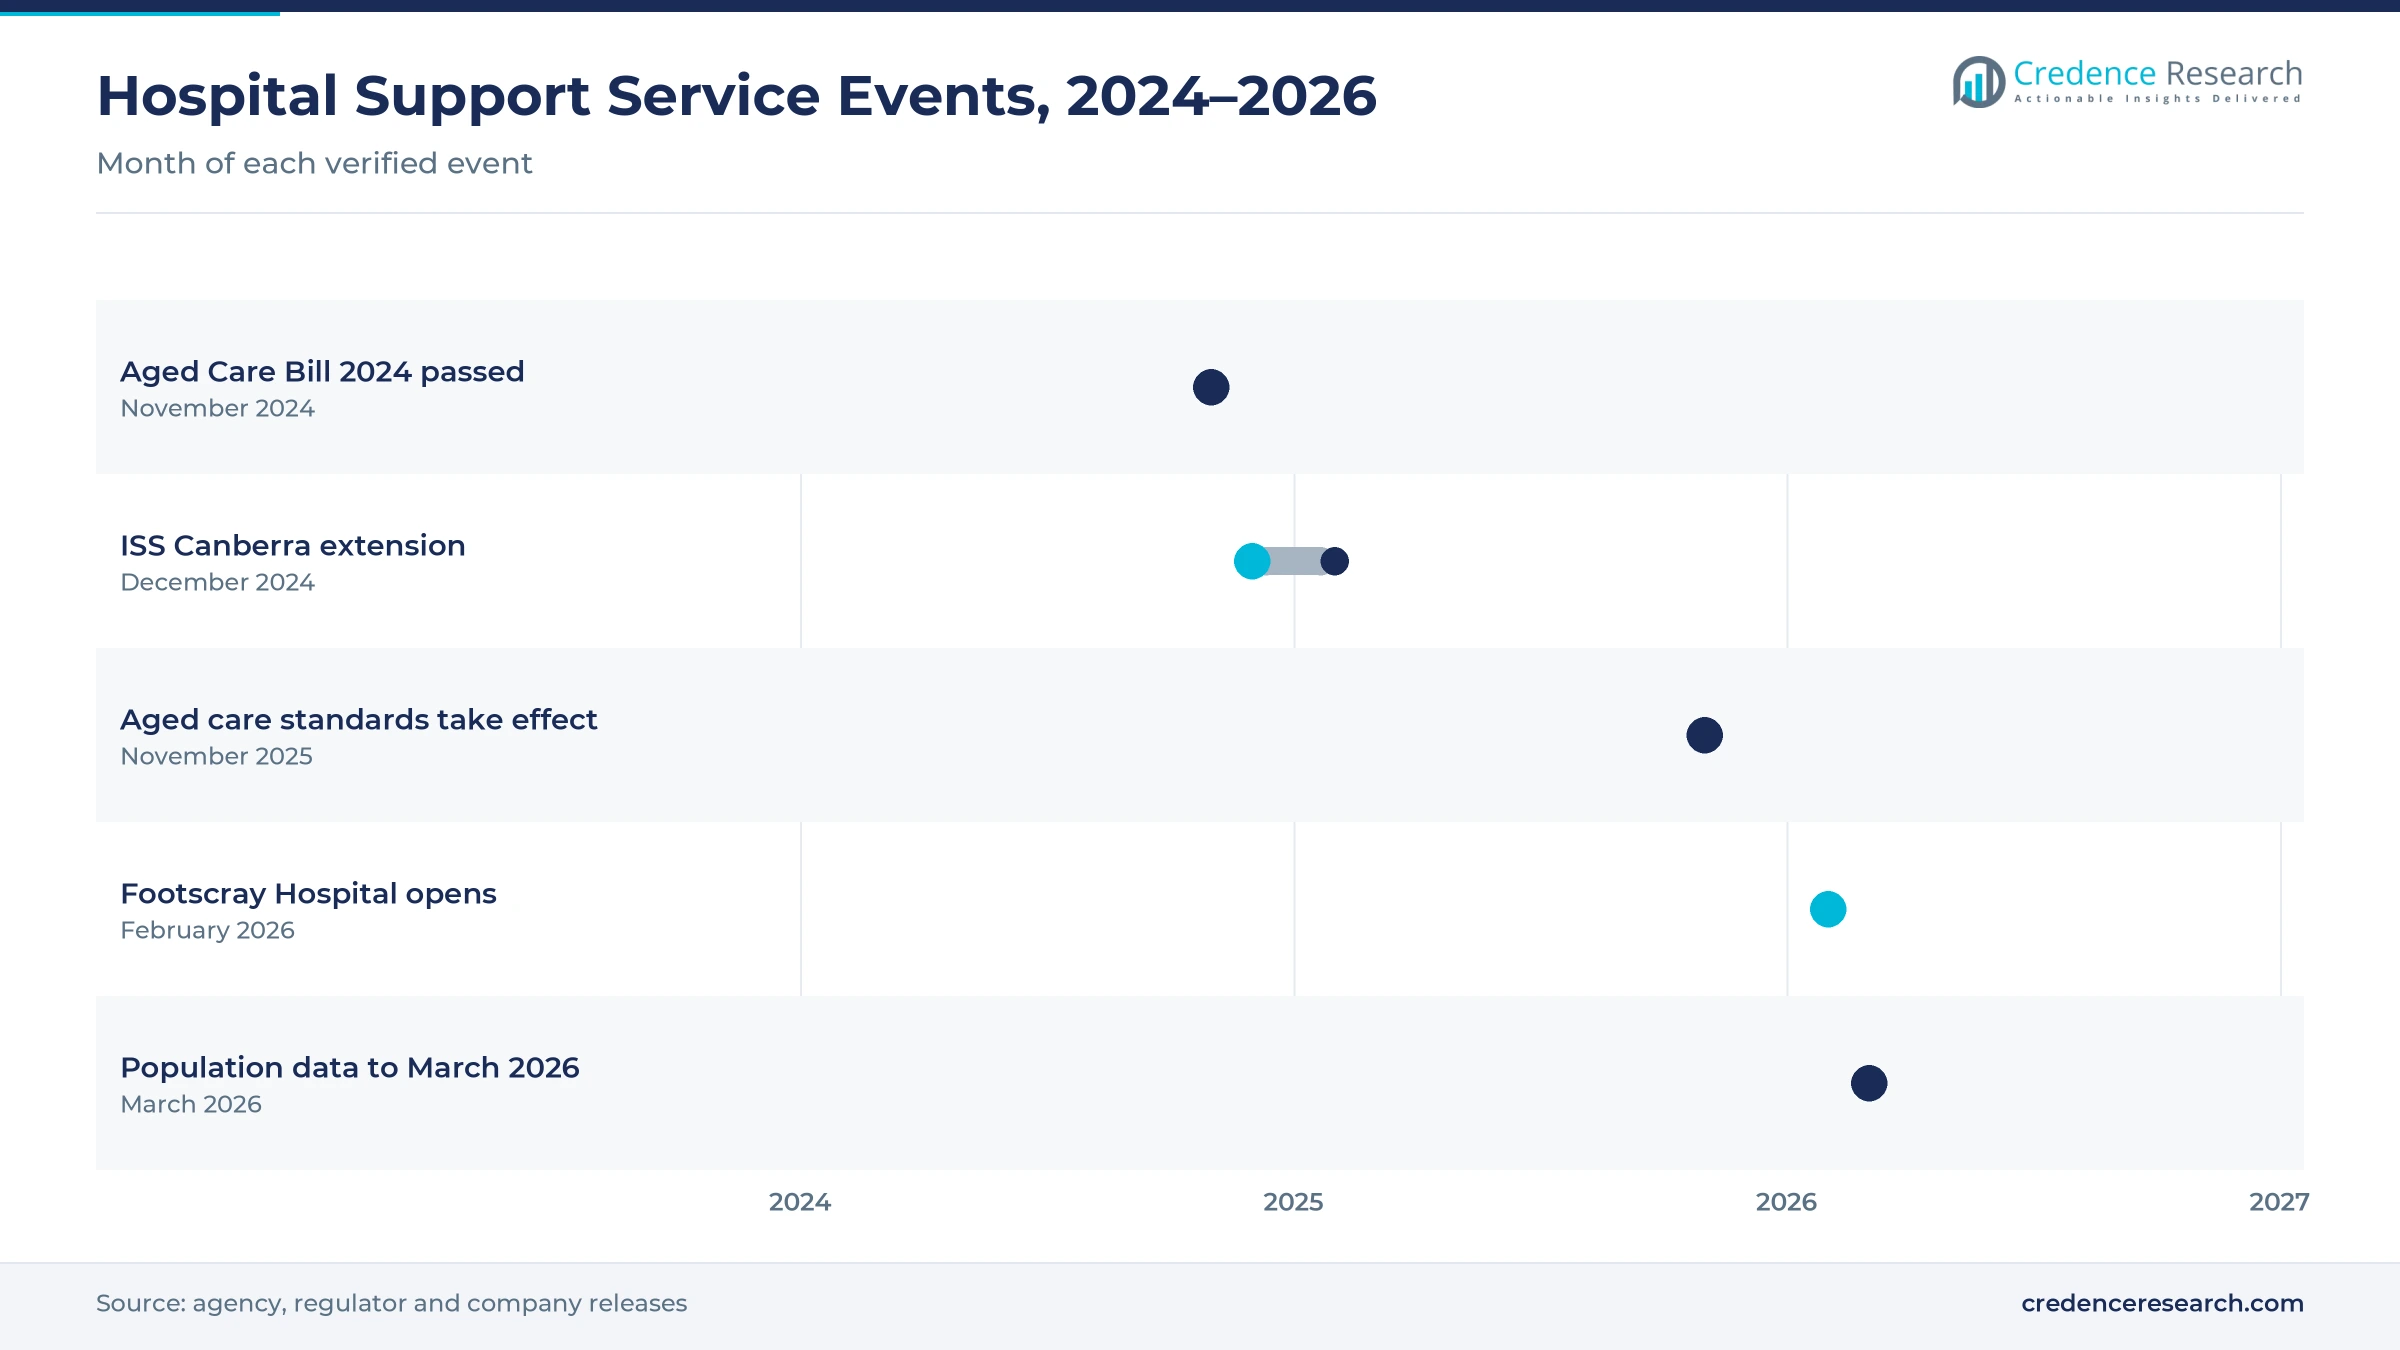
Aged care quality reform widens service scope, because homes must now show safe environments, good food and reliable building upkeep to regulators. The strengthened quality standards apply from Nov. 1, 2025, in line with the new Aged Care Act, according to the aged care quality regulator. The seven standards include a dedicated standard on the environment and another on food and nutrition. The Aged Care Bill 2024 passed Parliament on Nov. 25, 2024, which gave providers a year to prepare. Therefore, residential aged care posts the fastest end-user growth at 8.31% a year, as homes outsource aged care cleaning, catering and maintenance work.
Why does an aging population add long-term demand?
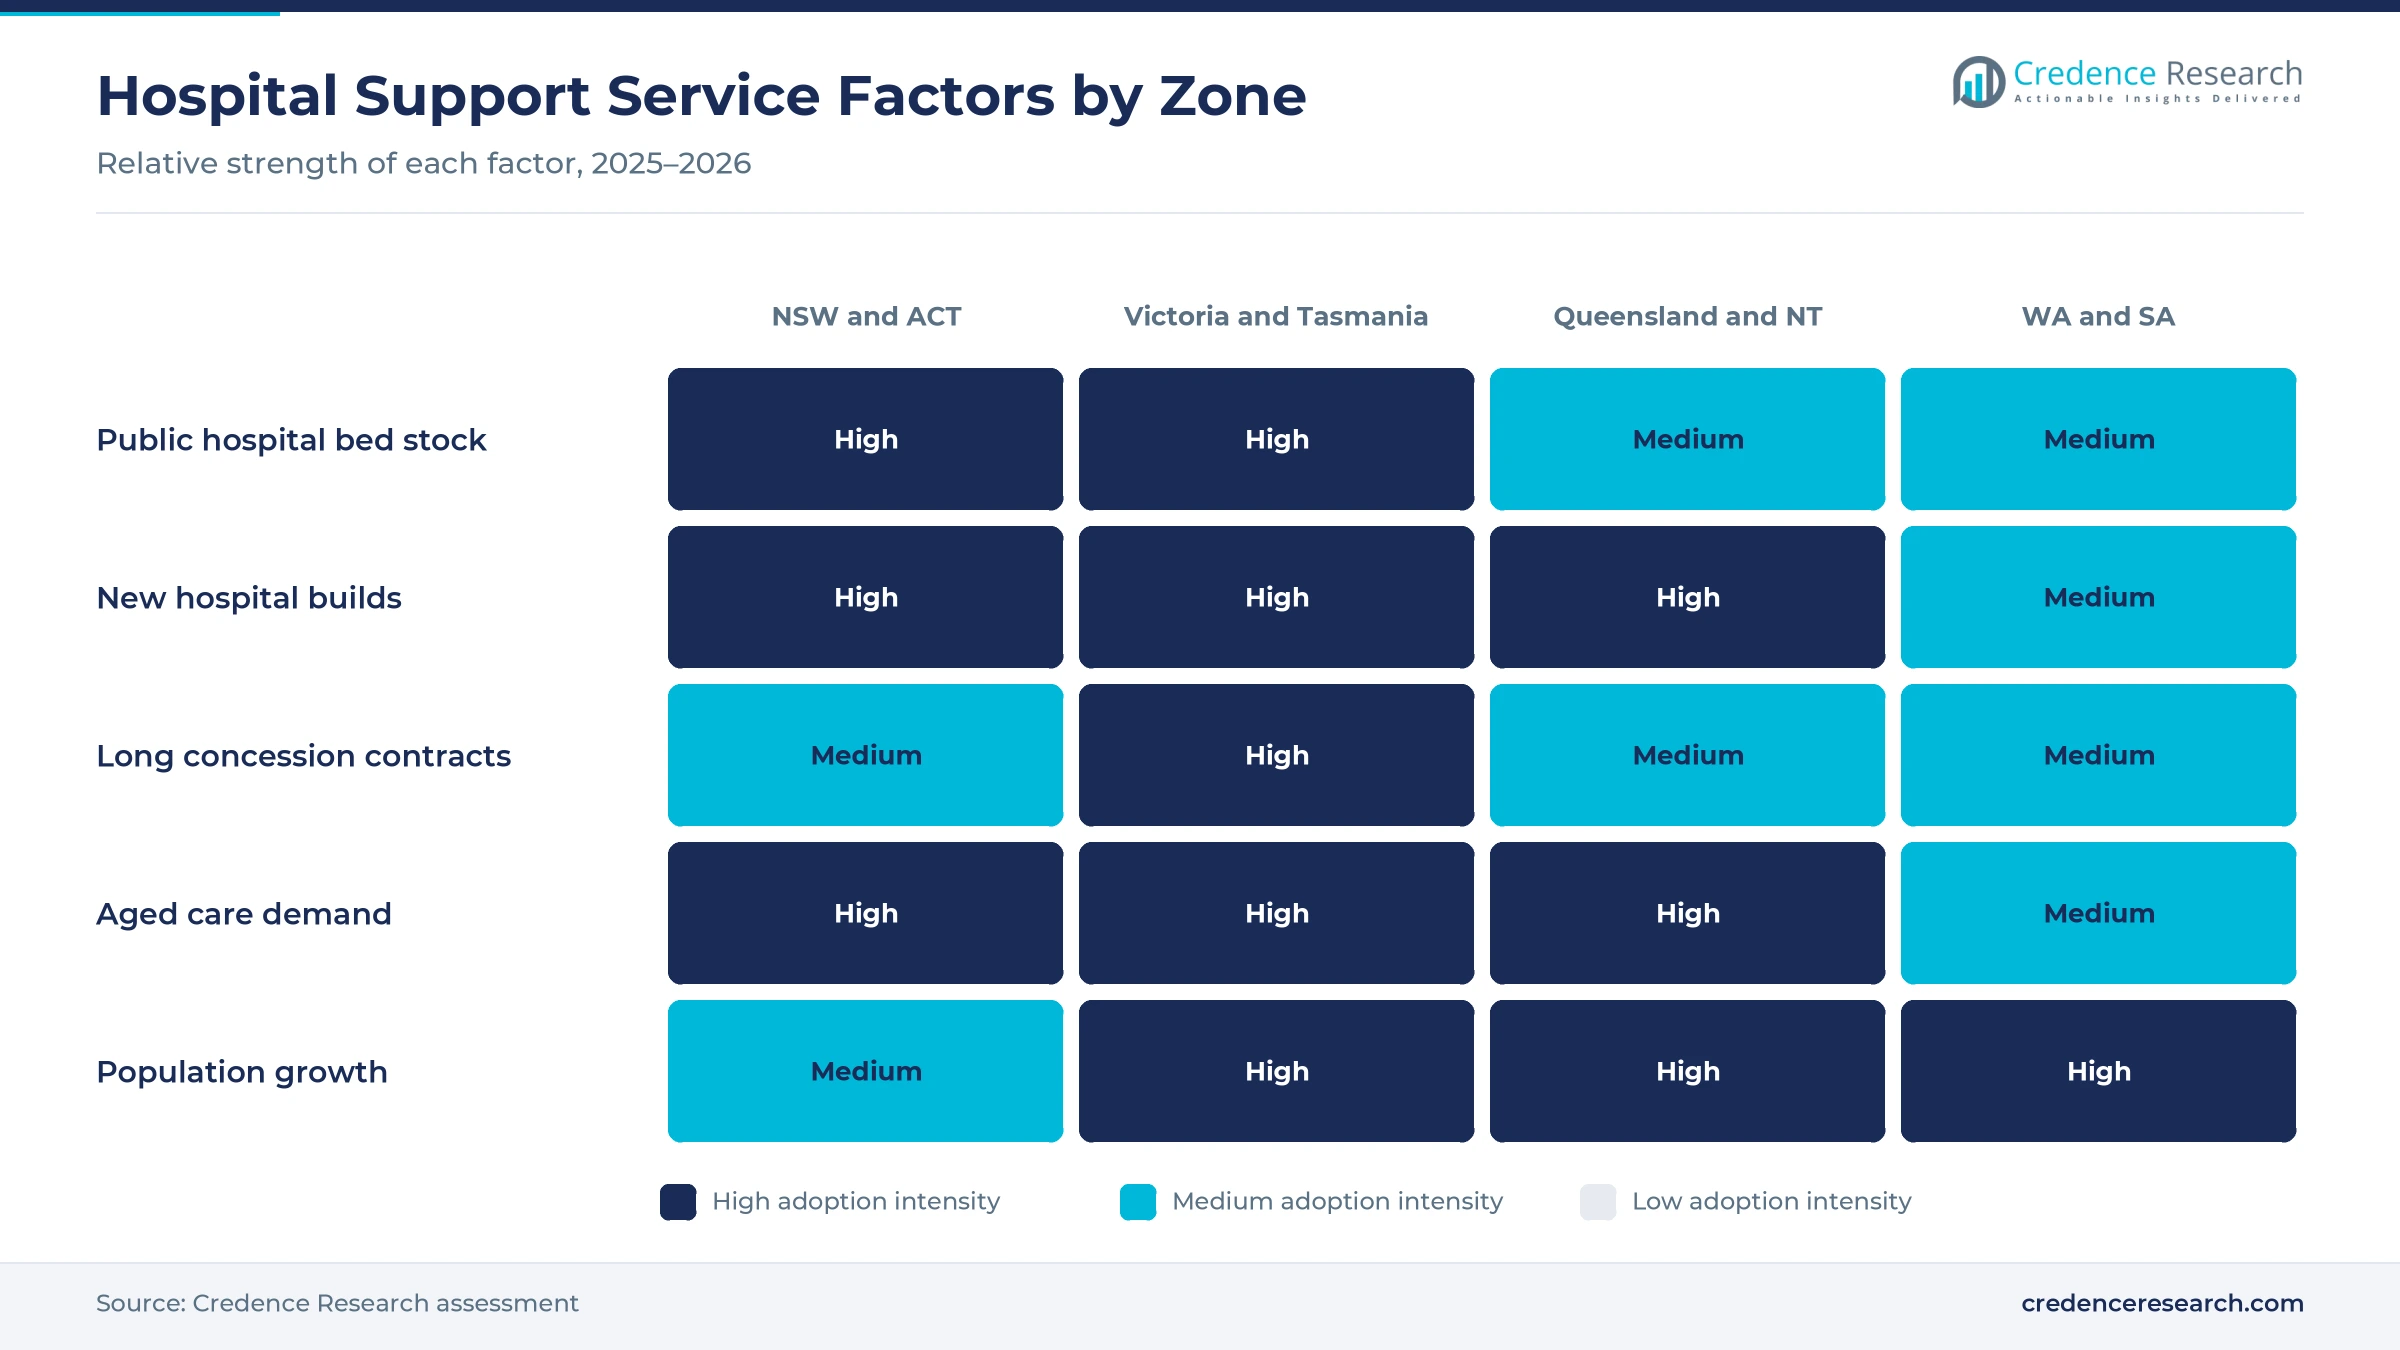
An aging population adds long-term demand, because older patients stay longer in hospital and need more aged care beds. People aged 65 and above made up 18.1% of the population in 2025, up from 17.4% in 2023, according to World Bank data. The national population also reached 27.9 million at March 31, 2026, after growth of 1.4% over the year. Western Australia grew fastest at 2.1%, which adds pressure on Perth hospitals and community clinics. As a result, demand for healthcare facility management rises in every zone, and the Queensland and Northern Territory zone posts the fastest regional growth through 2035.
Long concessions, digital workflows and aged care rise
How is the rise of long hospital concessions changing contracts?
The rise of long hospital concessions is changing contracts, because new hospitals now come with maintenance and services locked in for decades. The new Footscray Hospital opened to patients on Feb. 18, 2026, according to the state health building authority. The hospital cost more than AUD 1.5 billion and will have more than 500 inpatient beds once fully running. Its partnership runs for 25 years, with Honeywell and Compass Group named as facility and maintenance managers. Downer has also delivered integrated maintenance at the Bendigo Health partnership since 2017. Consequently, concession procurement posts the fastest channel growth at 8.35% a year.
Why is the shift to integrated multi-site contracts rising?
The shift to integrated multi-site contracts is rising, because health agencies want one accountable provider across campuses and satellite clinics. In December 2024, ISS secured a three-year extension with Canberra Health Services from February 2025, covering Canberra Hospital and 25 community health sites. Ventia holds an Austin Health integrated contract with an initial term of 10 years, covering three campuses and six satellite sites. BGIS also delivers integrated hard services, helpdesk and asset planning across 35 Healthscope hospitals and facilities in five states and territories. As a result, integrated facilities management grows fastest among service types at 8.80% a year during 2026–2035.
Can digital workflows open savings for hospital operators?
Digital workflows open a clear opening, because hospitals can track cleaning, patient moves and repairs in real time. Downer delivers more than 4.2 million hours of support services at healthcare facilities each year and supports about 500,000 patients annually. ISS uses its Pure Space Health method and Winnow food waste systems at South Australian hospitals, including Flinders Medical Centre and Modbury Hospital. Public hospitals also run 67,280 beds, so small time savings per bed add up across the estate. In turn, healthcare facility management providers that link hospital linen supply and cleaning data to bed management systems can win longer contracts and stronger renewal positions.
Is there room to grow in community and ambulatory sites?
Community and ambulatory sites offer a second opening, because more care now moves out of large campuses into clinics and same-day centers. Same-day patients made up 56.1% of public hospital separations in 2023-24, which favors smaller procedure sites. The Canberra contract alone covers 25 satellite community health sites from February 2025. Queensland has also opened seven satellite health centers under its capacity program, which spreads outpatient services across more small sites outside the main hospital campuses. Consequently, ambulatory and community facilities need regular cleaning, medical waste handling and building upkeep, which favors healthcare facility management providers with mobile teams, shared helpdesks and flexible rosters across many small sites.
Labor costs, budgets and infection rules test providers
How do labor costs squeeze fixed-fee contracts?
Labor costs squeeze fixed-fee contracts, because cleaners, food staff, porters and technicians make up most service spending in hospitals. Award wage rises and shortages of trade staff raise costs faster than many contract indexation clauses allow. As a result, providers that cannot pass on costs accept lower margins or exit work. Mitigation comes from better rostering, digital work orders and longer contracts with fair price review terms.
Why do tight health budgets limit service scope?
Tight health budgets limit service scope, because state agencies must fund clinical staff and new beds before support services. Government real recurrent expenditure per person fell slightly in 2023-24, which shows budget pressure across the system. Consequently, agencies push providers for lower prices or narrower service lists at each tender. Providers respond by offering measured savings in energy, waste and labor time over the contract term.
How do infection control rules raise delivery costs?
Infection control rules raise delivery costs, because hospital cleaning must meet strict frequency, audit and chemical standards in every ward. Outbreaks of resistant infections can force extra deep cleans and room closures at short notice. In turn, providers need trained staff, validated products and audit tools on every shift. Those that invest in training and contract cleaning quality systems reduce penalty risk.
Will contract transitions disrupt patient services?
Contract transitions can disrupt patient services, because large hospital portfolios change providers in one step after tenders. Staff transfers, asset data handover and new reporting systems all create risk in the first months. As a result, health agencies often plan long transition periods before a new provider starts work. Careful mobilization plans and early asset audits reduce service gaps for patients and clinical staff.
Sydney and Canberra lead as Queensland adds beds fastest
| Region | Value, 2025 (USD billion) | Share, 2025 | CAGR, 2026–2035 |
|---|---|---|---|
| New South Wales and Australian Capital Territory | 0.84 | 33.7% | 7.63% |
| Victoria and Tasmania | 0.61 | 24.6% | 7.78% |
| Western Australia and South Australia | 0.54 | 21.5% | 7.58% |
| Queensland and Northern Territory | 0.50 | 20.2% | 8.08% |
Why do New South Wales and Canberra lead service spending?
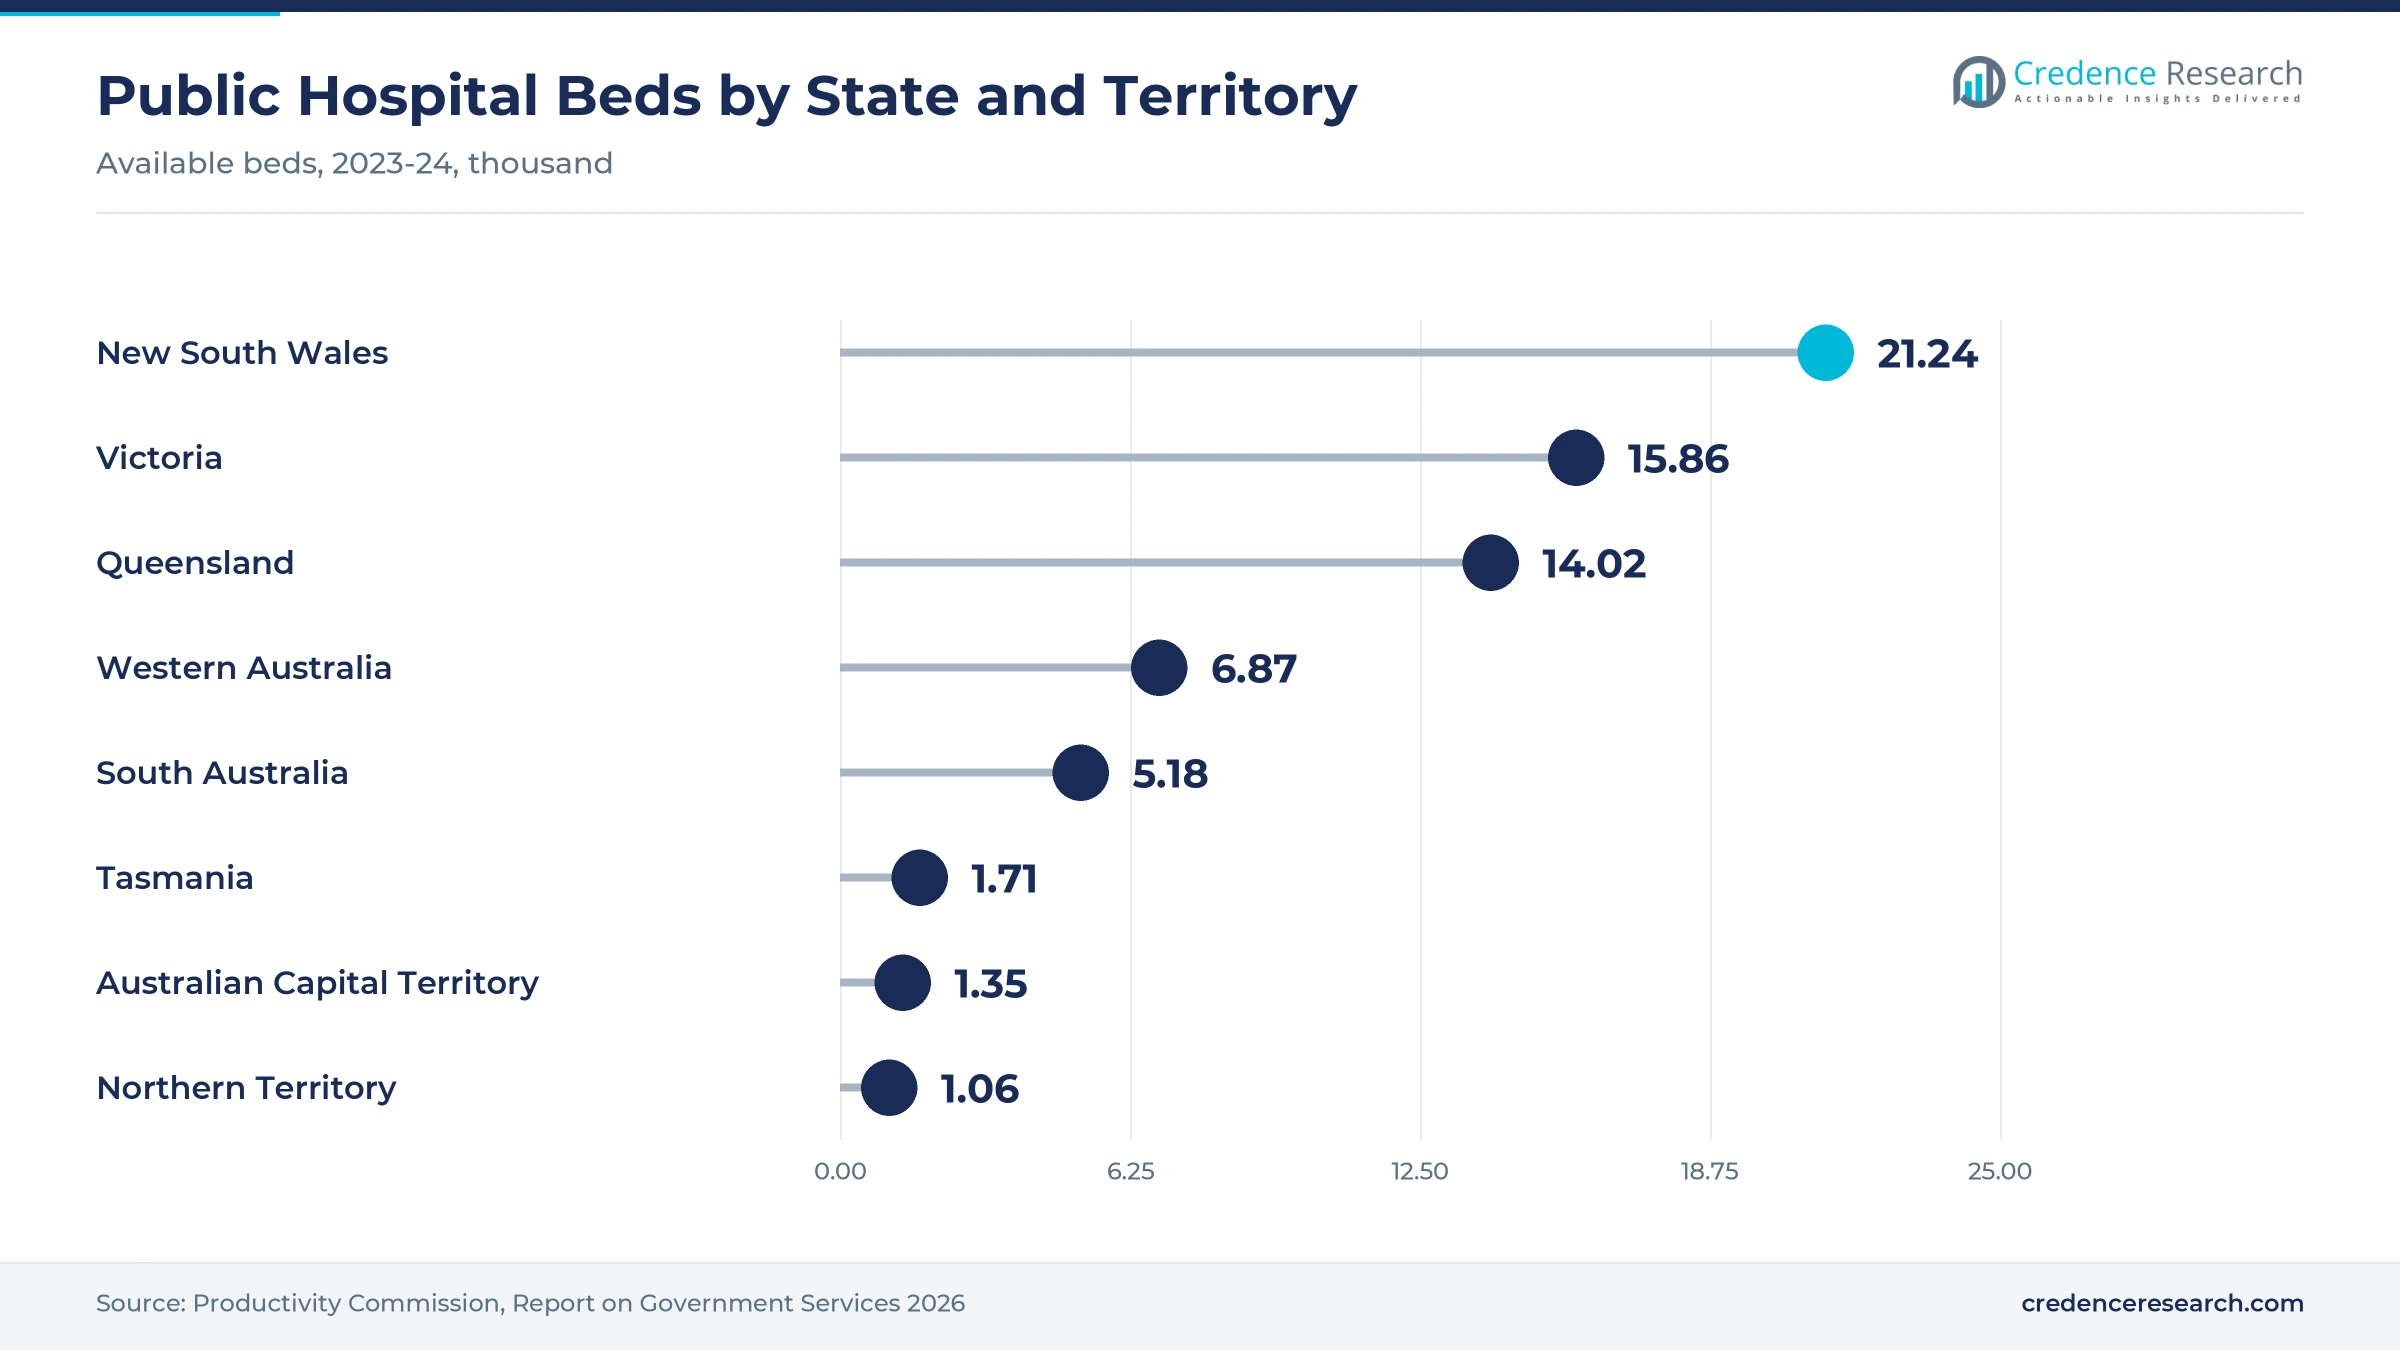
New South Wales and the Australian Capital Territory held a 33.7% share of 2025 value and grow at 7.63% a year. New South Wales ran 226 public hospitals with 21,238 available beds in 2023-24, the largest estate of any state. The capital territory added 1,345 beds, and ISS serves Canberra Hospital under a contract extended from February 2025. As a result, this zone keeps the largest share through 2035.
How does Victoria anchor long hospital partnerships?
Victoria and Tasmania held a 24.6% share of 2025 value and grow at 7.78% a year, because Melbourne hosts large public hospital campuses. Victoria ran 159 public hospitals with 15,856 beds in 2023-24, while Tasmania added 1,712 beds. The new Footscray Hospital opened on Feb. 18, 2026, under a 25-year partnership. Consequently, this zone holds a high share of long concession contracts.
Why are Queensland and the Northern Territory growing fastest?
Queensland and the Northern Territory held a 20.2% share of 2025 value and grow fastest at 8.08% a year. Queensland ran 123 public hospitals with 14,021 beds in 2023-24, while the Northern Territory had 4.2 beds per 1,000 people, the highest rate nationally. The state plans about 2,200 additional beds between 2024 and 2028. In turn, new hospitals at Coomera, Toowoomba and Bundaberg add service work.
How do Western and South Australia add service work?
Western Australia and South Australia held 21.5% of 2025 value and grow at 7.58% a year. Western Australia ran 89 public hospitals with 6,871 beds, while South Australia ran 75 hospitals with 5,180 beds in 2023-24. Serco signed a six-year extension at Fiona Stanley Hospital in Perth in March 2020. ISS has served SA Health hospitals for 25 years, so this zone keeps steady outsourced demand.
Hospital openings, contract renewals and care rules
| Development | Status and market relevance |
|---|---|
| In November 2024, Parliament passed the Aged Care Bill 2024, setting up the new rights-based aged care law. | Strengthened quality standards apply from November 2025 |
| In December 2024, ISS secured a three-year extension with Canberra Health Services from February 2025. | Covers Canberra Hospital and 25 community health sites |
| In October 2024, ISS marked 25 years of support services at SA Health hospitals, including Flinders Medical Centre. | Covers cleaning, patient transport and food waste programs |
| In November 2025, strengthened aged care quality standards took effect in line with the new Aged Care Act. | Seven standards include environment and food |
| In February 2026, the new Footscray Hospital opened to patients under a 25-year partnership. | More than 500 inpatient beds once fully running |
Digital work orders and predictive upkeep reshape service
- Digital work order platforms route cleaning, portering and repair tasks to staff phones, which shortens response times and gives hospitals audit-ready service records.
- Predictive asset management uses sensor and maintenance data to forecast failures in chillers, lifts and medical gas plant, which protects theaters and wards from outages.
- Food waste tracking systems weigh and classify plate and kitchen waste, which helps hospitals cut food costs and meet sustainability targets.
- Validated cleaning methods combine audited routines, approved chemicals and surface testing, which helps providers prove infection control performance to health agencies.
Need a Custom Version of This Report?
Tailor the scope, geography, or segments to your exact requirements.
- Custom geography or segment scope
- Direct access to our analyst team
Integrated providers compete for hospital portfolios
Competition combines integrated service groups, global facility firms and catering specialists that bid for hospital and aged care portfolios. ISS serves Canberra Hospital and 25 community sites and has worked with SA Health for 25 years. Ventia runs an integrated contract across three Austin Health campuses and six satellite sites. Downer has delivered integrated maintenance at Bendigo Health since 2017 and supports about 500,000 patients a year. Compass Group and Honeywell maintain the new Footscray Hospital under a 25-year partnership. Serco runs support services at Fiona Stanley Hospital, while BGIS serves 35 Healthscope hospitals and facilities. CBRE added health infrastructure project skills through its purchase of Aurora. Companies compete on infection control results, safety records, workforce scale, digital reporting and price.
Companies profiled and their roles in this market
| Company | Type | Role in the market |
|---|---|---|
| ISS | Integrated provider | Canberra Hospital and 25 community sites from February 2025; SA Health hospitals |
| Ventia | Integrated provider | Austin Health contract across three campuses and six satellite sites |
| Downer | Integrated provider | Bendigo Health partnership maintenance since 2017 |
| Compass Group | Soft services and maintenance provider | Footscray Hospital partnership with Honeywell for 25 years |
| Serco | Integrated provider | Support services at Fiona Stanley Hospital in Perth |
| BGIS | Hard services provider | Integrated services across 35 Healthscope hospitals and facilities |
| CBRE | Project and property services | Health infrastructure project skills from the Aurora purchase |
Credence Research view on hospital support services
Credence Research's view is that Australian healthcare facility management spending will grow strongly through 2035, as new hospitals, busier wards and aged care reform push agencies toward larger bundled contracts. Soft services should keep the largest share, while integrated contracts gain most as agencies seek one accountable provider. Aged care will add the fastest new work as homes meet strengthened standards. However, labor costs and tight budgets will favor providers with large trained workforces, digital reporting and proven infection control results.
How the hospital support service estimate was built
The report uses 2025 as the base year, with values in USD million at current prices. Market values come from the Credence Research model, which combines hospital beds, patient activity, aged care places, service spending per bed and contract activity. Regional shares follow the client zone split, and segment splits by service type, end user and sales channel are Credence Research estimates. Sources used are official statistics, government budget papers, regulator releases, company statements and news reports, and no interviews or surveys were used.
New hospitals and aged care standards shape 2035
The market is expected to reach USD 5.28 billion by 2035, a 7.75% CAGR during 2026–2035, as new hospitals open and aged care homes meet stricter standards. Growth should be strongest in integrated contracts, residential aged care and the Queensland and Northern Territory zone, while New South Wales and the capital territory keep the largest share. Long concessions will lock in service volume for decades after each hospital opens. In contrast, tight state budgets could slow tenders for smaller sites.
Frequently Asked Questions
How big is the Australia healthcare facility management market?
Which region leads hospital support service spending?
Which region grows fastest?
Which service type holds the largest share?
How does aged care reform affect the market?
Which service type grows fastest?
Who are the leading companies in this market?
What are the main risks to growth?
Table of Content
Chapter 1 Market Segmentation
- 1.1 Segmentation Framework
- 1.1.1 Product and Service Classification
- 1.1.2 Application and End-Use Classification
- 1.1.3 Technology and Solution Classification
- 1.1.4 Customer and Distribution Channel Classification
- 1.1.5 Geographic Segmentation
- 1.1.6 Market Segment Definitions and Boundaries
- 1.2 By Service Type
- 1.2.1 Soft Facilities Management
- 1.2.2 Hard Facilities Management
- 1.2.3 Integrated Facilities Management
- 1.2.4 Specialised Healthcare Facilities Management
- 1.3 By End User
- 1.3.1 Public Hospitals
- 1.3.2 Private Hospitals
- 1.3.3 Residential Aged Care
- 1.3.4 Ambulatory and Community Facilities
- 1.4 By Sales Channel
- 1.4.1 Public Open Tender
- 1.4.2 Private Competitive Tender
- 1.4.3 Negotiated Contracting
- 1.4.4 Concession Procurement
Chapter 2 Introduction
- 2.1 Report Objectives and Scope
- 2.2 Product Definition and Industry Terminology
- 2.3 Market Inclusions and Exclusions
- 2.4 Research Process
- 2.4.1 Primary Research and Expert Interviews
- 2.4.2 Secondary Research and Source Review
- 2.4.3 Top-Down and Bottom-Up Estimation
- 2.4.4 Data Triangulation and Verification
- 2.5 Market Size Measurement Basis
- 2.5.1 2025: USD 2.49 billion → 2035: USD 5.28 billion
- 2.6 Historical and Forecast Reference Periods
- 2.6.1 Historical Period: 2018-2025
- 2.6.2 Base Year: 2025
- 2.6.3 Forecast Period: 2025-2035
- 2.7 Research Assumptions and Limitations
Chapter 3 Executive Summary
- 3.1 Market Snapshot and Key Findings
- 3.2 Base-Year Market Size, 2025
- 3.3 Forecast Market Size, 2035
- 3.4 Revenue and Volume Growth Outlook
- 3.5 Key Demand and Supply Indicators
- 3.6 Leading Market Segments
- 3.7 Fastest-Growing Market Opportunities
- 3.8 Regional Performance Highlights
- 3.9 Technology and Industry Transformation
- 3.10 Competitive Landscape Summary
- 3.11 Analyst View and Strategic Implications
Chapter 4 Australia Healthcare Facility Management Market Trends and Developments
- 4.1 Historical Industry Development, 2018-2025
- 4.2 Recent Market Trends and Developments
- 4.3 Demand and Customer Behavior Trends
- 4.4 Technology and Product Innovation
- 4.5 Artificial Intelligence, Automation and Digitalization
- 4.6 Local Manufacturing and Supply Chain Realignment
- 4.7 Industry Partnerships, Mergers and Acquisitions
- 4.8 Sustainability and Circular Economy Developments
- 4.9 Government and Private Sector Investment Trends
- 4.10 Emerging Business Models and Commercialization
- 4.11 Industry Developments and Announcements
Chapter 5 Australia Healthcare Facility Management Market Production, Supply and Demand Analysis
- 5.1 Demand Trend and Consumption Analysis, 2018-2025
- 5.2 Demand Forecast, 2025-2035
- 5.3 Production and Output Trend, 2018-2025
- 5.4 Production and Output Forecast, 2025-2035
- 5.5 Installed Capacity and Capacity Utilization
- 5.6 Company-Wise Production Plants and Statistics
- 5.6.1 Installed Production Capacity
- 5.6.2 Actual Production
- 5.6.3 Planned Capacity and Expansion Targets
- 5.7 Supply Chain Structure and Procurement Trends
- 5.8 Supply-Demand Gap and Bottlenecks
- 5.9 Import Dependence and Sourcing Structure
- 5.10 Contract Manufacturing and Outsourcing
- 5.11 Regional Supply and Demand Concentration
Chapter 6 Australia Healthcare Facility Management Market Pricing Analysis
- 6.1 Pricing Structure and Measurement
- 6.2 Historical Pricing Trends, 2018-2025
- 6.3 Pricing Outlook, 2025-2035
- 6.4 Average Selling Price and Unit Economics
- 6.5 Pricing by Product and Market Segment
- 6.6 Geographic Pricing Differences
- 6.7 Key Input, Energy, Labor and Logistics Costs
- 6.8 Contract Pricing and Purchasing Models
- 6.9 Pricing Sensitivity and Competitive Positioning
- 6.10 Price, Margin and Profitability Implications
Chapter 7 Australia Healthcare Facility Management Market Dynamics
- 7.1 Market Growth Drivers
- 7.1.1 Demand-Side Drivers
- 7.1.2 Technology and Innovation Drivers
- 7.1.3 Infrastructure and Investment Drivers
- 7.1.4 Regulatory and Policy Drivers
- 7.2 Market Restraints
- 7.2.1 Cost and Affordability Constraints
- 7.2.2 Technology and Adoption Barriers
- 7.2.3 Supply Chain and Operational Constraints
- 7.3 Market Challenges
- 7.3.1 Competitive Pressure and Margin Erosion
- 7.3.2 Skills, Infrastructure and Implementation Gaps
- 7.4 Emerging Market Opportunities
- 7.5 Market Dynamics Impact and Time-Horizon Assessment
Chapter 8 Australia Healthcare Facility Management Value Chain Analysis
- 8.1 Industry Value Chain Overview
- 8.2 Upstream Suppliers and Critical Inputs
- 8.3 Technology and Component Providers
- 8.4 Manufacturing or Service Delivery
- 8.5 Distribution, Channel Partners and Integrators
- 8.6 Downstream Applications and End Users
- 8.7 Value Addition and Profit Pools
- 8.8 Vertical Integration and Outsourcing
- 8.9 Supplier Concentration and Risk
- 8.10 Supply Chain Localization and Resilience
Chapter 9 Australia Healthcare Facility Management Market Regulations and Policies
- 9.1 Relevant Laws, Standards and Compliance Frameworks
- 9.2 Product, Service, Safety and Quality Requirements
- 9.3 Government Policies, Incentives and Subsidies
- 9.4 Imports, Exports and Trade Barriers
- 9.5 Public Procurement and Local Content Requirements
- 9.6 Environmental and Sustainability Compliance
- 9.7 Upcoming Policy Changes and Market Implications
Chapter 10 Australia Healthcare Facility Management Market Hotspots and Opportunities
- 10.1 Market Opportunity Mapping and Growth Hotspots
- 10.2 High-Growth Applications and Customer Groups
- 10.3 Underserved Markets and White-Space Opportunities
- 10.4 Emerging Technology and Product Opportunities
- 10.5 New Capacity and Investment Hotspots
- 10.6 Market Entry and Expansion Opportunities
- 10.7 Distribution and Partnership Opportunities
- 10.8 Near-Term and Long-Term Commercial Potential
- 10.9 Opportunity Attractiveness and Execution Risks
Chapter 11 Australia Healthcare Facility Management Market Outlook, 2025-2035
- 11.1 Market Size and Analysis
- 11.1.1 Revenue (Market Measurement: 2025: USD 2.49 billion → 2035: USD 5.28 billion)
- 11.1.2 Market Volume and Quantity Sold
- 11.1.3 Historical Market Size, 2018-2025
- 11.1.4 Base-Year Market Size, 2025
- 11.2 Market Forecast, 2025-2035
- 11.2.1 Revenue Forecast to 2035
- 11.2.2 Volume Forecast to 2035
- 11.2.3 CAGR and Year-on-Year Growth
- 11.2.4 Incremental Revenue Opportunity
- 11.3 Forecast Assumptions and Scenario Analysis
- 11.3.1 Base-Case Forecast
- 11.3.2 Optimistic and Conservative Scenarios
- 11.3.3 Technology, Pricing and Policy Sensitivities
- 11.4 Market Attractiveness and Growth Outlook
Chapter 12 Australia Healthcare Facility Management Market Segmentation and Outlook
- 12.1 Segmentation Summary and Market Shares, 2025
- 12.2 Largest and Fastest-Growing Segments
- 12.3 By Service Type - Market Size and Forecast, 2025-2035
- 12.3.1 Segment Definition and Scope
- 12.3.2 Historical Market Size, 2018-2025
- 12.3.3 Revenue Forecast, 2025-2035
- 12.3.4 Volume Forecast, 2025-2035
- 12.3.5 Base-Year Market Share, 2025
- 12.3.6 Segment CAGR and Growth Drivers
- 12.3.7 Subsegment Market Size and Forecast
- 12.3.7.1 Soft Facilities Management
- 12.3.7.2 Hard Facilities Management
- 12.3.7.3 Integrated Facilities Management
- 12.3.7.4 Specialised Healthcare Facilities Management
- 12.3.8 Subsegment Pricing and Adoption Trends
- 12.3.9 Leading Suppliers and Competition
- 12.3.10 Regional Demand and Opportunities
- 12.4 By End User - Market Size and Forecast, 2025-2035
- 12.4.1 Segment Definition and Scope
- 12.4.2 Historical Market Size, 2018-2025
- 12.4.3 Revenue Forecast, 2025-2035
- 12.4.4 Volume Forecast, 2025-2035
- 12.4.5 Base-Year Market Share, 2025
- 12.4.6 Segment CAGR and Growth Drivers
- 12.4.7 Subsegment Market Size and Forecast
- 12.4.7.1 Public Hospitals
- 12.4.7.2 Private Hospitals
- 12.4.7.3 Residential Aged Care
- 12.4.7.4 Ambulatory and Community Facilities
- 12.4.8 Subsegment Pricing and Adoption Trends
- 12.4.9 Leading Suppliers and Competition
- 12.4.10 Regional Demand and Opportunities
- 12.5 By Sales Channel - Market Size and Forecast, 2025-2035
- 12.5.1 Segment Definition and Scope
- 12.5.2 Historical Market Size, 2018-2025
- 12.5.3 Revenue Forecast, 2025-2035
- 12.5.4 Volume Forecast, 2025-2035
- 12.5.5 Base-Year Market Share, 2025
- 12.5.6 Segment CAGR and Growth Drivers
- 12.5.7 Subsegment Market Size and Forecast
- 12.5.7.1 Public Open Tender
- 12.5.7.2 Private Competitive Tender
- 12.5.7.3 Negotiated Contracting
- 12.5.7.4 Concession Procurement
- 12.5.8 Subsegment Pricing and Adoption Trends
- 12.5.9 Leading Suppliers and Competition
- 12.5.10 Regional Demand and Opportunities
- 12.6 Segment Growth Comparison
- 12.7 Segment Attractiveness and Priority Matrix
Chapter 13 Australia Healthcare Facility Management End-Use and Application Market Outlook
- 13.1 End-Use Industry and Customer Demand Structure
- 13.2 Leading Applications and Customer Groups
- 13.3 End-Use Market Size, Share and Forecast
- 13.4 Major End-Use Industry Deep Dives
- 13.4.1 Customer Requirements and Use Cases
- 13.4.2 Demand and Replacement Cycles
- 13.4.3 Technical and Regulatory Considerations
- 13.4.4 Purchasing and Procurement Models
- 13.4.5 Leading Vendors and Distribution Channels
- 13.4.6 Forecast and Commercial Opportunities
- 13.5 Emerging Applications and Cross-Segment Demand
- 13.6 End-Use Industry Investment Priorities
Chapter 14 Australia Healthcare Facility Management Geographic Market Outlook, 2025-2035
- 14.1 Domestic Market Distribution and Demand Clusters
- 14.2 State- or Province-Wise Market Size and Forecast, 2025-2035
- 14.3 City and Metropolitan Market Outlook
- 14.4 Industrial, Manufacturing and Commercial Clusters
- 14.5 Geographic Concentration of Key End Users
- 14.6 Local Pricing and Purchasing Differences
- 14.7 Domestic Production Facilities and Capacity Map
- 14.8 Local Infrastructure and Project Pipeline
- 14.9 State-Level Policy and Incentive Differences
- 14.10 Subnational Investment Hotspots and Opportunities
- 14.11 Distribution and Logistics Networks
- 14.12 Domestic Competitive Footprint
Chapter 15 Australia Healthcare Facility Management Technology, Innovation and Sustainability Outlook
- 15.1 Technology Landscape and Maturity
- 15.2 Product, Process and Service Innovation
- 15.3 AI, Automation and Digital Tools in the Industry
- 15.4 Technology Adoption and Performance Benchmarking
- 15.5 Innovation Pipeline and R&D Investment
- 15.6 Patent and Intellectual Property Trends
- 15.7 Energy Efficiency and Resource Management
- 15.8 Sustainability, Recycling and Circularity
- 15.9 Technology Roadmap, 2025-2035
- 15.10 Risks of Obsolescence and Technology Substitution
Chapter 16 Australia Healthcare Facility Management Market Key Strategic Imperatives
- 16.1 Growth and Market Entry Priorities
- 16.2 High-Return Products and Segments
- 16.3 Pricing, Profitability and Cost Optimization
- 16.4 Technology Investment and Product Differentiation
- 16.5 Supply Chain Localization and Resilience
- 16.6 Distribution and Customer Acquisition
- 16.7 Partnership, Acquisition and Capacity Strategy
- 16.8 Regional Expansion Priorities
- 16.9 Short-, Medium- and Long-Term Actions
Chapter 17 Competition Outlook
- 17.1 Industry Competition Characteristics
- 17.2 Market Structure and Concentration
- 17.3 Market Share and Competitive Positioning, 2025
- 17.4 Company-Wise Revenue and Product Benchmarking
- 17.5 Production and Service Capacity Benchmarking
- 17.6 Technology, Pricing and Differentiation
- 17.7 Regional Footprint and Distribution Strength
- 17.8 Mergers, Acquisitions and Strategic Alliances
- 17.9 New Entrants and Competitive Threats
- 17.10 Porter's Five Forces and Industry Attractiveness
- 17.11 Competitive Outlook, 2025-2035
Chapter 18 Company Profiles
- 18.1 Company Coverage and Selection Criteria
- 18.2 Downer
- 18.2.1 Business Description
- 18.2.2 Company Ownership and Geographic Presence
- 18.2.3 Product and Service Portfolio
- 18.2.4 Manufacturing and Operating Footprint
- 18.2.5 Production Capacity and Expansion Plans
- 18.2.6 Financial Performance and Investment
- 18.2.7 Market Share and Competitive Position
- 18.2.8 Technology and Innovation Capabilities
- 18.2.9 Strategic Alliances or Partnerships
- 18.2.10 Recent Developments
- 18.2.11 Growth Strategy and Outlook
- 18.3 Ventia
- 18.4 ISS
- 18.5 Compass Group
- 18.6 CBRE
- 18.7 Serco
- 18.8 BGIS
- 18.9 Programmed
- 18.10 JLL
- 18.11 OCS
- 18.12 Other Relevant Market Participants
Note: Every listed company is profiled on the structure shown under the first company. The company list is preliminary and may change based on research findings, market developments, data availability and client requirements.
Chapter 19 Disclaimer
- 19.1 Research and Forecast Disclaimer
- 19.2 Data Source and Estimation Limitations
Note: The depth of individual sections depends on data availability for this market. Volume, capacity, trade and other unit-based metrics are included where applicable.

