
PBS listings move RNA medicines into routine care
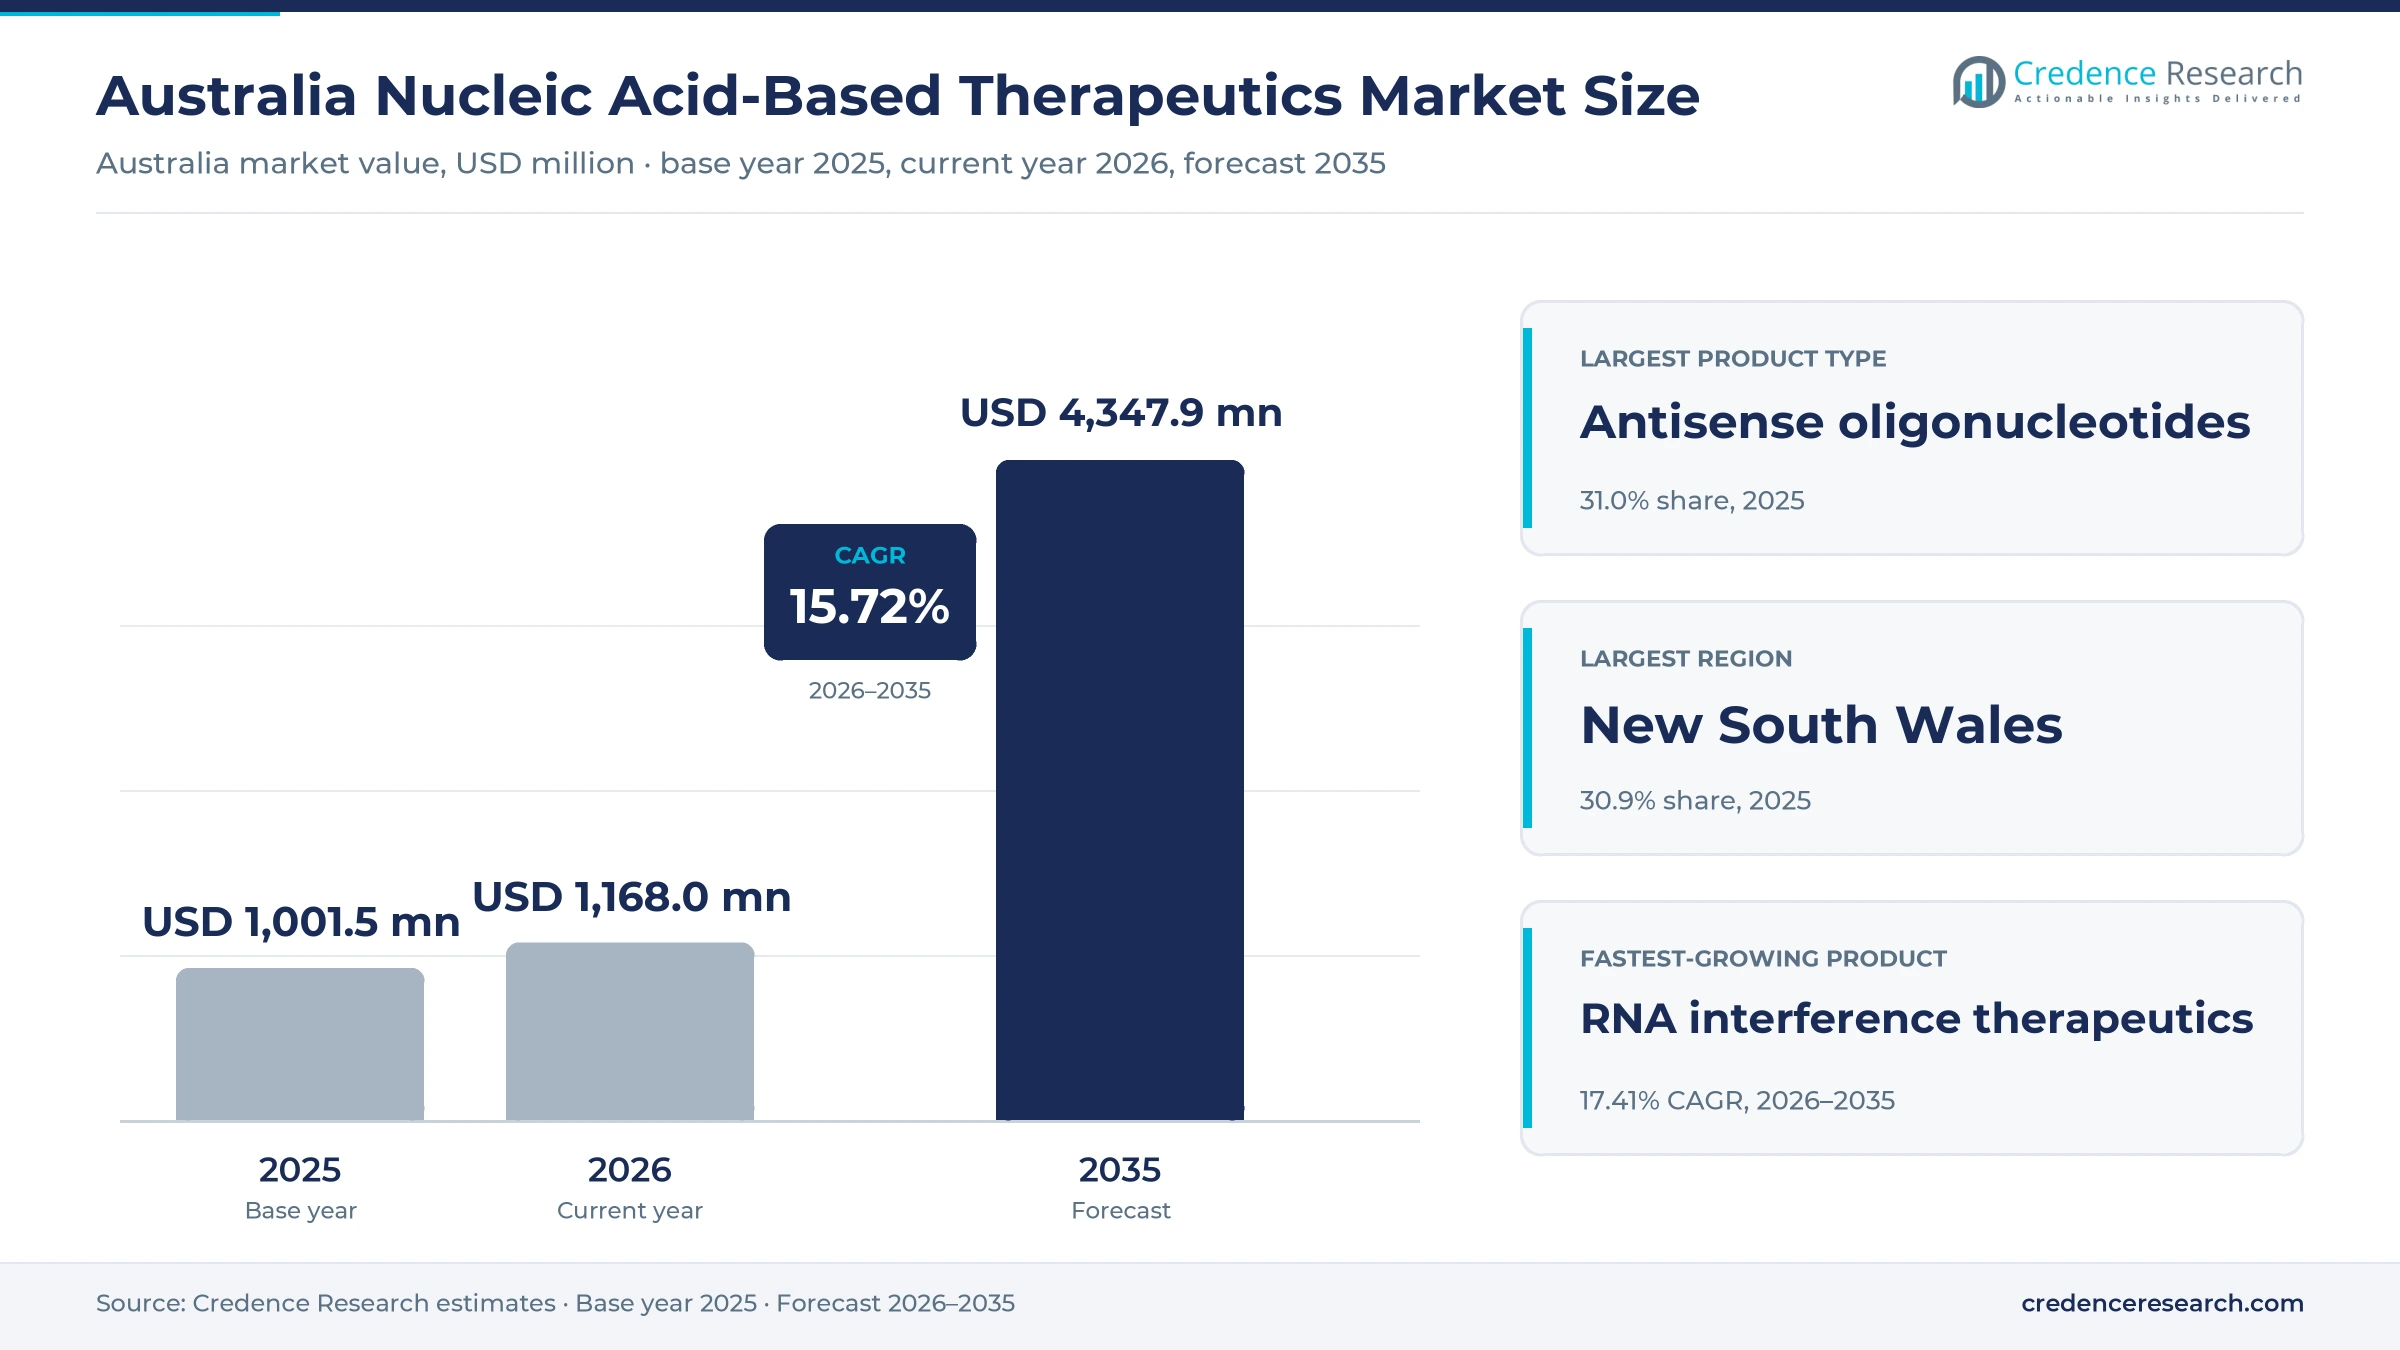
The Australia nucleic acid-based therapeutics market was valued at USD 1.00 billion in 2025 and is projected to increase from USD 1.17 billion in 2026 to USD 4.35 billion by 2035, registering a CAGR of 15.72% during 2026–2035. Demand comes from public hospitals, specialist clinics and community prescribers that use antisense, RNA interference, mRNA and gene-therapy products for rare neuromuscular disease, high cholesterol, amyloidosis and respiratory infection. New South Wales held the largest regional share, 30.9% in 2025, because Sydney hosts the largest group of tertiary hospitals and specialist neurology and cardiology services. Western Australia is the fastest-growing region at 16.19% a year, as population growth adds patients and outreach care widens access. Most spending runs through Pharmaceutical Benefits Scheme listings, which set subsidized prices for high-cost medicines. The opening of a commercial-scale mRNA plant in Victoria in December 2024 also gave Australia its first domestic source of mRNA vaccines.
Which RNA and DNA medicines does the Australian estimate count?
The estimate measures spending on medicines whose active ingredient is a nucleic acid, including antisense oligonucleotides, small interfering RNA, mRNA vaccines and therapies, gene therapies that deliver DNA, and aptamers. It covers products bought by federal and state health programs, public and private hospitals and self-funded patients. Values are stated at manufacturer selling prices after listed subsidy arrangements and include imported and locally made products.
The estimate excludes nucleic acid diagnostic tests, research reagents, contract manufacturing services and cell therapies that do not deliver a genetic payload. The value chain runs from global originators and local manufacturers through Australian sponsors and wholesalers to hospitals, specialist clinics and pharmacies, where federal subsidy rules decide which patients can access each medicine.
Australia Nucleic Acid-Based Therapeutics Market Insights
- The Australia nucleic acid-based therapeutics market was valued at USD 1.00 billion in 2025 and is projected to reach USD 4.35 billion by 2035, registering a CAGR of 15.72% during 2026–2035.
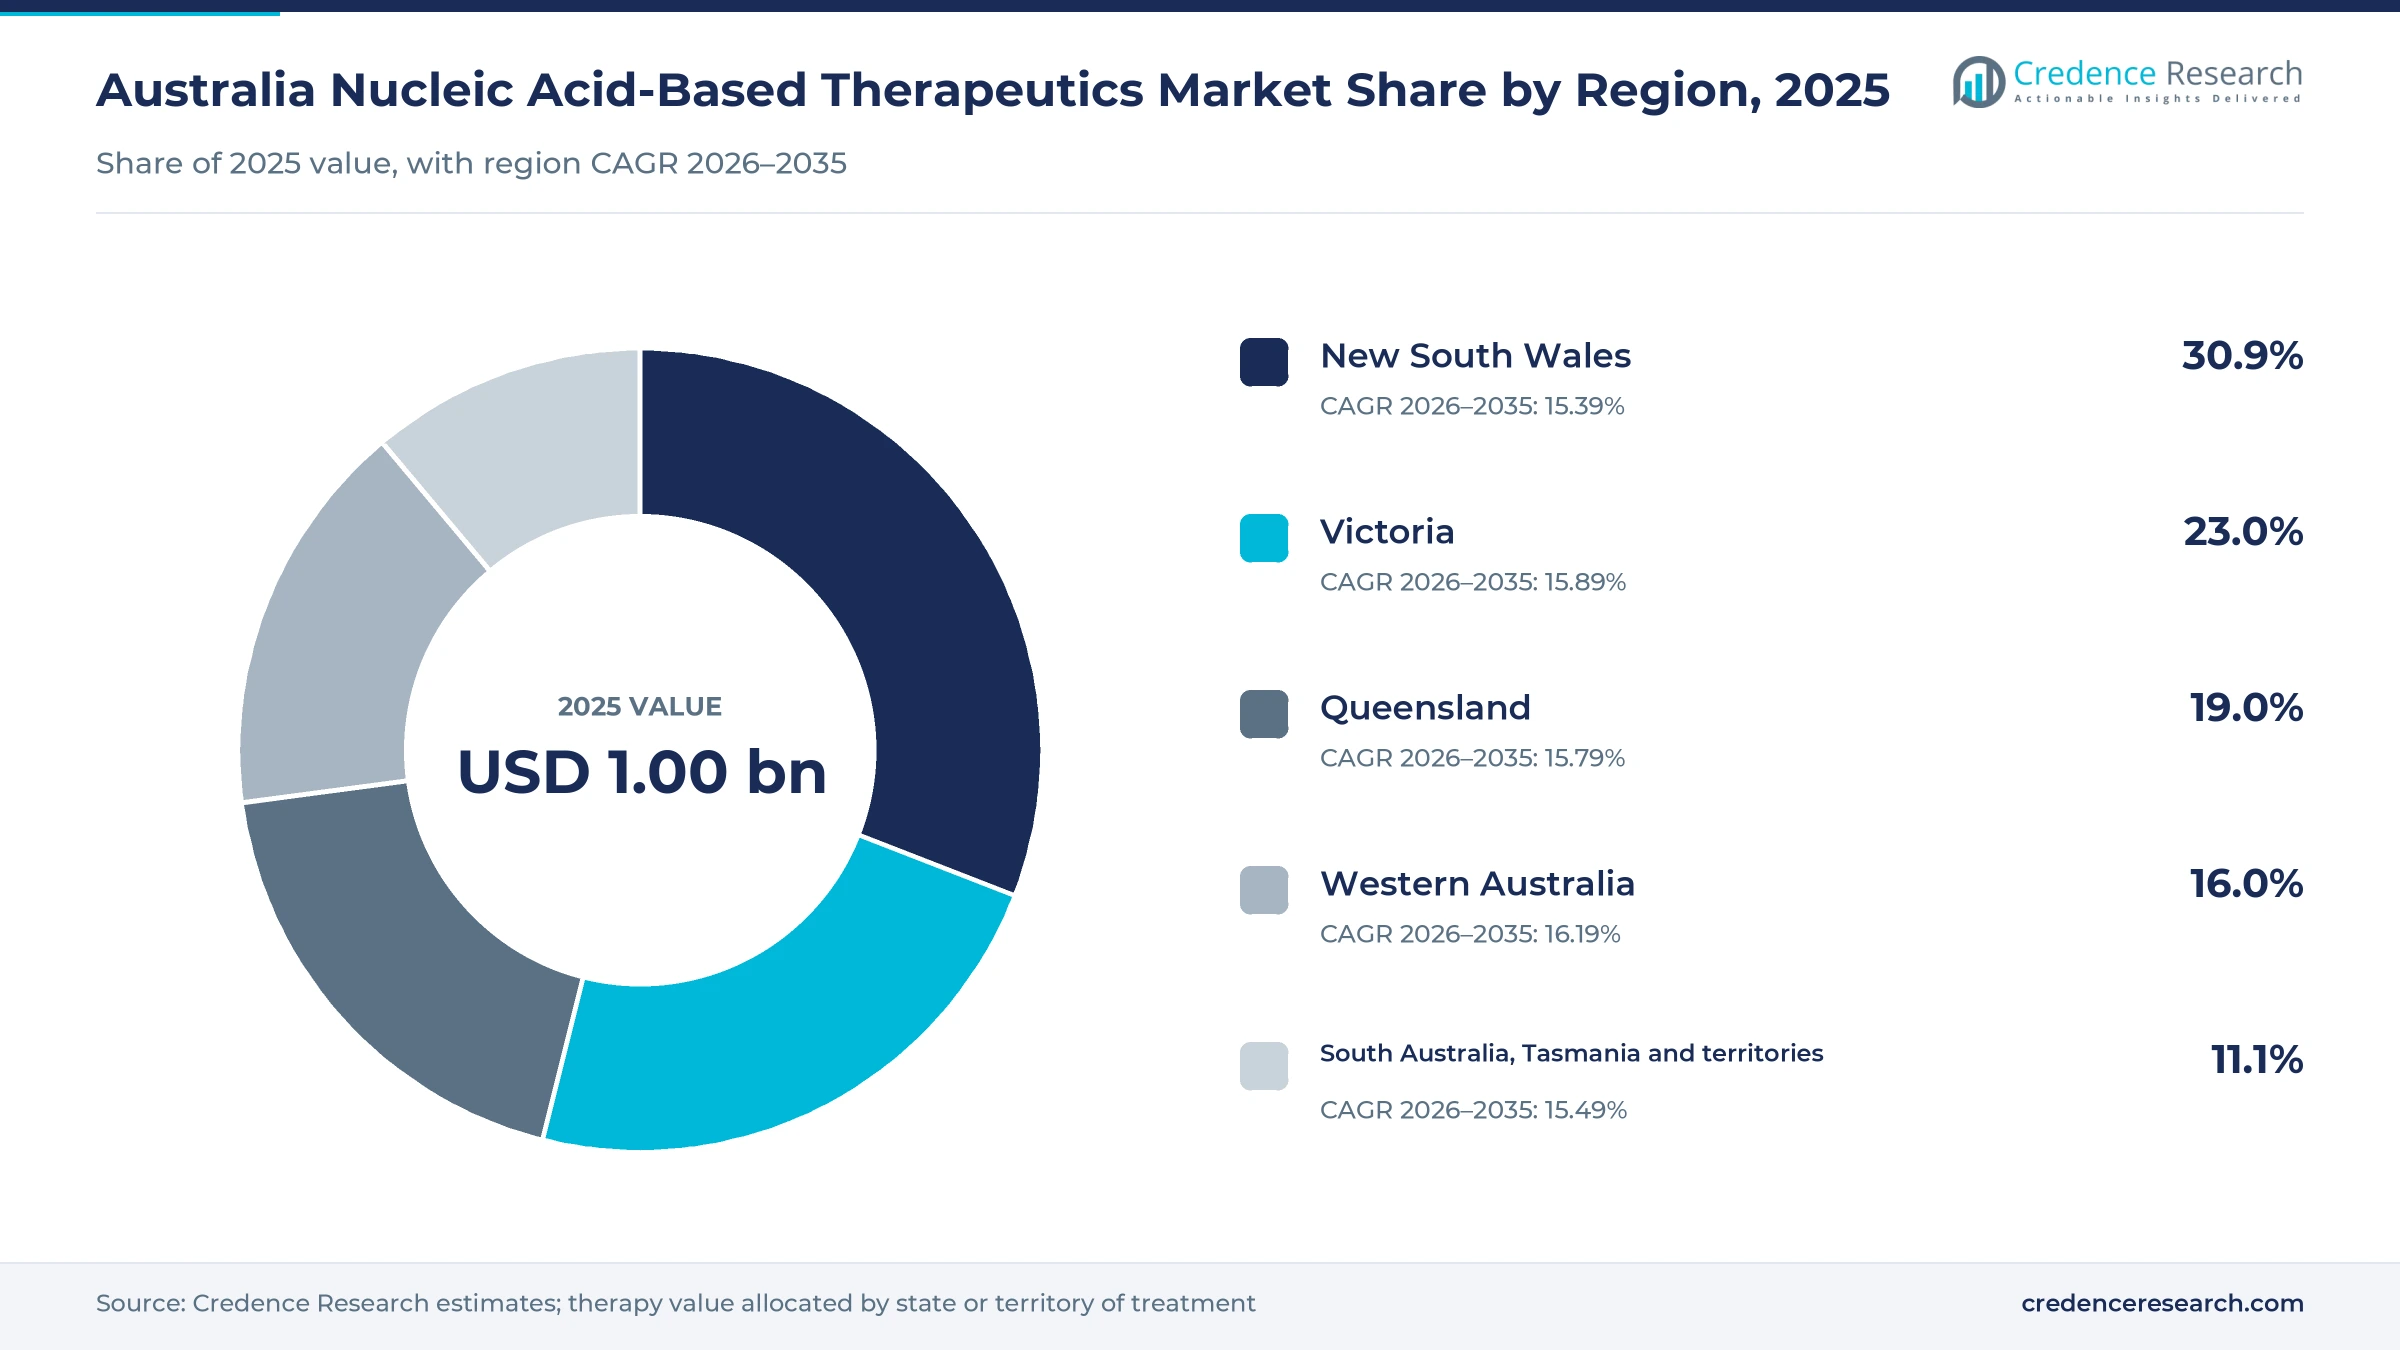
- New South Wales held a 30.9% share of 2025 value, because Sydney hosts the largest network of tertiary hospitals and specialist clinics.
- Antisense oligonucleotide therapeutics led with a 31.0% share of 2025 value, because subsidized spinal muscular atrophy treatment carries high annual costs.
- Inclisiran, a twice-yearly RNA interference injection for high cholesterol, was listed on the Pharmaceutical Benefits Scheme on March 1, 2025.
- A Victorian plant able to make up to 100 million mRNA vaccine doses a year opened at Monash University in December 2024.
Antisense drugs lead while RNA interference grows fastest
Why do antisense drugs hold the largest share?
Based on product type, the market is categorized into antisense oligonucleotide therapeutics, RNA interference therapeutics, mRNA therapeutics, nucleic-acid-payload gene therapies and aptamer and emerging oligonucleotide therapeutics. Antisense oligonucleotide therapeutics led with a 31.0% share of 2025 value, because spinal muscular atrophy treatment carries high annual costs. RNA interference therapeutics grow fastest at 17.41% a year, as cholesterol and amyloidosis listings add patients.
How do cardiovascular uses change the disease mix?
Based on disease area, the market is categorized into neuromuscular disorders, cardiovascular and metabolic disorders, infectious diseases, haematological and ophthalmic disorders and oncology and remaining rare disorders. Neuromuscular disorders led with a 30.0% share of 2025 value, because rare disease drugs carry high prices. Cardiovascular and metabolic disorders grow fastest at 17.35% a year, as a large group of patients with high cholesterol gains subsidized access.
Why is home administration growing from a small base?
Based on care setting, the market is categorized into tertiary hospital treatment, specialist outpatient treatment, community clinical administration and supported home administration. Tertiary hospital treatment led with a 44.0% share of 2025 value, because intrathecal and gene therapy doses need hospital teams. Supported home administration grows fastest at 17.07% a year, as injectable RNA medicines with long dosing intervals move closer to patients.
How does subsidized prescription supply shape buying?
Based on channel, the market is categorized into reimbursed prescription supply, government vaccine procurement, hospital formulary procurement and special-access and private procurement. Reimbursed prescription supply led with a 52.0% share of 2025 value, because federal subsidy funds most high-cost RNA medicines. Reimbursed prescription supply also grows fastest at 16.11% a year, as new listings for cholesterol and amyloidosis add prescriptions each year.
| Segment Group | Leading Sub-segment | Share, 2025 | Fastest-growing Sub-segment | CAGR, 2026–2035 |
|---|---|---|---|---|
| By Product Type | Antisense oligonucleotide therapeutics | 31.0% | RNA interference therapeutics | 17.41% |
| By Disease Area | Neuromuscular disorders | 30.0% | Cardiovascular and metabolic disorders | 17.35% |
| By Care Setting | Tertiary hospital treatment | 44.0% | Supported home administration | 17.07% |
| By Channel | Reimbursed prescription supply | 52.0% | Reimbursed prescription supply | 16.11% |
Request a Free Sample
Fill in your details and we'll send you a free sample report.
- Sample data tables & charts
- Research methodology
Subsidy, local mRNA supply and new indications lift demand
How does reimbursement-led RNA adoption widen access?
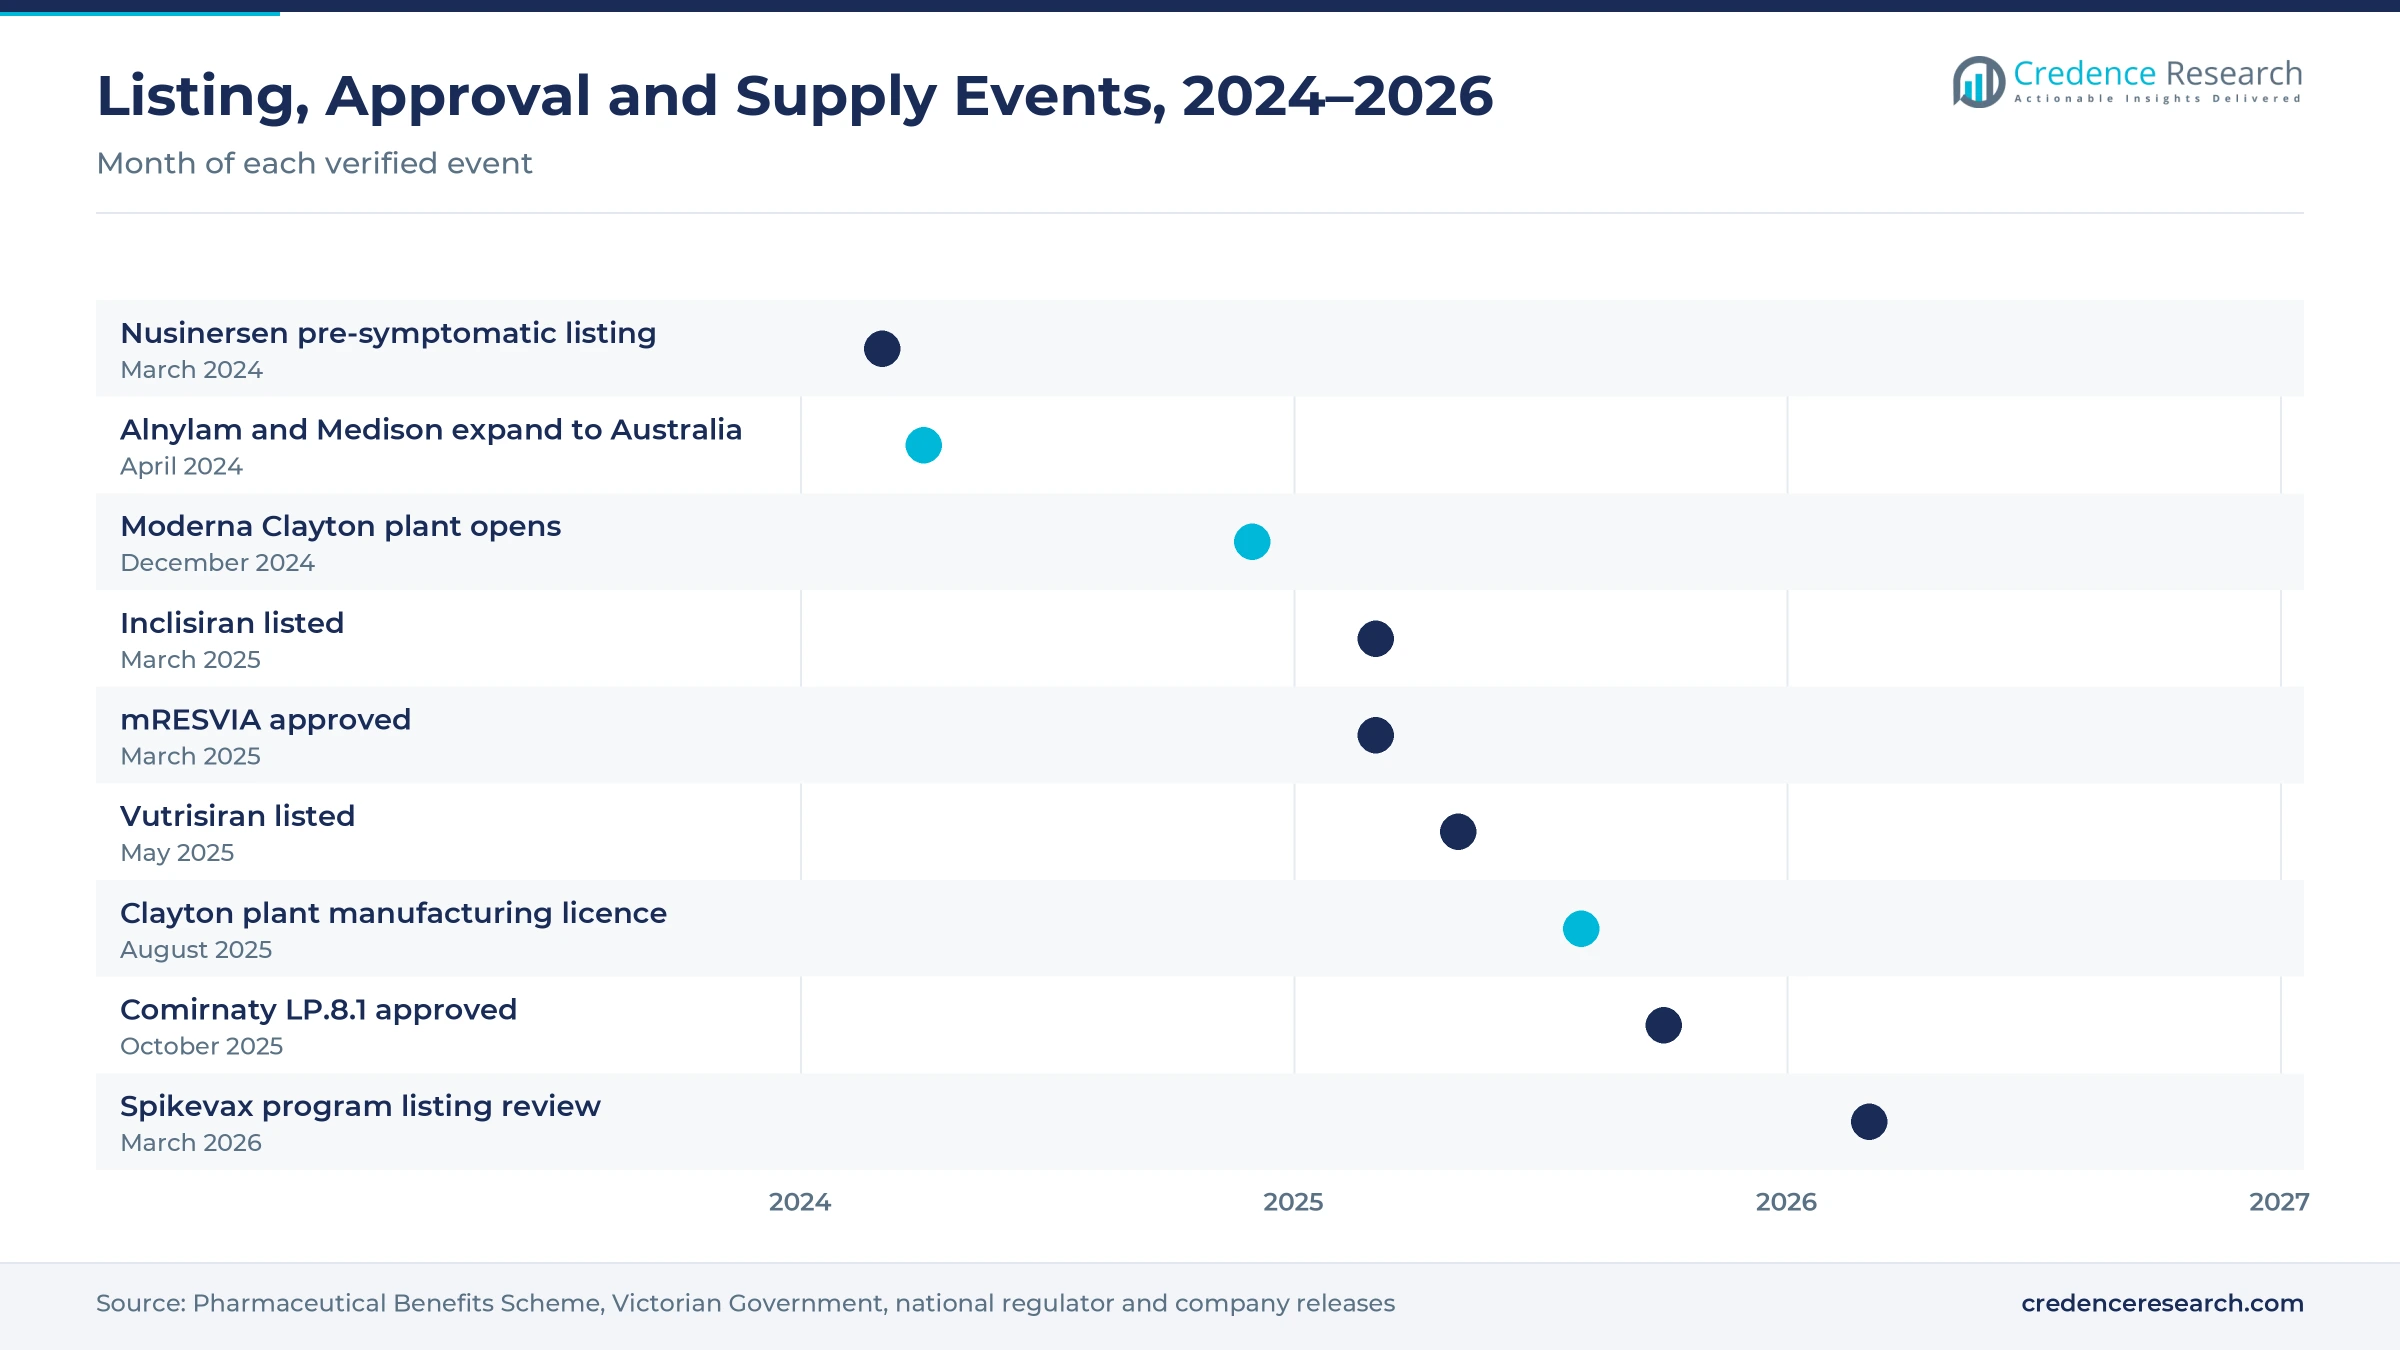
Reimbursement-led RNA adoption widens access, because federal subsidy turns high-priced medicines into treatments that patients can afford. Inclisiran, a twice-yearly RNA interference injection from Novartis, was listed on March 1, 2025, after a November 2024 recommendation, according to the Pharmaceutical Benefits Scheme. Vutrisiran, an RNA interference drug for hereditary transthyretin amyloidosis, followed on May 1, 2025, with Medison Pharma Australia as sponsor. Nusinersen also gained a listing for pre-symptomatic spinal muscular atrophy on March 1, 2024, which lets doctors treat babies before symptoms appear. As a result, reimbursed prescription supply holds a 52.0% share of 2025 value, and each new listing adds a steady stream of patients rather than one-off private purchases.
Why does domestic mRNA supply capability support growth?
Domestic mRNA supply capability supports growth, because local production secures vaccine supply and builds a base for new mRNA medicines. The Moderna plant at Monash University in Clayton opened on Dec. 4, 2024, and can make up to 100 million vaccine doses a year, according to the Victorian Government. The site sits within a 10-year partnership between the federal and Victorian governments and Moderna, with 140 direct jobs. It received its full manufacturing licence from the national regulator in August 2025. In turn, mRNA products hold a large share of 2025 value, while the plant gives suppliers of mRNA vaccines a local route to market.
How does expansion of eligible treatment indications add patients?
Expansion of eligible treatment indications adds patients, because each widened listing brings a new group into subsidized care. Nusinersen was extended to adults with spinal muscular atrophy whose symptoms began before age 19 from Aug. 1, 2022, and about 100 patients a year were expected to benefit, according to the federal health minister. Without subsidy, families faced costs above A$300,000 a year, while each script now costs A$42.50. The March 2024 listing for babies identified before symptoms then extended treatment to the earliest stage of disease. As a result, neuromuscular disorders hold a 30.0% share of 2025 value, because antisense oligonucleotide drugs carry high annual costs per patient.
Why does public health spending support high-cost treatment?
Public health spending supports high-cost treatment, because a well-funded system can absorb medicines priced for small patient groups. Current health spending equaled 10.4% of GDP in 2023, according to World Bank data. Australia's population also reached 27.92 million at March 31, 2026, growing 1.4% over the year, which adds patients in every state. Onasemnogene abeparvovec, a one-time gene therapy, became subsidized in May 2022 for babies under nine months with pre-symptomatic or Type 1 disease, and about 1 in 10,000 Australian babies are born with spinal muscular atrophy. In turn, tertiary hospital treatment holds a 44.0% share of 2025 value.
Twice-yearly dosing and local RNA research reshape supply
How is the rise of twice-yearly RNA injections changing care?
The rise of twice-yearly RNA injections is changing care, because long dosing intervals move treatment out of hospitals. Inclisiran is given as an initial dose, a second dose at three months and then every six months. General practitioners can prescribe it after a first specialist consultation, which brings cholesterol treatment into community clinics. About 1 in 3 Australian adults has high cholesterol, which gives the drug a very large potential base. Vutrisiran is also given every three months as a short injection, which reduces hospital visits for amyloidosis patients. As a result, cardiovascular and metabolic disorders grow at 17.35% a year, the fastest disease area through 2035.
Why is the shift to annual mRNA vaccine programs gaining ground?
The shift to annual mRNA vaccine programs is gaining ground, because variant-updated products now move through national funding reviews each year. Pfizer's Comirnaty LP.8.1 was approved by the national regulator on Oct. 1, 2025, and the advisory committee recommended Comirnaty for national program listing in December 2025. Moderna then sought program listing for Spikevax for adults aged 65 and older and other at-risk groups at the March 2026 meeting. The national regulator also approved mRESVIA, an mRNA vaccine for respiratory syncytial virus in adults aged 60 and older, on March 31, 2025. In turn, government vaccine procurement keeps a large share of 2025 value, even as pandemic-era volumes fall.
Can local RNA research hubs open room for new therapies?
Local RNA research hubs open room for new therapies, because shared plants let universities and start-ups make clinical-grade material at home. New South Wales chose Myeloid in February 2023 to operate an RNA pilot manufacturing facility at Macquarie University, which was due for completion in 2025. The site is designed to make RNA therapies and delivery technologies for early clinical trials, including cancer immunotherapies. In Victoria, Moderna signed incubator agreements with 3 research bodies, the Peter MacCallum Cancer Centre, the Monash Institute of Pharmaceutical Sciences and the Doherty Institute. As a result, oncology and remaining rare disorders grow faster than the market, as local trials feed future oligonucleotide synthesis and supply needs.
Is there room for wider gene therapy access?
Wider gene therapy access creates room for suppliers, because newborn screening finds more babies who qualify for one-time treatment. The federal government announced subsidy for onasemnogene abeparvovec on May 1, 2022, according to Novartis. The listing covers babies under nine months with Type 1 disease or pre-symptomatic disease with one or two copies of the backup gene. However, babies with three copies remain outside the listing, which leaves room for later review. In turn, nucleic-acid-payload gene therapies keep a steady place beside antisense drugs in spinal muscular atrophy care, while suppliers of viral vector treatments track Australian screening programs closely.
High prices, complex delivery and small cohorts slow uptake
How do high prices slow subsidy decisions?
High prices slow subsidy decisions, because the national advisory committee tests each medicine for cost effectiveness before listing. Rare disease drugs often have small trials and uncertain long-term benefit, which makes that test harder. As a result, some products wait several meeting cycles before they reach patients. Sponsors respond with risk-sharing deals, managed access programs and narrower first listings that widen once real-world data become available.
Why does complex delivery limit treatment capacity?
Complex delivery limits treatment capacity, because intrathecal injections and gene therapy infusions need trained hospital teams and theatre time. Regional patients often travel to capital-city hospitals for each dose, which adds cost and delay. In turn, hospitals ration slots for new patients when staff are short. Suppliers respond with nurse education, outreach clinics and longer dosing intervals that reduce the number of hospital visits each year.
How do small patient groups limit commercial scale?
Small patient groups limit commercial scale, because many nucleic acid medicines treat rare inherited conditions with only dozens or hundreds of Australian patients. Sponsors must still meet the full cost of registration, subsidy submissions and local supply. As a result, some products reach Australia later than larger markets or rely on special access schemes. Regional partners such as specialist distributors help by bundling several rare disease products under one local team.
Why does falling pandemic demand weigh on mRNA value?
Falling pandemic demand weighs on mRNA value, because COVID-19 vaccine volumes have dropped from their 2021 and 2022 peak. Annual programs now target older adults and people at higher risk, which reduces total doses. However, local supply and new respiratory vaccines support the base. Suppliers respond by adding influenza, respiratory syncytial virus and combination vaccines to their pipelines, so that each funded program carries more than one product.
Sydney hospitals lead and perth catchments grow fastest
| Region | Value, 2025 (USD billion) | Share, 2025 | CAGR, 2026–2035 |
|---|---|---|---|
| New South Wales | 0.31 | 30.9% | 15.39% |
| Victoria | 0.23 | 23.0% | 15.89% |
| Queensland | 0.19 | 19.0% | 15.79% |
| Western Australia | 0.16 | 16.0% | 16.19% |
| South Australia, Tasmania and territories | 0.11 | 11.1% | 15.49% |
Why does New South Wales hold the largest share?
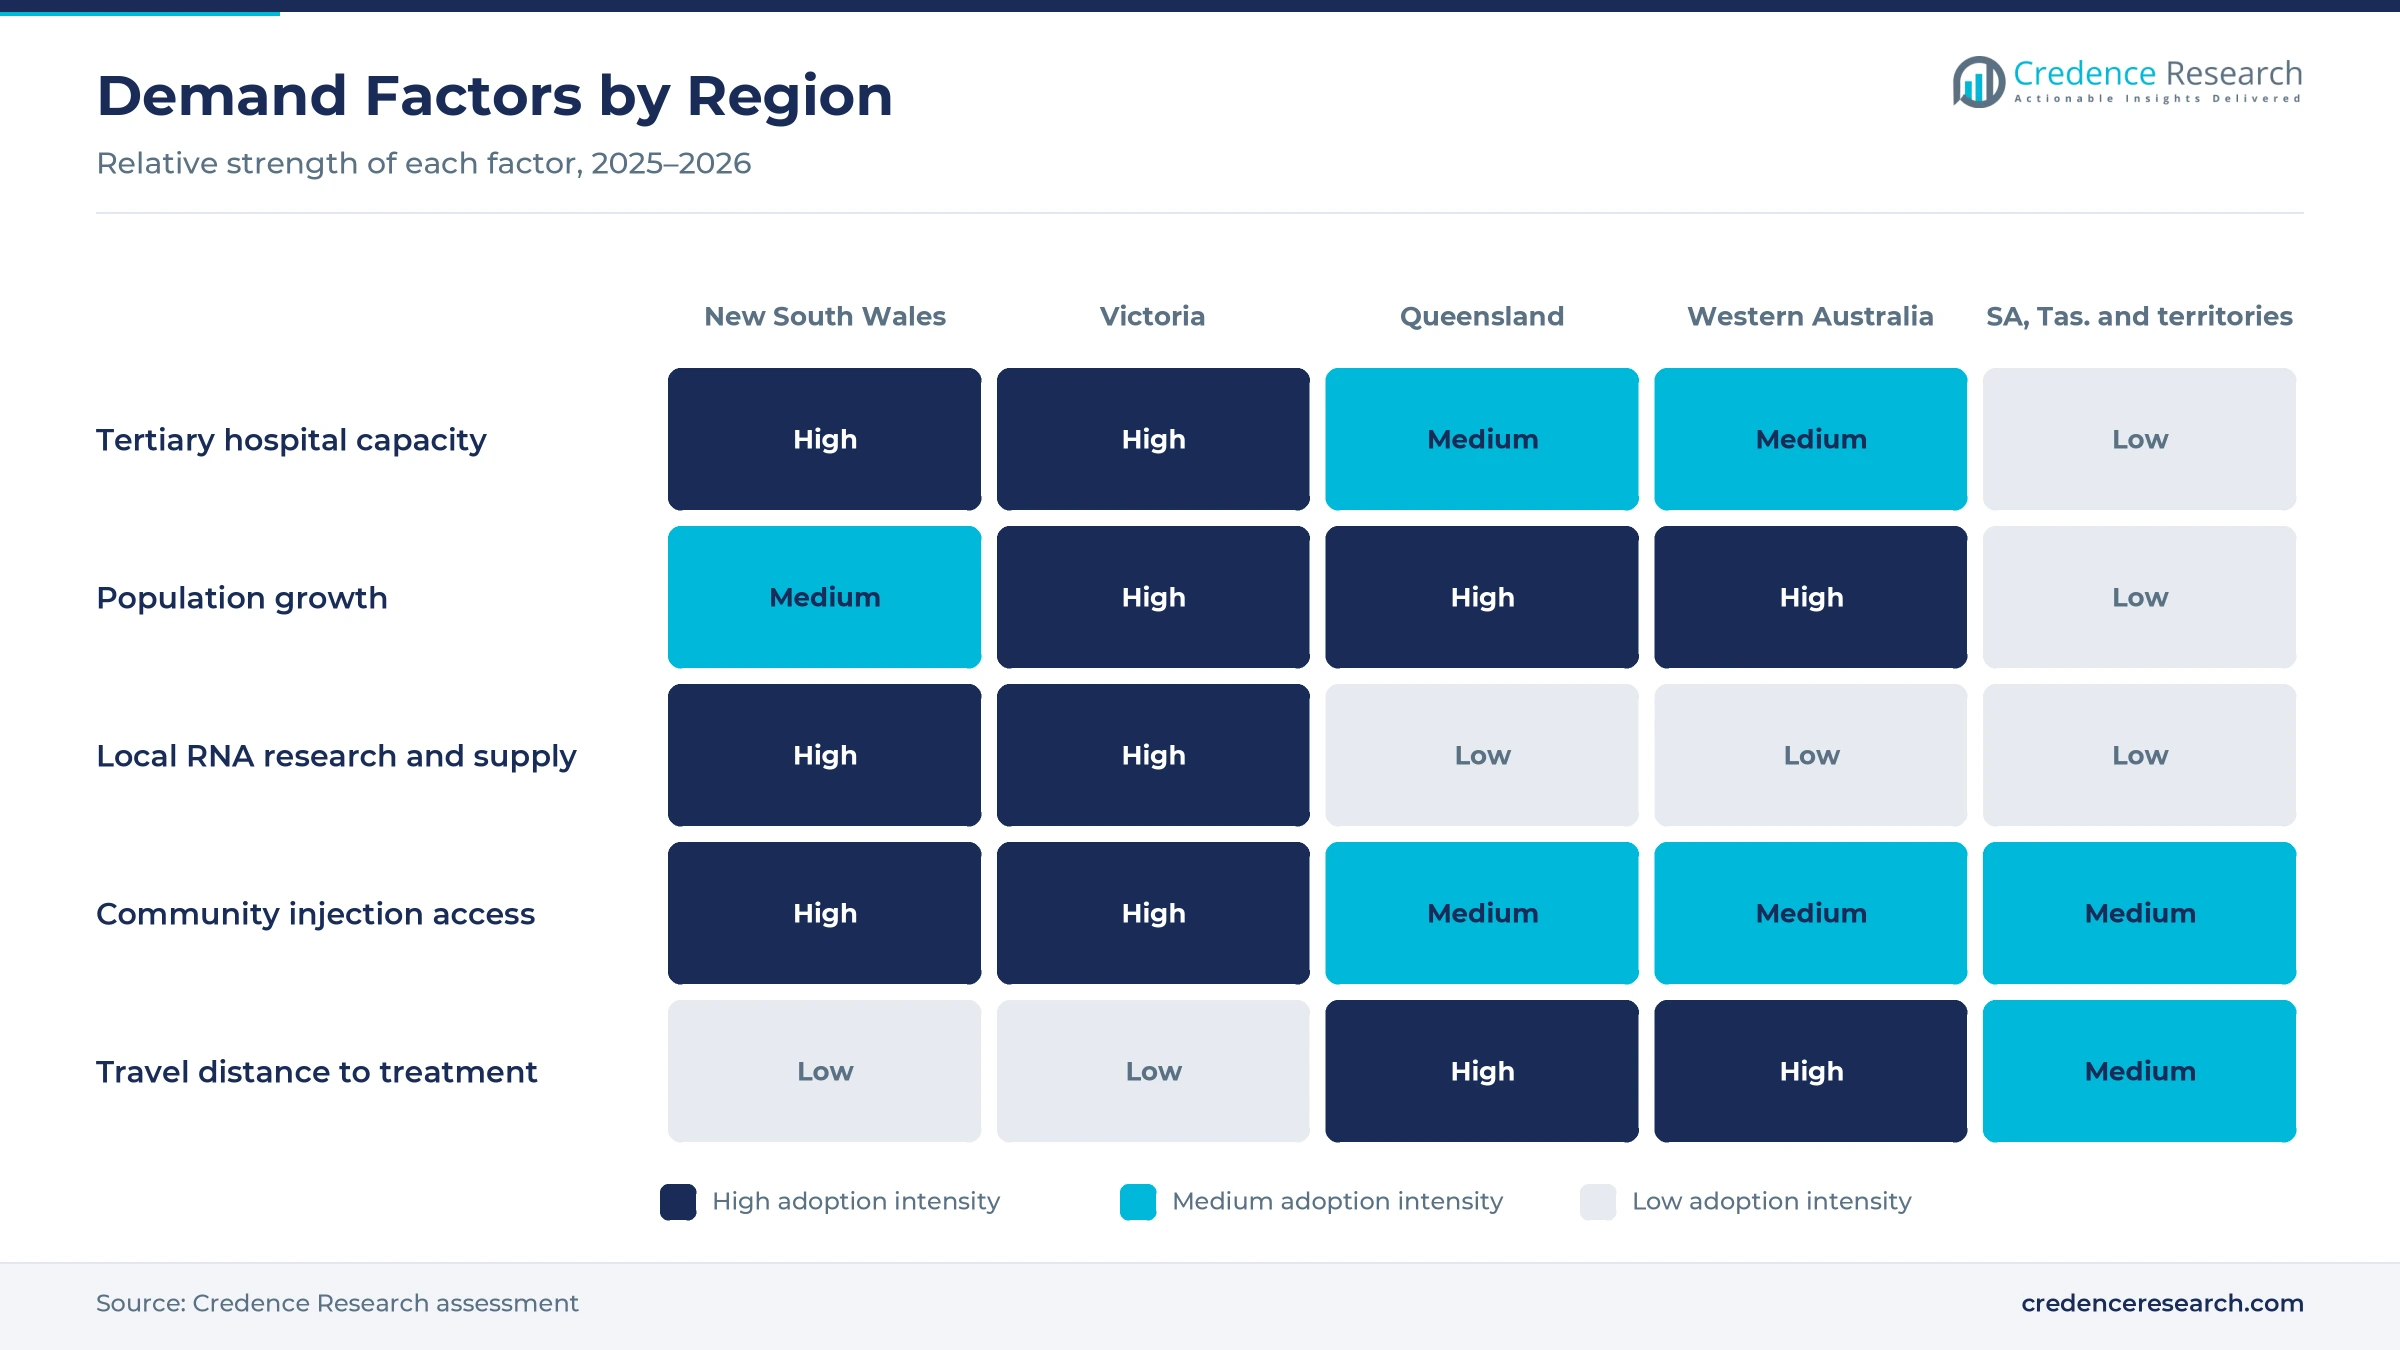
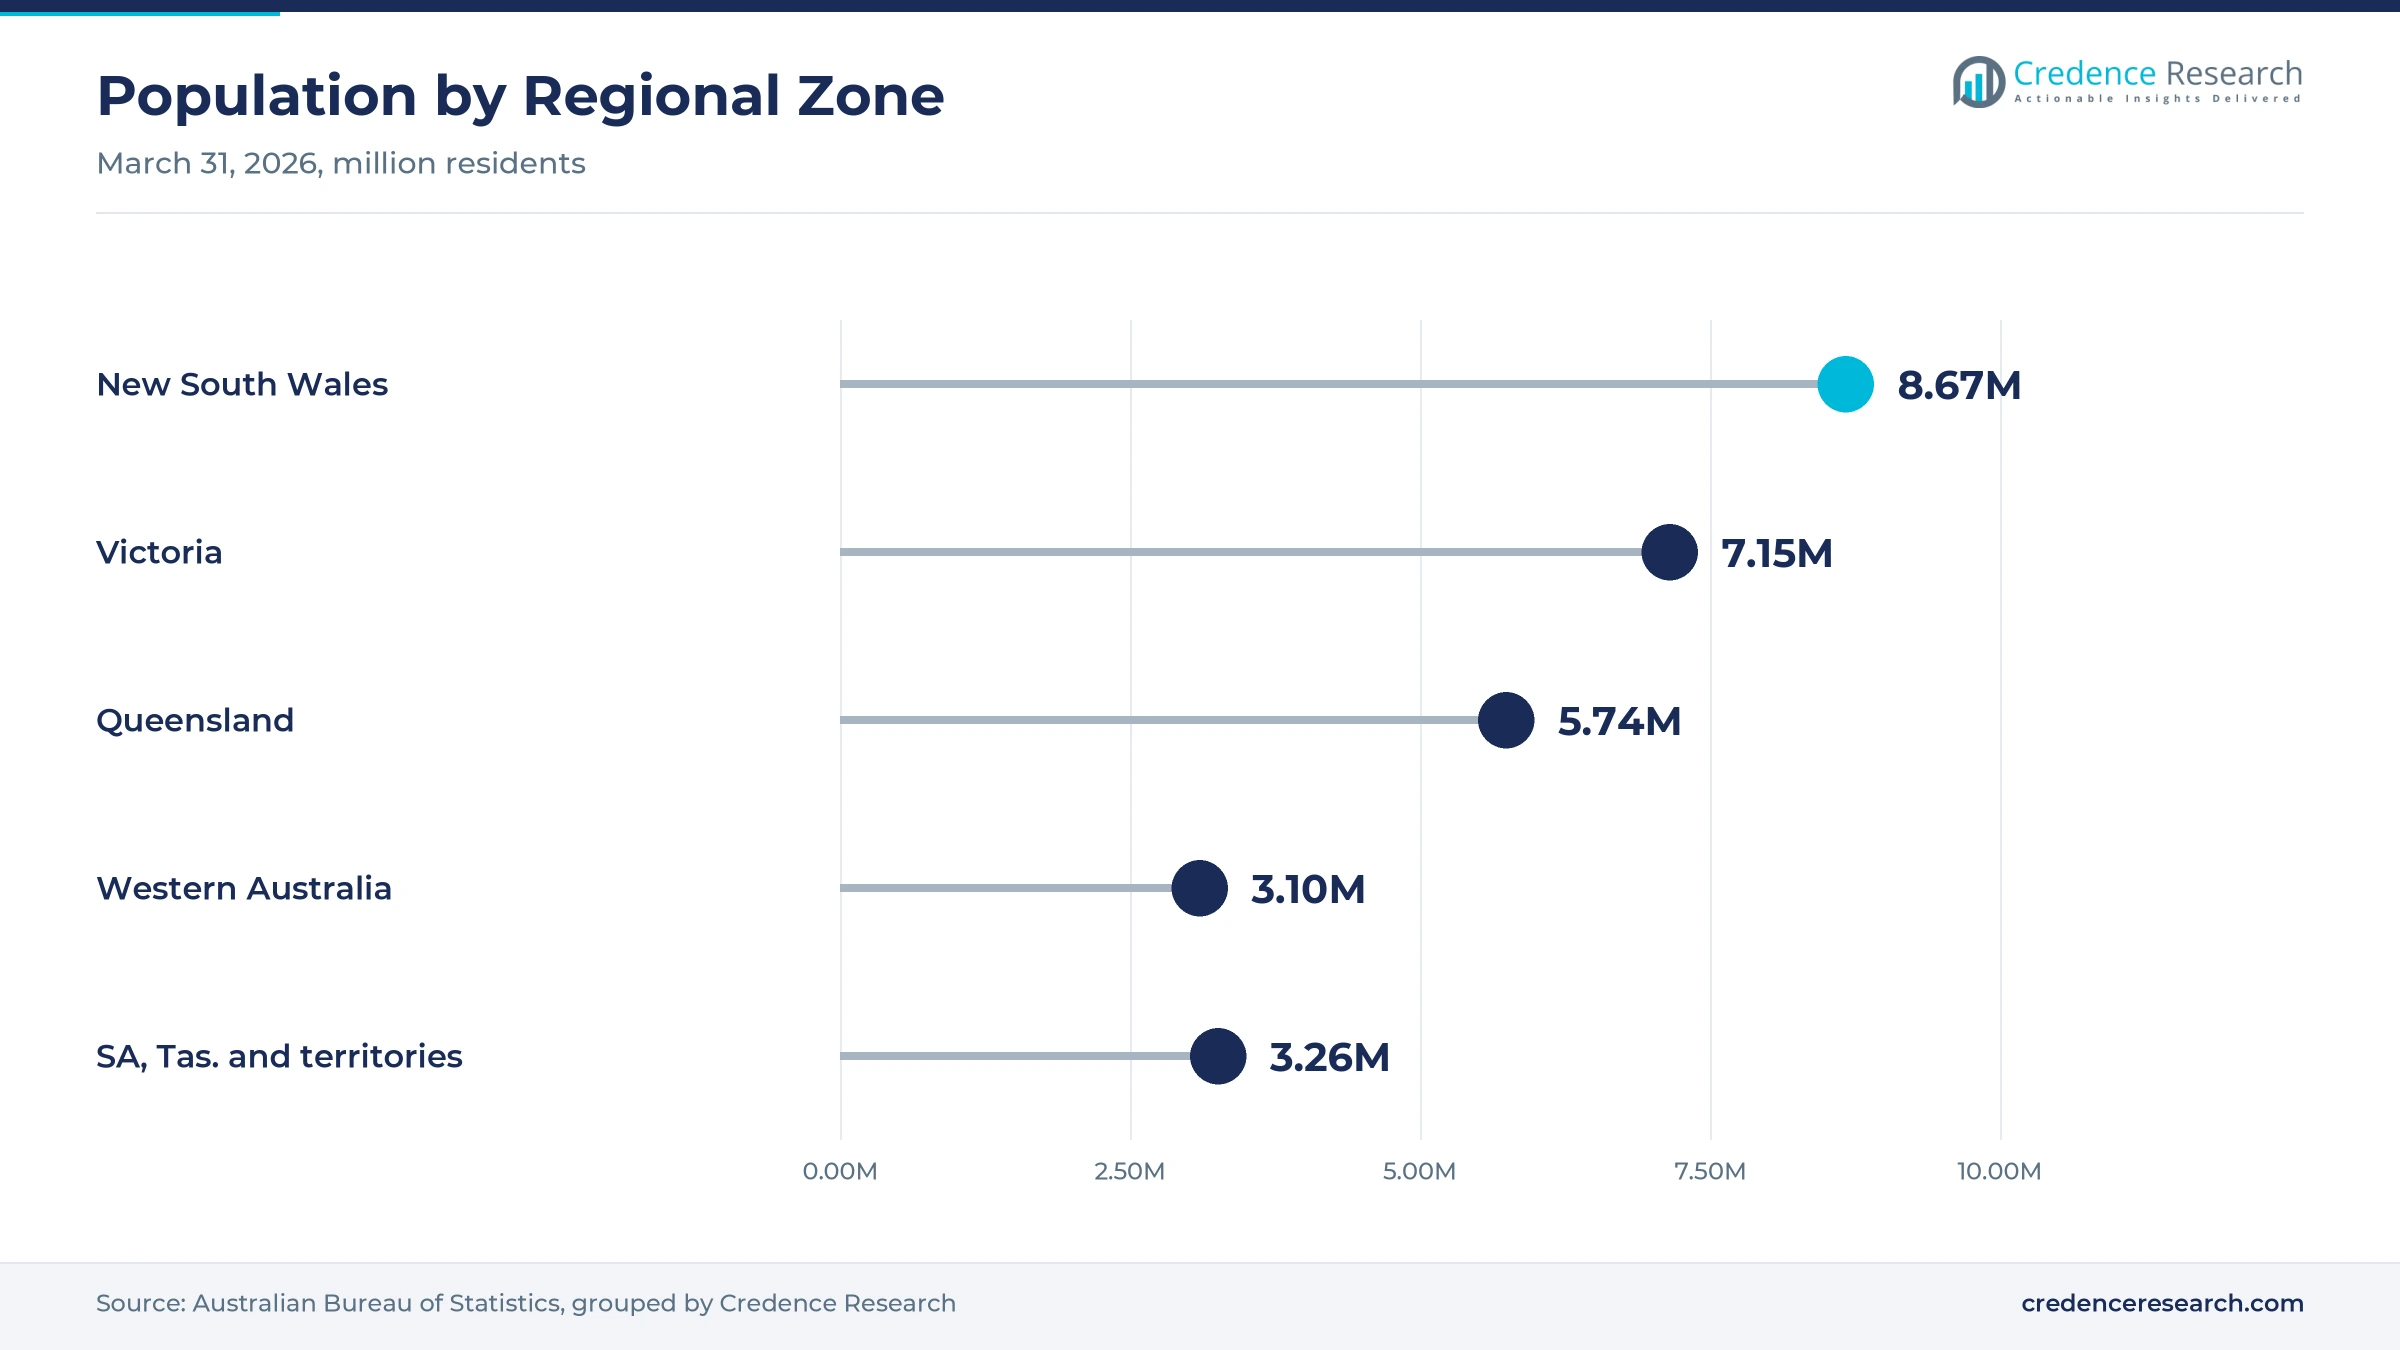
New South Wales held a 30.9% share of 2025 value and grows at 15.39% a year, because Sydney hosts the largest group of children's hospitals, neuromuscular clinics and cardiology services. The state had about 8.67 million residents at March 31, 2026. However, growth is slightly slower than the national rate because the treated base is already large. The planned RNA pilot plant at Macquarie University also links the state to early clinical work on new RNA medicines.
How does local mRNA production support Victoria?
Victoria held a 23.0% share of 2025 value and grows at 15.89% a year, because Melbourne hosts major children's, cancer and research hospitals. The state had about 7.15 million residents at March 31, 2026, after growth of 1.6% over the year. As a result, demand grows faster than in New South Wales, while the Moderna plant in Clayton and its research partners add clinical trial and supply activity that keeps new mRNA products close to Victorian patients.
What drives demand in Queensland?
Queensland held a 19.0% share of 2025 value and grows at 15.79% a year, because Brisbane hospitals serve a large and growing state with long travel distances. Queensland had about 5.74 million residents at March 31, 2026, after growth of 1.6% over the year. In turn, community injection of long-acting RNA medicines helps regional patients avoid repeated trips to Brisbane for each dose.
How does population growth speed uptake in Western Australia?
Western Australia held a 16.0% share of 2025 value and grows fastest at 16.19% a year, because the state had the fastest population growth at 2.1% in the year to March 2026. Perth hospitals serve a vast area, which favors long-acting medicines that need fewer visits. As a result, community and outreach use of RNA injections adds demand faster than in the eastern states.
How do South Australia, Tasmania and the territories add demand?
South Australia, Tasmania and the territories accounted for 11.1% of 2025 value and grow at 15.49% a year, because Adelaide, Hobart, Canberra and Darwin run smaller specialist services. Many rare disease patients still travel interstate for complex doses. In turn, growth depends on outreach clinics and long-acting products that can be given closer to home.
PBS listings, approvals and local plants marked 2024 to 2026
| Development | Status and market relevance |
|---|---|
| In March 2024, nusinersen from Biogen was listed for pre-symptomatic spinal muscular atrophy. | Extends subsidized antisense treatment to babies identified before symptoms |
| In December 2024, Moderna opened its mRNA manufacturing plant at Monash University in Clayton. | Can make up to 100 million vaccine doses a year under a 10-year government partnership |
| In March 2025, Novartis gained a Pharmaceutical Benefits Scheme listing for inclisiran. | Brings a twice-yearly RNA interference injection to patients with high cholesterol |
| In May 2025, vutrisiran was listed for hereditary transthyretin amyloidosis. | Adds a second subsidized RNA interference drug, supplied through Medison Pharma Australia |
| In October 2025, the national regulator approved Pfizer's Comirnaty LP.8.1 vaccine. | Keeps variant-updated mRNA vaccines in annual national programs |
Conjugates, lipid carriers and vectors change delivery
- Ligand-conjugated delivery attaches sugar groups that steer small interfering RNA to the liver, which allows dosing every three to six months.
- Lipid nanoparticle delivery wraps mRNA in fat-based carriers that protect it and help it enter cells, which underpins local vaccine production.
- Unconjugated oligonucleotide delivery places antisense drugs directly into spinal fluid, which suits neuromuscular disease but needs hospital teams.
- Viral vector delivery uses modified viruses to carry a working gene in a single infusion, which supports one-time treatment for infants.
Need a Custom Version of This Report?
Tailor the scope, geography, or segments to your exact requirements.
- Custom geography or segment scope
- Direct access to our analyst team
Originators compete through subsidy deals and local partners
Competition is led by global originators that sell through Australian subsidiaries and specialist partners. Biogen Australia sponsors nusinersen, which gained a listing for pre-symptomatic spinal muscular atrophy in March 2024. Novartis supplies both inclisiran for high cholesterol and onasemnogene abeparvovec for infants with spinal muscular atrophy. Alnylam Pharmaceuticals expanded its partnership with Medison in April 2024 to cover Australia, and Medison sponsors vutrisiran locally. Moderna runs a plant in Clayton and a regional headquarters in Melbourne, while Pfizer supplies Comirnaty for annual programs. Rivals compete on clinical evidence, dosing interval, subsidy terms and local service support, while specialist distributors help smaller sponsors reach patients with rare disease. Local manufacturing, newborn screening links and nurse education programs have also become important ways for suppliers to win hospital and prescriber support across the states.
Companies profiled and their roles in this market
| Company | Type | Role in the market |
|---|---|---|
| Biogen | Originator | Sponsors nusinersen for spinal muscular atrophy |
| Novartis | Originator | Supplies inclisiran and onasemnogene abeparvovec |
| Pfizer | Originator | Supplies Comirnaty for national vaccine programs |
| Moderna | Originator and local manufacturer | Runs an mRNA vaccine plant in Clayton, Victoria |
| Alnylam Pharmaceuticals | Originator | Reaches Australia through a Medison partnership |
Credence Research view on Australian RNA medicine demand
Credence Research's view is that Australian demand for nucleic acid-based therapeutics will grow quickly because federal subsidy now covers RNA medicines for common as well as rare conditions. RNA interference drugs for cholesterol and amyloidosis should add the most patients, while antisense drugs and gene therapies keep high value per patient. Local mRNA production gives the country a stable vaccine base and a platform for new products. However, high prices, small patient groups and complex delivery will slow some launches. Sponsors with strong subsidy strategies and local delivery support should gain share fastest.
PBS records and approvals anchor the sizing
The report uses 2025 as the base year on a calendar basis, and market values come from the Credence Research model. That model combines Pharmaceutical Benefits Scheme listing records, national regulator approvals, government announcements on vaccine supply and manufacturing, population statistics, World Bank health spending data and company information on products. Segment splits and regional growth rates are Credence Research estimates, while regional shares follow the client-defined split. Sources used are public reports, official statistics, trade press and company websites, and no interviews or surveys were used.
Wider subsidy and local supply carry growth to 2035
Sales of nucleic acid-based therapeutics in Australia are expected to reach USD 4.35 billion by 2035, a 15.72% CAGR during 2026–2035, as subsidy listings, local mRNA supply and wider indications keep demand rising. Growth should be strongest through 2030 while cholesterol and amyloidosis treatment spreads into community care. After that, new cancer and rare disease products from local trials should carry more growth. Slower subsidy decisions would lower this outlook, while faster approval of new indications would raise it. Sponsors that pair strong evidence with local delivery support are expected to gain the most.
Frequently Asked Questions
How big is the Australia nucleic acid-based therapeutics market?
Which product type leads demand in Australia?
Which region leads the Australia nucleic acid-based therapeutics market?
Which RNA medicines gained subsidy in 2025?
Does Australia make mRNA vaccines locally?
Which disease area is growing fastest?
Who are the leading suppliers of nucleic acid medicines in Australia?
What are the main challenges for suppliers?
Table of Content
Chapter 1 Market Segmentation
- 1.1 Segmentation Framework
- 1.1.1 Product and Service Classification
- 1.1.2 Application and End-Use Classification
- 1.1.3 Technology and Solution Classification
- 1.1.4 Customer and Distribution Channel Classification
- 1.1.5 Geographic Segmentation
- 1.1.6 Market Segment Definitions and Boundaries
- 1.2 By Product Type
- 1.2.1 Antisense oligonucleotide therapeutics
- 1.2.2 RNA interference therapeutics
- 1.2.3 mRNA therapeutics
- 1.2.4 Nucleic-acid-payload gene therapies
- 1.2.5 Aptamer and emerging oligonucleotide therapeutics
- 1.3 By Disease Area
- 1.3.1 Neuromuscular disorders
- 1.3.2 Cardiovascular and metabolic disorders
- 1.3.3 Infectious diseases
- 1.3.4 Haematological and ophthalmic disorders
- 1.3.5 Oncology and remaining rare disorders
- 1.4 By Care Setting
- 1.4.1 Tertiary hospital treatment
- 1.4.2 Specialist outpatient treatment
- 1.4.3 Community clinical administration
- 1.4.4 Supported home administration
- 1.5 By Channel
- 1.5.1 Reimbursed prescription supply
- 1.5.2 Government vaccine procurement
- 1.5.3 Hospital formulary procurement
- 1.5.4 Special-access and private procurement
Chapter 2 Introduction
- 2.1 Report Objectives and Scope
- 2.2 Product Definition and Industry Terminology
- 2.3 Market Inclusions and Exclusions
- 2.4 Research Process
- 2.4.1 Primary Research and Expert Interviews
- 2.4.2 Secondary Research and Source Review
- 2.4.3 Top-Down and Bottom-Up Estimation
- 2.4.4 Data Triangulation and Verification
- 2.5 Market Size Measurement Basis
- 2.5.1 2025: USD 1.00 billion → 2035: USD 4.35 billion
- 2.6 Historical and Forecast Reference Periods
- 2.6.1 Historical Period: 2018-2025
- 2.6.2 Base Year: 2025
- 2.6.3 Forecast Period: 2025-2035
- 2.7 Research Assumptions and Limitations
Chapter 3 Executive Summary
- 3.1 Market Snapshot and Key Findings
- 3.2 Base-Year Market Size, 2025
- 3.3 Forecast Market Size, 2035
- 3.4 Revenue and Volume Growth Outlook
- 3.5 Key Demand and Supply Indicators
- 3.6 Leading Market Segments
- 3.7 Fastest-Growing Market Opportunities
- 3.8 Regional Performance Highlights
- 3.9 Technology and Industry Transformation
- 3.10 Competitive Landscape Summary
- 3.11 Analyst View and Strategic Implications
Chapter 4 Australia Nucleic Acid-Based Therapeutics Market Trends and Developments
- 4.1 Historical Industry Development, 2018-2025
- 4.2 Recent Market Trends and Developments
- 4.3 Demand and Customer Behavior Trends
- 4.4 Technology and Product Innovation
- 4.5 Artificial Intelligence, Automation and Digitalization
- 4.6 Local Manufacturing and Supply Chain Realignment
- 4.7 Industry Partnerships, Mergers and Acquisitions
- 4.8 Sustainability and Circular Economy Developments
- 4.9 Government and Private Sector Investment Trends
- 4.10 Emerging Business Models and Commercialization
- 4.11 Industry Developments and Announcements
Chapter 5 Australia Nucleic Acid-Based Therapeutics Market Production, Supply and Demand Analysis
- 5.1 Demand Trend and Consumption Analysis, 2018-2025
- 5.2 Demand Forecast, 2025-2035
- 5.3 Production and Output Trend, 2018-2025
- 5.4 Production and Output Forecast, 2025-2035
- 5.5 Installed Capacity and Capacity Utilization
- 5.6 Company-Wise Production Plants and Statistics
- 5.6.1 Installed Production Capacity
- 5.6.2 Actual Production
- 5.6.3 Planned Capacity and Expansion Targets
- 5.7 Supply Chain Structure and Procurement Trends
- 5.8 Supply-Demand Gap and Bottlenecks
- 5.9 Import Dependence and Sourcing Structure
- 5.10 Contract Manufacturing and Outsourcing
- 5.11 Regional Supply and Demand Concentration
Chapter 6 Australia Nucleic Acid-Based Therapeutics Market Pricing Analysis
- 6.1 Pricing Structure and Measurement
- 6.2 Historical Pricing Trends, 2018-2025
- 6.3 Pricing Outlook, 2025-2035
- 6.4 Average Selling Price and Unit Economics
- 6.5 Pricing by Product and Market Segment
- 6.6 Geographic Pricing Differences
- 6.7 Key Input, Energy, Labor and Logistics Costs
- 6.8 Contract Pricing and Purchasing Models
- 6.9 Pricing Sensitivity and Competitive Positioning
- 6.10 Price, Margin and Profitability Implications
Chapter 7 Australia Nucleic Acid-Based Therapeutics Market Dynamics
- 7.1 Market Growth Drivers
- 7.1.1 Demand-Side Drivers
- 7.1.2 Technology and Innovation Drivers
- 7.1.3 Infrastructure and Investment Drivers
- 7.1.4 Regulatory and Policy Drivers
- 7.2 Market Restraints
- 7.2.1 Cost and Affordability Constraints
- 7.2.2 Technology and Adoption Barriers
- 7.2.3 Supply Chain and Operational Constraints
- 7.3 Market Challenges
- 7.3.1 Competitive Pressure and Margin Erosion
- 7.3.2 Skills, Infrastructure and Implementation Gaps
- 7.4 Emerging Market Opportunities
- 7.5 Market Dynamics Impact and Time-Horizon Assessment
Chapter 8 Australia Nucleic Acid-Based Therapeutics Value Chain Analysis
- 8.1 Industry Value Chain Overview
- 8.2 Upstream Suppliers and Critical Inputs
- 8.3 Technology and Component Providers
- 8.4 Manufacturing or Service Delivery
- 8.5 Distribution, Channel Partners and Integrators
- 8.6 Downstream Applications and End Users
- 8.7 Value Addition and Profit Pools
- 8.8 Vertical Integration and Outsourcing
- 8.9 Supplier Concentration and Risk
- 8.10 Supply Chain Localization and Resilience
Chapter 9 Australia Nucleic Acid-Based Therapeutics Market Regulations and Policies
- 9.1 Relevant Laws, Standards and Compliance Frameworks
- 9.2 Product, Service, Safety and Quality Requirements
- 9.3 Government Policies, Incentives and Subsidies
- 9.4 Imports, Exports and Trade Barriers
- 9.5 Public Procurement and Local Content Requirements
- 9.6 Environmental and Sustainability Compliance
- 9.7 Upcoming Policy Changes and Market Implications
Chapter 10 Australia Nucleic Acid-Based Therapeutics Market Hotspots and Opportunities
- 10.1 Market Opportunity Mapping and Growth Hotspots
- 10.2 High-Growth Applications and Customer Groups
- 10.3 Underserved Markets and White-Space Opportunities
- 10.4 Emerging Technology and Product Opportunities
- 10.5 New Capacity and Investment Hotspots
- 10.6 Market Entry and Expansion Opportunities
- 10.7 Distribution and Partnership Opportunities
- 10.8 Near-Term and Long-Term Commercial Potential
- 10.9 Opportunity Attractiveness and Execution Risks
Chapter 11 Australia Nucleic Acid-Based Therapeutics Market Outlook, 2025-2035
- 11.1 Market Size and Analysis
- 11.1.1 Revenue (Market Measurement: 2025: USD 1.00 billion → 2035: USD 4.35 billion)
- 11.1.2 Market Volume and Quantity Sold
- 11.1.3 Historical Market Size, 2018-2025
- 11.1.4 Base-Year Market Size, 2025
- 11.2 Market Forecast, 2025-2035
- 11.2.1 Revenue Forecast to 2035
- 11.2.2 Volume Forecast to 2035
- 11.2.3 CAGR and Year-on-Year Growth
- 11.2.4 Incremental Revenue Opportunity
- 11.3 Forecast Assumptions and Scenario Analysis
- 11.3.1 Base-Case Forecast
- 11.3.2 Optimistic and Conservative Scenarios
- 11.3.3 Technology, Pricing and Policy Sensitivities
- 11.4 Market Attractiveness and Growth Outlook
Chapter 12 Australia Nucleic Acid-Based Therapeutics Market Segmentation and Outlook
- 12.1 Segmentation Summary and Market Shares, 2025
- 12.2 Largest and Fastest-Growing Segments
- 12.3 By Product Type - Market Size and Forecast, 2025-2035
- 12.3.1 Segment Definition and Scope
- 12.3.2 Historical Market Size, 2018-2025
- 12.3.3 Revenue Forecast, 2025-2035
- 12.3.4 Volume Forecast, 2025-2035
- 12.3.5 Base-Year Market Share, 2025
- 12.3.6 Segment CAGR and Growth Drivers
- 12.3.7 Subsegment Market Size and Forecast
- 12.3.7.1 Antisense oligonucleotide therapeutics
- 12.3.7.2 RNA interference therapeutics
- 12.3.7.3 mRNA therapeutics
- 12.3.7.4 Nucleic-acid-payload gene therapies
- 12.3.7.5 Aptamer and emerging oligonucleotide therapeutics
- 12.3.8 Subsegment Pricing and Adoption Trends
- 12.3.9 Leading Suppliers and Competition
- 12.3.10 Regional Demand and Opportunities
- 12.4 By Disease Area - Market Size and Forecast, 2025-2035
- 12.4.1 Segment Definition and Scope
- 12.4.2 Historical Market Size, 2018-2025
- 12.4.3 Revenue Forecast, 2025-2035
- 12.4.4 Volume Forecast, 2025-2035
- 12.4.5 Base-Year Market Share, 2025
- 12.4.6 Segment CAGR and Growth Drivers
- 12.4.7 Subsegment Market Size and Forecast
- 12.4.7.1 Neuromuscular disorders
- 12.4.7.2 Cardiovascular and metabolic disorders
- 12.4.7.3 Infectious diseases
- 12.4.7.4 Haematological and ophthalmic disorders
- 12.4.7.5 Oncology and remaining rare disorders
- 12.4.8 Subsegment Pricing and Adoption Trends
- 12.4.9 Leading Suppliers and Competition
- 12.4.10 Regional Demand and Opportunities
- 12.5 By Care Setting - Market Size and Forecast, 2025-2035
- 12.5.1 Segment Definition and Scope
- 12.5.2 Historical Market Size, 2018-2025
- 12.5.3 Revenue Forecast, 2025-2035
- 12.5.4 Volume Forecast, 2025-2035
- 12.5.5 Base-Year Market Share, 2025
- 12.5.6 Segment CAGR and Growth Drivers
- 12.5.7 Subsegment Market Size and Forecast
- 12.5.7.1 Tertiary hospital treatment
- 12.5.7.2 Specialist outpatient treatment
- 12.5.7.3 Community clinical administration
- 12.5.7.4 Supported home administration
- 12.5.8 Subsegment Pricing and Adoption Trends
- 12.5.9 Leading Suppliers and Competition
- 12.5.10 Regional Demand and Opportunities
- 12.6 By Channel - Market Size and Forecast, 2025-2035
- 12.6.1 Segment Definition and Scope
- 12.6.2 Historical Market Size, 2018-2025
- 12.6.3 Revenue Forecast, 2025-2035
- 12.6.4 Volume Forecast, 2025-2035
- 12.6.5 Base-Year Market Share, 2025
- 12.6.6 Segment CAGR and Growth Drivers
- 12.6.7 Subsegment Market Size and Forecast
- 12.6.7.1 Reimbursed prescription supply
- 12.6.7.2 Government vaccine procurement
- 12.6.7.3 Hospital formulary procurement
- 12.6.7.4 Special-access and private procurement
- 12.6.8 Subsegment Pricing and Adoption Trends
- 12.6.9 Leading Suppliers and Competition
- 12.6.10 Regional Demand and Opportunities
- 12.7 Segment Growth Comparison
- 12.8 Segment Attractiveness and Priority Matrix
Chapter 13 Australia Nucleic Acid-Based Therapeutics Geographic Market Outlook, 2025-2035
- 13.1 Domestic Market Distribution and Demand Clusters
- 13.2 State- or Province-Wise Market Size and Forecast, 2025-2035
- 13.3 City and Metropolitan Market Outlook
- 13.4 Industrial, Manufacturing and Commercial Clusters
- 13.5 Geographic Concentration of Key End Users
- 13.6 Local Pricing and Purchasing Differences
- 13.7 Domestic Production Facilities and Capacity Map
- 13.8 Local Infrastructure and Project Pipeline
- 13.9 State-Level Policy and Incentive Differences
- 13.10 Subnational Investment Hotspots and Opportunities
- 13.11 Distribution and Logistics Networks
- 13.12 Domestic Competitive Footprint
Chapter 14 Australia Nucleic Acid-Based Therapeutics Technology, Innovation and Sustainability Outlook
- 14.1 Technology Landscape and Maturity
- 14.2 Product, Process and Service Innovation
- 14.3 AI, Automation and Digital Tools in the Industry
- 14.4 Technology Adoption and Performance Benchmarking
- 14.5 Innovation Pipeline and R&D Investment
- 14.6 Patent and Intellectual Property Trends
- 14.7 Energy Efficiency and Resource Management
- 14.8 Sustainability, Recycling and Circularity
- 14.9 Technology Roadmap, 2025-2035
- 14.10 Risks of Obsolescence and Technology Substitution
Chapter 15 Australia Nucleic Acid-Based Therapeutics Market Key Strategic Imperatives
- 15.1 Growth and Market Entry Priorities
- 15.2 High-Return Products and Segments
- 15.3 Pricing, Profitability and Cost Optimization
- 15.4 Technology Investment and Product Differentiation
- 15.5 Supply Chain Localization and Resilience
- 15.6 Distribution and Customer Acquisition
- 15.7 Partnership, Acquisition and Capacity Strategy
- 15.8 Regional Expansion Priorities
- 15.9 Short-, Medium- and Long-Term Actions
Chapter 16 Competition Outlook
- 16.1 Industry Competition Characteristics
- 16.2 Market Structure and Concentration
- 16.3 Market Share and Competitive Positioning, 2025
- 16.4 Company-Wise Revenue and Product Benchmarking
- 16.5 Production and Service Capacity Benchmarking
- 16.6 Technology, Pricing and Differentiation
- 16.7 Regional Footprint and Distribution Strength
- 16.8 Mergers, Acquisitions and Strategic Alliances
- 16.9 New Entrants and Competitive Threats
- 16.10 Porter's Five Forces and Industry Attractiveness
- 16.11 Competitive Outlook, 2025-2035
Chapter 17 Company Profiles
- 17.1 Company Coverage and Selection Criteria
- 17.2 Biogen
- 17.2.1 Business Description
- 17.2.2 Company Ownership and Geographic Presence
- 17.2.3 Product and Service Portfolio
- 17.2.4 Manufacturing and Operating Footprint
- 17.2.5 Production Capacity and Expansion Plans
- 17.2.6 Financial Performance and Investment
- 17.2.7 Market Share and Competitive Position
- 17.2.8 Technology and Innovation Capabilities
- 17.2.9 Strategic Alliances or Partnerships
- 17.2.10 Recent Developments
- 17.2.11 Growth Strategy and Outlook
- 17.3 Novartis
- 17.4 Pfizer
- 17.5 Moderna
- 17.6 Alnylam Pharmaceuticals
- 17.7 Other Relevant Market Participants
Note: Every listed company is profiled on the structure shown under the first company. The company list is preliminary and may change based on research findings, market developments, data availability and client requirements.
Chapter 18 Disclaimer
- 18.1 Research and Forecast Disclaimer
- 18.2 Data Source and Estimation Limitations
Note: The depth of individual sections depends on data availability for this market. Volume, capacity, trade and other unit-based metrics are included where applicable.

