
Medicare licence reform reshapes scanner deployment
The Australia mobile MRI services market was valued at USD 36.5 million in 2025 and is projected to increase from USD 39.9 million in 2026 to USD 99.7 million by 2035, registering a CAGR of 10.71% during 2026–2035. Demand comes from public and private hospitals that need temporary scanning while fixed rooms are replaced, from regional health services that book scheduled outreach visits, and from intensive care units that test bedside units. Eastern Australia held the largest regional share, 78.5% in 2025, because most hospitals, radiology networks and patients sit along the east coast. Western Australia is the fastest-growing region at 11.60% a year, as long distances and population growth favor relocatable and portable scanning. Services are sold as fully staffed contracts or equipment rentals, and Medicare eligibility rules shape which scans attract a rebate. The move to practice-based MRI licences from July 2025 also widened the pool of scanners that can bill Medicare.
Which relocatable scanning services does the estimate count?
The estimate measures the value of magnetic resonance imaging delivered from trailers, relocatable suites and portable scanners in Australia, including fully staffed service contracts, equipment rentals and per-scan fees. It covers services bought by public health services, private hospitals and radiology groups, as well as scans paid for directly by patients. Values are stated at contract and fee prices and include Medicare-rebated and privately billed scans.
The estimate excludes the sale of fixed and relocatable scanners, contrast agents and reporting services when priced separately, as well as fixed scanning rooms run by radiology clinics. The value chain runs from scanner makers and leasing firms through radiology networks and specialist operators to hospitals and outreach sites, where accredited practices bill eligible scans to Medicare.
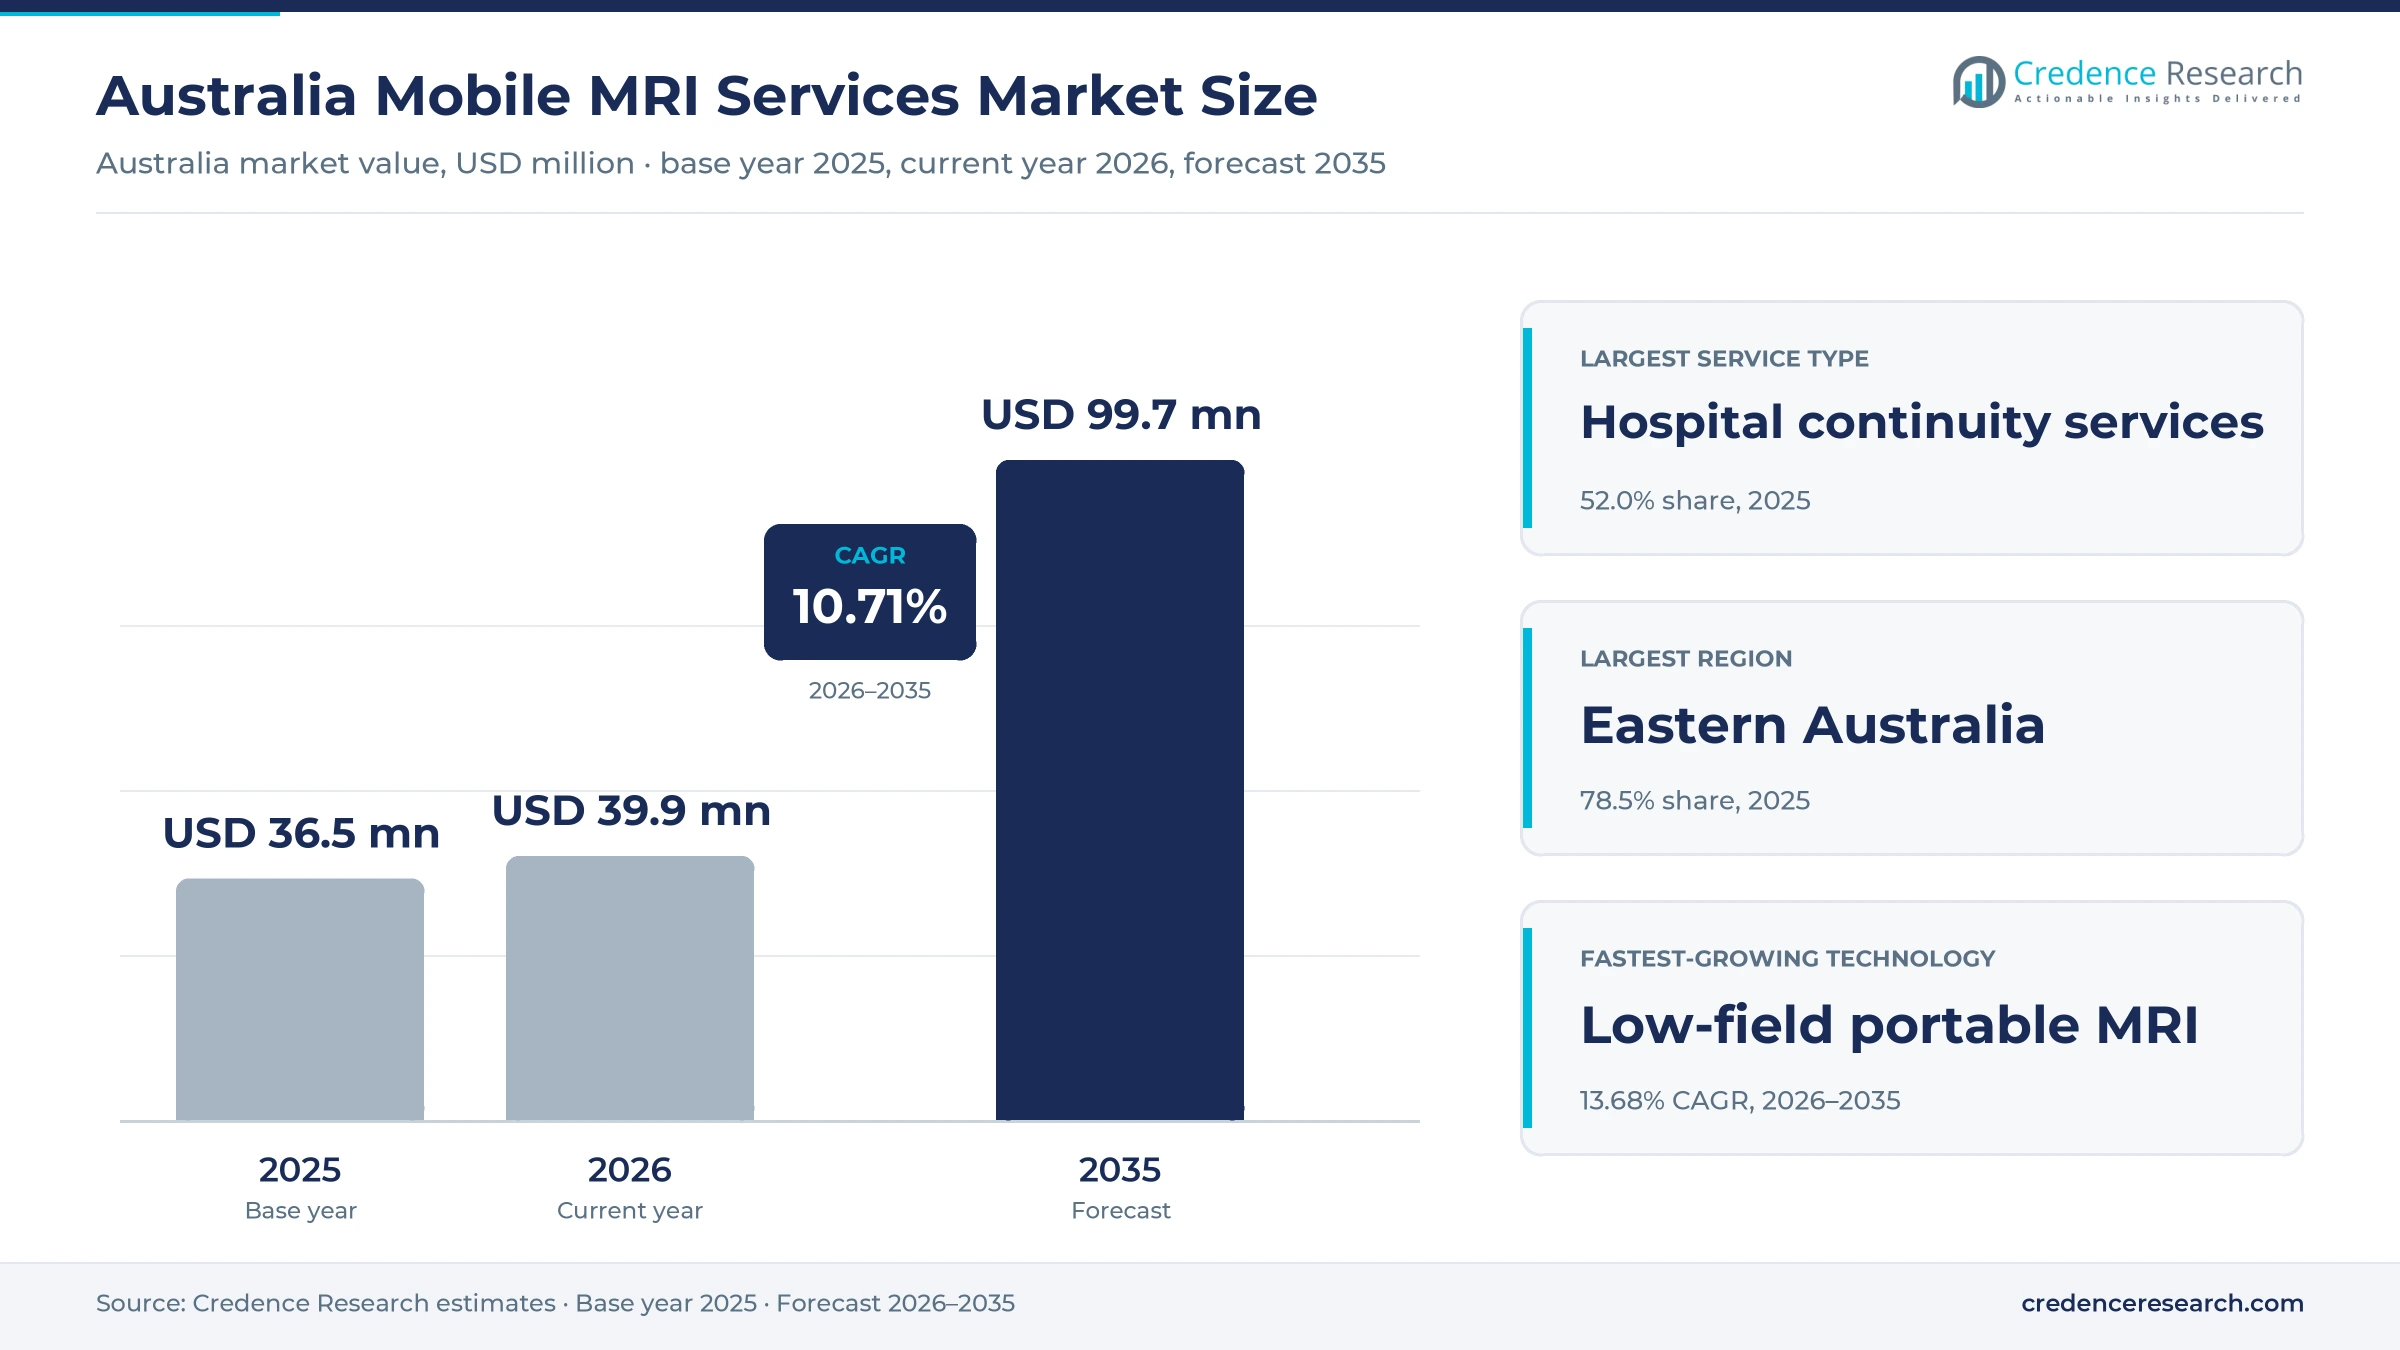
Australia Mobile MRI Services Market Insights
- The Australia mobile MRI services market was valued at USD 36.5 million in 2025 and is projected to reach USD 99.7 million by 2035, registering a CAGR of 10.71% during 2026–2035.
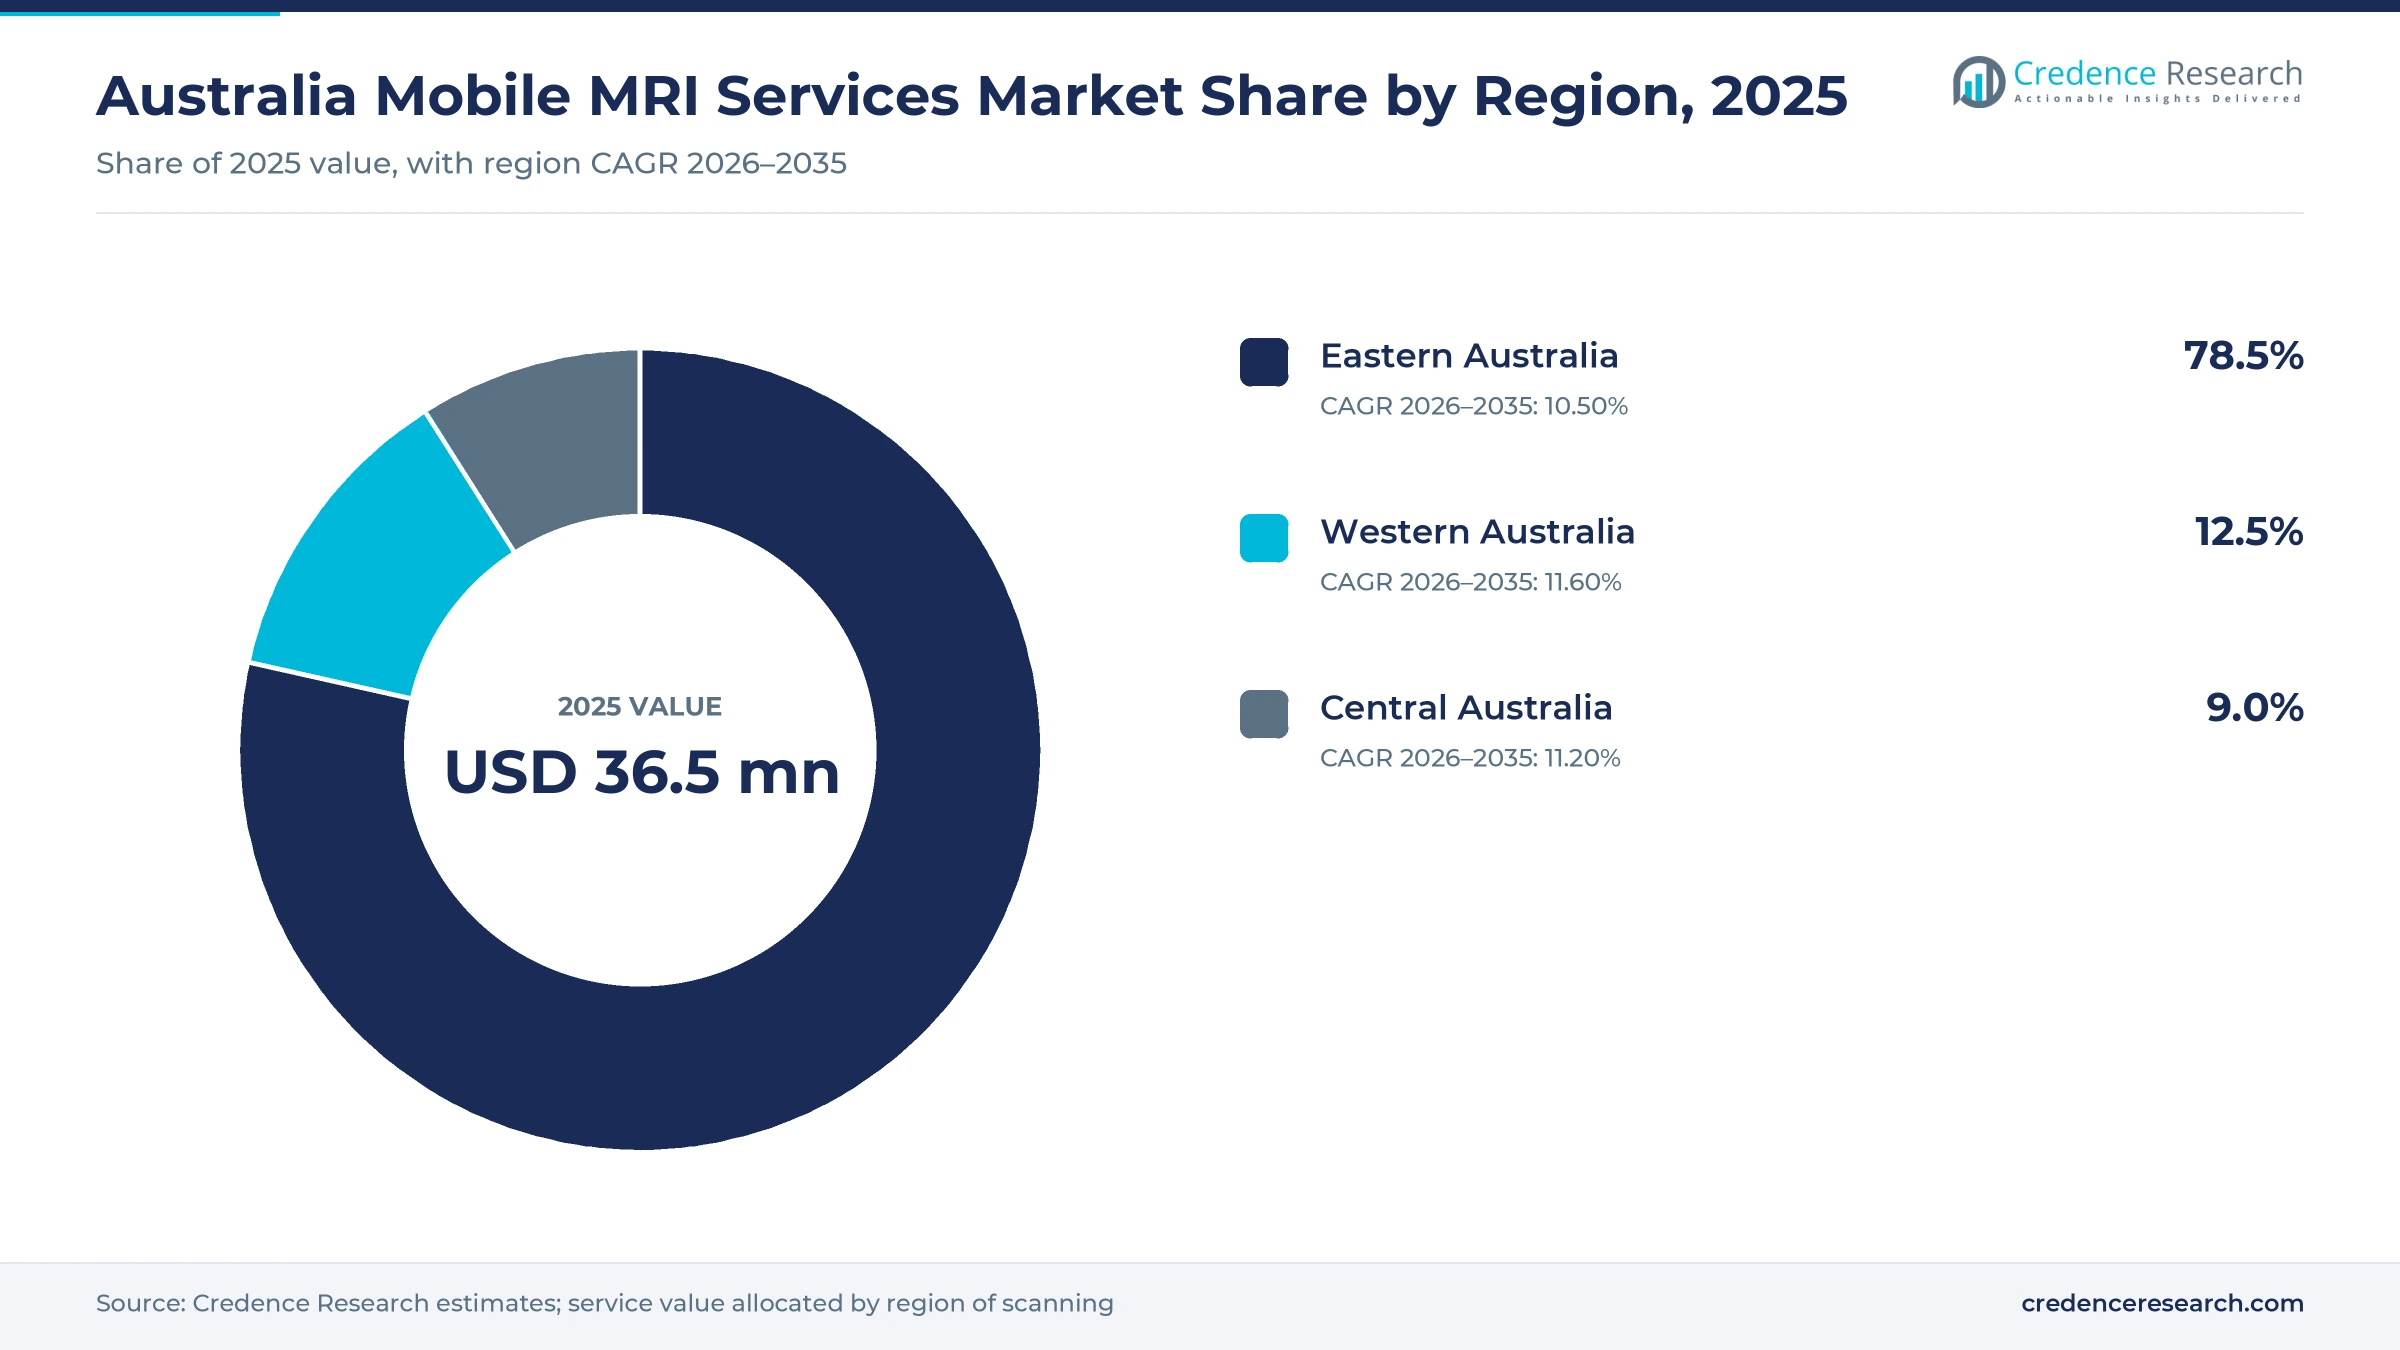
- Eastern Australia held a 78.5% share of 2025 value, because most hospitals, radiology networks and patients are located along the east coast.
- Hospital continuity services led with a 52.0% share of 2025 value, because hospitals rent scanners while fixed rooms are replaced or upgraded.
- From July 1, 2025, MRI licences in metropolitan areas moved from individual machines to whole practices, and the licence rule is set to end on July 1, 2027.
- Regional, rural and remote areas classed as Modified Monash 2 to 7 have had MRI licensing removed since Nov. 1, 2022.
Hospital continuity leads as bedside scanning grows fastest
Why do hospital continuity contracts lead demand?
Based on service type, the market is categorized into hospital continuity services, scheduled outreach services and bedside diagnostic services. Hospital Continuity Services led with a 52.0% share of 2025 value, because hospitals rent trailers while fixed rooms are replaced or waiting lists grow. Bedside Diagnostic Services grow fastest at 12.62% a year, as intensive care units test portable scanners that come to the patient.
How do community outreach sites gain ground?
Based on care setting, the market is categorized into public hospital sites, private hospital sites and community outreach sites. Public Hospital Sites led with a 46.0% share of 2025 value, because state health services run the largest scanning loads. Community Outreach Sites grow fastest at 11.58% a year, as regional towns book scheduled visits instead of sending patients to capital cities.
Why are private healthcare purchasers growing faster?
Based on customer type, the market is categorized into public health purchasers, private healthcare purchasers and direct patient purchasers. Public Health Purchasers led with a 55.0% share of 2025 value, because state health departments fund hospital continuity contracts. Private Healthcare Purchasers grow fastest at 11.11% a year, as radiology groups add capacity under wider Medicare eligibility.
Why is low-field portable scanning growing fastest?
Based on technology, the market is categorized into 1.5T mobile MRI, 3T mobile MRI and low-field portable MRI. 1.5T Mobile MRI led with a 68.0% share of 2025 value, because most trailers carry proven 1.5 tesla systems that suit general scanning. Low-Field Portable MRI grows fastest at 13.68% a year, as bedside units plug into a standard wall outlet and need no shielded room.
| Segment Group | Leading Sub-segment | Share, 2025 | Fastest-growing Sub-segment | CAGR, 2026–2035 |
|---|---|---|---|---|
| By Service Type | Hospital Continuity Services | 52.0% | Bedside Diagnostic Services | 12.62% |
| By Care Setting | Public Hospital Sites | 46.0% | Community Outreach Sites | 11.58% |
| By Customer Type | Public Health Purchasers | 55.0% | Private Healthcare Purchasers | 11.11% |
| By Technology | 1.5T Mobile MRI | 68.0% | Low-Field Portable MRI | 13.68% |
Request a Free Sample
Fill in your details and we'll send you a free sample report.
- Sample data tables & charts
- Research methodology
Eligibility reform and regional access lift scanning demand
How does practice-based eligibility expansion lift scan volumes?
Practice-based eligibility expansion lifts scan volumes, because more scanners can now bill Medicare for a full range of studies. From July 1, 2025, any metropolitan practice with a current licence gained a practice-based licence covering all its MRI equipment, according to the Department of Health. From July 1, 2027, scanners at comprehensive imaging practices that are still ineligible will gain full access, and licence rules will end. The same budget measure set aside A$162.6 million for three imaging reforms. As a result, private healthcare purchasers grow at 11.11% a year, as radiology groups add capacity that relocatable units can supply quickly while new rooms are built.
Why do regional access requirements support outreach demand?
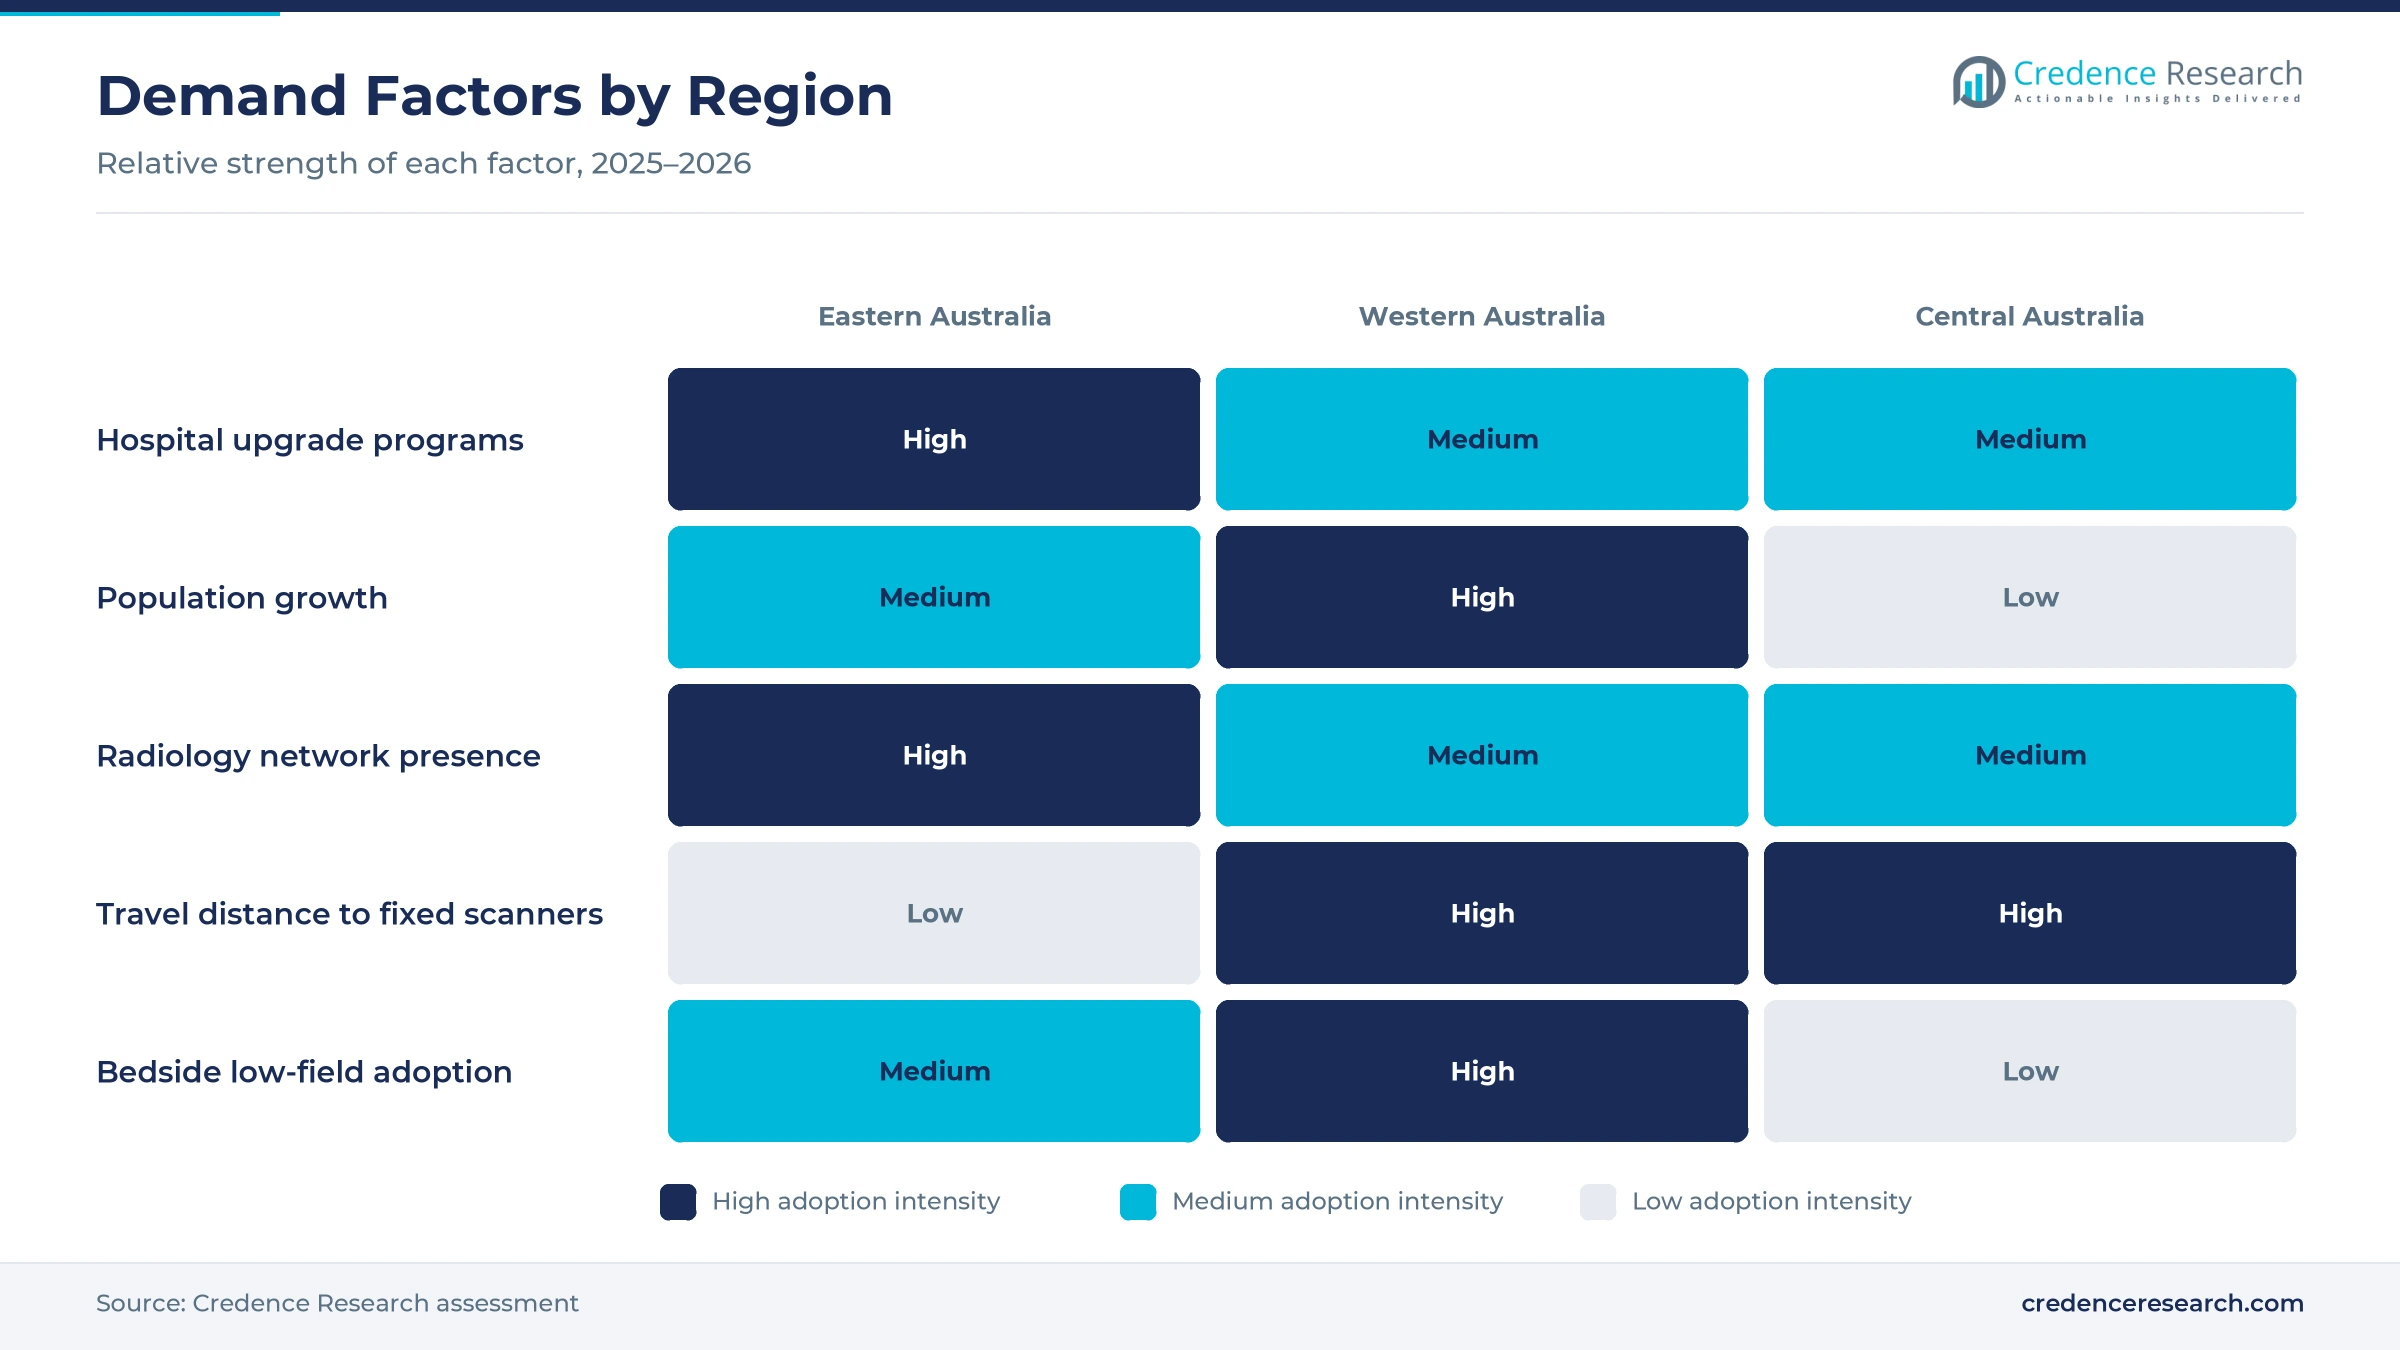
Regional access requirements support outreach demand, because patients outside capital cities face long trips for MRI. The federal government removed MRI licensing in Modified Monash 2 to seven areas from Nov. 1, 2022, under an A$66 million measure spread over four years. Health spending equaled 10.4% of GDP in 2023, according to World Bank data, which gives states room to fund outreach contracts. Western Australia also had the fastest population growth at 2.1% in the year to March 2026. In turn, community outreach sites grow at 11.58% a year, as regional towns book scheduled visits for patients who would otherwise travel to diagnostic imaging centers in capital cities.
How does portable imaging development open new uses?
Portable imaging development opens new uses, because low-field scanners can image the brain at the bedside without a shielded room. Hyperfine completed registration of its Swoop portable system in Australia on June 14, 2022, according to the company. The unit plugs into a standard wall outlet and is run from a tablet, and Alfred Health in Melbourne had used it for research since 2021. Royal Perth Hospital has also used the 0.064 tesla scanner since 2023 for bedside brain imaging, according to the RPH Research Foundation. As a result, low-field portable MRI grows at 13.68% a year, the fastest technology through 2035.
Why does fixed scanner replacement create continuity demand?
Fixed scanner replacement creates continuity demand, because hospitals must keep scanning while old magnets are removed and new rooms are fitted. In May 2023, Canberra Hospital took one of its 2 MRI machines offline for an A$9 million replacement and extended hours on the other. The hospital also sent some patients to private providers at no cost to them during the work. Australia's population reached 27.92 million at March 31, 2026, growing 1.4% over the year, which adds scans each year. In turn, hospital continuity services hold a 52.0% share of 2025 value, as hospitals rent trailers while upgrading their magnetic resonance imaging systems.
Network consolidation and low-field scanners reshape supply
How is the rise of larger radiology networks changing contracts?
The rise of larger radiology networks is changing contracts, because bigger groups can move scanners between sites and negotiate fleet deals. Integral Diagnostics consolidated Capitol Health from Dec. 20, 2024, and held 42 licensed MRI machines in Australia from July 2025, up from 23. The group runs 142 sites across Australia and New Zealand. Healius also agreed in September 2024 to sell Lumus Imaging to funds managed by Affinity Equity Partners, and the sale has since completed. As a result, private healthcare purchasers hold a large share of 2025 value, and operators that link scanning to teleradiology reporting can serve more remote sites.
Why is the shift to bedside low-field scanning gaining ground?
The shift to bedside low-field scanning is gaining ground, because moving unstable patients to a fixed scanner carries risk and needs staff. Royal Perth Hospital has used a 0.064 tesla portable scanner since 2023 in settings that include emergency and intensive care, far below the 1.5 or 3 tesla of fixed systems. The unit avoids patient transfers and the costly shielding of a fixed room. Hyperfine also said in June 2022 that several pilot units were ordered across major Australian cities through its distributor, Quantum Healthcare. In turn, bedside diagnostic services grow at 12.62% a year, the fastest service type, while hospitals use the scans to decide which patients need a full study.
Can the 2027 licence change open room for new fleets?
The 2027 licence change opens room for new fleets, because all existing and new MRI machines in metropolitan areas are set to become fully Medicare-eligible from July 1, 2027. Before that, non-essential moves of eligible machines were generally not approved from July 14, 2024 to July 1, 2025, which held back relocations. Patients could save up to A$700 on each scan under the first stage, according to Region Illawarra, and one Illawarra practice gained access to 120 Medicare scan types. As a result, providers that lease relocatable suites or refurbished scanners can win contracts quickly as demand moves to new sites.
Is there room for remote stroke and outreach imaging?
Remote stroke and outreach imaging creates room for suppliers, because patients in rural areas lose time on long transfers. In March 2021, the federal research fund gave up to A$8 million to Micro-X for a portable brain scanner within an A$40 million stroke program. That program aims to fit scanners into road ambulances and Royal Flying Doctor Service aircraft. The same fund invested A$100 million across three projects in stroke, epilepsy and lung disease. In turn, Central Australia grows at 11.20% a year, as outreach operators and hospital networks test new ways to bring brain imaging to remote communities.
Siting rules, staffing and capital costs slow fleet growth
How do siting rules limit relocations?
Siting rules limit relocations, because a scanner must be listed at a registered practice location to bill Medicare. Each move needs updated registration, accreditation and supervision by an eligible radiologist. As a result, operators spend time on paperwork before a trailer can scan at a new site. Providers respond by building long-term contracts at fixed host sites and by planning moves well ahead of planned room replacements.
Why do staff shortages slow fleet growth?
Staff shortages slow fleet growth, because each relocatable unit needs MRI radiographers and a supervising radiologist. Regional services find it hardest to recruit and keep these specialists. In turn, some outreach visits run fewer days than planned even when funding exists. Operators respond with remote supervision, standardized protocols and rotating staff from city clinics, which helps smaller teams deliver consistent image quality.
How do high capital costs limit new units?
High capital costs limit new units, because a staffed trailer with a 1.5 tesla or 3 tesla magnet costs millions of dollars to buy and fit out. Contracts must run for long periods before operators recover that cost. As a result, few firms can afford to run large fleets across the country. Providers respond with leasing, refurbished magnets and shared contracts across several hospitals that keep each unit busy for most of the year.
Why do road and climate conditions affect service quality?
Road and climate conditions affect service quality, because trailers travel long distances on rough roads in hot weather. Magnets need stable power, cooling and helium management at each site. In turn, breakdowns can cancel full days of bookings in remote towns. Operators respond with sealed helium designs, backup power and planned maintenance between visits, while portable low-field units avoid many of these limits.
East coast hospitals lead while Perth outreach grows fastest
| Region | Value, 2025 (USD million) | Share, 2025 | CAGR, 2026–2035 |
|---|---|---|---|
| Eastern Australia | 28.7 | 78.5% | 10.50% |
| Western Australia | 4.6 | 12.5% | 11.60% |
| Central Australia | 3.3 | 9.0% | 11.20% |
Why does Eastern Australia hold the largest share?
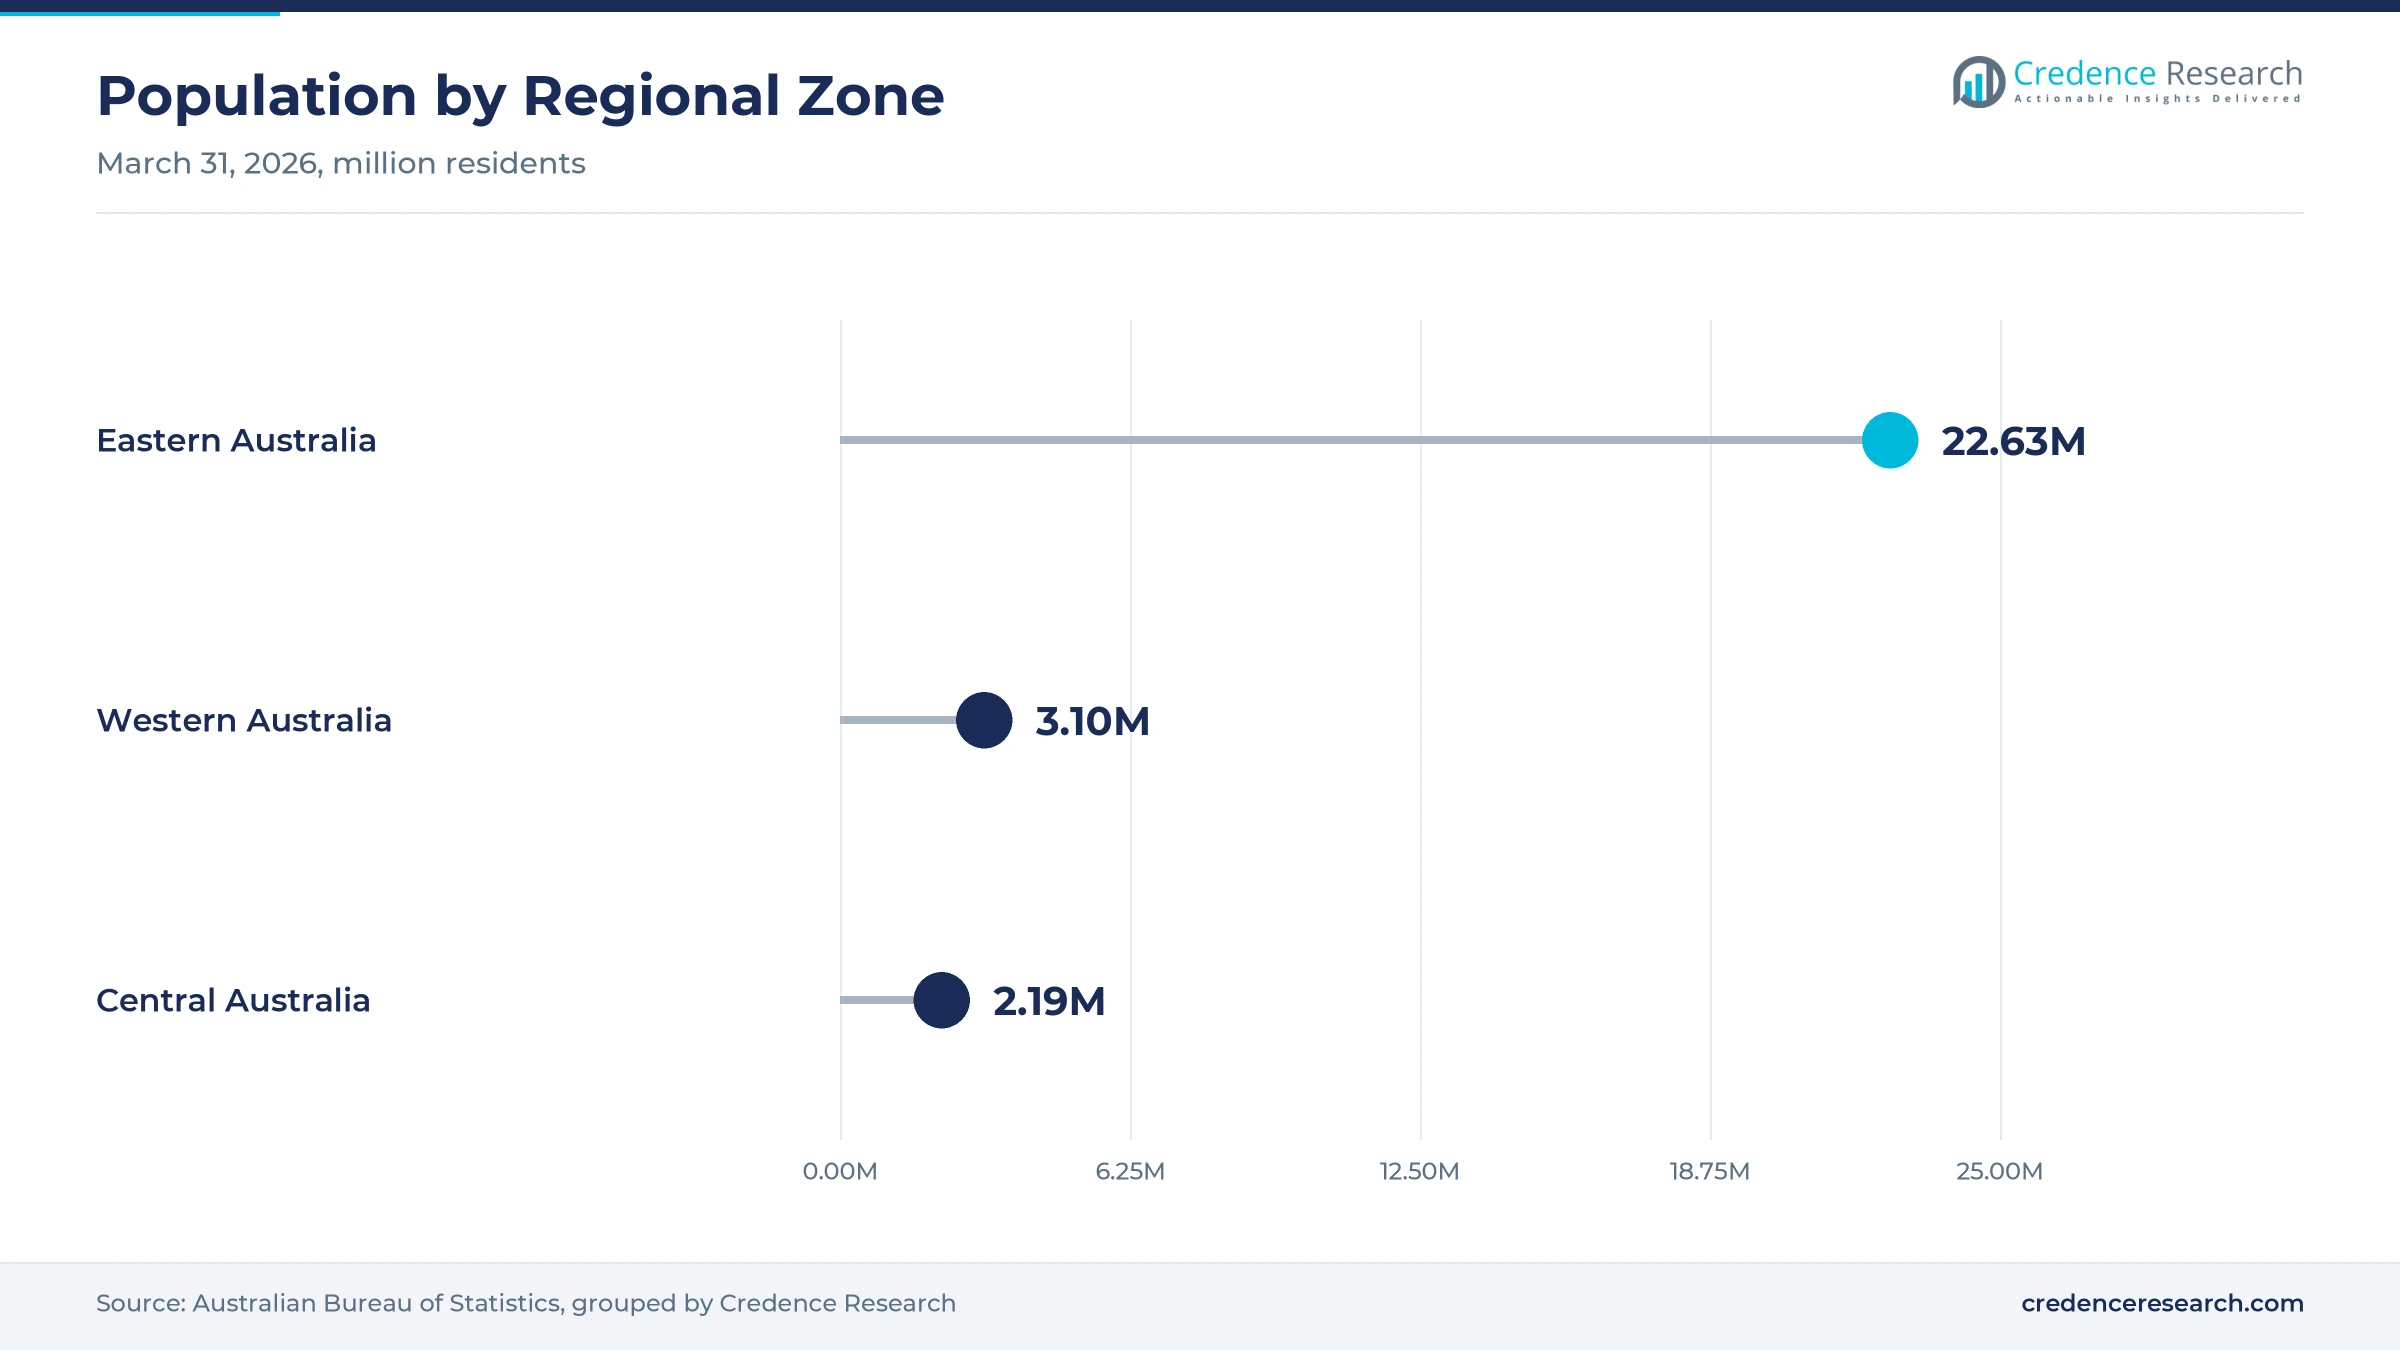
Eastern Australia held a 78.5% share of 2025 value and grows at 10.50% a year, because the zone had about 22.63 million residents at March 31, 2026 and hosts most hospitals and radiology networks. Large hospital upgrade programs in Sydney, Melbourne and Brisbane create a steady need for continuity contracts. However, growth is slower than in the other zones because many patients already live near fixed scanners. Practice-based licences from July 2025 also add fixed capacity in metropolitan areas.
How do remote mining towns lift scanning in Western Australia?
Western Australia held a 12.5% share of 2025 value and grows fastest at 11.60% a year, because the state had about 3.10 million residents and the fastest population growth at 2.1% in the year to March 2026. Mining and farming towns sit far from Perth, which makes scheduled outreach visits valuable. As a result, regional health services and Royal Perth Hospital, an early user of bedside low-field scanning, keep demand rising.
How does Central Australia use outreach scanning?
Central Australia accounted for 9.0% of 2025 value and grows at 11.20% a year, because South Australia and the Northern Territory had about 2.19 million residents at March 31, 2026. Adelaide hospitals serve a wide area, and remote Northern Territory communities face very long transfers. In turn, outreach visits and portable units help patients avoid flights to capital cities for each scan.
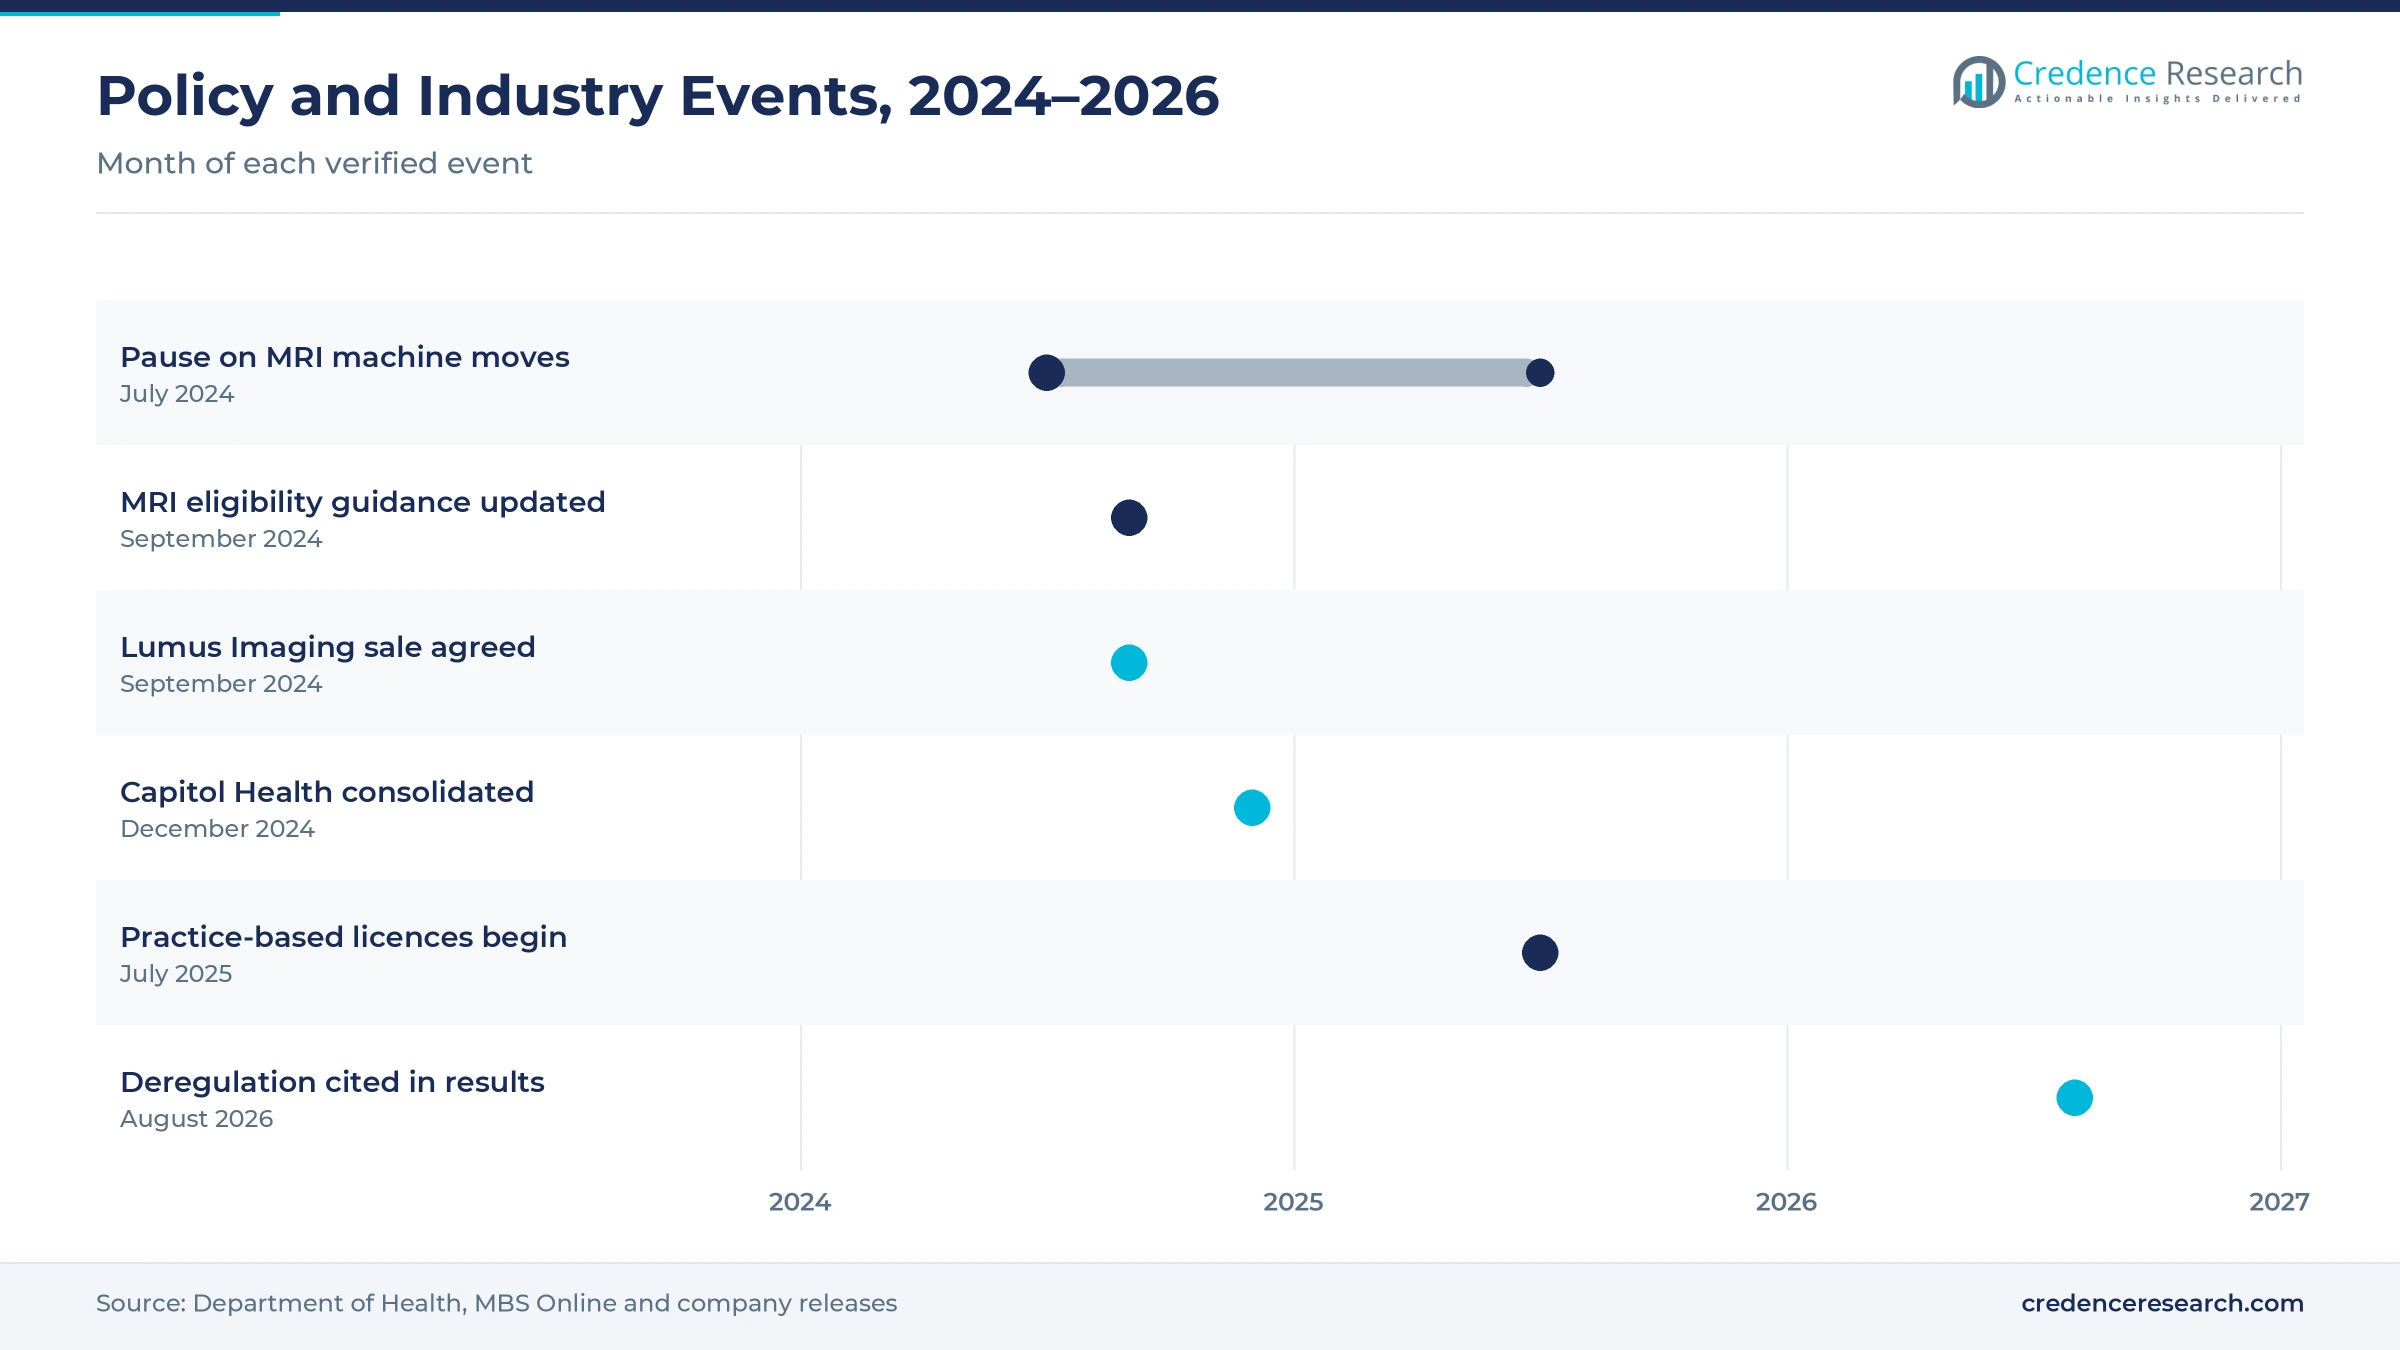
Licence reform and imaging deals marked 2024 to 2026
| Development | Status and market relevance |
|---|---|
| In July 2024, the federal government paused most non-essential moves of Medicare-eligible MRI machines. | Held back relocations until practice-based licences began in July 2025 |
| In September 2024, Healius agreed to sell Lumus Imaging to funds managed by Affinity Equity Partners. | Moved a national imaging network into private equity ownership |
| In December 2024, Integral Diagnostics began consolidating Capitol Health. | Created a larger network of 142 sites across Australia and New Zealand |
| In July 2025, MRI licences in metropolitan areas moved from machines to practices. | Made all partial and ineligible scanners at licensed practices fully Medicare-eligible |
| In August 2026, Integral Diagnostics reported that MRI deregulation supported growth. | Held 42 licensed MRI machines in Australia from July 2025, up from 23 |
Field strength and portability split the service fleet
- 1.5 tesla relocatable systems fit inside trailers and cover most general neurological and musculoskeletal studies, which keeps them the core of rental fleets.
- 3 tesla relocatable systems give sharper images for detailed brain, prostate and joint work, which suits private hospital contracts.
- Ultra-low-field portable scanners run at 0.064 tesla from a wall outlet, which allows bedside brain imaging in intensive care.
- Sealed helium magnets use far less liquid helium than older designs, which reduces refills and suits long road trips.
Need a Custom Version of This Report?
Tailor the scope, geography, or segments to your exact requirements.
- Custom geography or segment scope
- Direct access to our analyst team
Radiology networks compete on scale and hospital contracts
Competition is led by national radiology networks that run large scanner fleets and win hospital contracts. I-MED Radiology Network offers MRI at more than 110 clinics, which gives it staff and spare capacity for hospital support. Integral Diagnostics held 42 licensed MRI machines from July 2025 after consolidating Capitol Health, while Lumus Imaging now operates under Affinity Equity Partners. Qscan Group runs 3 tesla wide-bore scanning in Queensland, including a site at Upper Coomera on the Gold Coast. Rivals compete on scanner availability, radiologist supervision, contract length and reporting speed, while device makers and leasing firms supply relocatable suites. Portable low-field units, sold through local distributors, add a separate bedside segment that larger networks are now starting to watch closely.
Companies profiled and their roles in this market
| Company | Type | Role in the market |
|---|---|---|
| I-MED Radiology Network | Radiology network | Offers MRI at more than 110 clinics |
| Integral Diagnostics | Radiology network | Held 42 licensed MRI machines from July 2025 |
| Lumus Imaging | Radiology network | Sold by Healius to Affinity Equity Partners |
| Qscan Group | Radiology network | Runs 3 tesla wide-bore scanning in Queensland |
Credence Research view on Australian relocatable scanning
Credence Research's view is that Australian demand for mobile MRI services will grow steadily because Medicare eligibility is widening and regional patients still face long trips for scans. Hospital continuity contracts remain the base of the market, while bedside low-field units add the fastest growth from a small start. The end of licence rules in 2027 should free operators to move capacity where demand is highest. However, siting rules, staffing gaps and high capital costs will slow fleet growth. Networks with spare radiologists and remote reporting should gain share fastest.
Medicare rules and population data anchor the sizing
The report uses 2025 as the base year on a calendar basis, and market values come from the Credence Research model. That model combines Medicare MRI licensing rules and budget measures, population statistics, World Bank health spending data, hospital announcements and company information on scanner fleets and clinics. Regional shares, segment splits and growth rates are Credence Research estimates, because the client gave the three zones without shares. Sources used are public reports, official statistics, trade press and company websites, and no interviews or surveys were used.
Deregulation and remote care carry growth to 2035
Mobile MRI services in Australia are expected to reach USD 99.7 million by 2035, a 10.71% CAGR during 2026–2035, as eligibility reform, regional access needs and portable scanners keep demand rising. Growth should pick up after July 2027, when licence rules end and operators can place new units more freely. After that, bedside low-field scanning and remote outreach should carry more growth. Tighter state budgets would lower this outlook, while faster adoption of portable units would raise it. Operators with strong hospital contracts and remote reporting are expected to gain the most.
Frequently Asked Questions
How big is the Australia mobile MRI services market?
Which service type leads demand in Australia?
Which region leads the Australia mobile MRI services market?
How did Medicare MRI rules change in 2025?
What drives demand for relocatable scanning in Australia?
Which technology is growing fastest?
Who are the leading providers in Australia?
What are the main challenges for operators?
Table of Content
Chapter 1 Market Segmentation
- 1.1 Segmentation Framework
- 1.1.1 Product and Service Classification
- 1.1.2 Application and End-Use Classification
- 1.1.3 Technology and Solution Classification
- 1.1.4 Customer and Distribution Channel Classification
- 1.1.5 Geographic Segmentation
- 1.1.6 Market Segment Definitions and Boundaries
- 1.2 By Service Type
- 1.2.1 Hospital Continuity Services
- 1.2.2 Scheduled Outreach Services
- 1.2.3 Bedside Diagnostic Services
- 1.3 By Care Setting
- 1.3.1 Public Hospital Sites
- 1.3.2 Private Hospital Sites
- 1.3.3 Community Outreach Sites
- 1.4 By Customer Type
- 1.4.1 Public Health Purchasers
- 1.4.2 Private Healthcare Purchasers
- 1.4.3 Direct Patient Purchasers
- 1.5 By Technology
- 1.5.1 1.5T Mobile MRI
- 1.5.2 3T Mobile MRI
- 1.5.3 Low-Field Portable MRI
Chapter 2 Introduction
- 2.1 Report Objectives and Scope
- 2.2 Product Definition and Industry Terminology
- 2.3 Market Inclusions and Exclusions
- 2.4 Research Process
- 2.4.1 Primary Research and Expert Interviews
- 2.4.2 Secondary Research and Source Review
- 2.4.3 Top-Down and Bottom-Up Estimation
- 2.4.4 Data Triangulation and Verification
- 2.5 Market Size Measurement Basis
- 2.5.1 2025: USD 36.5 million → 2035: USD 99.7 million
- 2.6 Historical and Forecast Reference Periods
- 2.6.1 Historical Period: 2018-2025
- 2.6.2 Base Year: 2025
- 2.6.3 Forecast Period: 2025-2035
- 2.7 Research Assumptions and Limitations
Chapter 3 Executive Summary
- 3.1 Market Snapshot and Key Findings
- 3.2 Base-Year Market Size, 2025
- 3.3 Forecast Market Size, 2035
- 3.4 Revenue and Volume Growth Outlook
- 3.5 Key Demand and Supply Indicators
- 3.6 Leading Market Segments
- 3.7 Fastest-Growing Market Opportunities
- 3.8 Regional Performance Highlights
- 3.9 Technology and Industry Transformation
- 3.10 Competitive Landscape Summary
- 3.11 Analyst View and Strategic Implications
Chapter 4 Australia Mobile MRI Services Market Trends and Developments
- 4.1 Historical Industry Development, 2018-2025
- 4.2 Recent Market Trends and Developments
- 4.3 Demand and Customer Behavior Trends
- 4.4 Technology and Product Innovation
- 4.5 Artificial Intelligence, Automation and Digitalization
- 4.6 Local Manufacturing and Supply Chain Realignment
- 4.7 Industry Partnerships, Mergers and Acquisitions
- 4.8 Sustainability and Circular Economy Developments
- 4.9 Government and Private Sector Investment Trends
- 4.10 Emerging Business Models and Commercialization
- 4.11 Industry Developments and Announcements
Chapter 5 Australia Mobile MRI Services Market Supply and Demand Analysis
- 5.1 Demand Trend and Consumption Analysis, 2018-2025
- 5.2 Demand Forecast, 2025-2035
- 5.3 Supply Chain Structure and Procurement Trends
- 5.4 Supply-Demand Gap and Bottlenecks
- 5.5 Import Dependence and Sourcing Structure
- 5.6 Regional Supply and Demand Concentration
Chapter 6 Australia Mobile MRI Services Market Pricing Analysis
- 6.1 Pricing Structure and Measurement
- 6.2 Historical Pricing Trends, 2018-2025
- 6.3 Pricing Outlook, 2025-2035
- 6.4 Pricing by Product and Market Segment
- 6.5 Geographic Pricing Differences
- 6.6 Key Input, Energy, Labor and Logistics Costs
- 6.7 Contract Pricing and Purchasing Models
- 6.8 Pricing Sensitivity and Competitive Positioning
- 6.9 Price, Margin and Profitability Implications
Chapter 7 Australia Mobile MRI Services Market Dynamics
- 7.1 Market Growth Drivers
- 7.1.1 Demand-Side Drivers
- 7.1.2 Technology and Innovation Drivers
- 7.1.3 Infrastructure and Investment Drivers
- 7.1.4 Regulatory and Policy Drivers
- 7.2 Market Restraints
- 7.2.1 Cost and Affordability Constraints
- 7.2.2 Technology and Adoption Barriers
- 7.2.3 Supply Chain and Operational Constraints
- 7.3 Market Challenges
- 7.3.1 Competitive Pressure and Margin Erosion
- 7.3.2 Skills, Infrastructure and Implementation Gaps
- 7.4 Emerging Market Opportunities
- 7.5 Market Dynamics Impact and Time-Horizon Assessment
Chapter 8 Australia Mobile MRI Services Value Chain Analysis
- 8.1 Industry Value Chain Overview
- 8.2 Upstream Suppliers and Critical Inputs
- 8.3 Technology and Component Providers
- 8.4 Manufacturing or Service Delivery
- 8.5 Distribution, Channel Partners and Integrators
- 8.6 Downstream Applications and End Users
- 8.7 Value Addition and Profit Pools
- 8.8 Vertical Integration and Outsourcing
- 8.9 Supplier Concentration and Risk
- 8.10 Supply Chain Localization and Resilience
Chapter 9 Australia Mobile MRI Services Market Regulations and Policies
- 9.1 Relevant Laws, Standards and Compliance Frameworks
- 9.2 Product, Service, Safety and Quality Requirements
- 9.3 Government Policies, Incentives and Subsidies
- 9.4 Imports, Exports and Trade Barriers
- 9.5 Public Procurement and Local Content Requirements
- 9.6 Data Protection, AI and Cybersecurity Compliance
- 9.7 Upcoming Policy Changes and Market Implications
Chapter 10 Australia Mobile MRI Services Market Hotspots and Opportunities
- 10.1 Market Opportunity Mapping and Growth Hotspots
- 10.2 High-Growth Applications and Customer Groups
- 10.3 Underserved Markets and White-Space Opportunities
- 10.4 Emerging Technology and Product Opportunities
- 10.5 New Capacity and Investment Hotspots
- 10.6 Market Entry and Expansion Opportunities
- 10.7 Distribution and Partnership Opportunities
- 10.8 Near-Term and Long-Term Commercial Potential
- 10.9 Opportunity Attractiveness and Execution Risks
Chapter 11 Australia Mobile MRI Services Market Outlook, 2025-2035
- 11.1 Market Size and Analysis
- 11.1.1 Revenue (Market Measurement: 2025: USD 36.5 million → 2035: USD 99.7 million)
- 11.1.2 Historical Market Size, 2018-2025
- 11.1.3 Base-Year Market Size, 2025
- 11.2 Market Forecast, 2025-2035
- 11.2.1 Revenue Forecast to 2035
- 11.2.2 CAGR and Year-on-Year Growth
- 11.2.3 Incremental Revenue Opportunity
- 11.3 Forecast Assumptions and Scenario Analysis
- 11.3.1 Base-Case Forecast
- 11.3.2 Optimistic and Conservative Scenarios
- 11.3.3 Technology, Pricing and Policy Sensitivities
- 11.4 Market Attractiveness and Growth Outlook
Chapter 12 Australia Mobile MRI Services Market Segmentation and Outlook
- 12.1 Segmentation Summary and Market Shares, 2025
- 12.2 Largest and Fastest-Growing Segments
- 12.3 By Service Type - Market Size and Forecast, 2025-2035
- 12.3.1 Segment Definition and Scope
- 12.3.2 Historical Market Size, 2018-2025
- 12.3.3 Revenue Forecast, 2025-2035
- 12.3.4 Base-Year Market Share, 2025
- 12.3.5 Segment CAGR and Growth Drivers
- 12.3.6 Subsegment Market Size and Forecast
- 12.3.6.1 Hospital Continuity Services
- 12.3.6.2 Scheduled Outreach Services
- 12.3.6.3 Bedside Diagnostic Services
- 12.3.7 Subsegment Pricing and Adoption Trends
- 12.3.8 Leading Suppliers and Competition
- 12.3.9 Regional Demand and Opportunities
- 12.4 By Care Setting - Market Size and Forecast, 2025-2035
- 12.4.1 Segment Definition and Scope
- 12.4.2 Historical Market Size, 2018-2025
- 12.4.3 Revenue Forecast, 2025-2035
- 12.4.4 Base-Year Market Share, 2025
- 12.4.5 Segment CAGR and Growth Drivers
- 12.4.6 Subsegment Market Size and Forecast
- 12.4.6.1 Public Hospital Sites
- 12.4.6.2 Private Hospital Sites
- 12.4.6.3 Community Outreach Sites
- 12.4.7 Subsegment Pricing and Adoption Trends
- 12.4.8 Leading Suppliers and Competition
- 12.4.9 Regional Demand and Opportunities
- 12.5 By Customer Type - Market Size and Forecast, 2025-2035
- 12.5.1 Segment Definition and Scope
- 12.5.2 Historical Market Size, 2018-2025
- 12.5.3 Revenue Forecast, 2025-2035
- 12.5.4 Base-Year Market Share, 2025
- 12.5.5 Segment CAGR and Growth Drivers
- 12.5.6 Subsegment Market Size and Forecast
- 12.5.6.1 Public Health Purchasers
- 12.5.6.2 Private Healthcare Purchasers
- 12.5.6.3 Direct Patient Purchasers
- 12.5.7 Subsegment Pricing and Adoption Trends
- 12.5.8 Leading Suppliers and Competition
- 12.5.9 Regional Demand and Opportunities
- 12.6 By Technology - Market Size and Forecast, 2025-2035
- 12.6.1 Segment Definition and Scope
- 12.6.2 Historical Market Size, 2018-2025
- 12.6.3 Revenue Forecast, 2025-2035
- 12.6.4 Base-Year Market Share, 2025
- 12.6.5 Segment CAGR and Growth Drivers
- 12.6.6 Subsegment Market Size and Forecast
- 12.6.6.1 1.5T Mobile MRI
- 12.6.6.2 3T Mobile MRI
- 12.6.6.3 Low-Field Portable MRI
- 12.6.7 Subsegment Pricing and Adoption Trends
- 12.6.8 Leading Suppliers and Competition
- 12.6.9 Regional Demand and Opportunities
- 12.7 Segment Growth Comparison
- 12.8 Segment Attractiveness and Priority Matrix
Chapter 13 Australia Mobile MRI Services End-Use and Application Market Outlook
- 13.1 End-Use Industry and Customer Demand Structure
- 13.2 Leading Applications and Customer Groups
- 13.3 End-Use Market Size, Share and Forecast
- 13.4 Major End-Use Industry Deep Dives
- 13.4.1 Customer Requirements and Use Cases
- 13.4.2 Demand and Replacement Cycles
- 13.4.3 Technical and Regulatory Considerations
- 13.4.4 Purchasing and Procurement Models
- 13.4.5 Leading Vendors and Distribution Channels
- 13.4.6 Forecast and Commercial Opportunities
- 13.5 Emerging Applications and Cross-Segment Demand
- 13.6 End-Use Industry Investment Priorities
Chapter 14 Australia Mobile MRI Services Geographic Market Outlook, 2025-2035
- 14.1 Domestic Market Distribution and Demand Clusters
- 14.2 State- or Province-Wise Market Size and Forecast, 2025-2035
- 14.3 City and Metropolitan Market Outlook
- 14.4 Industrial, Manufacturing and Commercial Clusters
- 14.5 Geographic Concentration of Key End Users
- 14.6 Local Pricing and Purchasing Differences
- 14.7 Domestic Production Facilities and Capacity Map
- 14.8 Local Infrastructure and Project Pipeline
- 14.9 State-Level Policy and Incentive Differences
- 14.10 Subnational Investment Hotspots and Opportunities
- 14.11 Distribution and Logistics Networks
- 14.12 Domestic Competitive Footprint
Chapter 15 Australia Mobile MRI Services Technology, Innovation and Sustainability Outlook
- 15.1 Technology Landscape and Maturity
- 15.2 Product, Process and Service Innovation
- 15.3 AI, Automation and Digital Tools in the Industry
- 15.4 Technology Adoption and Performance Benchmarking
- 15.5 Innovation Pipeline and R&D Investment
- 15.6 Energy Efficiency and Resource Management
- 15.7 Sustainability, Recycling and Circularity
- 15.8 Technology Roadmap, 2025-2035
- 15.9 Risks of Obsolescence and Technology Substitution
Chapter 16 Australia Mobile MRI Services Market Key Strategic Imperatives
- 16.1 Growth and Market Entry Priorities
- 16.2 High-Return Products and Segments
- 16.3 Pricing, Profitability and Cost Optimization
- 16.4 Technology Investment and Product Differentiation
- 16.5 Supply Chain Localization and Resilience
- 16.6 Distribution and Customer Acquisition
- 16.7 Partnership, Acquisition and Capacity Strategy
- 16.8 Regional Expansion Priorities
- 16.9 Short-, Medium- and Long-Term Actions
Chapter 17 Competition Outlook
- 17.1 Industry Competition Characteristics
- 17.2 Market Structure and Concentration
- 17.3 Market Share and Competitive Positioning, 2025
- 17.4 Company-Wise Revenue and Product Benchmarking
- 17.5 Production and Service Capacity Benchmarking
- 17.6 Technology, Pricing and Differentiation
- 17.7 Regional Footprint and Distribution Strength
- 17.8 Mergers, Acquisitions and Strategic Alliances
- 17.9 New Entrants and Competitive Threats
- 17.10 Porter's Five Forces and Industry Attractiveness
- 17.11 Competitive Outlook, 2025-2035
Chapter 18 Company Profiles
- 18.1 Company Coverage and Selection Criteria
- 18.2 I-MED Radiology Network
- 18.2.1 Business Description
- 18.2.2 Company Ownership and Geographic Presence
- 18.2.3 Product and Service Portfolio
- 18.2.4 Manufacturing and Operating Footprint
- 18.2.5 Financial Performance and Investment
- 18.2.6 Market Share and Competitive Position
- 18.2.7 Technology and Innovation Capabilities
- 18.2.8 Strategic Alliances or Partnerships
- 18.2.9 Recent Developments
- 18.2.10 Growth Strategy and Outlook
- 18.3 Lumus Imaging
- 18.4 Sonic Healthcare
- 18.5 Integral Diagnostics
- 18.6 Qscan Group
- 18.7 Other Relevant Market Participants
Note: Every listed company is profiled on the structure shown under the first company. The company list is preliminary and may change based on research findings, market developments, data availability and client requirements.
Chapter 19 Disclaimer
- 19.1 Research and Forecast Disclaimer
- 19.2 Data Source and Estimation Limitations
Note: The depth of individual sections depends on data availability for this market. Volume, capacity, trade and other unit-based metrics are included where applicable.

