
Assay finishing and metal limits anchor instrument demand
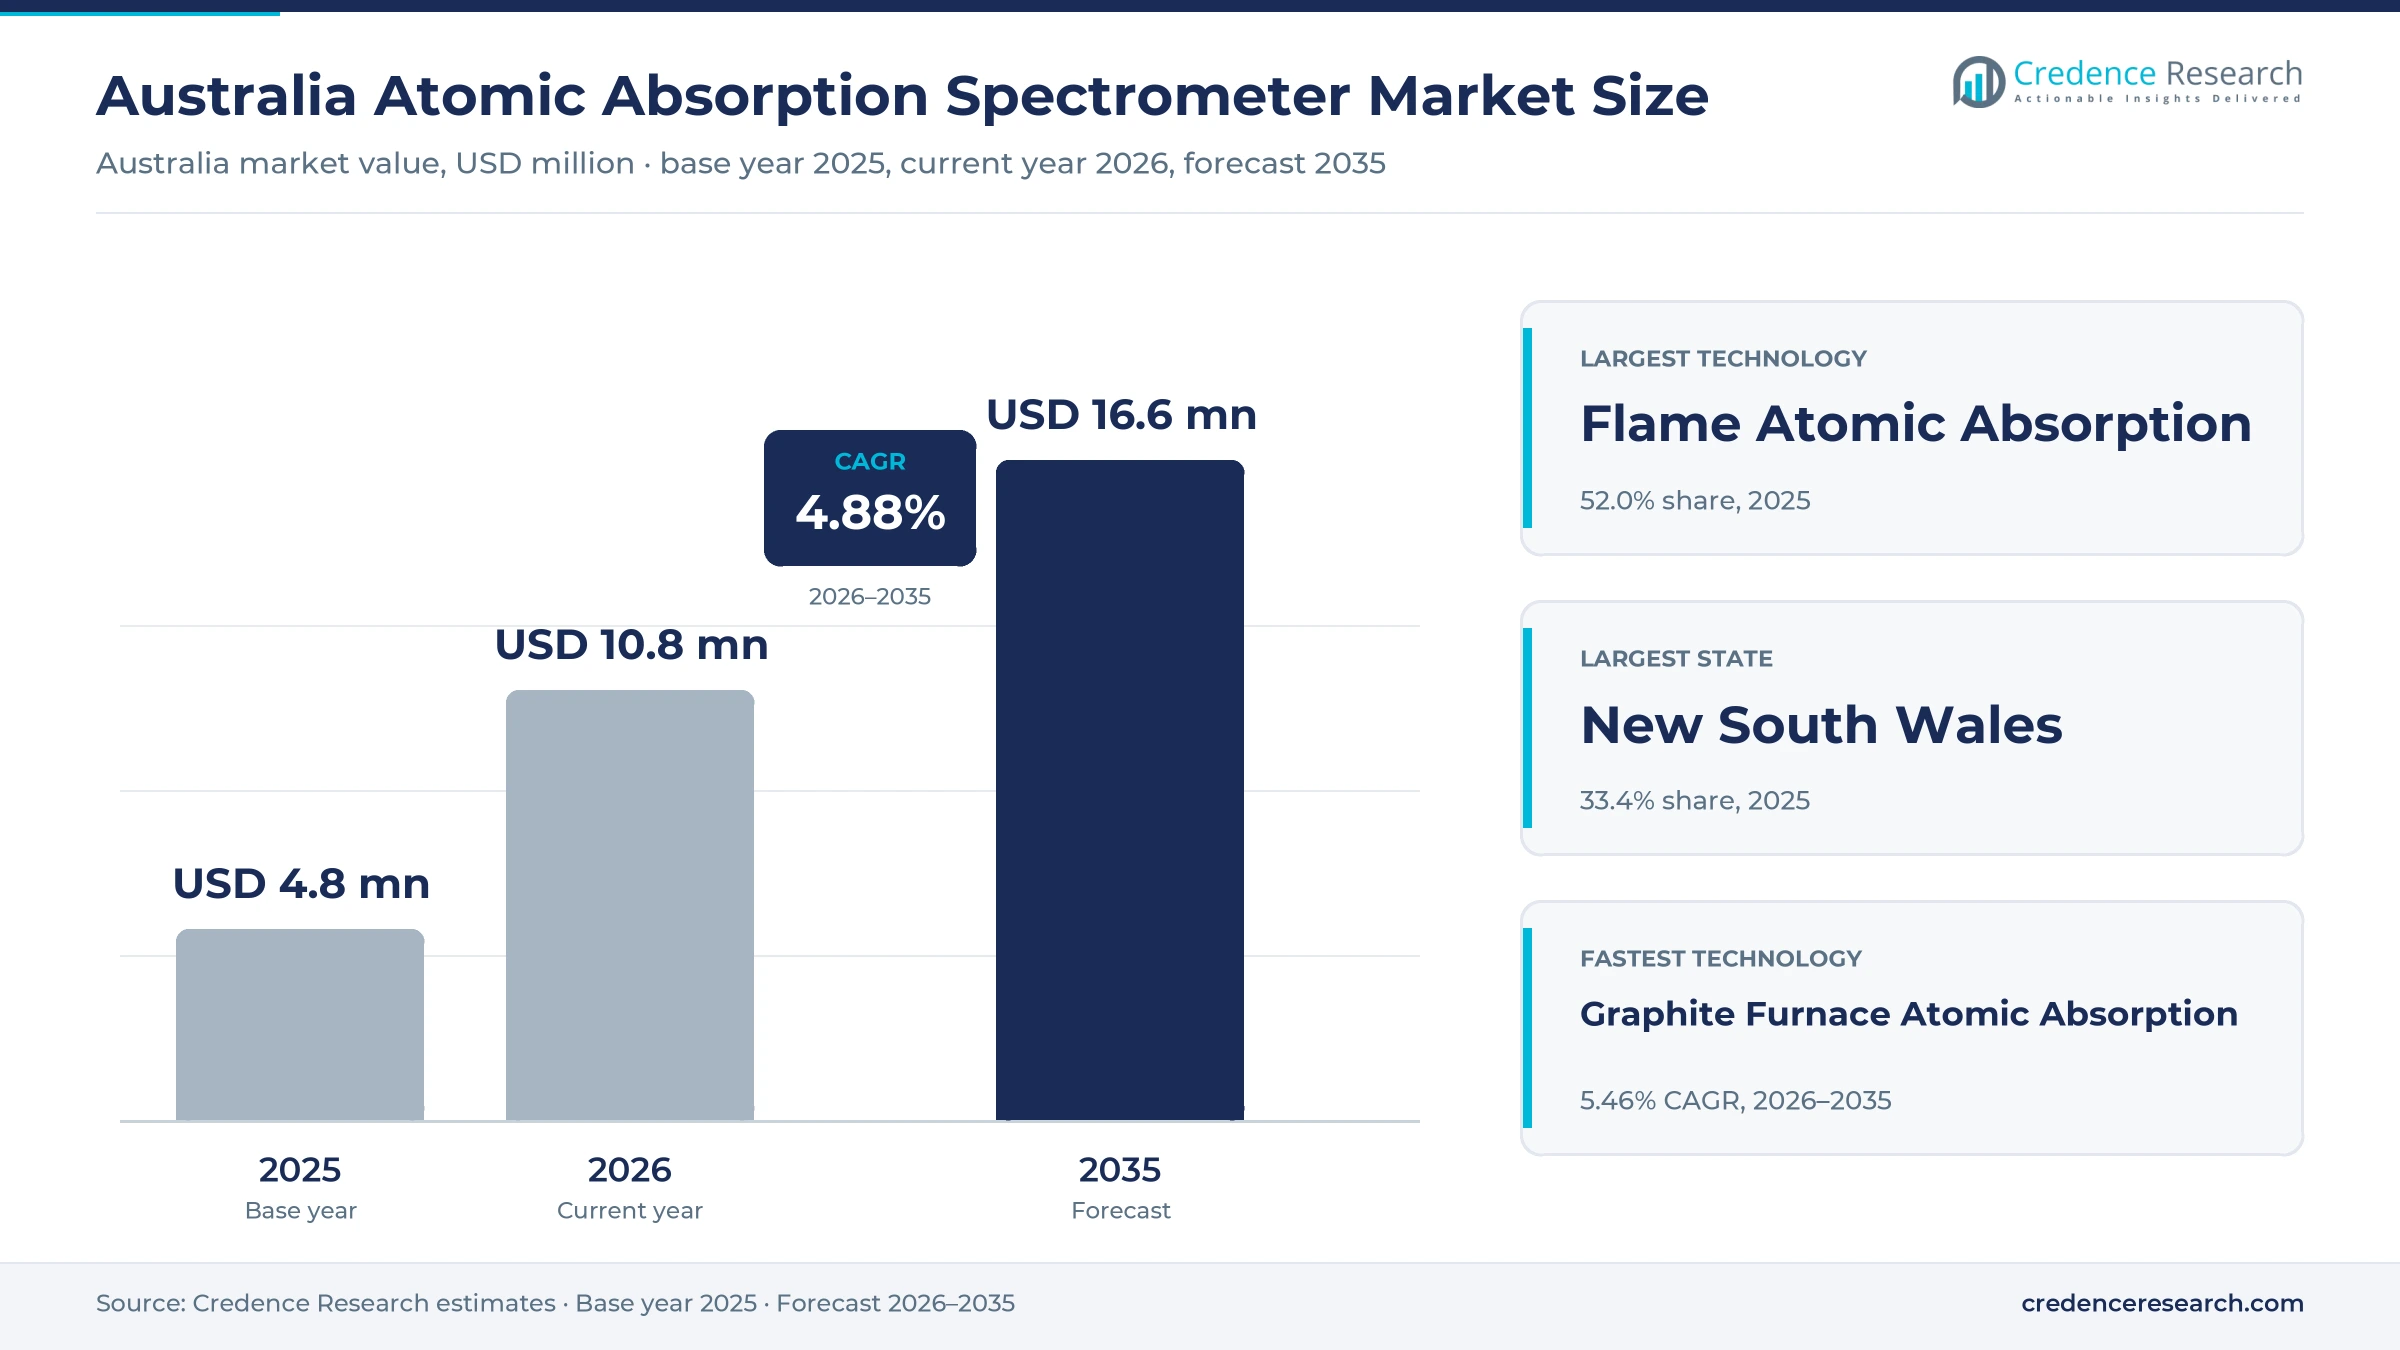
The Australia atomic absorption spectrometer market was valued at USD 4.80 million in 2025 and is projected to increase from USD 10.8 million in 2026 to USD 16.6 million by 2035, registering a CAGR of 4.88% during 2026–2035. Demand comes from commercial mineral laboratories that finish gold fire assays by atomic absorption, and from food, water and medicine testing that must confirm metal limits with validated methods. New South Wales held the largest state share, 33.4% in 2025, because Sydney hosts dense networks of environmental and food laboratories serving the most populous state. Western Australia is the fastest-growing state at 5.63% a year during 2026–2035, as gold exploration and grade control keep assay laboratories busy. Instrument choice is changing too, because tighter limits for lead in drinking water favor graphite furnace systems, while photon assay units now compete with fire assay for part of the gold work.
Which instruments, parts and services does this estimate count?
The estimate counts spending in Australia on new flame, graphite furnace, hydride generation and cold vapor atomic absorption instruments, together with hollow cathode lamps, graphite tubes, burners, autosampler parts and other consumables. It also includes service contracts, repairs, validation support and instrument software bought by contract laboratories, in-house corporate laboratories and public and research laboratories.
The estimate leaves out ICP optical emission and ICP mass spectrometry systems, X-ray fluorescence analyzers and photon assay units, even where they replace atomic absorption work. Laboratory testing fees are also excluded, because the estimate measures what laboratories spend on equipment and support rather than what they charge.
Australia Atomic Absorption Spectrometer Market Insights
- The Australia atomic absorption spectrometer market is projected to grow from USD 10.8 million in 2026 to USD 16.6 million by 2035, a CAGR of 4.88%, as furnace methods and service work expand.
- New South Wales held the largest state share at 33.4% in 2025, reflecting dense environmental and food testing networks around Sydney.
- Flame atomic absorption led technologies with 52.0% of 2025 value, because it gives low-cost routine readings for gold, copper and zinc digests.
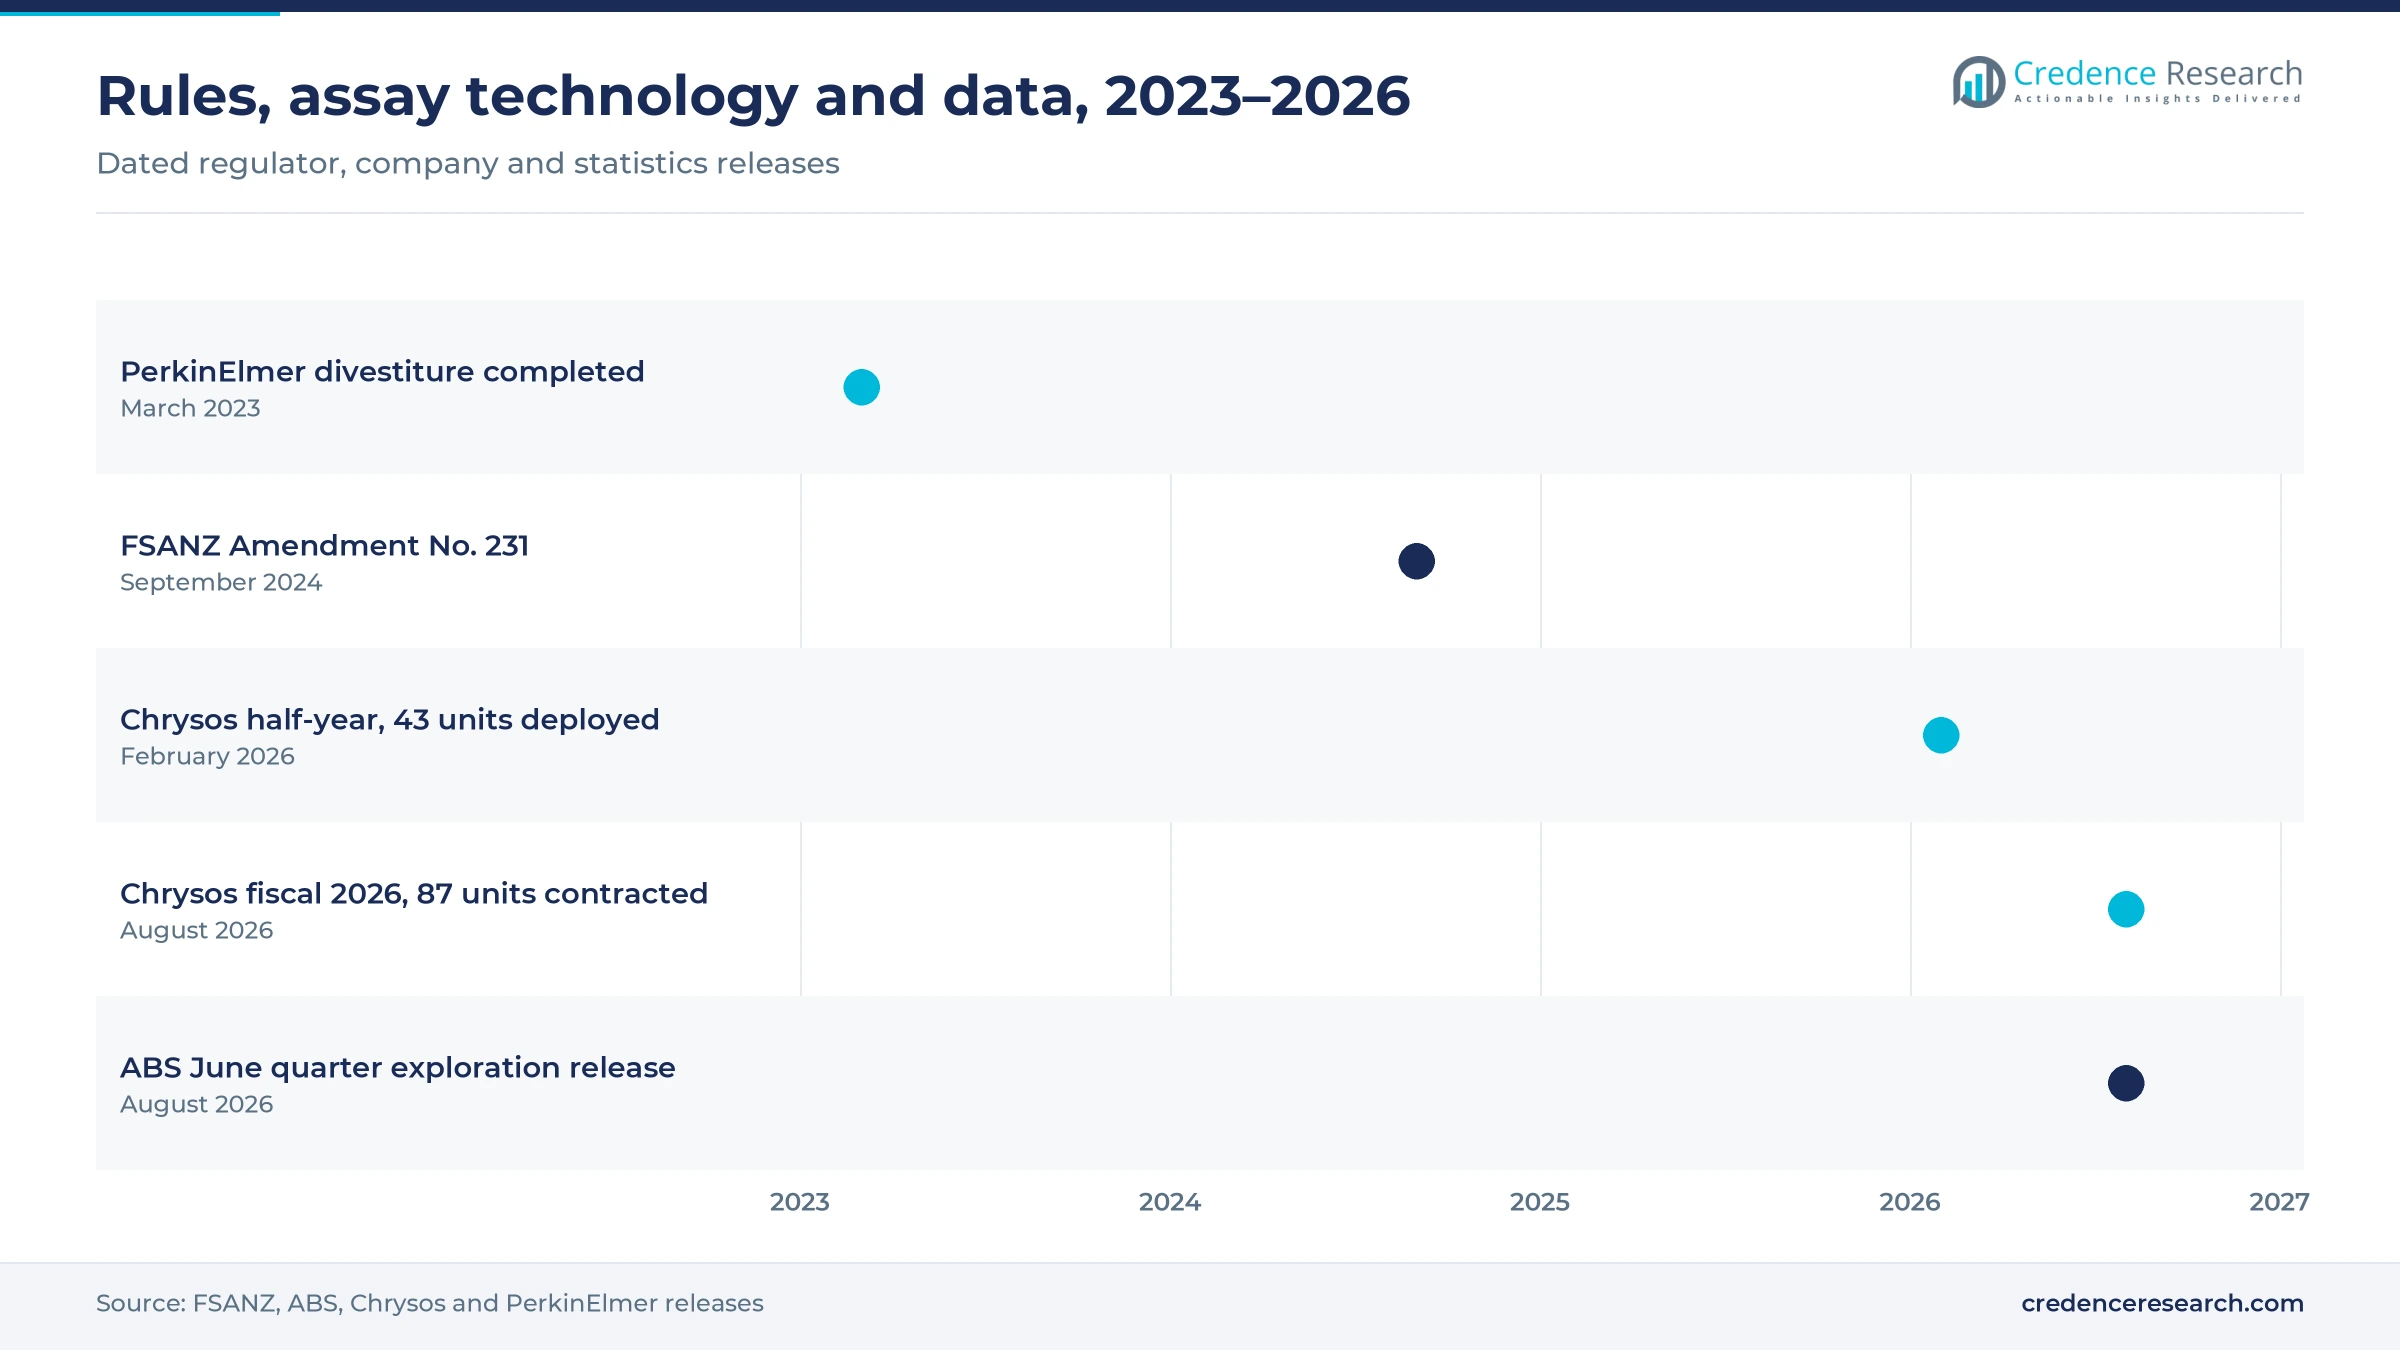
- FSANZ gazetted Amendment No. 231 on Sept. 13, 2024, revising contaminant limits in Schedule 19 of the Food Standards Code as part of its infant formula proposal.
- Chrysos reported 43 deployed PhotonAssay units in February 2026, which adds competition for gold assay work that atomic absorption laboratories have long handled.
Flame systems and contract laboratories hold most value
Why do new instruments still lead spending?
Based on product type, the market is categorized into new instruments, consumables and service and software. New instruments led with 44.0% of 2025 value, because flame and furnace systems carry the highest unit price in each laboratory budget. Service and software grows fastest at 5.57% a year, as laboratories keep older systems running longer and pay for planned maintenance, validation support and data software.
Which atomization method handles most routine work?
Based on technology, the market is categorized into flame atomic absorption, graphite furnace atomic absorption, hydride generation atomic absorption and cold vapour atomic absorption. Flame atomic absorption led with 52.0% of 2025 value, because it handles routine readings in assay, food and water laboratories at a low cost per test. Graphite furnace atomic absorption grows fastest at 5.46% a year, as tighter limits for lead and cadmium require detection at parts-per-billion levels.
How much value comes from mineral laboratories?
Based on end-use industry, the market is categorized into mining and mineral exploration, environmental testing, food and beverage testing, pharmaceutical and clinical testing, and research and process control. Mining and mineral exploration led with 31.0% of 2025 value and is also the fastest-growing end use at 5.29% a year. This reflects fire assay finishing and base metal analysis at commercial mineral laboratories, especially in Western Australia and Queensland.
Why do contract laboratories buy the most systems?
Based on customer type, the market is categorized into contract testing laboratories, in-house corporate laboratories and public and research laboratories. Contract testing laboratories led with 47.0% of 2025 value, because mineral, environmental and food samples are mostly sent to accredited commercial networks. The same customer type grows fastest at 5.36% a year, as mine operators and food processors outsource more routine metal testing.
| Segment Group | Leading Sub-segment | Share, 2025 | Fastest-growing Sub-segment | CAGR, 2026–2035 |
|---|---|---|---|---|
| By Product Type | New instruments | 44.0% | Service and software | 5.57% |
| By Technology | Flame atomic absorption | 52.0% | Graphite furnace atomic absorption | 5.46% |
| By End-Use Industry | Mining and mineral exploration | 31.0% | Mining and mineral exploration | 5.29% |
| By Customer Type | Contract testing laboratories | 47.0% | Contract testing laboratories | 5.36% |
Request a Free Sample
Fill in your details and we'll send you a free sample report.
- Sample data tables & charts
- Research methodology
Gold assay, metal limits and installed fleets lift spending
Retained gold assay workflows keep mineral labs buying
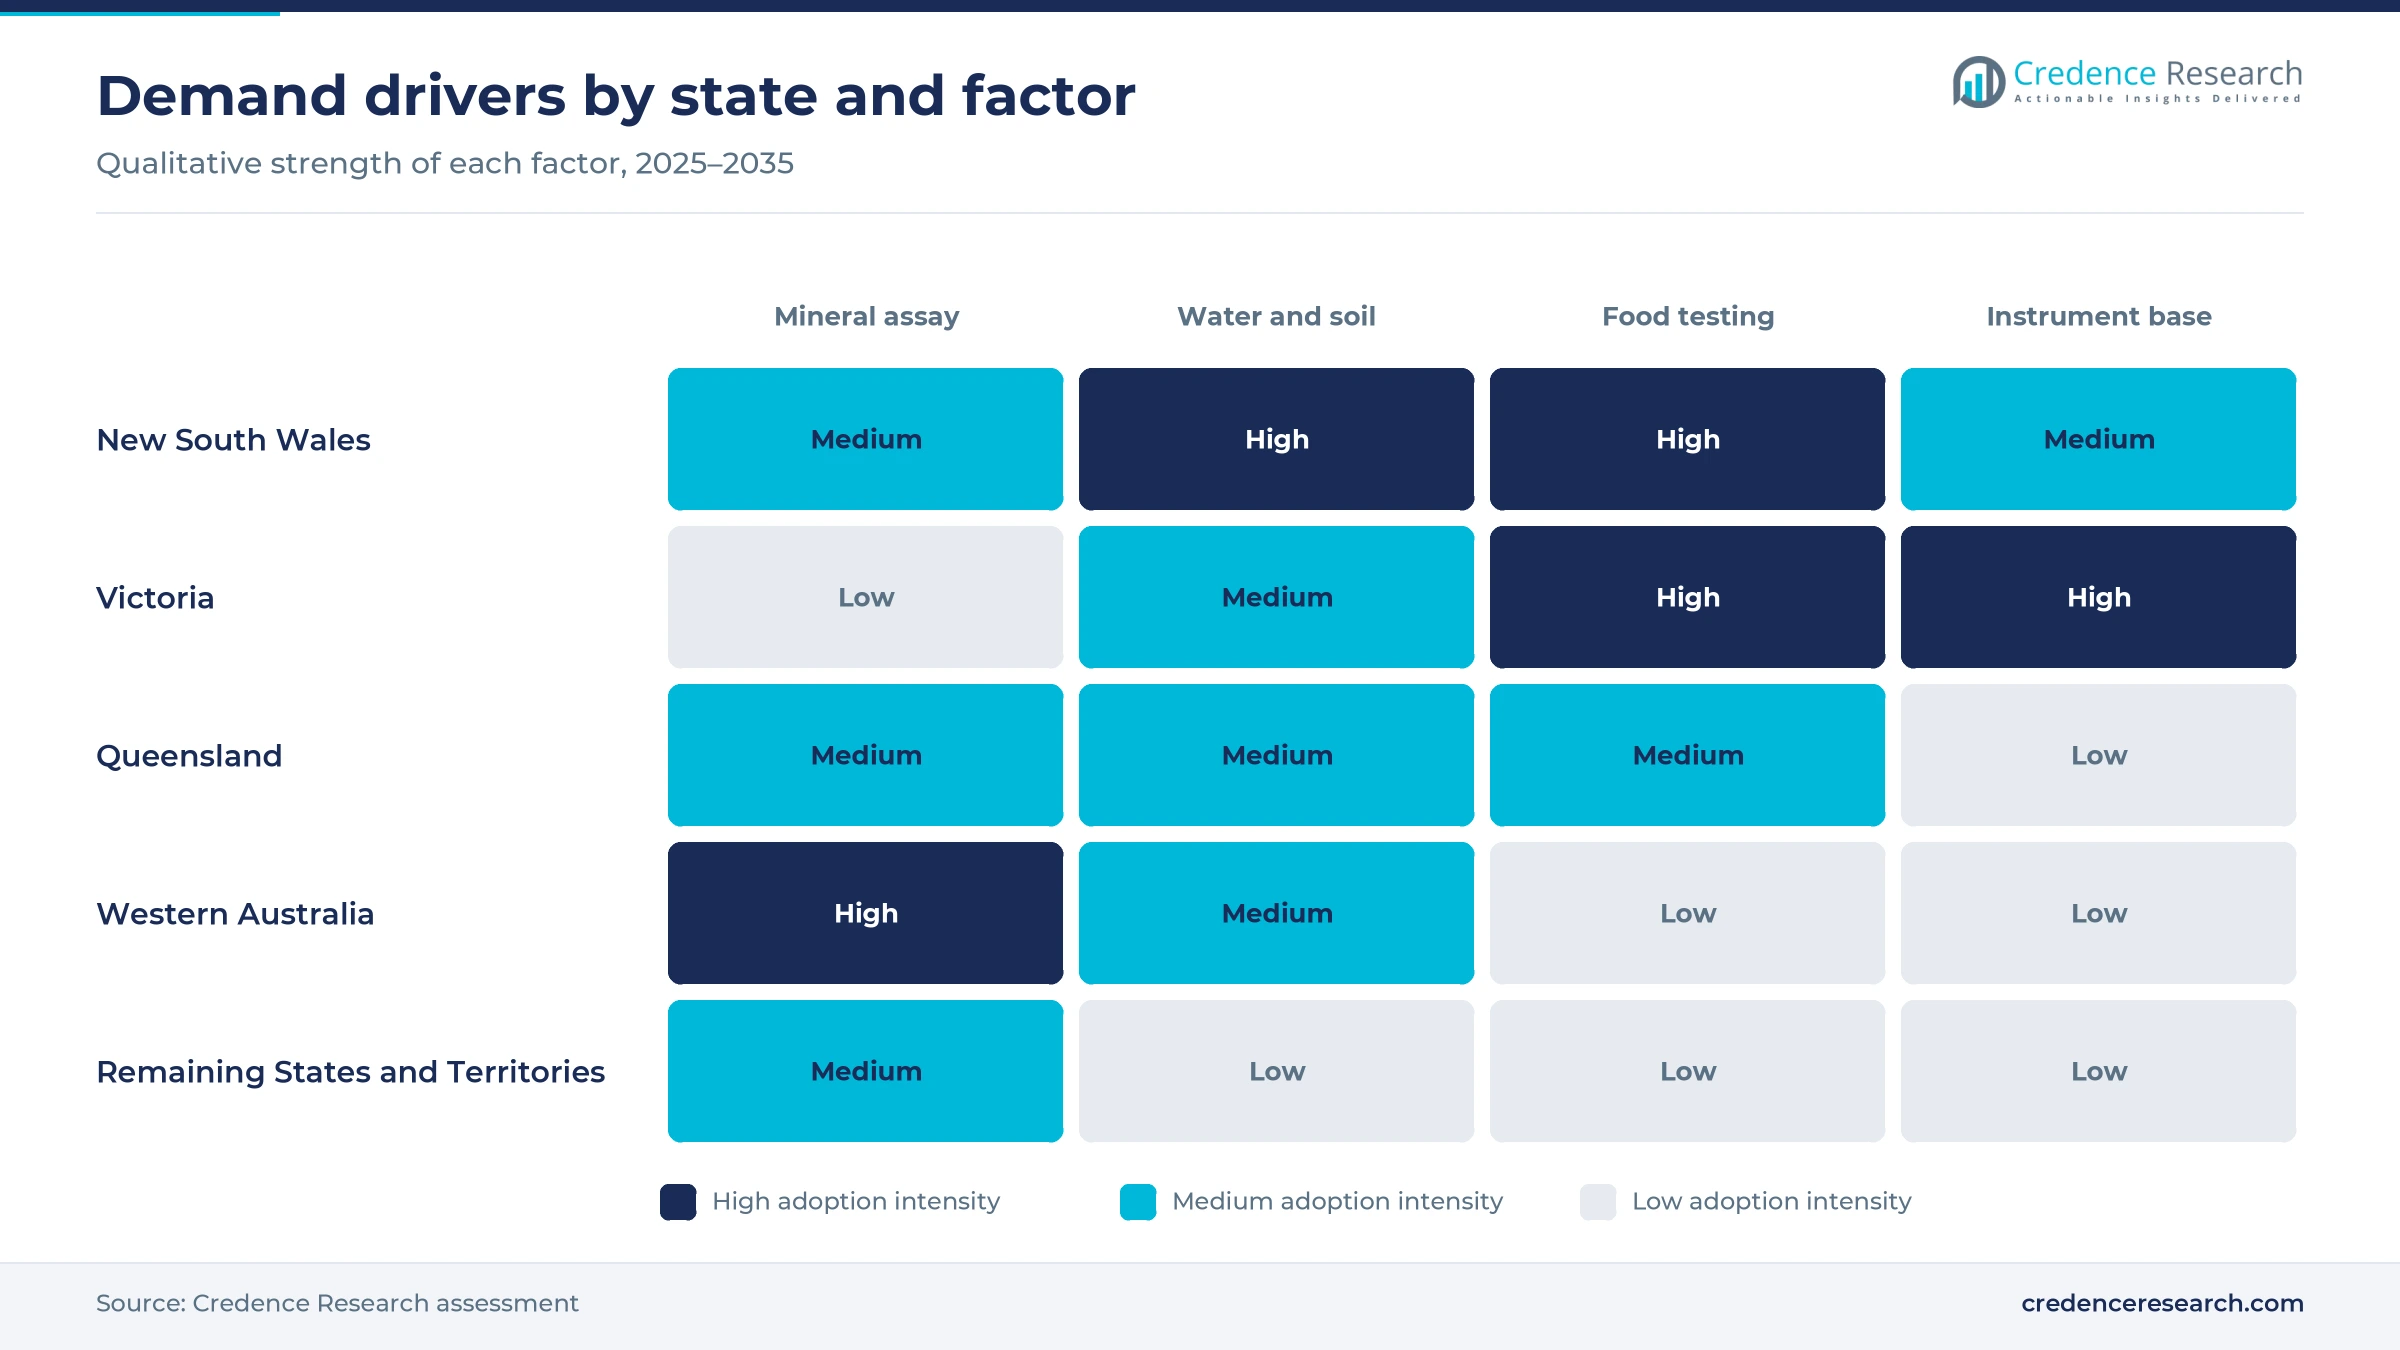
Mineral laboratories keep atomic absorption in their gold workflows, because fire assay with an AAS finish remains a standard reporting route for explorers and miners. Australia mined an estimated 280 tons of gold in 2025, out of a world total of about 3,300 tons, according to USGS mineral commodity data. ALS lists four gold fire assay methods with an AAS finish, using 30 g or 50 g charges, with its ore-grade versions covering 0.01 to 100 ppm. ABS data show gold exploration spending rose from A$457.7 million in the March quarter of 2026 to A$565.6 million in the June quarter, which adds drill samples to laboratory queues. As a result, mining and mineral exploration held 31.0% of 2025 value.
Validated metal limits sustain compliance testing
Compliance testing provides a second steady base, because food, water and medicine rules set numeric metal limits that laboratories must confirm with validated methods. Schedule 19 of the Food Standards Code caps cadmium in rice at 0.1 mg/kg and tin in canned foods at 250 mg/kg. FSANZ gazetted Amendment No. 231 on Sept. 13, 2024, which revised Schedule 19 as part of its infant formula proposal. Envirolab's Chatswood laboratory in Sydney holds NATA accreditation for mercury by AAS vapour generation in bore, ground, potable and surface waters. The TGA also lists ICH Q3D(R2) on elemental impurities among its adopted guidelines. These rules keep contract testing laboratories, which held 47.0% of 2025 value, running daily metal batches.
Installed fleets create steady parts and service demand
A large installed base keeps buying lamps, graphite tubes, burners and service visits long after each instrument sale. CSIRO records that Alan Walsh conceived atomic absorption in Melbourne in March 1952, and that more than 10,000 spectrophotometers were in use worldwide by 1969. Instruments are still designed locally, since Agilent opened an A$25 million spectroscopy center in Mulgrave in August 2013 with 250 staff, where its AAS was developed, according to LabOnline. GBC Scientific Equipment, which began operating in 1978, runs manufacturing and training facilities in Melbourne and in Penang, Malaysia. New instruments led product types with 44.0% of 2025 value, yet each system creates years of follow-on demand for consumables and service.
Population growth adds water and food samples
Population growth adds drinking water, food and clinical samples, which lifts routine metal testing in state and private laboratories. Australia's population reached 27.9 million on March 31, 2026, up 1.4% over the year, according to the Australian Bureau of Statistics. New South Wales had 8.67 million residents and Victoria 7.15 million, which concentrates water utility and food processing work around Sydney and Melbourne. Western Australia had the fastest population growth, at 2.1%, which adds municipal and mine-camp water checks across the state. These patterns help explain why Victoria held 24.7% of 2025 demand, well ahead of its 3% share of mineral exploration spending in the four quarters to June 2026.
Faster flame runs and furnace methods reshape buying
Shift toward fast sequential flame analysis
Laboratories are shifting toward fast sequential flame instruments that read several elements from one aspiration, because labor and gas costs weigh on routine metal work. Agilent says its 240FS AA can determine 10 elements per sample in less than two minutes and can double sample throughput. GBC offers its XplorAA in 12 configurations, which lets smaller laboratories match a flame system to a narrow test menu. Shimadzu launched its AA-7800 series on Sept. 29, 2022, with a vibration sensor, gas leak checks and what it calls the industry's smallest dual atomizer system. Flame atomic absorption still led technologies with 52.0% of 2025 value, so faster flame runs protect the largest technology segment.
Rise of furnace methods as lead limits tighten
Lower metal limits are raising demand for graphite furnace and vapor methods that reach parts-per-billion levels. The NHMRC lead fact sheet, updated and endorsed in 2025, says lead in drinking water should not exceed 0.005 mg/L, half the WHO provisional value of 0.01 mg/L. The same page notes that the EU has set 0.005 mg/L to take effect by 2036, which shows the same direction in other markets. GBC's System 5000 offers sub-ppb graphite furnace analysis with full automation, while its enduro T2200 adds electronic double-beam operation. As a result, graphite furnace atomic absorption grows fastest among technologies at 5.46% a year during 2026–2035.
Opportunity in Western Australian assay capacity
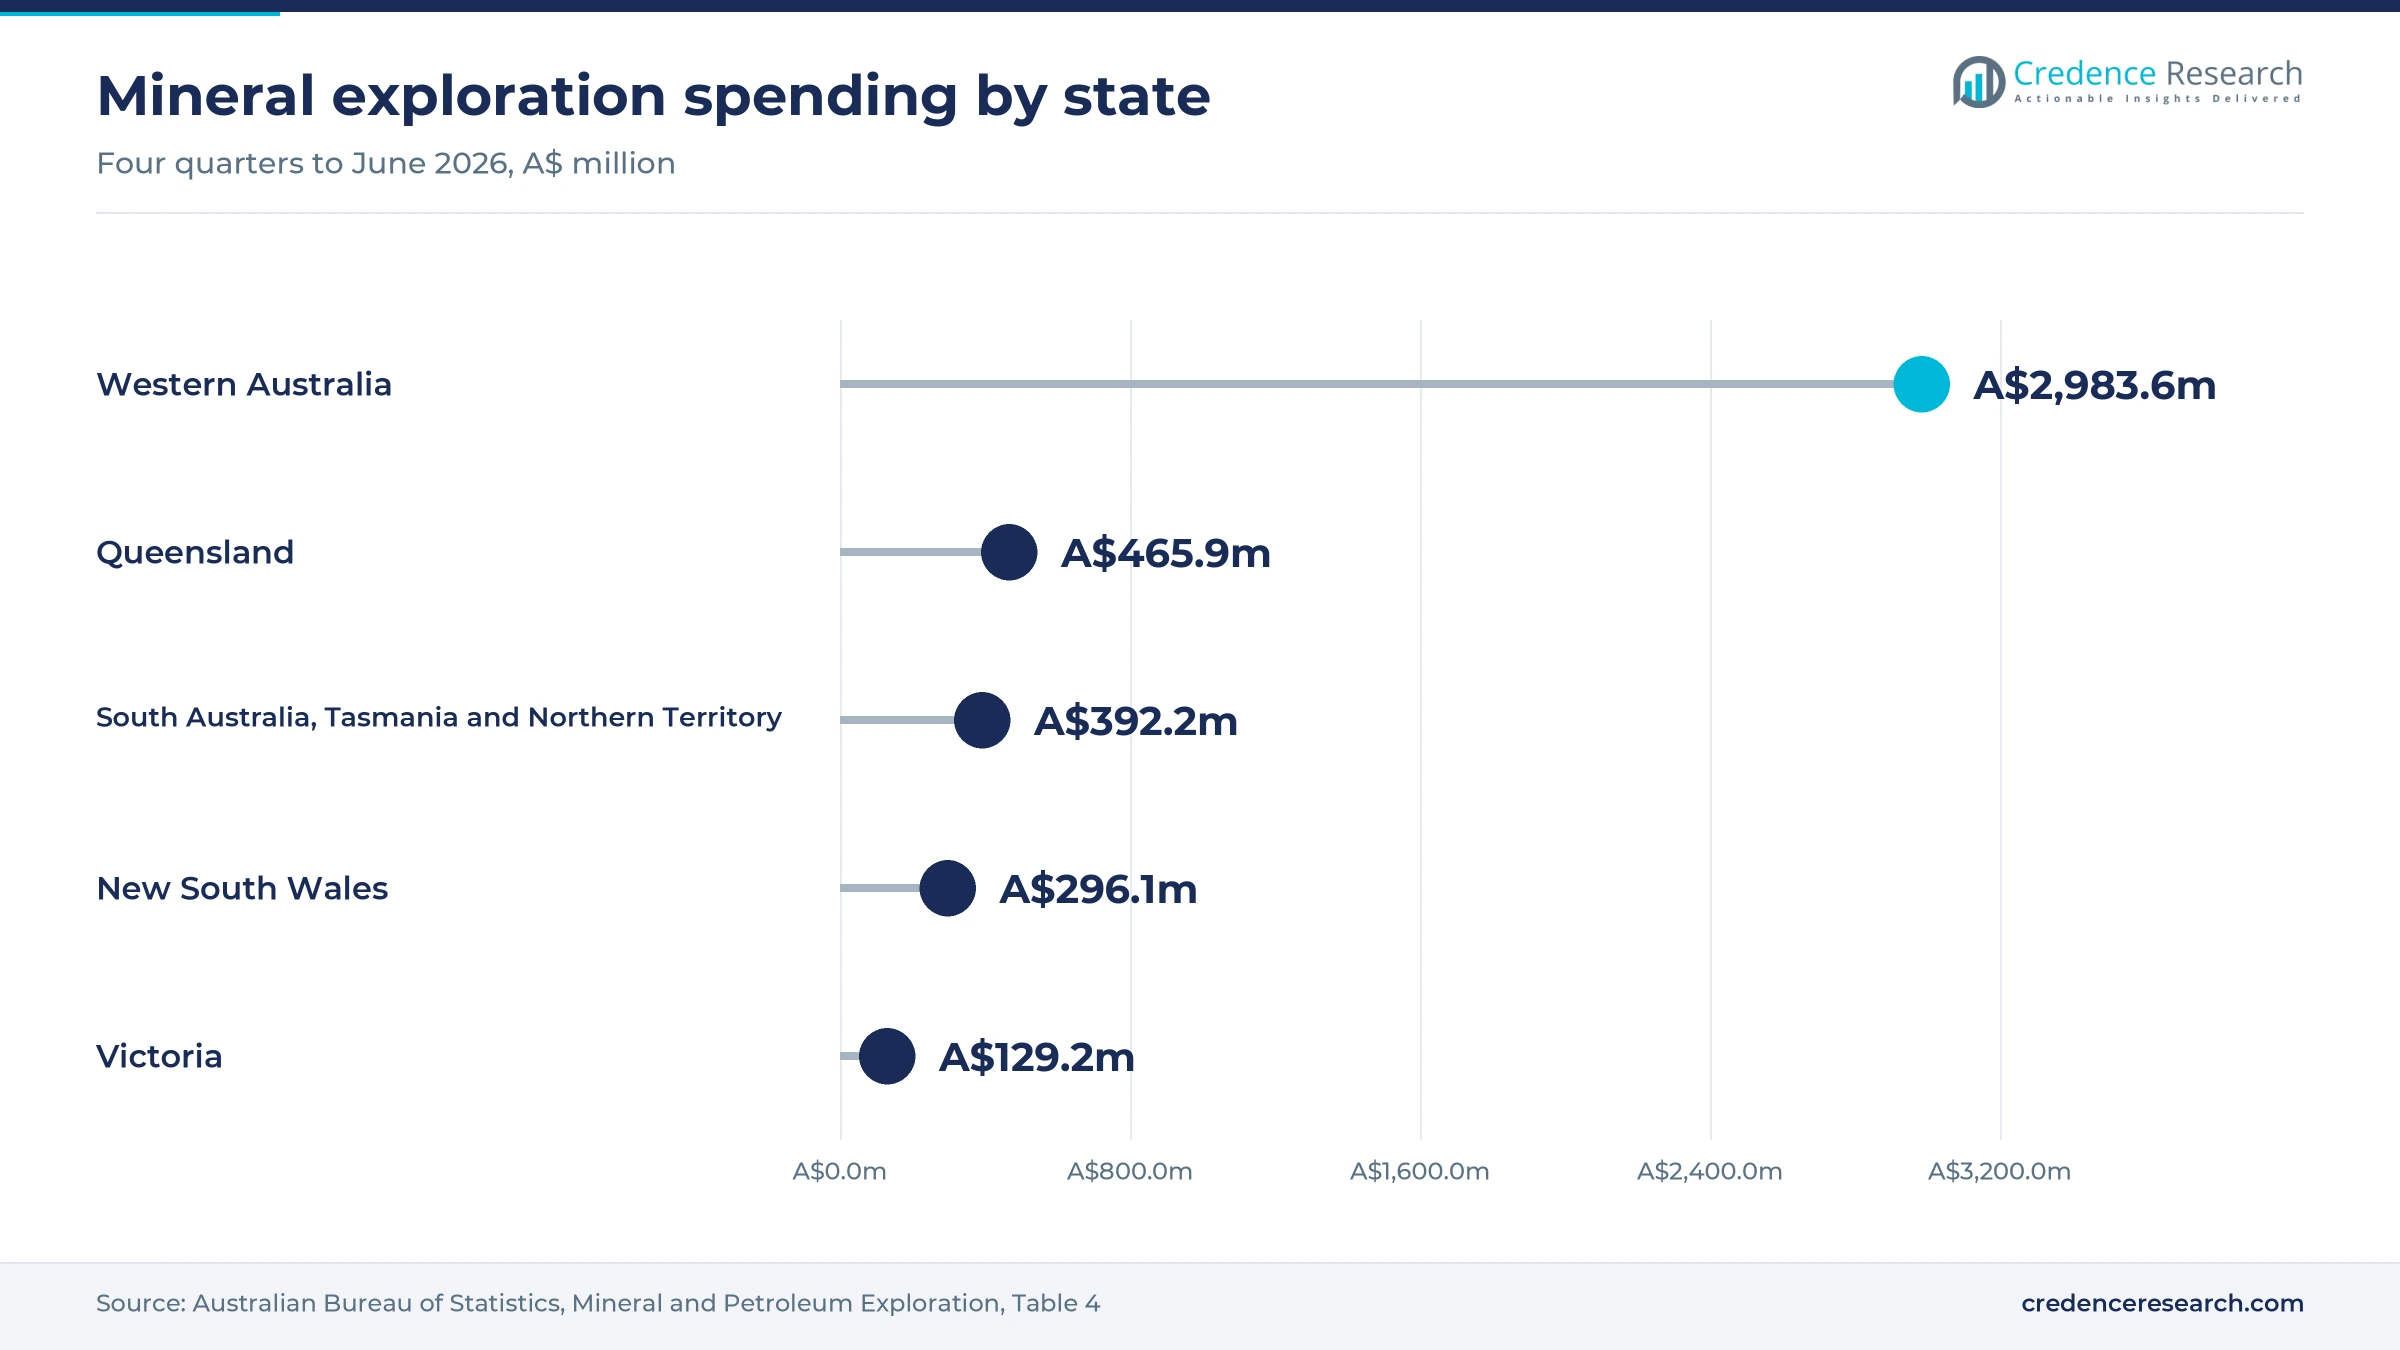
Western Australia offers the clearest opening for instrument and consumable sales, because exploration and gold assay work are concentrated there. The state accounted for A$2,983.6 million of the A$4,267.1 million spent on mineral exploration in the four quarters to June 2026, about 70%, according to ABS data. Gold exploration in the state alone reached A$461.1 million in the June quarter of 2026. Intertek's Maddington laboratory, opened in August 2021 with about 500 staff, can process more than 2.5 million mineral samples a year, according to Business News. Western Australia held 17.2% of 2025 value, so new assay capacity there lifts instrument demand faster than in other states.
Opportunity in service contracts for aging fleets
Service and software contracts offer an opening, as laboratories keep older flame and furnace systems running for longer. PerkinElmer's analytical instrument and service businesses were sold to New Mountain Capital in March 2023 and now operate as a standalone company under the PerkinElmer name. Agilent's Mulgrave center includes user demonstration and training facilities next to its research laboratories. Thermo Fisher Scientific provides after-sales service support for analytical instruments from Scoresby, Victoria, while Shimadzu's Rydalmere subsidiary has more than 100 staff across Australia and New Zealand. Service visits often extend to precision weighing instruments, since sample masses feed directly into metal results. Service and software therefore grows fastest among product types at 5.57% a year.
Photon assay, ICP panels and remote service limit growth
Photon assay competes with fire assay finishing
Chrysos PhotonAssay offers a non-destructive gold assay that competes directly with fire assay and its AAS finish. Chrysos announced 43 deployed units and 72 contracted units in its half-year results of February 2026, including its first XN unit at SGS in Perth. Each mine laboratory that converts to photon assay buys fewer lamps, burners and gas for gold work. Instrument suppliers respond by targeting base metal, environmental and food testing, where gold assay is not the main task.
ICP panels take multi-element work
Multi-element panels increasingly run on plasma techniques, which reduces the number of samples that reach atomic absorption. The NHMRC notes that lead in drinking water is commonly measured by ICP mass spectrometry, and Envirolab's accredited soil metals methods list ICP-AES and ICP-MS. Laboratories that buy ICP optical emission systems often keep atomic absorption only for mercury, hydride elements or low-volume work. Suppliers respond by pricing their systems as low-running-cost options for narrow test menus.
Flame gases add safety and handling costs
Flame instruments rely on compressed fuel and oxidant gases, so laboratories must manage gas storage, ventilation and leak risks. Shimadzu built a vibration sensor and a gas leak check function into its AA-7800 series, which shows how closely vendors watch flame safety. Smaller sites in remote towns may struggle to keep gas supply and safety checks current. This adds cost per test and pushes some buyers toward send-out testing at larger city laboratories.
Distance makes field service slow outside cities
Australia's distances make field service slow and costly outside capital cities, especially for mine-site laboratories in remote regions. A furnace or burner fault can stop gold or water reporting for days while a technician travels to site. Vendors cover these regions with remote engineers and partner networks, yet response times still vary widely. As a result, some buyers hold spare instruments or parts, which ties up capital that could otherwise fund new systems.
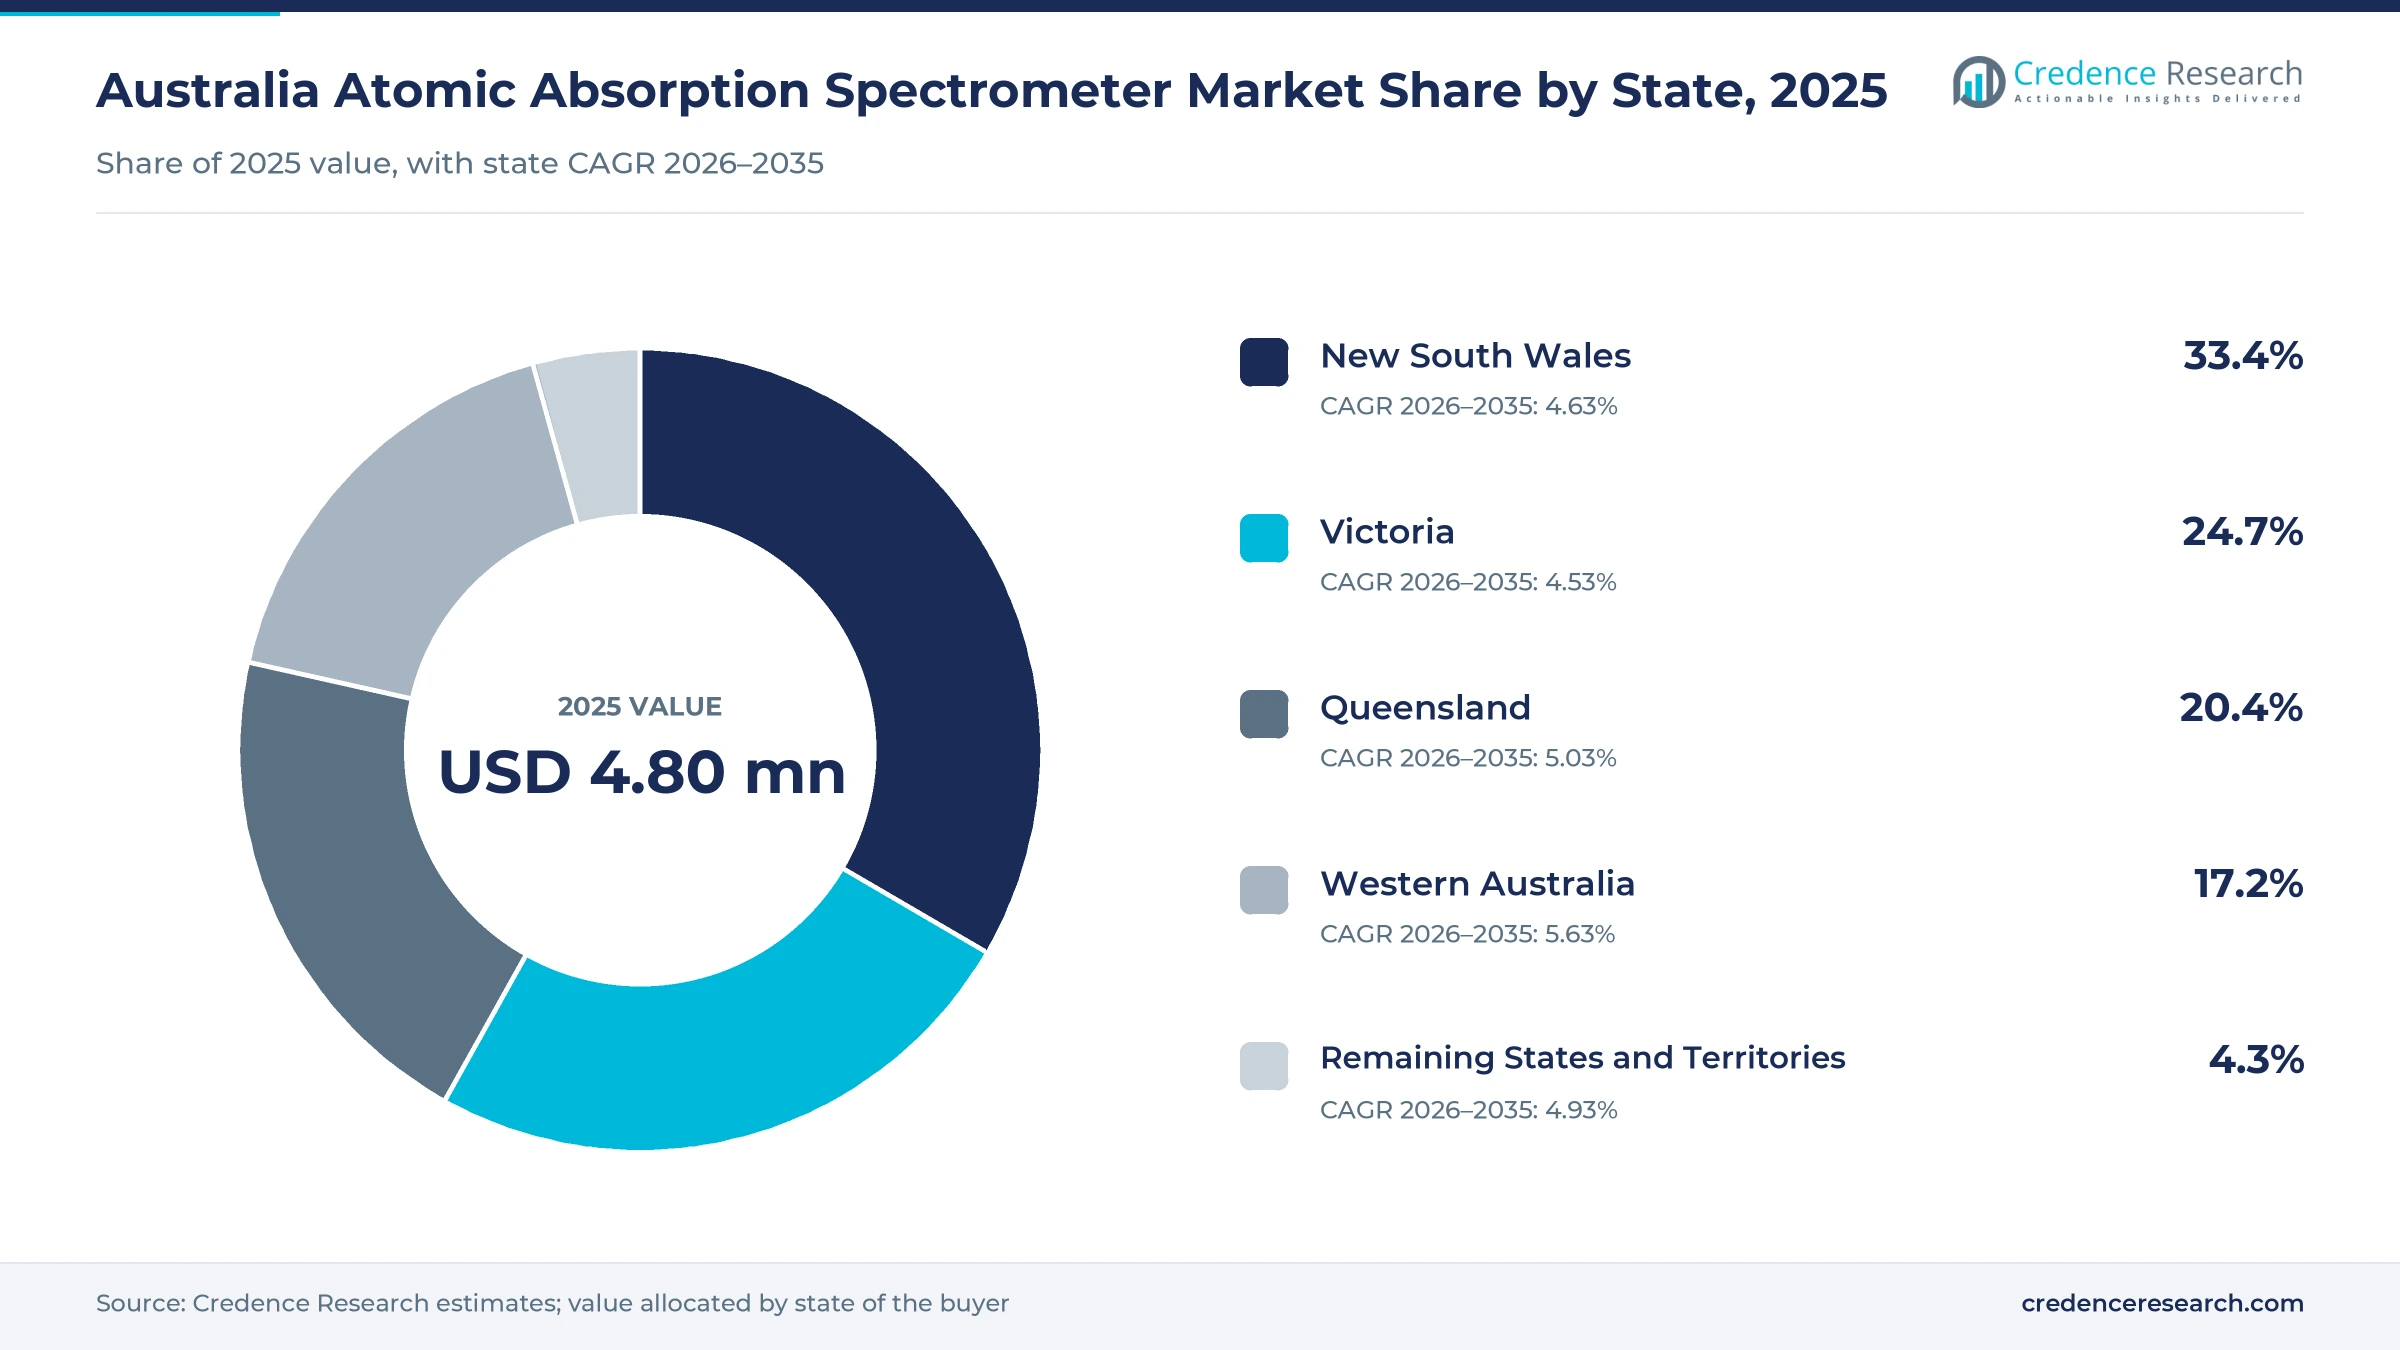
Sydney test networks lead as Perth assay work grows fastest
| State | Value, 2025 (USD million) | Share, 2025 | CAGR, 2026–2035 |
|---|---|---|---|
| New South Wales | 1.6 | 33.4% | 4.63% |
| Victoria | 1.2 | 24.7% | 4.53% |
| Queensland | 1.0 | 20.4% | 5.03% |
| Western Australia | 0.8 | 17.2% | 5.63% |
| Remaining States and Territories | 0.2 | 4.3% | 4.93% |
New South Wales leads on water and food testing
New South Wales took the largest slice of 2025 laboratory spending at 33.4% and expands at 4.63% a year. The state had 8.67 million residents on March 31, 2026, according to the ABS, which sustains a heavy load of drinking water and food testing. Envirolab's Chatswood laboratory runs accredited mercury tests, and the NSW EPA used a NATA-accredited laboratory for 43 soil samples around the Cadia gold mine in July 2023. Shimadzu's Oceania subsidiary is also based in Rydalmere, in Sydney.
Victoria keeps a deep instrument and research base
Victoria held 24.7% of 2025 value and grows at 4.53% a year, reflecting a deep base of food, research and instrument activity around Melbourne. CSIRO work in Melbourne gave rise to atomic absorption in 1952, and Agilent's Mulgrave center and GBC's Melbourne plant still design or build instruments in the state. Thermo Fisher Scientific also runs its Australian base in Scoresby, east of Melbourne. The state's population grew 1.6% to 7.15 million in the year to March 2026, which adds routine water and food samples.
Queensland grows on exploration and population
Queensland held 20.4% of 2025 value and grows at 5.03% a year, a little above the national rate. Mineral exploration spending in the state reached A$465.9 million in the four quarters to June 2026, the second highest after Western Australia, according to the ABS. Coal, copper and gold projects send drill samples to commercial laboratories for base metal and precious metal finishing. The state's population rose 1.6% to 5.74 million, which adds water and food testing work.
Western Australia grows fastest on gold assay work
Western Australia held 17.2% of 2025 value and grows fastest among states at 5.63% a year. The state led mineral exploration with A$2,983.6 million in the four quarters to June 2026, and its laboratories process large volumes of gold fire assays. Mines that buy underground mining equipment also need routine grade control assays, which often run in regional laboratories. However, photon assay units at SGS in Perth and in the goldfields compete for part of this gold work.
Remaining states and territories hold a small share
Remaining States and Territories held 4.3% of 2025 value and grow at 4.93% a year. South Australia, Tasmania and the Northern Territory together spent A$392.2 million on mineral exploration in the four quarters to June 2026, according to the ABS. Copper and gold exploration in South Australia and public research laboratories in Canberra are likely the main buyers. Buyers in these jurisdictions depend on visiting or remote service engineers, which raises the value of service contracts.
Food rules, assay technology and exploration data since 2023
| Development | Status and market relevance |
|---|---|
| In March 2023, PerkinElmer completed the sale of its Applied, Food and Enterprise Services businesses to New Mountain Capital. | Completed; the instrument business keeps the PerkinElmer name |
| In September 2024, FSANZ gazetted Amendment No. 231, revising Schedule 19 contaminant limits within its infant formula proposal. | In force; sets limits that food laboratories must verify |
| In February 2026, Chrysos reported 43 deployed PhotonAssay units, including its first XN unit at SGS in Perth. | Active; competes with fire assay and AAS finishing for gold |
| In August 2026, Chrysos reported 87 contracted PhotonAssay units and 11.3 million samples processed in fiscal 2026. | Reported; signals faster substitution in gold assay |
| In August 2026, the ABS reported mineral exploration spending of A$1,189.8 million for the June quarter of 2026. | Published; gold exploration reached A$565.6 million in the quarter |
Atomizers, vapor systems and sequential software
- Flame atomizers burn a fuel and oxidant gas mixture and remain the quickest route to routine gold, copper and zinc readings in digests.
- Graphite furnaces heat small sample volumes in a tube and, with Zeeman background correction as in GBC enduro systems, reach sub-ppb detection.
- Hydride and vapor generators turn arsenic, selenium and mercury into gases, and GBC pairs its HG3000 hydride system with SavantAA and XplorAA.
- Fast sequential software switches lamps and gas settings automatically, which lets the Agilent 240FS read 10 elements per sample in under two minutes.
Need a Custom Version of This Report?
Tailor the scope, geography, or segments to your exact requirements.
- Custom geography or segment scope
- Direct access to our analyst team
Five brands compete on uptime, service and local support
Competition centers on uptime, service coverage and cost per test rather than on list price alone. Agilent Technologies designs atomic absorption instruments at its Mulgrave center in Victoria and sells the 240FS AA for fast sequential flame work. GBC Scientific Equipment, which began operating in Melbourne in 1978, offers SavantAA, XplorAA and enduro systems and builds hydride and furnace accessories. Thermo Fisher Scientific offers its iCE 3000 series and runs its Australian base from Scoresby, while Shimadzu Corporation offers the AA-7800 series and serves Australia through its Rydalmere subsidiary, which has more than 100 staff across Australia and New Zealand. PerkinElmer offers PinAAcle flame, furnace and combined systems and has operated under New Mountain Capital since March 2023. Suppliers that keep engineers close to mineral and environmental laboratories win most replacement orders.
Instrument brands active in Australian laboratories
| Company | Type | Role in the market |
|---|---|---|
| Agilent Technologies | Instrument maker | Designs AAS at Mulgrave and sells the 240FS AA |
| GBC Scientific Equipment | Local instrument maker | Melbourne firm offering SavantAA, XplorAA and enduro systems |
| Thermo Fisher Scientific | Instrument maker and distributor | Offers iCE 3000 series AAS, with its Australian base in Scoresby |
| Shimadzu Corporation | Instrument maker | Offers the AA-7800 series, with a Rydalmere-based subsidiary |
| PerkinElmer | Instrument maker and service provider | Offers PinAAcle flame, furnace and combined systems |
Credence Research view on metals testing instruments
Credence Research's view is that the Australia atomic absorption spectrometer market will grow steadily rather than quickly, because the technique now competes with plasma and photon methods for new laboratory budgets. Flame systems keep the largest share for routine assay and food work, while graphite furnace methods gain as lead and cadmium limits tighten. Melbourne design work for AAS product lines sold worldwide gives local buyers good access to engineers and parts. Queensland, which held 20.4% of 2025 value, should grow at 5.03% a year as exploration demand holds up, while service contracts protect supplier income across older fleets.
Sources behind the state and technology splits
The report uses 2025 as the base year on a calendar basis, and market values come from the Credence Research model. That model draws on Australian Bureau of Statistics exploration and population data, USGS production data, NHMRC and FSANZ standards, TGA guideline listings, NATA accreditation scopes, company product pages, stock exchange announcements and trade media. State shares are the sheet values supplied for this study, while segment splits and state growth rates are Credence Research estimates. No interviews or surveys were used, and every dated fact in the report comes from a source page opened during the research.
Furnace methods and service work drive growth to 2035
The Australia atomic absorption spectrometer market is expected to reach USD 16.6 million by 2035, rising at a 4.88% CAGR during 2026–2035, as laboratories balance routine flame work with lower-limit furnace testing. New instruments keep the largest share of spending, while service and software, graphite furnace systems and contract laboratories grow fastest. Contract testing laboratories should expand demand at 5.36% a year as miners and food processors outsource routine metal work. Photon assay, ICP panels and remote service costs will limit growth in gold work, yet food, water and medicine rules keep compliance testing steady through the forecast period.
Frequently Asked Questions
How big is the Australia atomic absorption spectrometer market?
Which technology holds the largest share?
Which state holds the largest share of value?
Why does Western Australia grow fastest?
Why is graphite furnace analysis growing quickly?
How does photon assay affect demand?
Which customer type buys the most systems?
Which companies are active in the Australia atomic absorption spectrometer market?
Table of Content
Chapter 1 Market Segmentation
- 1.1 Segmentation Framework
- 1.1.1 Product and Service Classification
- 1.1.2 Application and End-Use Classification
- 1.1.3 Technology and Solution Classification
- 1.1.4 Customer and Distribution Channel Classification
- 1.1.5 Geographic Segmentation
- 1.1.6 Market Segment Definitions and Boundaries
- 1.2 By Product Type
- 1.2.1 New instruments
- 1.2.2 Consumables
- 1.2.3 Service and software
- 1.3 By Technology
- 1.3.1 Flame atomic absorption
- 1.3.2 Graphite furnace atomic absorption
- 1.3.3 Hydride generation atomic absorption
- 1.3.4 Cold vapour atomic absorption
- 1.4 By End-Use Industry
- 1.4.1 Mining and mineral exploration
- 1.4.2 Environmental testing
- 1.4.3 Food and beverage testing
- 1.4.4 Pharmaceutical and clinical testing
- 1.4.5 Research and process control
- 1.5 By Customer Type
- 1.5.1 Contract testing laboratories
- 1.5.2 In-house corporate laboratories
- 1.5.3 Public and research laboratories
- 1.6 By State
- 1.6.1 New South Wales
- 1.6.2 Victoria
- 1.6.3 Queensland
- 1.6.4 Western Australia
- 1.6.5 Remaining States and Territories
Chapter 2 Introduction
- 2.1 Report Objectives and Scope
- 2.2 Product Definition and Industry Terminology
- 2.3 Market Inclusions and Exclusions
- 2.4 Research Process
- 2.4.1 Primary Research and Expert Interviews
- 2.4.2 Secondary Research and Source Review
- 2.4.3 Top-Down and Bottom-Up Estimation
- 2.4.4 Data Triangulation and Verification
- 2.5 Market Size Measurement Basis
- 2.5.1 2025: USD 4.80 million → 2035: USD 16.6 million
- 2.6 Historical and Forecast Reference Periods
- 2.6.1 Historical Period: 2018-2025
- 2.6.2 Base Year: 2025
- 2.6.3 Forecast Period: 2025-2035
- 2.7 Research Assumptions and Limitations
Chapter 3 Executive Summary
- 3.1 Market Snapshot and Key Findings
- 3.2 Base-Year Market Size, 2025
- 3.3 Forecast Market Size, 2035
- 3.4 Revenue and Volume Growth Outlook
- 3.5 Key Demand and Supply Indicators
- 3.6 Leading Market Segments
- 3.7 Fastest-Growing Market Opportunities
- 3.8 Regional Performance Highlights
- 3.9 Technology and Industry Transformation
- 3.10 Competitive Landscape Summary
- 3.11 Analyst View and Strategic Implications
Chapter 4 Australia Atomic Absorption Spectrometer Market Trends and Developments
- 4.1 Historical Industry Development, 2018-2025
- 4.2 Recent Market Trends and Developments
- 4.3 Demand and Customer Behavior Trends
- 4.4 Technology and Product Innovation
- 4.5 Artificial Intelligence, Automation and Digitalization
- 4.6 Local Manufacturing and Supply Chain Realignment
- 4.7 Industry Partnerships, Mergers and Acquisitions
- 4.8 Sustainability and Circular Economy Developments
- 4.9 Government and Private Sector Investment Trends
- 4.10 Emerging Business Models and Commercialization
- 4.11 Industry Developments and Announcements
Chapter 5 Australia Atomic Absorption Spectrometer Market Production, Supply and Demand Analysis
- 5.1 Demand Trend and Consumption Analysis, 2018-2025
- 5.2 Demand Forecast, 2025-2035
- 5.3 Production and Output Trend, 2018-2025
- 5.4 Production and Output Forecast, 2025-2035
- 5.5 Installed Capacity and Capacity Utilization
- 5.6 Company-Wise Production Plants and Statistics
- 5.6.1 Installed Production Capacity
- 5.6.2 Actual Production
- 5.6.3 Planned Capacity and Expansion Targets
- 5.7 Supply Chain Structure and Procurement Trends
- 5.8 Supply-Demand Gap and Bottlenecks
- 5.9 Import Dependence and Sourcing Structure
- 5.10 Contract Manufacturing and Outsourcing
- 5.11 Regional Supply and Demand Concentration
Chapter 6 Australia Atomic Absorption Spectrometer Market Pricing Analysis
- 6.1 Pricing Structure and Measurement
- 6.2 Historical Pricing Trends, 2018-2025
- 6.3 Pricing Outlook, 2025-2035
- 6.4 Average Selling Price and Unit Economics
- 6.5 Pricing by Product and Market Segment
- 6.6 Geographic Pricing Differences
- 6.7 Key Input, Energy, Labor and Logistics Costs
- 6.8 Contract Pricing and Purchasing Models
- 6.9 Pricing Sensitivity and Competitive Positioning
- 6.10 Price, Margin and Profitability Implications
Chapter 7 Australia Atomic Absorption Spectrometer Market Dynamics
- 7.1 Market Growth Drivers
- 7.1.1 Demand-Side Drivers
- 7.1.2 Technology and Innovation Drivers
- 7.1.3 Infrastructure and Investment Drivers
- 7.1.4 Regulatory and Policy Drivers
- 7.2 Market Restraints
- 7.2.1 Cost and Affordability Constraints
- 7.2.2 Technology and Adoption Barriers
- 7.2.3 Supply Chain and Operational Constraints
- 7.3 Market Challenges
- 7.3.1 Competitive Pressure and Margin Erosion
- 7.3.2 Skills, Infrastructure and Implementation Gaps
- 7.4 Emerging Market Opportunities
- 7.5 Market Dynamics Impact and Time-Horizon Assessment
Chapter 8 Australia Atomic Absorption Spectrometer Value Chain Analysis
- 8.1 Industry Value Chain Overview
- 8.2 Upstream Suppliers and Critical Inputs
- 8.3 Technology and Component Providers
- 8.4 Manufacturing or Service Delivery
- 8.5 Distribution, Channel Partners and Integrators
- 8.6 Downstream Applications and End Users
- 8.7 Value Addition and Profit Pools
- 8.8 Vertical Integration and Outsourcing
- 8.9 Supplier Concentration and Risk
- 8.10 Supply Chain Localization and Resilience
Chapter 9 Australia Atomic Absorption Spectrometer Market Regulations and Policies
- 9.1 Relevant Laws, Standards and Compliance Frameworks
- 9.2 Product, Service, Safety and Quality Requirements
- 9.3 Government Policies, Incentives and Subsidies
- 9.4 Imports, Exports and Trade Barriers
- 9.5 Public Procurement and Local Content Requirements
- 9.6 Environmental and Sustainability Compliance
- 9.7 Upcoming Policy Changes and Market Implications
Chapter 10 Australia Atomic Absorption Spectrometer Market Hotspots and Opportunities
- 10.1 Market Opportunity Mapping and Growth Hotspots
- 10.2 High-Growth Applications and Customer Groups
- 10.3 Underserved Markets and White-Space Opportunities
- 10.4 Emerging Technology and Product Opportunities
- 10.5 New Capacity and Investment Hotspots
- 10.6 Market Entry and Expansion Opportunities
- 10.7 Distribution and Partnership Opportunities
- 10.8 Near-Term and Long-Term Commercial Potential
- 10.9 Opportunity Attractiveness and Execution Risks
Chapter 11 Australia Atomic Absorption Spectrometer Market Outlook, 2025-2035
- 11.1 Market Size and Analysis
- 11.1.1 Revenue (Market Measurement: 2025: USD 4.80 million → 2035: USD 16.6 million)
- 11.1.2 Market Volume and Quantity Sold
- 11.1.3 Historical Market Size, 2018-2025
- 11.1.4 Base-Year Market Size, 2025
- 11.2 Market Forecast, 2025-2035
- 11.2.1 Revenue Forecast to 2035
- 11.2.2 Volume Forecast to 2035
- 11.2.3 CAGR and Year-on-Year Growth
- 11.2.4 Incremental Revenue Opportunity
- 11.3 Forecast Assumptions and Scenario Analysis
- 11.3.1 Base-Case Forecast
- 11.3.2 Optimistic and Conservative Scenarios
- 11.3.3 Technology, Pricing and Policy Sensitivities
- 11.4 Market Attractiveness and Growth Outlook
Chapter 12 Australia Atomic Absorption Spectrometer Market Segmentation and Outlook
- 12.1 Segmentation Summary and Market Shares, 2025
- 12.2 Largest and Fastest-Growing Segments
- 12.3 By Product Type - Market Size and Forecast, 2025-2035
- 12.3.1 Segment Definition and Scope
- 12.3.2 Historical Market Size, 2018-2025
- 12.3.3 Revenue Forecast, 2025-2035
- 12.3.4 Volume Forecast, 2025-2035
- 12.3.5 Base-Year Market Share, 2025
- 12.3.6 Segment CAGR and Growth Drivers
- 12.3.7 Subsegment Market Size and Forecast
- 12.3.7.1 New instruments
- 12.3.7.2 Consumables
- 12.3.7.3 Service and software
- 12.3.8 Subsegment Pricing and Adoption Trends
- 12.3.9 Leading Suppliers and Competition
- 12.3.10 Regional Demand and Opportunities
- 12.4 By Technology - Market Size and Forecast, 2025-2035
- 12.4.1 Segment Definition and Scope
- 12.4.2 Historical Market Size, 2018-2025
- 12.4.3 Revenue Forecast, 2025-2035
- 12.4.4 Volume Forecast, 2025-2035
- 12.4.5 Base-Year Market Share, 2025
- 12.4.6 Segment CAGR and Growth Drivers
- 12.4.7 Subsegment Market Size and Forecast
- 12.4.7.1 Flame atomic absorption
- 12.4.7.2 Graphite furnace atomic absorption
- 12.4.7.3 Hydride generation atomic absorption
- 12.4.7.4 Cold vapour atomic absorption
- 12.4.8 Subsegment Pricing and Adoption Trends
- 12.4.9 Leading Suppliers and Competition
- 12.4.10 Regional Demand and Opportunities
- 12.5 By End-Use Industry - Market Size and Forecast, 2025-2035
- 12.5.1 Segment Definition and Scope
- 12.5.2 Historical Market Size, 2018-2025
- 12.5.3 Revenue Forecast, 2025-2035
- 12.5.4 Volume Forecast, 2025-2035
- 12.5.5 Base-Year Market Share, 2025
- 12.5.6 Segment CAGR and Growth Drivers
- 12.5.7 Subsegment Market Size and Forecast
- 12.5.7.1 Mining and mineral exploration
- 12.5.7.2 Environmental testing
- 12.5.7.3 Food and beverage testing
- 12.5.7.4 Pharmaceutical and clinical testing
- 12.5.7.5 Research and process control
- 12.5.8 Subsegment Pricing and Adoption Trends
- 12.5.9 Leading Suppliers and Competition
- 12.5.10 Regional Demand and Opportunities
- 12.6 By Customer Type - Market Size and Forecast, 2025-2035
- 12.6.1 Segment Definition and Scope
- 12.6.2 Historical Market Size, 2018-2025
- 12.6.3 Revenue Forecast, 2025-2035
- 12.6.4 Volume Forecast, 2025-2035
- 12.6.5 Base-Year Market Share, 2025
- 12.6.6 Segment CAGR and Growth Drivers
- 12.6.7 Subsegment Market Size and Forecast
- 12.6.7.1 Contract testing laboratories
- 12.6.7.2 In-house corporate laboratories
- 12.6.7.3 Public and research laboratories
- 12.6.8 Subsegment Pricing and Adoption Trends
- 12.6.9 Leading Suppliers and Competition
- 12.6.10 Regional Demand and Opportunities
- 12.7 By State - Market Size and Forecast, 2025-2035
- 12.7.1 Segment Definition and Scope
- 12.7.2 Historical Market Size, 2018-2025
- 12.7.3 Revenue Forecast, 2025-2035
- 12.7.4 Volume Forecast, 2025-2035
- 12.7.5 Base-Year Market Share, 2025
- 12.7.6 Segment CAGR and Growth Drivers
- 12.7.7 Subsegment Market Size and Forecast
- 12.7.7.1 New South Wales
- 12.7.7.2 Victoria
- 12.7.7.3 Queensland
- 12.7.7.4 Western Australia
- 12.7.7.5 Remaining States and Territories
- 12.7.8 Subsegment Pricing and Adoption Trends
- 12.7.9 Leading Suppliers and Competition
- 12.7.10 Regional Demand and Opportunities
- 12.8 Segment Growth Comparison
- 12.9 Segment Attractiveness and Priority Matrix
Chapter 13 Australia Atomic Absorption Spectrometer End-Use and Application Market Outlook
- 13.1 End-Use Industry and Customer Demand Structure
- 13.2 Leading Applications and Customer Groups
- 13.3 End-Use Market Size, Share and Forecast
- 13.4 Major End-Use Industry Deep Dives
- 13.4.1 Customer Requirements and Use Cases
- 13.4.2 Demand and Replacement Cycles
- 13.4.3 Technical and Regulatory Considerations
- 13.4.4 Purchasing and Procurement Models
- 13.4.5 Leading Vendors and Distribution Channels
- 13.4.6 Forecast and Commercial Opportunities
- 13.5 Emerging Applications and Cross-Segment Demand
- 13.6 End-Use Industry Investment Priorities
Chapter 14 Australia Atomic Absorption Spectrometer Geographic Market Outlook, 2025-2035
- 14.1 Domestic Market Distribution and Demand Clusters
- 14.2 State- or Province-Wise Market Size and Forecast, 2025-2035
- 14.3 City and Metropolitan Market Outlook
- 14.4 Industrial, Manufacturing and Commercial Clusters
- 14.5 Geographic Concentration of Key End Users
- 14.6 Local Pricing and Purchasing Differences
- 14.7 Domestic Production Facilities and Capacity Map
- 14.8 Local Infrastructure and Project Pipeline
- 14.9 State-Level Policy and Incentive Differences
- 14.10 Subnational Investment Hotspots and Opportunities
- 14.11 Distribution and Logistics Networks
- 14.12 Domestic Competitive Footprint
Chapter 15 Australia Atomic Absorption Spectrometer Technology, Innovation and Sustainability Outlook
- 15.1 Technology Landscape and Maturity
- 15.2 Product, Process and Service Innovation
- 15.3 AI, Automation and Digital Tools in the Industry
- 15.4 Technology Adoption and Performance Benchmarking
- 15.5 Innovation Pipeline and R&D Investment
- 15.6 Patent and Intellectual Property Trends
- 15.7 Energy Efficiency and Resource Management
- 15.8 Sustainability, Recycling and Circularity
- 15.9 Technology Roadmap, 2025-2035
- 15.10 Risks of Obsolescence and Technology Substitution
Chapter 16 Australia Atomic Absorption Spectrometer Market Key Strategic Imperatives
- 16.1 Growth and Market Entry Priorities
- 16.2 High-Return Products and Segments
- 16.3 Pricing, Profitability and Cost Optimization
- 16.4 Technology Investment and Product Differentiation
- 16.5 Supply Chain Localization and Resilience
- 16.6 Distribution and Customer Acquisition
- 16.7 Partnership, Acquisition and Capacity Strategy
- 16.8 Regional Expansion Priorities
- 16.9 Short-, Medium- and Long-Term Actions
Chapter 17 Competition Outlook
- 17.1 Industry Competition Characteristics
- 17.2 Market Structure and Concentration
- 17.3 Market Share and Competitive Positioning, 2025
- 17.4 Company-Wise Revenue and Product Benchmarking
- 17.5 Production and Service Capacity Benchmarking
- 17.6 Technology, Pricing and Differentiation
- 17.7 Regional Footprint and Distribution Strength
- 17.8 Mergers, Acquisitions and Strategic Alliances
- 17.9 New Entrants and Competitive Threats
- 17.10 Porter's Five Forces and Industry Attractiveness
- 17.11 Competitive Outlook, 2025-2035
Chapter 18 Company Profiles
- 18.1 Company Coverage and Selection Criteria
- 18.2 Agilent Technologies
- 18.2.1 Business Description
- 18.2.2 Company Ownership and Geographic Presence
- 18.2.3 Product and Service Portfolio
- 18.2.4 Manufacturing and Operating Footprint
- 18.2.5 Production Capacity and Expansion Plans
- 18.2.6 Financial Performance and Investment
- 18.2.7 Market Share and Competitive Position
- 18.2.8 Technology and Innovation Capabilities
- 18.2.9 Strategic Alliances or Partnerships
- 18.2.10 Recent Developments
- 18.2.11 Growth Strategy and Outlook
- 18.3 PerkinElmer
- 18.4 Shimadzu Corporation
- 18.5 Thermo Fisher Scientific
- 18.6 GBC Scientific Equipment
- 18.7 Other Relevant Market Participants
Note: Every listed company is profiled on the structure shown under the first company. The company list is preliminary and may change based on research findings, market developments, data availability and client requirements.
Chapter 19 Disclaimer
- 19.1 Research and Forecast Disclaimer
- 19.2 Data Source and Estimation Limitations
Note: The depth of individual sections depends on data availability for this market. Volume, capacity, trade and other unit-based metrics are included where applicable.

