
Remote mining and factory upgrades lift rugged PC demand
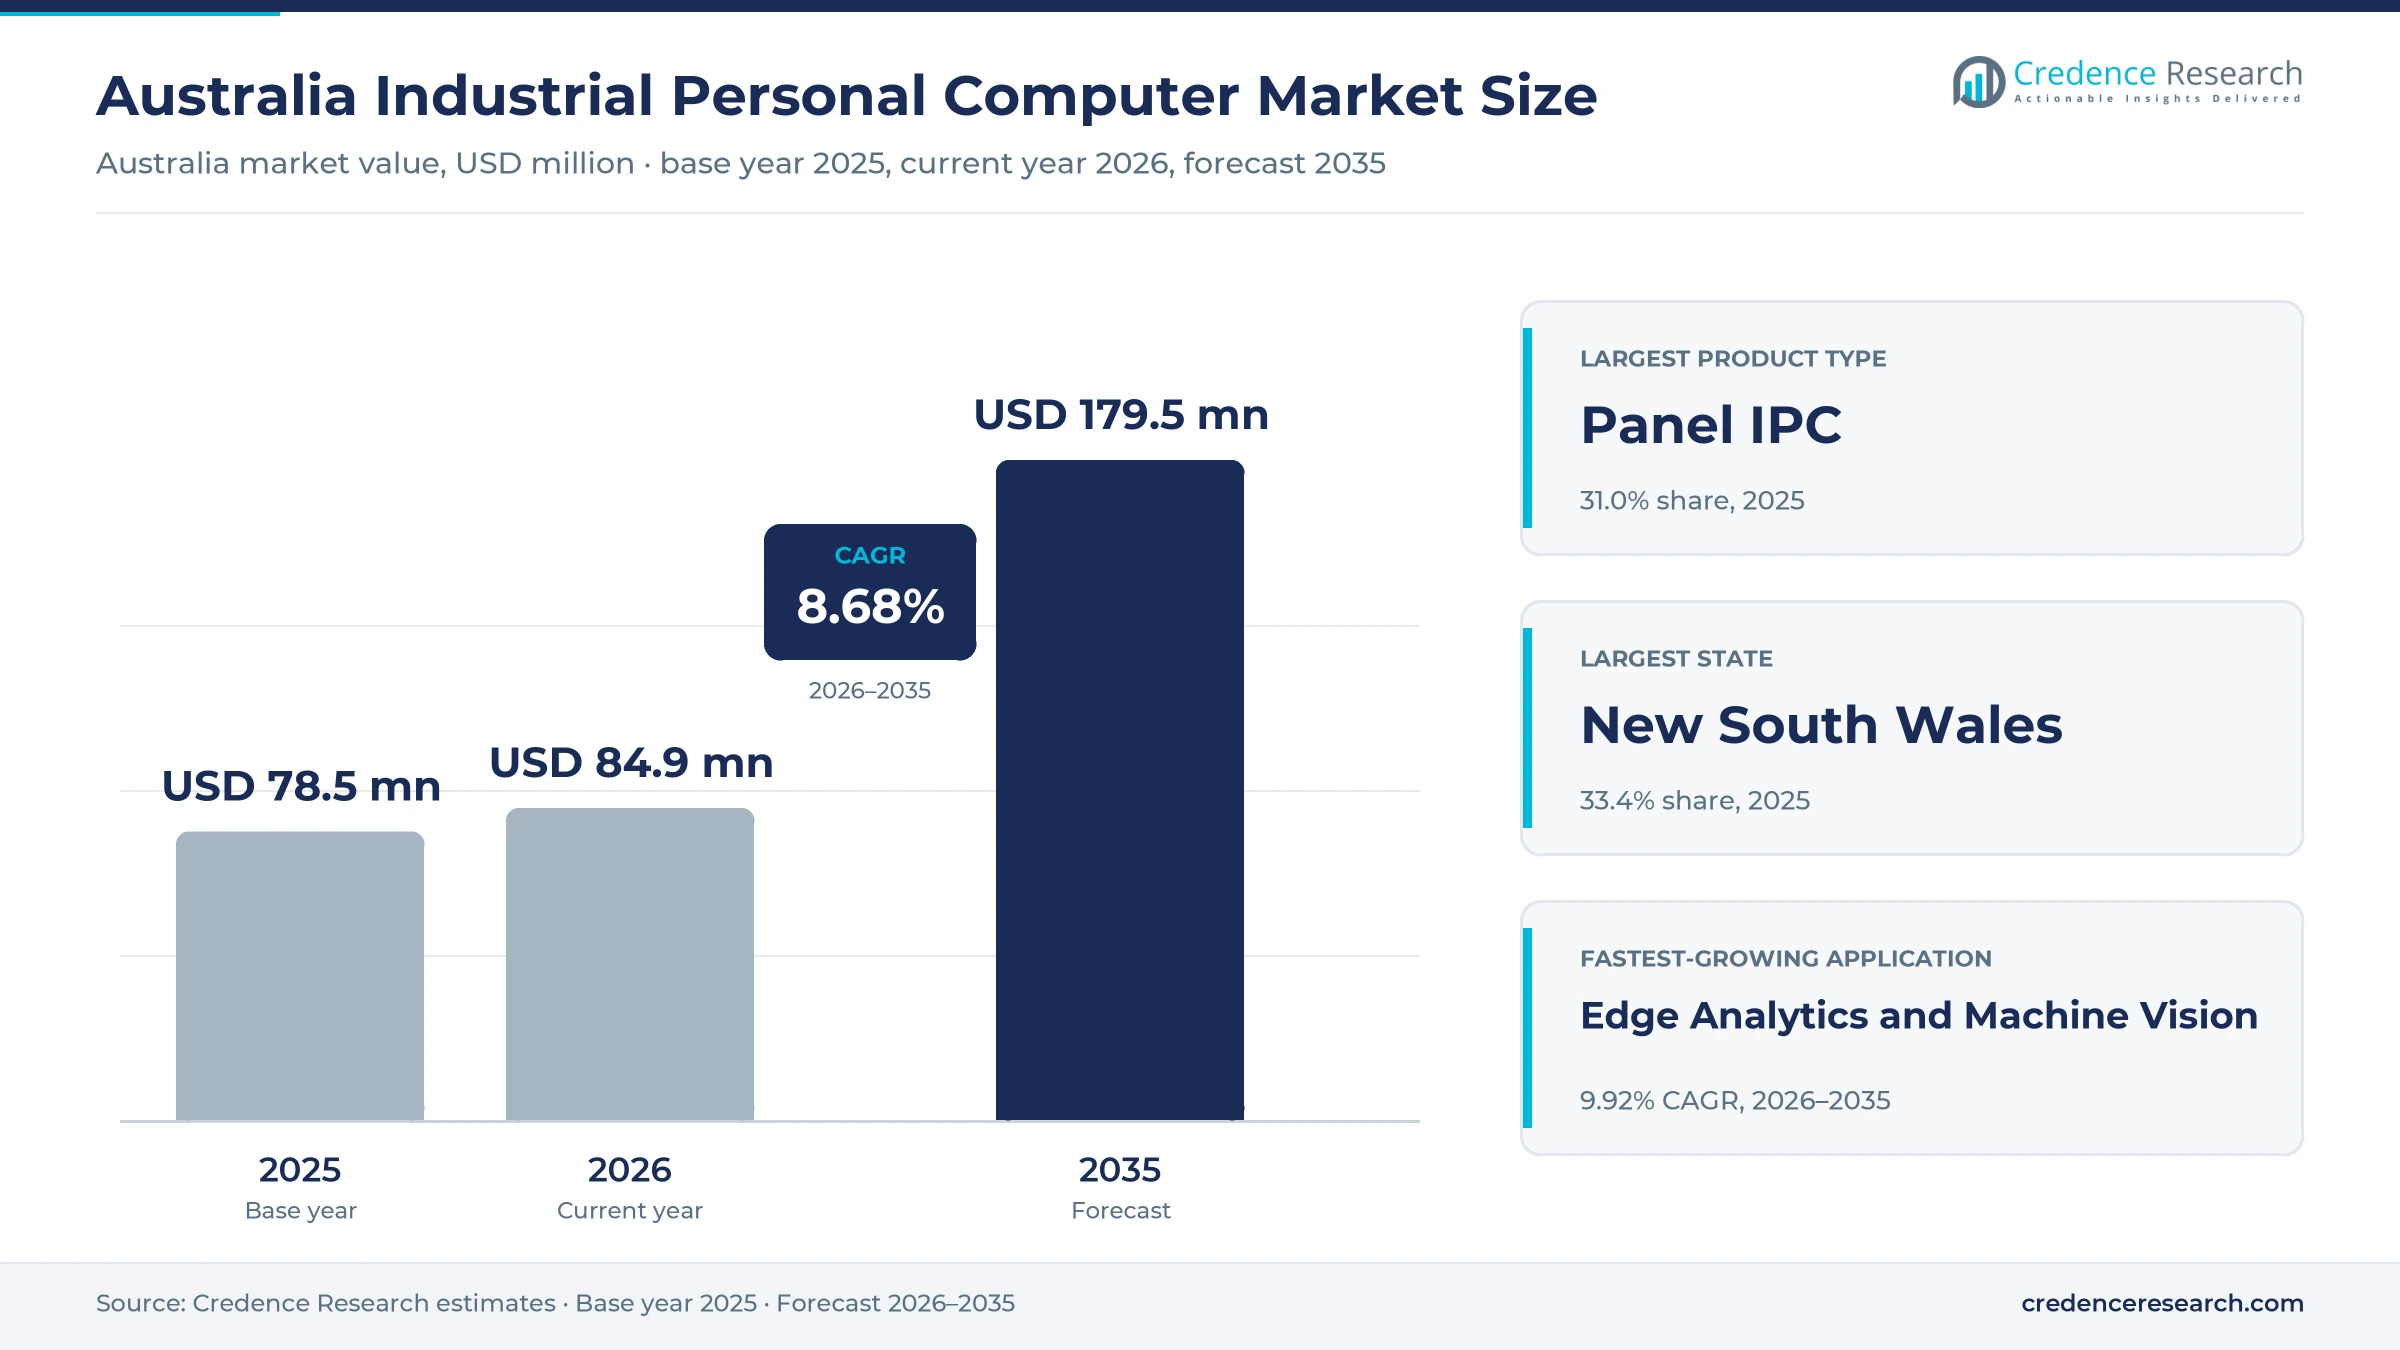
The Australia industrial personal computer market was valued at USD 78.5 million in 2025 and is projected to increase from USD 84.9 million in 2026 to USD 179.5 million by 2035, registering a CAGR of 8.68% during 2026–2035. Demand comes from mine operators, machine builders, food and packaging plants, utilities, defense contractors and transport operators that need rugged computers for operator panels, machine control and data collection. New South Wales held the largest state share, 33.4% in 2025, because manufacturers, integrators and public sector buyers cluster around Sydney and the Hunter. Western Australia is the fastest-growing state at 9.45% a year, as Pilbara iron ore miners run more autonomous fleets from Perth control rooms. In turn, the end of Windows 10 support in October 2025 is pushing buyers toward long-term servicing editions and newer hardware.
Which panel, box, rack and embedded computers are counted?
The estimate measures spending in Australia on panel, box, rack-mount, embedded and portable computers built for industrial duty, including fanless designs, wide temperature ranges and long product lifecycles. It covers units used for operator screens, machine control, vision and analytics, and data acquisition across mining, manufacturing, energy, defense and transport. Values are stated in USD million at current prices and exclude goods and services tax.
The estimate excludes office desktops, consumer laptops, rugged phones, standalone controllers without a PC platform, software licenses sold separately and integration labor. The value chain runs from overseas board and system makers through local subsidiaries, authorized distributors and system integrators to machine builders, asset owners and public sector buyers.
Australia Industrial Personal Computer Market Insights
- The Australia industrial personal computer market was valued at USD 78.5 million in 2025 and is projected to reach USD 179.5 million by 2035, at an 8.68% CAGR during 2026–2035.
- New South Wales held a 33.4% share of 2025 value, as manufacturers, integrators and public sector buyers cluster around Sydney.
- Panel units led product types with a 31.0% share of 2025 value, because operator screens sit on almost every machine and process line.
- Fortescue and Liebherr signed a deal on Sept. 25, 2024, covering 475 machines, including 360 autonomous battery-electric haul trucks.
- Edge analytics and machine vision grow fastest among applications at 9.92% a year during 2026–2035, as plants add cameras and local AI.
Panel units lead while embedded units grow fastest
Why do operator panel computers lead unit spending?
Based on product type, the market is categorized into panel IPC, box IPC, rack-mount IPC, embedded IPC and portable IPC. Panel IPC led with a 31.0% share of 2025 value, because touch screens combine display and computing at each machine or control desk. Embedded IPC grows fastest at 9.62% a year, as compact fanless units move into vehicles, cabinets and field sites.
Why do mines buy the most rugged computers?
Based on end-use industry, the market is categorized into mining and resources, manufacturing, energy and process industries, defense and aerospace, and transport and specialist industries. Mining and Resources led with a 30.0% share of 2025 value and also grow fastest at 9.38% a year, because autonomous fleets, processing plants and control rooms need hardened computers.
Why do operator screens still take the largest share?
Based on application, the market is categorized into human-machine interface, edge analytics and machine vision, PC-based machine control and data acquisition and supervisory computing. Human-Machine Interface led with a 36.0% share of 2025 value, because every line needs operator screens. Edge Analytics and Machine Vision grows fastest at 9.92% a year, as plants add cameras, inspection and local AI models.
Vendors, distributors or system integrators?
Based on sales channel, the market is categorized into direct OEM sales, authorized distribution and integrator hardware resale. Authorised Distribution led with a 40.0% share of 2025 value, because most buyers order small lots through local stockists. Integrator Hardware Resale grows fastest at 9.27% a year, as integrators bundle computers with software, networks and commissioning for mines and plants.
| Segment Group | Leading Sub-segment | Share, 2025 | Fastest-growing Sub-segment | CAGR, 2026–2035 |
|---|---|---|---|---|
| By Product Type | Panel IPC | 31.0% | Embedded IPC | 9.62% |
| By End-Use Industry | Mining and Resources | 30.0% | Mining and Resources | 9.38% |
| By Application | Human-Machine Interface | 36.0% | Edge Analytics and Machine Vision | 9.92% |
| By Sales Channel | Authorised Distribution | 40.0% | Integrator Hardware Resale | 9.27% |
Request a Free Sample
Fill in your details and we'll send you a free sample report.
- Sample data tables & charts
- Research methodology
Remote mines, PC-based control and OS refresh drive demand
How do remote mining operations lift computer demand?
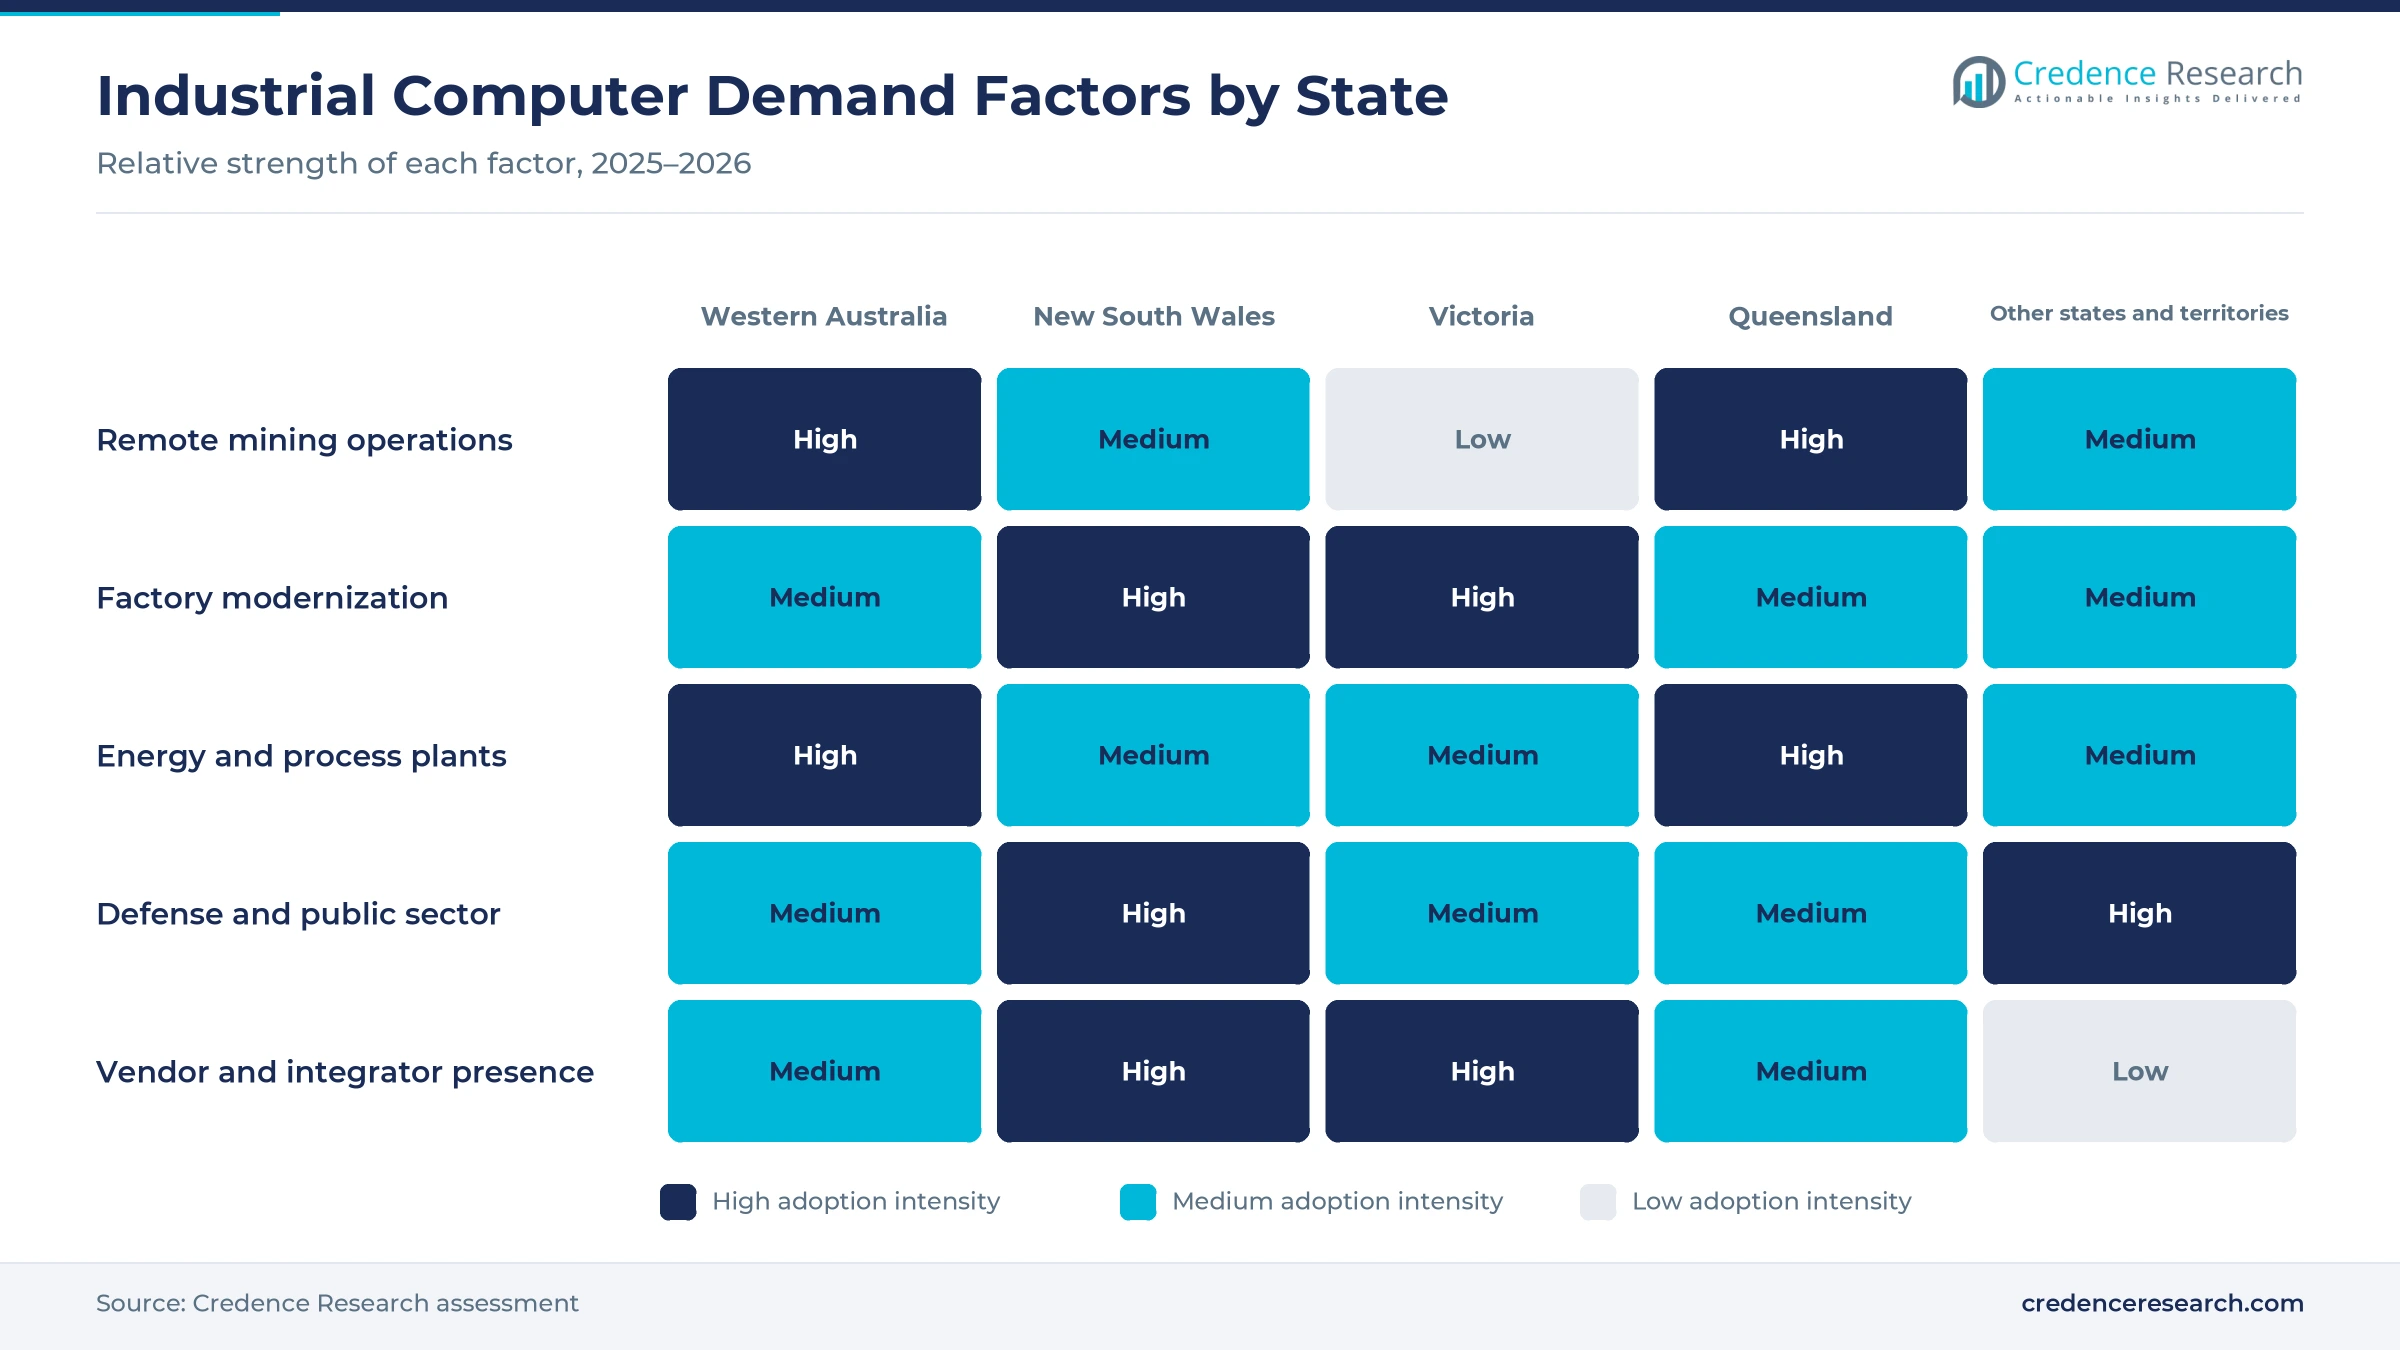
Remote mining operations lift computer demand, because autonomous trucks, drills, trains and plants are run from control rooms that need rugged screens, servers and in-vehicle computers. Fortescue runs the Hive in Perth, which remotely controls more than 200 autonomous haul trucks and about 500 million tons of iron ore moved a year, according to the company. Fortescue and Liebherr signed a USD 2.8 billion deal on Sept. 25, 2024, for 475 machines, including 360 autonomous battery-electric trucks, according to an industry report. Mining equipment, plant and machinery spending rose 5.4% in the June quarter 2026. As a result, mining and resources lead end uses with a 30.0% share.
Why does PC-based factory modernization support growth?
PC-based factory modernization supports growth, because plants replace separate controllers and screens with computers that run control, visualization and data tasks together. Beckhoff announced in April 2026 that its growth rests on PC-based control and that its cabinet-free MX-System is in high demand. The company runs an Australian head office in Melbourne and offices in Sydney, Brisbane and Perth. Manufacturing added 5.3% of gross domestic product in 2025, according to the World Bank. Consequently, PC-based machine control keeps a solid share, as machine builders replace programmable logic controllers with open platforms that also collect production data.
How does edition-specific device refresh add orders?
Edition-specific device refresh adds orders, because industrial buyers must keep operating systems supported for the full life of a machine. Microsoft ended Windows 10 support on Oct. 14, 2025, after which the system received no security updates without paid extensions. Windows 11 IoT Enterprise LTSC 2024 reached device makers on May 22, 2024, with servicing to Oct. 10, 2034, according to Microsoft. The edition also raised removable packages from 20 to 36 and turned on Credential Guard by default. As a result, panel units keep a 31.0% share, as owners replace older screens and boxes that cannot run newer long-term editions.
Why does business investment keep hardware budgets open?
Business investment keeps hardware budgets open, because miners, manufacturers and logistics firms fund control upgrades alongside new plant and buildings. Private new capital expenditure fell 3.6% in the June quarter 2026 but stayed 10.7% higher than a year earlier, according to the Australian Bureau of Statistics. Planned 2026-27 spending was revised up 15.5% from the previous estimate. Transport, postal and warehousing equipment spending also rose 27.8% in the quarter. Consequently, integrator hardware resale grows fastest among channels at 9.27% a year, as mining, logistics and factory projects bundle computers with networks, software and commissioning services.
Edge vision, cabinet-free control and security gain ground
How is the rise of edge vision changing hardware choices?
The rise of edge vision is changing hardware choices, because plants now run cameras and AI models next to the machine instead of in distant data centers. Rockwell Automation showed its OptixEdge gateway at ROKLive 2025 on the Gold Coast in July 2025, for real-time machine-level data processing. The same event drew more than 500 professionals and offered more than 50 hands-on labs on AI and digital transformation. Beckhoff also plans new AI features and tool chains for PC-based control in 2026. As a result, edge analytics and machine vision grow fastest among applications at 9.92% a year, supported by machine vision upgrades.
Why is the shift to fanless embedded units rising?
The shift to fanless embedded units is rising, because mines, trucks and remote sites need small computers that survive dust, vibration and heat without moving parts. Advantech supplies embedded, fanless, industrial and rack-mount computers from its Australian base in Dingley, Victoria and has built computing platforms since 1983. Fortescue expected its first operational autonomous battery-electric truck deployment in the first quarter of 2025. Its fast chargers deliver up to six megawatts and charge a truck in about 30 minutes. Consequently, embedded units grow fastest among products at 9.62% a year, as vehicles and chargers add onboard computing.
Can secure, long-life platforms open new public demand?
Secure, long-life platforms open a clear opening, because defense, utility and transport buyers want hardened devices that receive updates for a decade. Windows 11 IoT Enterprise LTSC 2024 offers 10 years of servicing and adds LSA protection, Smart App Control and Windows LAPS. Consumer extended updates for Windows 10 run only to Oct. 12, 2027, which leaves older devices with a short window. Siemens Australia led a delegation of more than 100 people to Hannover Messe in April 2018, including defense and infrastructure stakeholders. As a result, defense and aerospace buyers grow steadily, as programs specify long-life, secure computers for ships, vehicles and bases.
Is there room to grow in local electrical manufacturing?
Local electrical manufacturing offers room to grow, because new production lines need operator screens, test stations and data collection computers. Schneider Electric announced on Sept. 14, 2026, an AUD 2.5 million investment in a circuit breaker line at Gepps Cross in Adelaide. The line includes about AUD 500,000 of testing equipment and will add more than 25 jobs to a site with more than 400 staff. It is expected to start by the first quarter of 2027. Consequently, the remaining states and territories hold a 4.3% share, while human-machine interface panels gain on new lines.
Long refresh cycles, imports and skills slow adoption
Why do long machine lifecycles limit replacement?
Long machine lifecycles limit replacement, because industrial computers often run the same control software for 10 years or more. In turn, owners delay upgrades until hardware fails or support ends, which slows unit sales in mature plants. Validation testing and production downtime costs add a further barrier for plant owners. Vendors respond with long-availability product lines, drop-in replacements and long-term servicing operating systems that reduce the engineering work and downtime of each change.
How does import dependence create supply risk?
Import dependence creates supply risk, because almost all industrial computers and boards are made overseas and shipped through local subsidiaries and distributors. As a result, chip shortages or freight delays can stretch lead times for screens and embedded units. Small buyers also face minimum order quantities for special builds. Distributors respond by holding local stock of common models and agreeing annual supply plans with large mining, utility and manufacturing buyers.
Why do cybersecurity duties raise project costs?
Cybersecurity duties raise project costs, because connected control computers must be patched, hardened and monitored like office IT. Windows 10 support ended on Oct. 14, 2025, so unsupported devices now carry higher risk. Consequently, owners must budget for new licenses, testing and network segmentation before they connect machines. Vendors respond with secured images, managed updates and hardware security features that reduce the burden on plant teams and remote site staff.
Can integrators find staff for control upgrades?
Skills shortages constrain upgrades, because control engineers and integrators are needed to migrate software, test safety functions and commission new computers. In turn, projects in remote mines and regional plants can wait months for available staff. Larger vendors respond with training labs, remote commissioning tools and partner networks, while mine operators move more monitoring and support work into city control rooms in Perth and Brisbane.
Sydney plants lead while Pilbara mines add demand fastest
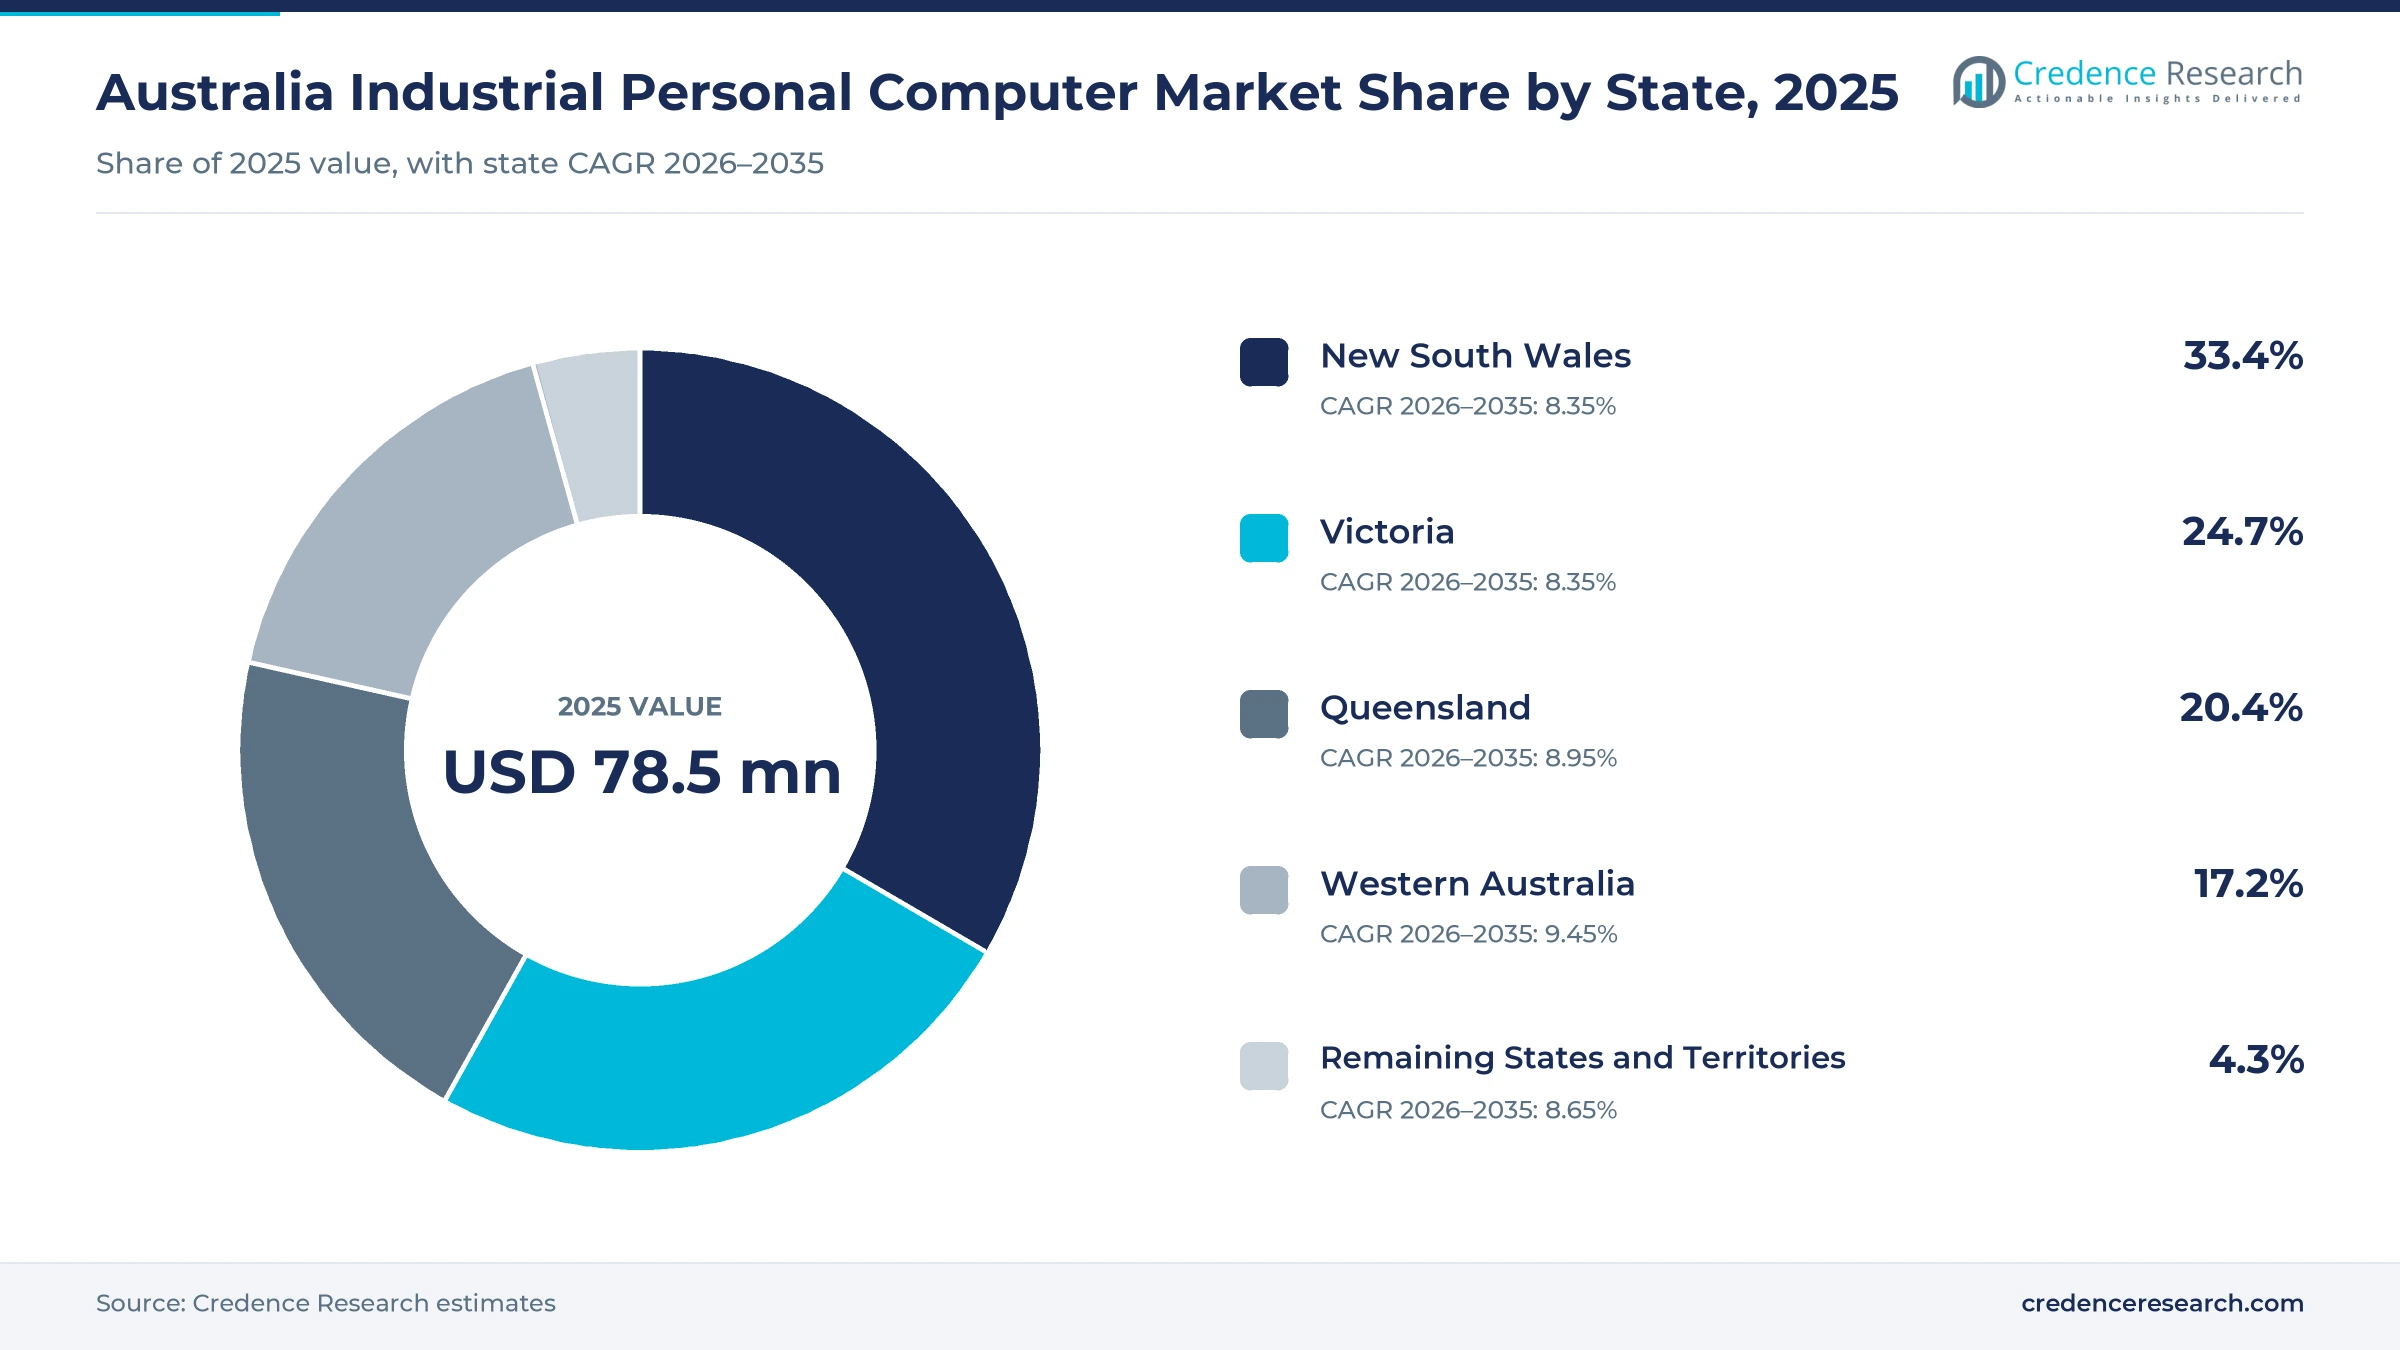
| State | Value, 2025 (USD million) | Share, 2025 | CAGR, 2026–2035 |
|---|---|---|---|
| New South Wales | 26.2 | 33.4% | 8.35% |
| Victoria | 19.4 | 24.7% | 8.35% |
| Queensland | 16.0 | 20.4% | 8.95% |
| Western Australia | 13.5 | 17.2% | 9.45% |
| Remaining States and Territories | 3.4 | 4.3% | 8.65% |
Factories and integrators keep New South Wales ahead
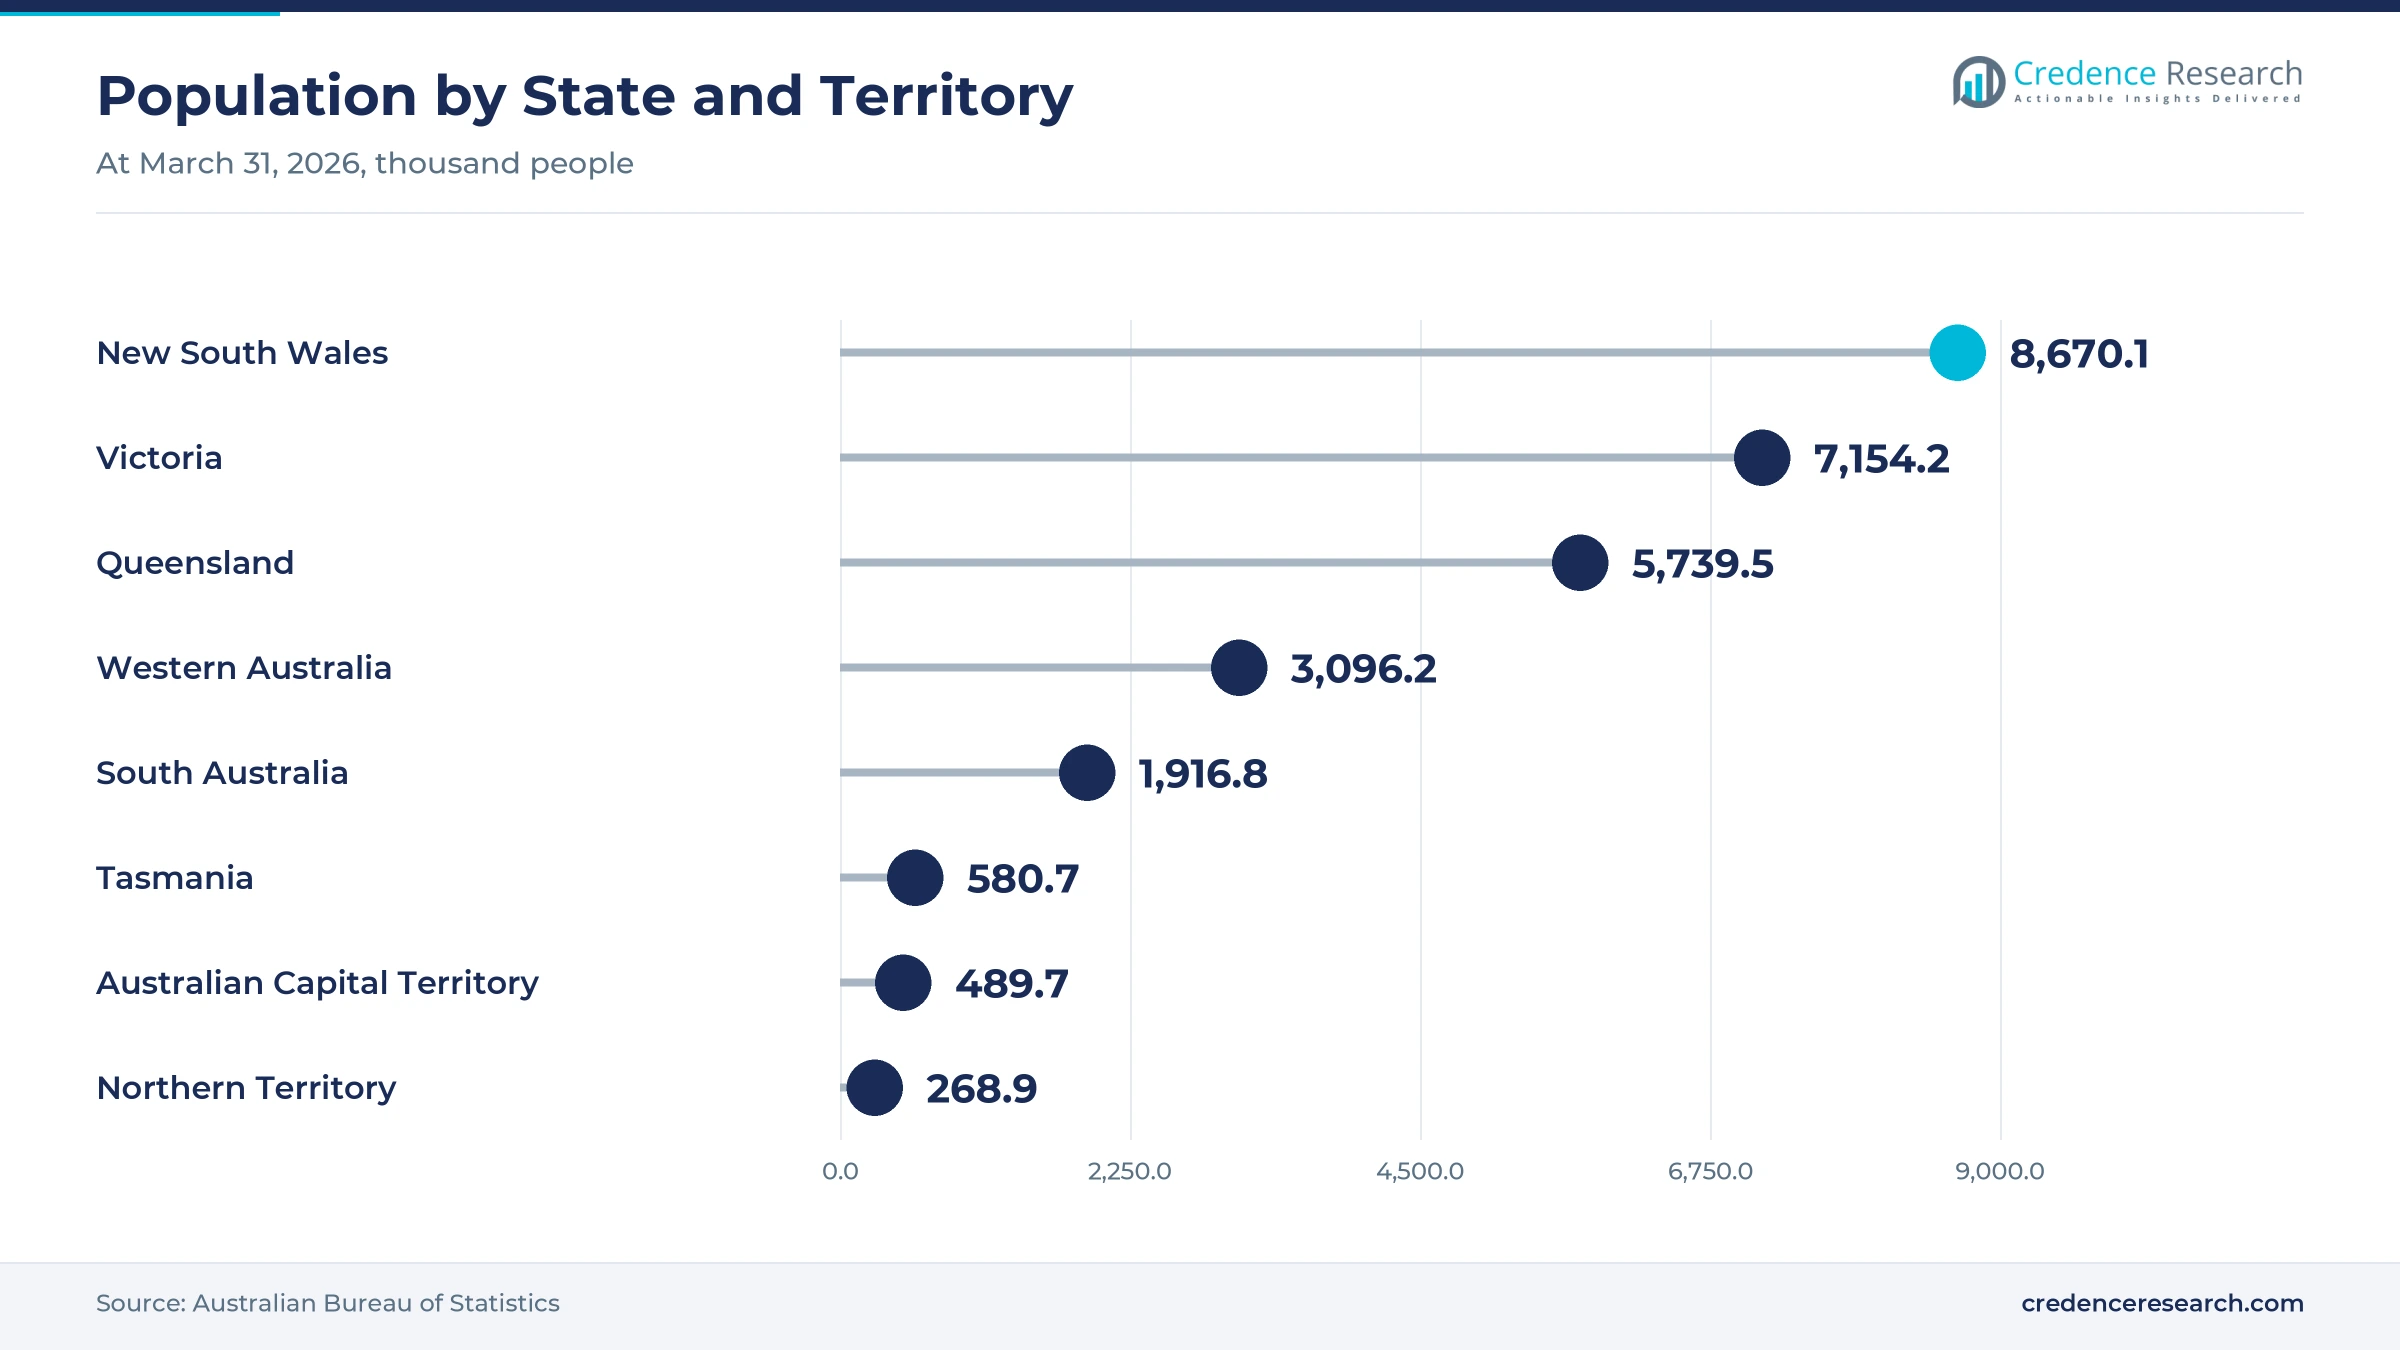
New South Wales held a 33.4% share of 2025 value and grows at 8.35% a year. The state had 8,670,100 residents at March 31, 2026, the largest population in the country. Beckhoff runs a Sydney office in Macquarie Park, close to integrators and machine builders. As a result, food, packaging, water and public sector projects give New South Wales the largest base of operator screens and control computers.
Melbourne factories and suppliers anchor victorian demand
Victoria held a 24.7% share of 2025 value and grows at 8.35% a year. Beckhoff keeps its Australian head office and stock center in Melbourne, while Advantech is based in Dingley. However, total capital expenditure in Victoria fell 13.9% in the June quarter 2026. Consequently, demand here depends on food, packaging, automotive parts and machine building, which favor edge computing and panel upgrades.
How do coal, gas and defense shape Queensland?
Queensland held a 20.4% share of 2025 value and grows at 8.95% a year. BHP Mitsubishi Alliance committed about AUD 100 million to 34 autonomous trucks at its Daunia coal mine. The state population also rose 1.6% in the year to March 2026. In turn, coal, gas, defense and food processing keep demand for rugged screens and in-vehicle computers rising.
Pilbara autonomy makes Western Australia the fastest state
Western Australia held a 17.2% share of 2025 value and grows fastest at 9.45% a year. Fortescue runs more than 200 autonomous haul trucks from Perth, while BHP moved Newman East to autonomous haulage. The state also had the fastest population growth at 2.1% in the year to March 2026. As a result, control rooms and fleets drive the strongest growth.
Shipyards and utilities support the smaller jurisdictions
The remaining states and territories held a 4.3% share of 2025 value and grow at 8.65% a year. Schneider Electric is adding a circuit breaker line in Adelaide. Consequently, shipbuilding, utilities, mining and defense projects in South Australia, Tasmania, the Northern Territory and the ACT add steady orders.
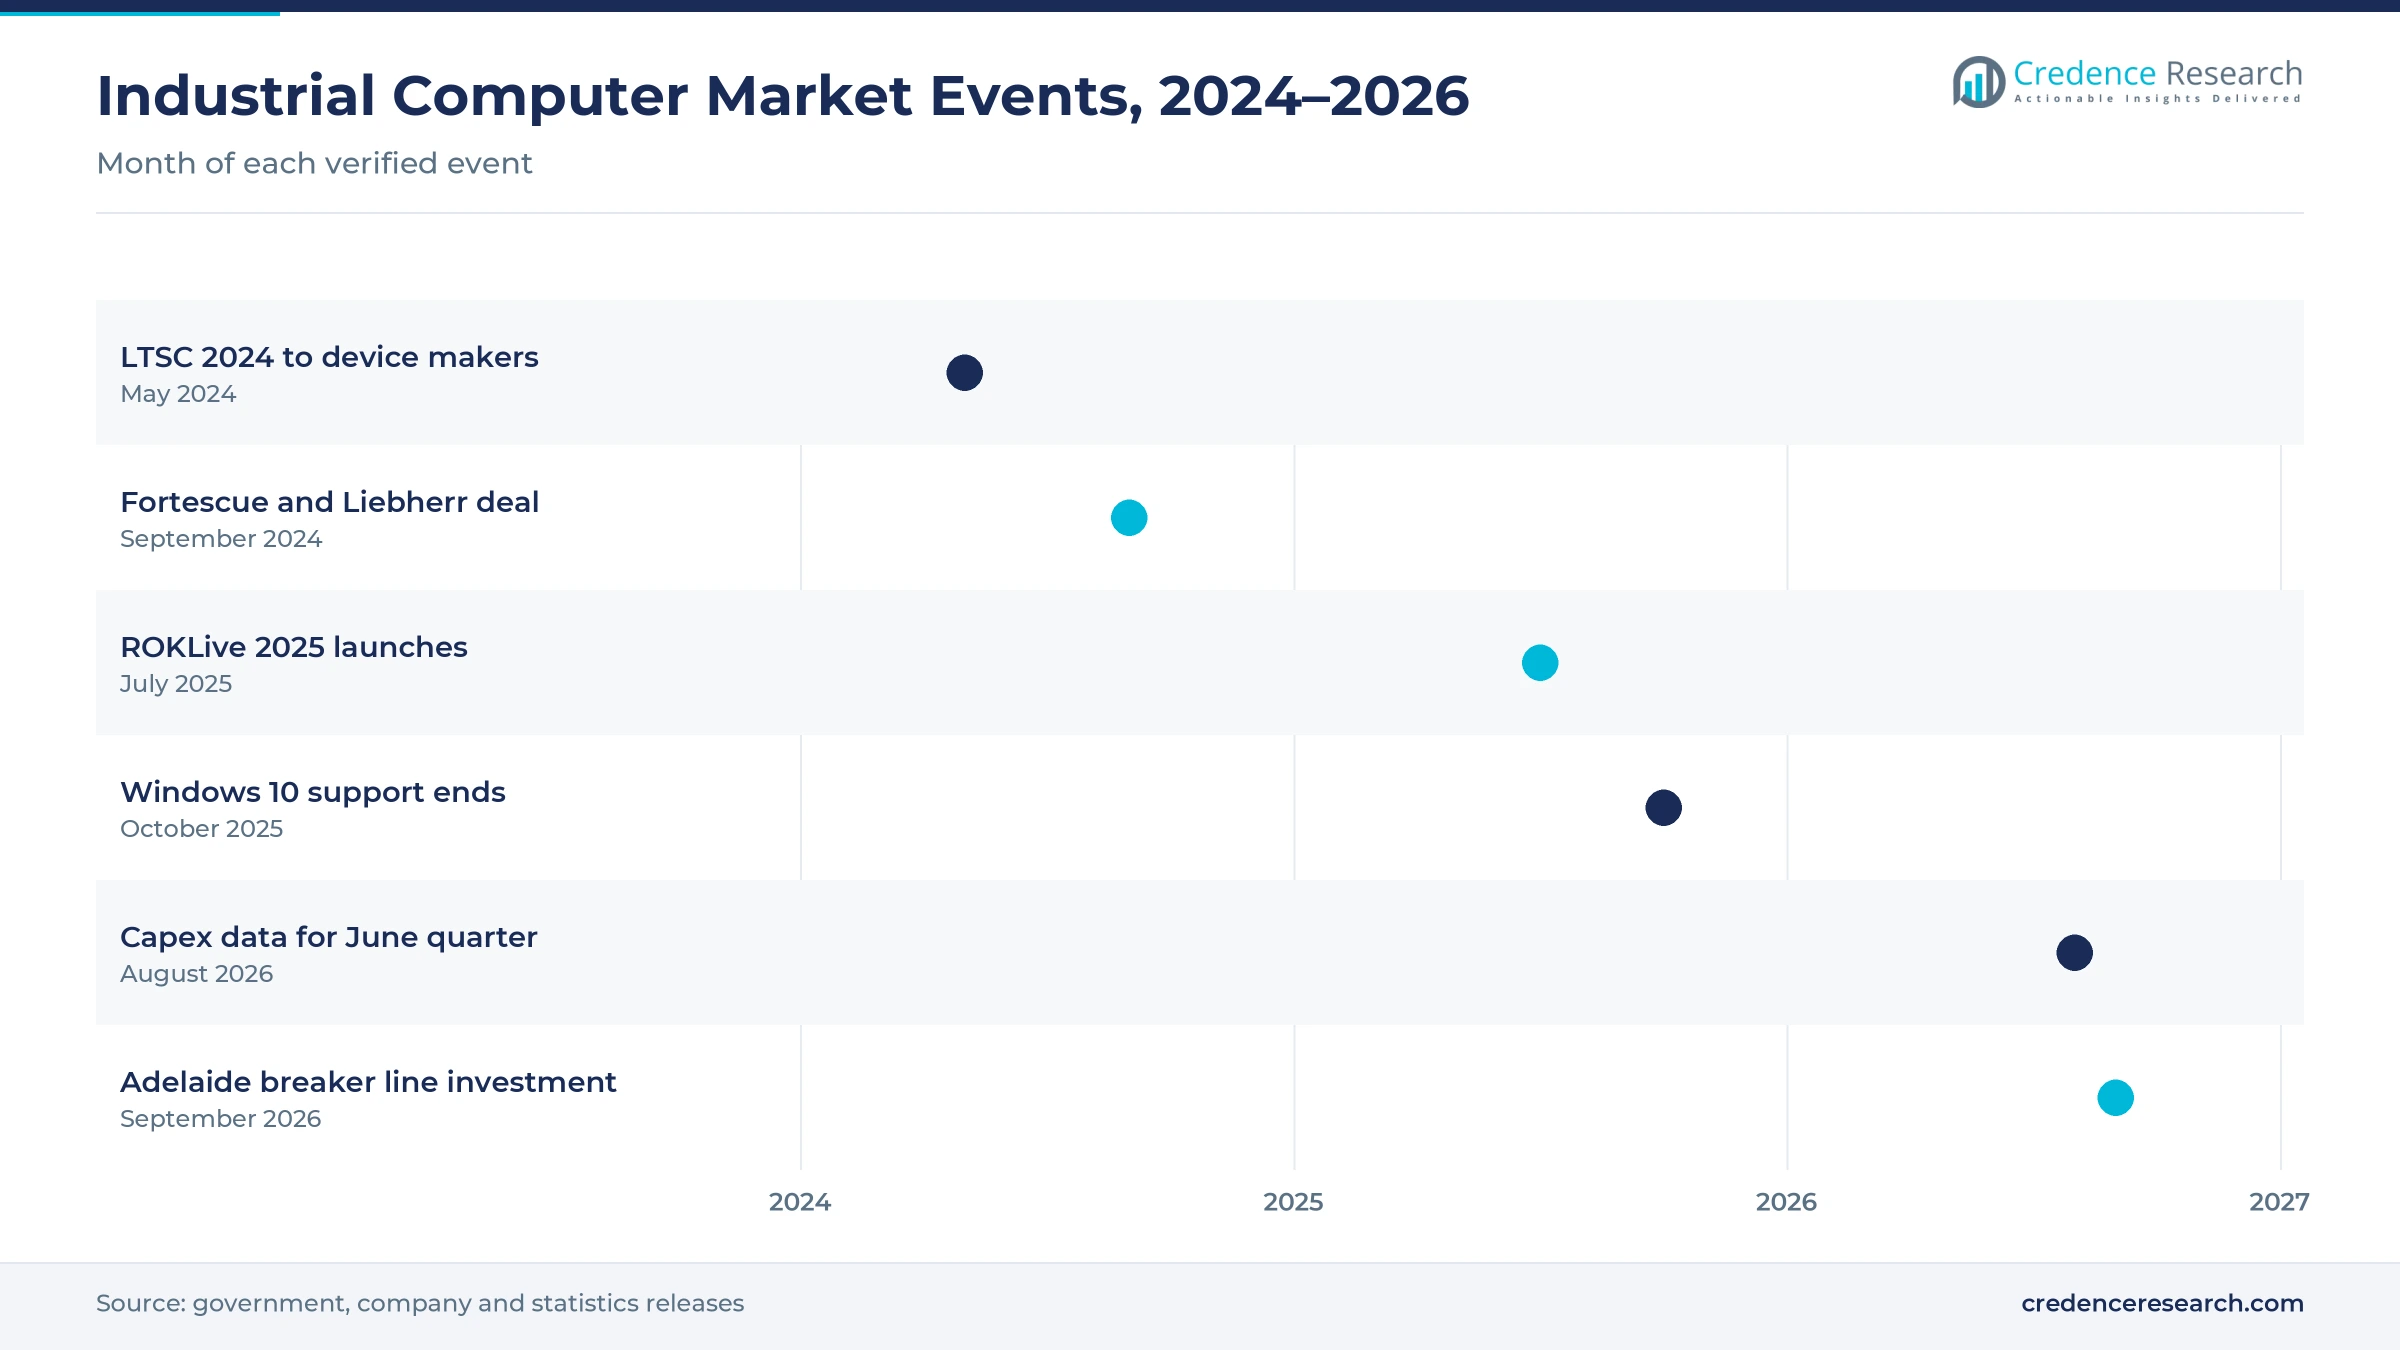
Mining fleets, OS releases and capex data, 2024–2026
| Development | Status and market relevance |
|---|---|
| In May 2024, Microsoft released Windows 11 IoT Enterprise LTSC 2024 to device makers with servicing to October 2034. | Sets the next long-life platform |
| In September 2024, Fortescue and Liebherr signed a deal for 475 machines, including 360 autonomous battery-electric trucks. | Adds in-vehicle and control computing |
| In July 2025, Rockwell Automation showed its OptixEdge gateway and ControlLogix 5590 controller at ROKLive 2025 on the Gold Coast. | Brings edge and control products to buyers |
| In October 2025, Microsoft ended Windows 10 support, leaving older industrial devices without free security updates. | Triggers device and license refresh |
| In September 2026, Schneider Electric announced an AUD 2.5 million circuit breaker line investment in Adelaide. | Adds local factory automation demand |
Windows, Linux and RTOS platforms split control roles
- Windows Platforms run most operator screens and supervisory software, and long-term servicing editions give about 10 years of updates.
- Linux Platforms run edge gateways, vision systems and containers, which suits buyers that want open tools and remote management.
- RTOS Platforms run time-critical motion and safety tasks, often beside Windows or Linux on the same multi-core computer.
- Hypervisor setups split one computer into control and visualization partitions, which cuts cabinet space and hardware count.
Need a Custom Version of This Report?
Tailor the scope, geography, or segments to your exact requirements.
- Custom geography or segment scope
- Direct access to our analyst team
Automation vendors and IPC makers compete on lifecycle
Competition combines global automation vendors with specialist industrial computer makers, local distributors and system integrators. Beckhoff runs an Australian head office in Melbourne and offices in Sydney, Brisbane and Perth, and bases its growth on PC-based control. Rockwell Automation runs ROKLive, its largest event in Australia and New Zealand, where it showed edge and control products in 2025. Advantech supplies embedded, fanless and rack-mount computers from Dingley in Victoria. Schneider Electric announced an AUD 2.5 million investment in 2026 at its Adelaide site, which employs more than 400 people. Siemens has led Australian delegations to Hannover Messe to show digital factory projects. Fortescue and Liebherr signed a deal in 2024 for 360 autonomous trucks, which widens demand for in-vehicle computing from equipment suppliers. Companies compete on product lifecycle, ruggedness, software integration, local stock and service.
Which vendors supply rugged computers to Australian sites?
| Company | Type | Role in the market |
|---|---|---|
| Beckhoff Automation | PC-based control vendor | Melbourne head office; Sydney, Brisbane and Perth offices |
| Rockwell Automation | Automation vendor | ROKLive 2025 on the Gold Coast; OptixEdge and ControlLogix |
| Advantech | Industrial computer maker | Embedded, fanless and rack-mount computers from Dingley |
| Schneider Electric | Automation and electrical vendor | Adelaide plant with more than 400 staff |
| Siemens | Automation vendor | Digital factory projects shown at Hannover Messe |
Credence Research sees mining and edge vision set pace
Credence Research's view is that Australian demand for industrial personal computers will grow strongly through 2035, as remote mining, PC-based control and operating system refresh keep buyers replacing hardware. Panel units should keep the largest product share, while embedded units gain most. New South Wales will remain the largest state, although Western Australia adds demand fastest. However, long machine lifecycles, import dependence and skills shortages will reward suppliers with local stock, long product availability and strong integrator networks that can support remote sites.
Installed base and replacement cycles anchor the model
The report uses 2025 as the base year, with values in USD million at current prices. Market values come from the Credence Research model, which combines installed machine and site counts, replacement cycles, computers per site and price tiers. The five state groups and their 2025 shares follow the client brief, while state growth and segment splits by product type, end-use industry, application and sales channel are Credence Research estimates. Sources used are official statistics, World Bank data, vendor documentation, company pages and news reports, and no interviews or surveys were used.
Mining automation and edge vision shape demand to 2035
The market is expected to reach USD 179.5 million by 2035, an 8.68% CAGR during 2026–2035, as remote mining, factory upgrades and edge vision keep demand rising. Spending is projected to rise from USD 84.9 million in 2026 as owners replace devices after the end of Windows 10 support. Growth should be strongest in embedded units, edge analytics and machine vision and Western Australia, while New South Wales keeps the largest share. In contrast, long refresh cycles, supply delays and skills shortages could slow orders in some years.
Frequently Asked Questions
How big is the Australia industrial personal computer market?
Which state leads demand?
Which state grows fastest?
Which product type holds the largest share?
Which application grows fastest?
How does the end of Windows 10 support affect demand?
Who are the leading companies in this market?
What are the main risks to growth?
Table of Content
Chapter 1 Market Segmentation
- 1.1 Segmentation Framework
- 1.1.1 Product and Service Classification
- 1.1.2 Application and End-Use Classification
- 1.1.3 Technology and Solution Classification
- 1.1.4 Customer and Distribution Channel Classification
- 1.1.5 Geographic Segmentation
- 1.1.6 Market Segment Definitions and Boundaries
- 1.2 By Product Type
- 1.2.1 Panel IPC
- 1.2.2 Box IPC
- 1.2.3 Rack-Mount IPC
- 1.2.4 Embedded IPC
- 1.2.5 Portable IPC
- 1.3 By End-Use Industry
- 1.3.1 Mining and Resources
- 1.3.2 Manufacturing
- 1.3.3 Energy and Process Industries
- 1.3.4 Defence and Aerospace
- 1.3.5 Transport and Specialist Industries
- 1.4 By Application
- 1.4.1 Human-Machine Interface
- 1.4.2 Edge Analytics and Machine Vision
- 1.4.3 PC-Based Machine Control
- 1.4.4 Data Acquisition and Supervisory Computing
- 1.5 By Sales Channel
- 1.5.1 Direct OEM Sales
- 1.5.2 Authorised Distribution
- 1.5.3 Integrator Hardware Resale
- 1.6 By State
- 1.6.1 Western Australia
- 1.6.2 New South Wales
- 1.6.3 Victoria
- 1.6.4 Queensland
- 1.6.5 Remaining States and Territories
Chapter 2 Introduction
- 2.1 Report Objectives and Scope
- 2.2 Product Definition and Industry Terminology
- 2.3 Market Inclusions and Exclusions
- 2.4 Research Process
- 2.4.1 Primary Research and Expert Interviews
- 2.4.2 Secondary Research and Source Review
- 2.4.3 Top-Down and Bottom-Up Estimation
- 2.4.4 Data Triangulation and Verification
- 2.5 Market Size Measurement Basis
- 2.5.1 2025: USD 78.5 million → 2035: USD 179.5 million
- 2.6 Historical and Forecast Reference Periods
- 2.6.1 Historical Period: 2018-2025
- 2.6.2 Base Year: 2025
- 2.6.3 Forecast Period: 2025-2035
- 2.7 Research Assumptions and Limitations
Chapter 3 Executive Summary
- 3.1 Market Snapshot and Key Findings
- 3.2 Base-Year Market Size, 2025
- 3.3 Forecast Market Size, 2035
- 3.4 Revenue and Volume Growth Outlook
- 3.5 Key Demand and Supply Indicators
- 3.6 Leading Market Segments
- 3.7 Fastest-Growing Market Opportunities
- 3.8 Regional Performance Highlights
- 3.9 Technology and Industry Transformation
- 3.10 Competitive Landscape Summary
- 3.11 Analyst View and Strategic Implications
Chapter 4 Australia Industrial Personal Computer Market Trends and Developments
- 4.1 Historical Industry Development, 2018-2025
- 4.2 Recent Market Trends and Developments
- 4.3 Demand and Customer Behavior Trends
- 4.4 Technology and Product Innovation
- 4.5 Artificial Intelligence, Automation and Digitalization
- 4.6 Local Manufacturing and Supply Chain Realignment
- 4.7 Industry Partnerships, Mergers and Acquisitions
- 4.8 Sustainability and Circular Economy Developments
- 4.9 Government and Private Sector Investment Trends
- 4.10 Emerging Business Models and Commercialization
- 4.11 Industry Developments and Announcements
Chapter 5 Australia Industrial Personal Computer Market Production, Supply and Demand Analysis
- 5.1 Demand Trend and Consumption Analysis, 2018-2025
- 5.2 Demand Forecast, 2025-2035
- 5.3 Production and Output Trend, 2018-2025
- 5.4 Production and Output Forecast, 2025-2035
- 5.5 Installed Capacity and Capacity Utilization
- 5.6 Company-Wise Production Plants and Statistics
- 5.6.1 Installed Production Capacity
- 5.6.2 Actual Production
- 5.6.3 Planned Capacity and Expansion Targets
- 5.7 Supply Chain Structure and Procurement Trends
- 5.8 Supply-Demand Gap and Bottlenecks
- 5.9 Import Dependence and Sourcing Structure
- 5.10 Contract Manufacturing and Outsourcing
- 5.11 Regional Supply and Demand Concentration
Chapter 6 Australia Industrial Personal Computer Market Pricing Analysis
- 6.1 Pricing Structure and Measurement
- 6.2 Historical Pricing Trends, 2018-2025
- 6.3 Pricing Outlook, 2025-2035
- 6.4 Average Selling Price and Unit Economics
- 6.5 Pricing by Product and Market Segment
- 6.6 Geographic Pricing Differences
- 6.7 Key Input, Energy, Labor and Logistics Costs
- 6.8 Contract Pricing and Purchasing Models
- 6.9 Pricing Sensitivity and Competitive Positioning
- 6.10 Price, Margin and Profitability Implications
Chapter 7 Australia Industrial Personal Computer Market Dynamics
- 7.1 Market Growth Drivers
- 7.1.1 Demand-Side Drivers
- 7.1.2 Technology and Innovation Drivers
- 7.1.3 Infrastructure and Investment Drivers
- 7.1.4 Regulatory and Policy Drivers
- 7.2 Market Restraints
- 7.2.1 Cost and Affordability Constraints
- 7.2.2 Technology and Adoption Barriers
- 7.2.3 Supply Chain and Operational Constraints
- 7.3 Market Challenges
- 7.3.1 Competitive Pressure and Margin Erosion
- 7.3.2 Skills, Infrastructure and Implementation Gaps
- 7.4 Emerging Market Opportunities
- 7.5 Market Dynamics Impact and Time-Horizon Assessment
Chapter 8 Australia Industrial Personal Computer Value Chain Analysis
- 8.1 Industry Value Chain Overview
- 8.2 Upstream Suppliers and Critical Inputs
- 8.3 Technology and Component Providers
- 8.4 Manufacturing or Service Delivery
- 8.5 Distribution, Channel Partners and Integrators
- 8.6 Downstream Applications and End Users
- 8.7 Value Addition and Profit Pools
- 8.8 Vertical Integration and Outsourcing
- 8.9 Supplier Concentration and Risk
- 8.10 Supply Chain Localization and Resilience
Chapter 9 Australia Industrial Personal Computer Market Regulations and Policies
- 9.1 Relevant Laws, Standards and Compliance Frameworks
- 9.2 Product, Service, Safety and Quality Requirements
- 9.3 Government Policies, Incentives and Subsidies
- 9.4 Imports, Exports and Trade Barriers
- 9.5 Public Procurement and Local Content Requirements
- 9.6 Environmental and Sustainability Compliance
- 9.7 Upcoming Policy Changes and Market Implications
Chapter 10 Australia Industrial Personal Computer Market Hotspots and Opportunities
- 10.1 Market Opportunity Mapping and Growth Hotspots
- 10.2 High-Growth Applications and Customer Groups
- 10.3 Underserved Markets and White-Space Opportunities
- 10.4 Emerging Technology and Product Opportunities
- 10.5 New Capacity and Investment Hotspots
- 10.6 Market Entry and Expansion Opportunities
- 10.7 Distribution and Partnership Opportunities
- 10.8 Near-Term and Long-Term Commercial Potential
- 10.9 Opportunity Attractiveness and Execution Risks
Chapter 11 Australia Industrial Personal Computer Market Outlook, 2025-2035
- 11.1 Market Size and Analysis
- 11.1.1 Revenue (Market Measurement: 2025: USD 78.5 million → 2035: USD 179.5 million)
- 11.1.2 Market Volume and Quantity Sold
- 11.1.3 Historical Market Size, 2018-2025
- 11.1.4 Base-Year Market Size, 2025
- 11.2 Market Forecast, 2025-2035
- 11.2.1 Revenue Forecast to 2035
- 11.2.2 Volume Forecast to 2035
- 11.2.3 CAGR and Year-on-Year Growth
- 11.2.4 Incremental Revenue Opportunity
- 11.3 Forecast Assumptions and Scenario Analysis
- 11.3.1 Base-Case Forecast
- 11.3.2 Optimistic and Conservative Scenarios
- 11.3.3 Technology, Pricing and Policy Sensitivities
- 11.4 Market Attractiveness and Growth Outlook
Chapter 12 Australia Industrial Personal Computer Market Segmentation and Outlook
- 12.1 Segmentation Summary and Market Shares, 2025
- 12.2 Largest and Fastest-Growing Segments
- 12.3 By Product Type - Market Size and Forecast, 2025-2035
- 12.3.1 Segment Definition and Scope
- 12.3.2 Historical Market Size, 2018-2025
- 12.3.3 Revenue Forecast, 2025-2035
- 12.3.4 Volume Forecast, 2025-2035
- 12.3.5 Base-Year Market Share, 2025
- 12.3.6 Segment CAGR and Growth Drivers
- 12.3.7 Subsegment Market Size and Forecast
- 12.3.7.1 Panel IPC
- 12.3.7.2 Box IPC
- 12.3.7.3 Rack-Mount IPC
- 12.3.7.4 Embedded IPC
- 12.3.7.5 Portable IPC
- 12.3.8 Subsegment Pricing and Adoption Trends
- 12.3.9 Leading Suppliers and Competition
- 12.3.10 Regional Demand and Opportunities
- 12.4 By End-Use Industry - Market Size and Forecast, 2025-2035
- 12.4.1 Segment Definition and Scope
- 12.4.2 Historical Market Size, 2018-2025
- 12.4.3 Revenue Forecast, 2025-2035
- 12.4.4 Volume Forecast, 2025-2035
- 12.4.5 Base-Year Market Share, 2025
- 12.4.6 Segment CAGR and Growth Drivers
- 12.4.7 Subsegment Market Size and Forecast
- 12.4.7.1 Mining and Resources
- 12.4.7.2 Manufacturing
- 12.4.7.3 Energy and Process Industries
- 12.4.7.4 Defence and Aerospace
- 12.4.7.5 Transport and Specialist Industries
- 12.4.8 Subsegment Pricing and Adoption Trends
- 12.4.9 Leading Suppliers and Competition
- 12.4.10 Regional Demand and Opportunities
- 12.5 By Application - Market Size and Forecast, 2025-2035
- 12.5.1 Segment Definition and Scope
- 12.5.2 Historical Market Size, 2018-2025
- 12.5.3 Revenue Forecast, 2025-2035
- 12.5.4 Volume Forecast, 2025-2035
- 12.5.5 Base-Year Market Share, 2025
- 12.5.6 Segment CAGR and Growth Drivers
- 12.5.7 Subsegment Market Size and Forecast
- 12.5.7.1 Human-Machine Interface
- 12.5.7.2 Edge Analytics and Machine Vision
- 12.5.7.3 PC-Based Machine Control
- 12.5.7.4 Data Acquisition and Supervisory Computing
- 12.5.8 Subsegment Pricing and Adoption Trends
- 12.5.9 Leading Suppliers and Competition
- 12.5.10 Regional Demand and Opportunities
- 12.6 By Sales Channel - Market Size and Forecast, 2025-2035
- 12.6.1 Segment Definition and Scope
- 12.6.2 Historical Market Size, 2018-2025
- 12.6.3 Revenue Forecast, 2025-2035
- 12.6.4 Volume Forecast, 2025-2035
- 12.6.5 Base-Year Market Share, 2025
- 12.6.6 Segment CAGR and Growth Drivers
- 12.6.7 Subsegment Market Size and Forecast
- 12.6.7.1 Direct OEM Sales
- 12.6.7.2 Authorised Distribution
- 12.6.7.3 Integrator Hardware Resale
- 12.6.8 Subsegment Pricing and Adoption Trends
- 12.6.9 Leading Suppliers and Competition
- 12.6.10 Regional Demand and Opportunities
- 12.7 By State - Market Size and Forecast, 2025-2035
- 12.7.1 Segment Definition and Scope
- 12.7.2 Historical Market Size, 2018-2025
- 12.7.3 Revenue Forecast, 2025-2035
- 12.7.4 Volume Forecast, 2025-2035
- 12.7.5 Base-Year Market Share, 2025
- 12.7.6 Segment CAGR and Growth Drivers
- 12.7.7 Subsegment Market Size and Forecast
- 12.7.7.1 Western Australia
- 12.7.7.2 New South Wales
- 12.7.7.3 Victoria
- 12.7.7.4 Queensland
- 12.7.7.5 Remaining States and Territories
- 12.7.8 Subsegment Pricing and Adoption Trends
- 12.7.9 Leading Suppliers and Competition
- 12.7.10 Regional Demand and Opportunities
- 12.8 Segment Growth Comparison
- 12.9 Segment Attractiveness and Priority Matrix
Chapter 13 Australia Industrial Personal Computer End-Use and Application Market Outlook
- 13.1 End-Use Industry and Customer Demand Structure
- 13.2 Leading Applications and Customer Groups
- 13.3 End-Use Market Size, Share and Forecast
- 13.4 Major End-Use Industry Deep Dives
- 13.4.1 Customer Requirements and Use Cases
- 13.4.2 Demand and Replacement Cycles
- 13.4.3 Technical and Regulatory Considerations
- 13.4.4 Purchasing and Procurement Models
- 13.4.5 Leading Vendors and Distribution Channels
- 13.4.6 Forecast and Commercial Opportunities
- 13.5 Emerging Applications and Cross-Segment Demand
- 13.6 End-Use Industry Investment Priorities
Chapter 14 Australia Industrial Personal Computer Geographic Market Outlook, 2025-2035
- 14.1 Domestic Market Distribution and Demand Clusters
- 14.2 State- or Province-Wise Market Size and Forecast, 2025-2035
- 14.3 City and Metropolitan Market Outlook
- 14.4 Industrial, Manufacturing and Commercial Clusters
- 14.5 Geographic Concentration of Key End Users
- 14.6 Local Pricing and Purchasing Differences
- 14.7 Domestic Production Facilities and Capacity Map
- 14.8 Local Infrastructure and Project Pipeline
- 14.9 State-Level Policy and Incentive Differences
- 14.10 Subnational Investment Hotspots and Opportunities
- 14.11 Distribution and Logistics Networks
- 14.12 Domestic Competitive Footprint
Chapter 15 Australia Industrial Personal Computer Technology, Innovation and Sustainability Outlook
- 15.1 Technology Landscape and Maturity
- 15.2 Product, Process and Service Innovation
- 15.3 AI, Automation and Digital Tools in the Industry
- 15.4 Technology Adoption and Performance Benchmarking
- 15.5 Innovation Pipeline and R&D Investment
- 15.6 Patent and Intellectual Property Trends
- 15.7 Energy Efficiency and Resource Management
- 15.8 Sustainability, Recycling and Circularity
- 15.9 Technology Roadmap, 2025-2035
- 15.10 Risks of Obsolescence and Technology Substitution
Chapter 16 Australia Industrial Personal Computer Market Key Strategic Imperatives
- 16.1 Growth and Market Entry Priorities
- 16.2 High-Return Products and Segments
- 16.3 Pricing, Profitability and Cost Optimization
- 16.4 Technology Investment and Product Differentiation
- 16.5 Supply Chain Localization and Resilience
- 16.6 Distribution and Customer Acquisition
- 16.7 Partnership, Acquisition and Capacity Strategy
- 16.8 Regional Expansion Priorities
- 16.9 Short-, Medium- and Long-Term Actions
Chapter 17 Competition Outlook
- 17.1 Industry Competition Characteristics
- 17.2 Market Structure and Concentration
- 17.3 Market Share and Competitive Positioning, 2025
- 17.4 Company-Wise Revenue and Product Benchmarking
- 17.5 Production and Service Capacity Benchmarking
- 17.6 Technology, Pricing and Differentiation
- 17.7 Regional Footprint and Distribution Strength
- 17.8 Mergers, Acquisitions and Strategic Alliances
- 17.9 New Entrants and Competitive Threats
- 17.10 Porter's Five Forces and Industry Attractiveness
- 17.11 Competitive Outlook, 2025-2035
Chapter 18 Company Profiles
- 18.1 Company Coverage and Selection Criteria
- 18.2 Rockwell Automation
- 18.2.1 Business Description
- 18.2.2 Company Ownership and Geographic Presence
- 18.2.3 Product and Service Portfolio
- 18.2.4 Manufacturing and Operating Footprint
- 18.2.5 Production Capacity and Expansion Plans
- 18.2.6 Financial Performance and Investment
- 18.2.7 Market Share and Competitive Position
- 18.2.8 Technology and Innovation Capabilities
- 18.2.9 Strategic Alliances or Partnerships
- 18.2.10 Recent Developments
- 18.2.11 Growth Strategy and Outlook
- 18.3 Advantech
- 18.4 Siemens
- 18.5 Beckhoff Automation
- 18.6 Schneider Electric
- 18.7 Other Relevant Market Participants
Note: Every listed company is profiled on the structure shown under the first company. The company list is preliminary and may change based on research findings, market developments, data availability and client requirements.
Chapter 19 Disclaimer
- 19.1 Research and Forecast Disclaimer
- 19.2 Data Source and Estimation Limitations
Note: The depth of individual sections depends on data availability for this market. Volume, capacity, trade and other unit-based metrics are included where applicable.

