
Directional Drilling Services Market Overview:
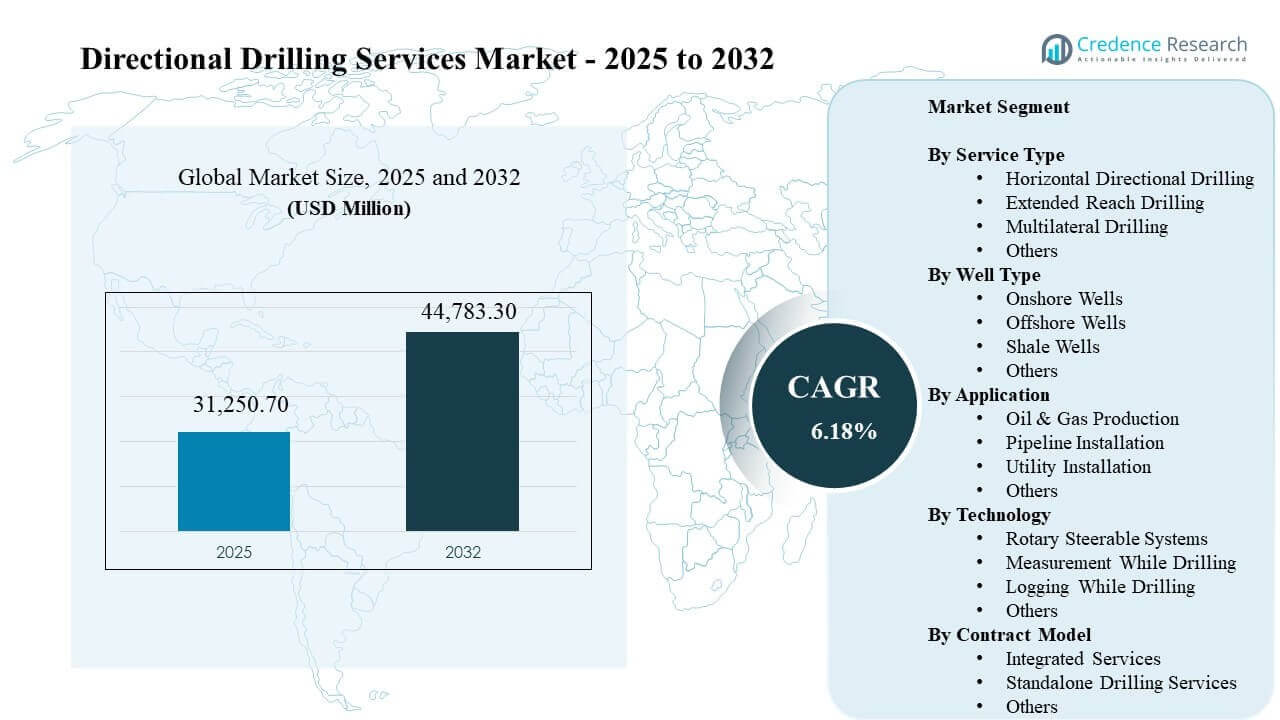
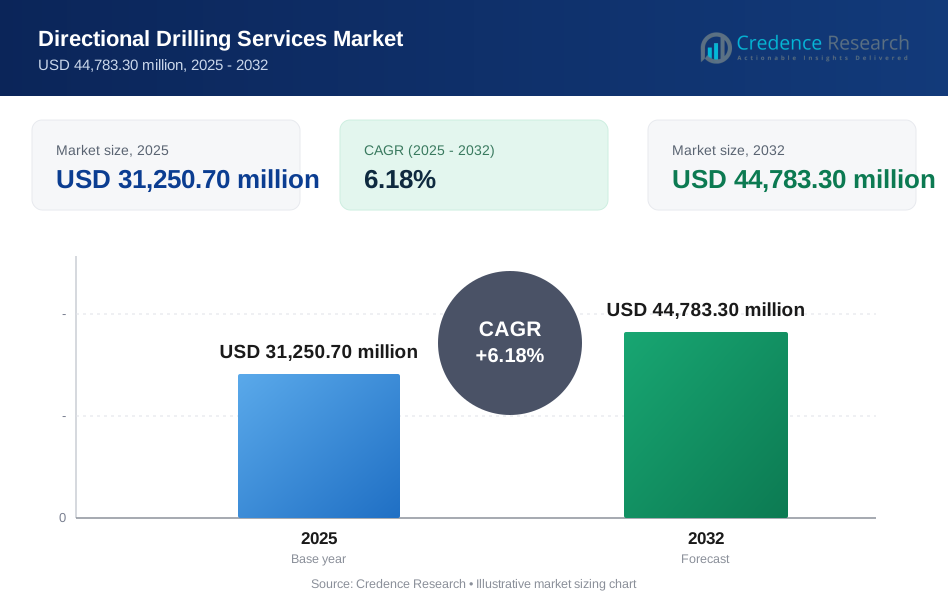
The Directional Drilling Services Market size was estimated at USD 31,250.70 million in 2025 and is expected to reach USD 44,783.30 million by 2032, growing at a CAGR of 6.18% from 2025 to 2032. Demand is rising as operators drill longer, more complex well trajectories that require tighter wellbore placement, higher-quality downhole data, and more consistent drilling performance across high-intensity programs. North America remains a major demand center due to large-scale unconventional drilling activity and ongoing efficiency-focused service adoption across drilling operations.
| REPORT ATTRIBUTE | DETAILS |
|---|---|
| Historical Period | 2021-2024 |
| Base Year | 2025 |
| Forecast Period | 2026-2032 |
| Directional Drilling Services Market Size 2025 | USD 31,250.70 million |
| Directional Drilling Services Market, CAGR | 6.18% |
| Directional Drilling Services Market Size 2032 | USD 44,783.30 million |
Key Market Trends & Insights
- The Directional Drilling Services Market is projected to expand from USD 31,250.70 million (2025) to USD 44,783.30 million (2032), reflecting a 6.18% CAGR (2025–2032).
- North America held the leading regional share at 30.6% in 2025, supported by sustained onshore activity and high utilization of advanced directional workflows.
- Asia Pacific represented 24.8% of market revenue in 2025, reflecting expanding drilling programs and continued investment in upstream development.
- Horizontal Directional Drilling accounted for the largest service-type share at 63.9% in 2025, underpinned by long-lateral development and complex trajectory requirements.
- Measurement While Drilling led the technology mix with a 31.4% share in 2025, reflecting operator focus on real-time trajectory control and reduced rework.
Segment Analysis
Segment performance is primarily shaped by drilling complexity, well geometry, and the level of real-time measurement required to deliver wells within tighter tolerance windows. Buyers increasingly favor integrated execution that combines downhole measurement, trajectory control, and interpretation workflows to reduce non-productive time and improve well placement accuracy. Horizontal well designs and longer laterals continue to anchor service demand, especially across high-volume programs where repeatability and consistency drive procurement decisions.
End-use demand remains concentrated in upstream oil and gas development, where directional capabilities directly affect production outcomes through reservoir exposure and placement quality. Technology adoption is shifting toward higher-fidelity measurement and steering packages that enable faster decisions during drilling and reduce corrective runs. Contracting preferences vary by operator strategy, with some prioritizing integrated accountability across tools and teams and others retaining flexibility through stand-alone service procurement.
By Service Type Insights
Horizontal Directional Drilling accounted for the largest share of 63.9% in 2025. Leadership reflects the sustained dominance of horizontal well architectures in unconventional development and complex reservoir access. Longer lateral lengths require tighter directional control and consistent execution to protect drilling efficiency. Horizontal projects also benefit from mature operational playbooks that scale across pads and repeat drilling campaigns.
By Well Type Insights
Onshore Wells accounted for the largest share of 71.1% in 2025. Onshore activity leads due to higher rig counts, faster campaign execution, and repeatable drilling programs that sustain tool utilization. Logistics simplicity and shorter cycle times support continuous service demand across active basins. Onshore development also drives consistent requirements for trajectory control and reliable downhole measurement.
By Application Insights
Oil & Gas Production accounted for the largest share of 69.8% in 2025. Upstream development relies on accurate well placement and stable drilling performance to maximize reservoir contact and production results. Directional services are embedded in development drilling and infill programs where tighter targets elevate the value of measurement and steering precision. Operator focus on reducing drilling time and minimizing rework supports sustained demand in production-led projects.
By Technology Insights
Measurement While Drilling accounted for the largest share of 31.4% in 2025. MWD leads because real-time inclination, azimuth, and toolface information supports immediate corrective action and tighter trajectory control. Strong adoption aligns with drilling programs that prioritize consistency and reduced non-productive time. Higher data availability also supports more standardized decision-making across multi-well campaigns.
By Contract Model Insights
Contract model leadership varies by operator procurement strategy, project complexity, and risk allocation preferences. Integrated services are often selected when accountability across tools, telemetry, and interpretation teams is critical to well delivery performance. Stand-alone drilling services remain common where operators seek flexibility in tool selection and maintain internal oversight of directional planning and execution.
Directional Drilling Services Market Drivers
Rising complexity of well trajectories and longer laterals
Directional drilling demand increases as operators pursue longer laterals and more complex well paths to improve reservoir exposure. Complex trajectories require tighter wellbore placement and higher steering precision across varied formations. Measurement-intensive workflows support faster correction during drilling and reduce costly rework. Standardized execution across multi-well programs also increases reliance on consistent directional service capability.
Focus on drilling efficiency and reduced non-productive time
Operators prioritize well delivery performance because small improvements in drilling time can materially affect total well cost. Directional services support efficiency through better trajectory control, reduced slide time, and fewer corrective runs. Real-time downhole measurement enables earlier detection of deviations and quicker course correction. Performance-based procurement reinforces demand for proven execution quality and reliability.
Expansion of upstream development programs in key regions
Upstream development programs sustain demand for directional services through development drilling, infill wells, and redevelopment of mature assets. High-volume drilling environments reward repeatability, tool uptime, and consistent interpretation workflows. Directional capability remains essential to deliver wells to target and to maintain wellbore quality for completions. Regional investment cycles continue to translate into steady service utilization.
- For instance, Baker Hughes reported that, in an offshore development well for Equinor, its i-Trak automated directional drilling service landed the 8 1/2-in. section within 1.15 m and the 12 1/4-in. section within 2 m of the planned well path while delivering smooth well paths with low dogleg severity.
Technology adoption supporting better placement and decision-making
Advanced downhole measurement and steering solutions enable more precise well placement and improved drilling consistency. Higher-quality data supports better decision-making during drilling and reduces uncertainty in complex sections. Digital workflows help standardize operations across rigs and crews, improving repeatability. Technology-forward service offerings can differentiate suppliers in competitive tenders focused on performance outcomes.
- For instance, SLB reported that Sinopec used the PowerDrive Archer high-build-rate RSS with near-bit gamma-ray imaging to drill a total of 2,790 m within a pay zone only 2 to 3 m thick, achieving 100% placement accuracy across two laterals in the Dingye field in China.
Directional Drilling Services Market Challenges
Directional projects face operational risk from tool reliability constraints, harsh downhole conditions, and formation variability that can degrade performance. Longer laterals can amplify friction, torque, and trajectory control challenges, increasing the risk of delays. Service delivery also requires high-skill crews and consistent interpretation quality, creating staffing and training pressure. Procurement decisions can remain price-sensitive, compressing margins when operators prioritize short-term well costs.
Integration and interoperability constraints can slow adoption of advanced measurement and steering packages across mixed fleets. Data flow and decision workflows require alignment across rig systems, service tools, and operational teams. Logistical complexity rises in remote locations where equipment movement and maintenance support are constrained. Project planning can be affected by permitting, environmental constraints, and schedule volatility, especially for infrastructure-linked applications.
- For instance, Halliburton’s EarthStar ultra-deep resistivity service can detect formation boundaries and fluid contacts at distances of up to 225 ft from the wellbore, but capturing the full operational value of that capability depends on seamless integration between downhole measurements, surface systems, and geosteering teams.
Directional Drilling Services Market Trends and Opportunities
Increased use of automation and data-driven drilling workflows is creating opportunities for service providers with integrated measurement, steering, and interpretation capabilities. Real-time decision support can help standardize execution across multi-well programs and reduce variability. Providers that package directional services with measurement and evaluation workflows can improve accountability and performance outcomes. Technology upgrades that enhance data quality and reliability can support premium positioning.
- For instance, SLB reported that in an offshore Brazil project its autonomous directional drilling and rig automation suite drilled a 2,695.5-m section with more than 95% autonomous control, increased rate of penetration by more than 60%, achieved an instant ROP of 80 m/h, drilled 1,100 m in 24 hours, and held the wellbore to 1.58 m center-to-center from the planned trajectory.
Infrastructure and trenchless projects continue to create opportunities for service demand beyond upstream drilling cycles. Pipeline crossings and utility installations often require controlled drilling paths to reduce surface disruption and permitting friction. Urban densification and right-of-way constraints support continued utilization of trenchless directional methods. Service providers that optimize planning, execution, and risk management can expand participation in non-upstream applications.
Regional Insights
North America
North America led with a 30.6% revenue share in 2025. Regional demand is supported by sustained onshore drilling activity, performance-driven procurement, and continued use of advanced measurement and steering workflows. High-intensity drilling programs require repeatable execution and consistent well placement quality. Service providers compete on reliability, tool uptime, and measurable drilling performance improvements.
Europe
Europe accounted for 12.4% of market revenue in 2025. Regional demand is supported by offshore and onshore programs that require high placement accuracy and strong operational risk management. Operational standards and compliance requirements can raise the value of reliable service delivery and strong technical support. Activity levels remain sensitive to upstream investment cycles and project economics.
Asia Pacific
Asia Pacific represented 24.8% of revenue in 2025. Regional demand is driven by expanding upstream development and the need for efficient well delivery in varied geologies. Directional services support more complex drilling programs as operators pursue higher reservoir contact and improved placement. Supplier differentiation often centers on technical capability, reliability, and the ability to scale across multiple projects.
Latin America
Latin America held 11.7% of market revenue in 2025. Regional demand benefits from development programs that require consistent execution quality and strong service logistics. Project delivery can be shaped by operational constraints and infrastructure factors that elevate the value of planning discipline. Service providers with strong local support and reliable equipment availability can sustain competitive positioning.
Middle East & Africa
Middle East & Africa accounted for 20.5% of revenue in 2025. Regional activity is supported by continued upstream development and the need for efficient drilling delivery in large-scale programs. Directional services remain important for placing wells accurately and supporting development and redevelopment plans. Procurement can emphasize reliability, technical capability, and long-term service support aligned with campaign execution.
Competitive Landscape
Competition is shaped by technology depth, operational reliability, and the ability to bundle measurement, steering, and interpretation workflows into accountable service delivery. Providers differentiate through tool performance, data quality, and the capability to execute complex trajectories under tight cost and schedule constraints. Service portfolios that support both high-volume onshore programs and complex offshore drilling can improve resilience across cycles. Execution consistency and downhole tool uptime remain central differentiators in operator evaluations.
Schlumberger is positioned around broad oilfield service integration, leveraging directional drilling expertise alongside measurement and evaluation capabilities that support well placement and drilling performance objectives. Schlumberger’s scale supports multi-basin deployment, technical standardization, and consistent operational support across projects. The company’s competitive approach often centers on integrated workflows that connect downhole data to faster decisions during drilling. Strong field execution and tool reliability support differentiation in performance-focused tenders.
The industry research and growth report includes detailed analyses of the competitive landscape of the market and information about key companies, including:
- Schlumberger
- Halliburton
- Baker Hughes
- Weatherford
- Nabors Industries
- Patterson-UTI Energy
- Helmerich & Payne
- Transocean
- Saipem
- China Oilfield Services
Qualitative and quantitative analysis of companies has been conducted to help clients understand the wider business environment as well as the strengths and weaknesses of key industry players. Data is qualitatively analyzed to categorize companies as pure play, category-focused, industry-focused, and diversified; it is quantitatively analyzed to categorize companies as dominant, leading, strong, tentative, and weak.
Recent Developments
- In March 2026, ACT Energy Technologies announced an agreement to acquire the directional drilling services business of SB Directional Services for USD 47.0 million, a move aimed at strengthening ACT’s U.S. footprint in key basins such as Anadarko and Permian. In April 1, 2026, the transaction was reported as completed, formally adding SB’s directional drilling operations to ACT Energy Technologies’ portfolio.
- In March 2026, Halliburton announced its acquisition of Sekal AS from Sumitomo Corporation to expand its drilling automation and digital well construction capabilities. The deal combines Halliburton’s LOGIX automation and remote operations platform with Sekal’s DrillTronics automation technology, reinforcing Halliburton’s position in advanced directional and automated drilling services.
- In March 2025, Nabors Industries closed its acquisition of Parker Wellbore, expanding its drilling and related value-added service capabilities. Nabors said the acquisition strengthens its Nabors Drilling Solutions business, broadens market reach, and is expected to generate recurring synergies by the end of 2025
Report Scope
| Report Attribute | Details |
| Market size value in 2025 | USD 31,250.70 million |
| Revenue forecast in 2032 | USD 44,783.30 million |
| Growth rate (CAGR) | 6.18% (2025–2032) |
| Base year | 2025 |
| Forecast period | 2026-2032 |
| Quantitative units | USD million |
| Segments covered | By Service Type Outlook: Horizontal Directional Drilling, Extended Reach Drilling, Multilateral Drilling, Others; By Well Type Outlook: Onshore Wells, Offshore Wells, Shale Wells, Others; By Application Outlook: Oil & Gas Production, Pipeline Installation, Utility Installation, Others; By Technology Outlook: Rotary Steerable Systems, Measurement While Drilling, Logging While Drilling, Others; By Contract Model Outlook: Integrated Services, Standalone Drilling Services, Others |
| Regional scope | North America, Europe, Asia Pacific, Latin America, Middle East & Africa |
| Key companies profiled | Schlumberger; Halliburton; Baker Hughes; Weatherford; Nabors Industries; Patterson-UTI Energy; Helmerich & Payne; Transocean; Saipem; China Oilfield Services |
| No. of Pages | 338 |
Segmentation
By Service Type
- Horizontal Directional Drilling
- Extended Reach Drilling
- Multilateral Drilling
- Others
By Well Type
- Onshore Wells
- Offshore Wells
- Shale Wells
- Others
By Application
- Oil & Gas Production
- Pipeline Installation
- Utility Installation
- Others
By Technology
- Rotary Steerable Systems
- Measurement While Drilling
- Logging While Drilling
- Others
By Contract Model
- Integrated Services
- Standalone Drilling Services
- Others
By Region
- North America
- U.S.
- Canada
- Mexico
- Europe
- Germany
- France
- U.K.
- Italy
- Spain
- Rest of Europe
- Asia Pacific
- China
- Japan
- India
- South Korea
- South-east Asia
- Rest of Asia Pacific
- Latin America
- Brazil
- Argentina
- Rest of Latin America
- Middle East & Africa
- GCC Countries
- South Africa
- Rest of the Middle East and Africa
Request a Free Sample
Fill in your details and we'll send you a free sample report.
- Sample data tables & charts
- Research methodology
Need a Custom Version of This Report?
Tailor the scope, geography, or segments to your exact requirements.
- Custom geography or segment scope
- Direct access to our analyst team
Frequently Asked Questions
What is the market size of the Directional Drilling Services Market in 2025 and its forecast for 2032?
What is the CAGR for the Directional Drilling Services Market during 2025–2032?
What is the largest segment in the Directional Drilling Services Market?
What factors are driving growth in the Directional Drilling Services Market?
Who are the leading companies in the Directional Drilling Services Market?
Which region leads the Directional Drilling Services Market?
Table of Content
Chapter 1. Report Introduction
- 1.1 Report Description & Purpose
- 1.1.1 Report Title & Market Definition
- 1.1.2 Unique Selling Propositions (USP) & Key Differentiators
- 1.1.3 Value Proposition for Stakeholders
- 1.2 Research Objectives
- 1.2.1 Market Sizing Objectives (Volume & Revenue)
- 1.2.2 Segmentation Objectives
- 1.2.3 Competitive Intelligence Objectives
- 1.2.4 Forecast & Scenario Objectives
- 1.3 Report Scope
- 1.3.1 Directional Drilling Services Scope – Types & Subtypes Covered
- 1.3.2 Geographic Scope – Regions & Countries Covered
- 1.3.3 Historical Period, Base Year & Forecast Period (2025; forecast to 2032)
- 1.3.4 Inclusions & Exclusions
- 1.4 HS Code & Classification Framework
- 1.5 Currency, Units & Pricing Basis
- 1.6 Target Stakeholders
- 1.7 Limitations & Assumptions
Chapter 2. Executive Summary
- 2.1 Global Directional Drilling Services Market Snapshot
- 2.1.1 Market Size – Historical (2025) & Forecast (2025-2032) (2025: USD 31,250.70 million → 2032: USD 44,783.30 million)
- 2.1.2 Volume & Revenue – Global Totals
- 2.1.3 Key Market Highlights – Top Five Facts
- 2.2 Directional Drilling Services Market Segmentation Snapshot
- 2.2.1 Market Split by Region – 2025 vs. 2032
- 2.3 Competitive Snapshot
- 2.3.1 Top 10 Players by Revenue Share – 2025
- 2.3.2 Top 10 Players by Volume Share – 2025
- 2.3.3 Recent Strategic Developments (18-Month Summary)
- 2.4 Key Investment Highlights & Strategic Conclusions
Chapter 3. Directional Drilling Services Market Dynamics & Industry Analysis
- 3.1 Market Overview & Context
- 3.1.1 Directional Drilling Services Market Position in the Broader Automotive Value Chain
- 3.1.2 OEM vs. Replacement Market Dynamics
- 3.1.3 Market Maturity & Development Stage by Region
- 3.2 Directional Drilling Services Market Drivers
- 3.3 Directional Drilling Services Market Restraints & Challenges
- 3.4 Directional Drilling Services Market Opportunities
- 3.5 Porter's Five Forces Analysis
- 3.5.1 Threat of New Entrants
- 3.5.2 Bargaining Power of Suppliers
- 3.5.3 Bargaining Power of Buyers
- 3.5.4 Threat of Substitutes
- 3.5.5 Competitive Rivalry – Intensity Assessment
- 3.6 Directional Drilling Services Value Chain Analysis
- 3.6.1 Upstream – Raw Material/Input Suppliers
- 3.6.1.1 Raw Material/Input 1
- 3.6.1.2 Raw Material/Input 2
- 3.6.1.3 Raw Material/Input 3
- 3.6.2 Midstream – Production/Manufacturing/Service Delivery
- 3.6.2.1 Production/Process Overview
- 3.6.2.2 Key Facility Locations & Capacity by Manufacturer
- 3.6.3 Downstream – Distribution & End Consumer
- 3.6.3.1 Primary Channel – B2B/OEM
- 3.6.3.2 Secondary Channels – Dealer, Retail, Online, Direct
- 3.6.4 Value Chain Profitability Analysis
- 3.6.1 Upstream – Raw Material/Input Suppliers
- 3.7 PESTEL Analysis
- 3.7.1 Political Factors
- 3.7.2 Economic Factors
- 3.7.3 Social Factors
- 3.7.4 Technological Factors
- 3.7.5 Environmental Factors
- 3.7.6 Legal Factors
- 3.8 Directional Drilling Services Supply Chain Analysis
- 3.8.1 Raw Material/Input Supply Risk Assessment
- 3.8.2 Manufacturing Concentration Risk (Geographic Exposure)
- 3.8.3 Trade Disruption Impact Analysis
- 3.9 Regulatory & Policy Landscape
Note: The regulatory and policy landscape section covers regulations based on their applicability to the market, Directional Drilling Services category, geography, and scope of the study. Only regulatory frameworks with a material impact on operations, compliance, trade, sustainability, or market access are analyzed in detail.
Chapter 4. Key Investment Pockets & Opportunity Analysis
- 4.1 Directional Drilling Services Market Attractiveness Analysis
- 4.1.1 By Region – Investment Attractiveness Matrix (Volume × CAGR)
- 4.2 Absolute Revenue Growth Opportunity
- 4.2.1 By Region – Absolute USD Growth Through 2032
- 4.3 Incremental Volume Opportunity
- 4.3.1 By Region – Incremental Volume Through 2032
- 4.3.2 Segment – Incremental Volume
- 4.4 Emerging Submarket Opportunity Deep Dive (Subject to Applicability)
- 4.5 Emerging Market Opportunity Scorecards
- 4.5.1 United States
- 4.5.2 Europe
- 4.5.3 Asia
- 4.5.4 Middle East & Africa
Note: Emerging Market Opportunity Scorecards will be included based on relevance and strategic importance. Regions listed are indicative and may vary depending on data availability and market dynamics.
Chapter 5. Directional Drilling Services Import-Export Analysis & Trade Flows
- 5.1 Global Trade Overview
- 5.1.1 Global Export Value by Country (2025)
- 5.1.2 Global Export Volume by Country (2025)
- 5.1.3 Global Import Value by Country (2025)
- 5.1.4 Global Import Volume by Country (2025)
- 5.1.5 Net Trade Balance by Country (2025)
- 5.2 Export Analysis – Segment
- 5.2.1 Type 1 (HS Code)
- 5.2.2 Type 2 (HS Code)
- 5.2.3 Type 3 (HS Code)
- 5.2.4 Type 4 (HS Code)
- 5.2.5 Type 5 (HS Code)
- 5.3 Import Analysis – Segment
- 5.3.1 Type 1 (HS Code)
- 5.3.2 Type 2 (HS Code)
- 5.3.3 Type 3 (HS Code)
- 5.3.4 Type 4 (HS Code)
- 5.3.5 Type 5 (HS Code)
- 5.4 Average Unit Trade Prices
- 5.4.1 Average Export Price – Segment & Country
- 5.4.2 Average Import Price – Segment & Source Country
- 5.4.3 Price Trends (2025)
- 5.5 Key Trade Route Analysis
- 5.5.1 Trade Route 1
- 5.5.2 Trade Route 2
- 5.5.3 Trade Route 3
- 5.5.4 Trade Route 4
- 5.5.5 Trade Route 5
- 5.6 Trade Policy Impact Assessment
- 5.6.1 US Anti-Dumping & Section 301 Tariffs
- 5.6.2 EU Customs Union Impact
- 5.6.3 Major Free Trade Agreements
- 5.6.4 USMCA Rules of Origin
Note: Trade policy analysis will be included only where relevant to the Directional Drilling Services market.
Chapter 6. Competitive Landscape & Company Benchmarking
- 6.1 Directional Drilling Services Market Concentration & Structure
- 6.1.1 Herfindahl-Hirschman Index (HHI) – vs. 2025
- 6.1.2 Tier 1, Tier 2 & Tier 3 Market Structure
- 6.1.3 Global, Regional & Local Player Dynamics
- 6.2 Directional Drilling Services Market Share Analysis – 2025
- 6.2.1 Global Revenue Share by Company
- 6.2.2 Global Volume Share by Company
- 6.2.3 Regional Revenue Share
- 6.2.4 Market Share Evolution ( vs. 2025)
- 6.2.5 OEM Segment Share by Company
- 6.2.6 Replacement Segment Share by Company
- 6.3 Production/Delivery Capacity & Facility Analysis
- 6.3.1 Global Installed Capacity
- 6.3.2 Capacity Utilization Rates
- 6.3.3 Production/Output Volume
- 6.3.4 Facility Locations & Capacity Map
- 6.3.5 Planned Capacity Additions
- 6.4 Directional Drilling Services Competitive Benchmarking Matrix
- 6.4.1 Revenue, Volume, CAGR & Profitability Comparison
- 6.4.2 Channel Revenue Mix
- 6.4.3 Geographic Revenue Exposure
- 6.4.4 R&D Intensity
- 6.4.5 Sustainability Maturity
- 6.5 Strategic Developments in Directional Drilling Services (Last 24 Months)
- 6.5.1 Mergers, Acquisitions & Divestments
- 6.5.2 New Directional Drilling Services Launches
- 6.5.3 Facility Expansions
- 6.5.4 Strategic Alliances, Joint Ventures & Partnerships
- 6.5.5 Distribution Expansion & Market Entry
- 6.5.6 Sustainability & ESG Initiatives
- 6.6 Competitive Strategy Mapping
- 6.6.1 Leader, Challenger, Follower & Niche Classification
- 6.6.2 Pricing Strategy Comparison
- 6.6.3 Channel Strategy Matrix
Note: Strategic developments are included based on their materiality and the availability of reliable information.
Chapter 7. Global Directional Drilling Services Market – By Distribution Channel
- 7.1 Segment Overview
- 7.1.1 Volume & Revenue Split by Channel (2025 & 2032)
- 7.1.2 Channel Mix Evolution (2025-2032)
Chapter 8. Regional Market Analysis – Global Overview
- 8.1 Global Regional Overview
- 8.1.1 Regional Volume Share
- 8.1.2 Regional Revenue Share
- 8.1.3 Regional Volume by Region
- 8.1.4 Regional Revenue by Region
- 8.1.5 Regional Forecast Through 2032
- 8.2 Cross-Regional Segment Analysis
- 8.2.1 By Distribution Channel
- 8.2.2 By Brand/Price Tier
Chapter 9. North America Directional Drilling Services Market
- 9.1 United States
- 9.2 Canada
- 9.3 Mexico
Chapter 10. Europe Directional Drilling Services Market
- 10.1 Germany
- 10.2 France
- 10.3 Italy
- 10.4 United Kingdom
- 10.5 Spain
- 10.6 Poland
- 10.7 Russia
- 10.8 Netherlands
- 10.9 Belgium
- 10.10 Sweden
- 10.11 Denmark
- 10.12 Norway
- 10.13 Rest of Europe
Chapter 11. Asia Pacific Directional Drilling Services Market
- 11.1 China
- 11.2 India
- 11.3 Japan
- 11.4 South Korea
- 11.5 Thailand
- 11.6 Indonesia
- 11.7 Vietnam
- 11.8 Malaysia
- 11.9 Australia
- 11.10 Rest of Asia Pacific
Chapter 12. Latin America Directional Drilling Services Market
- 12.1 Brazil
- 12.2 Argentina
- 12.3 Colombia
- 12.4 Chile
- 12.5 Rest of Latin America
Chapter 13. Middle East Directional Drilling Services Market
- 13.1 Saudi Arabia
- 13.2 United Arab Emirates
- 13.3 Turkey
- 13.4 Israel
- 13.5 Iran
- 13.6 Rest of the Middle East
Chapter 14. Africa Directional Drilling Services Market
- 14.1 South Africa
- 14.2 Egypt
- 14.3 Nigeria
- 14.4 Morocco
- 14.5 Rest of Africa
Chapter 15. Directional Drilling Services Company Profiles
- 15.1 [Company 01]
- 15.1.1 Company Overview
- 15.1.2 Key Management Personnel
- 15.1.3 Products & Services Portfolio
- 15.1.4 Financial Performance
- 15.1.5 Key Market Focus & Geographic Presence
- 15.1.6 Recent Developments & Strategic Initiatives
Note: The company profile list is preliminary and may change based on research findings, market developments, data availability, and client requirements.
Chapter 16. Appendices
- Appendix A – List of Abbreviations & Acronyms
- Appendix B – Industry Classification Code Reference – Full Series
- Appendix C – Production & Capacity Data Tables
- Appendix D – End-Use & Demand Base Tables
- Appendix E – Consumption & Replacement Rate Assumptions
- Appendix F – ASP Reference Tables
- Appendix G – Manufacturing & Facility Database
- Appendix H – Import-Export Data Tables
- Appendix I – Regulatory Summary Tables
- Appendix J – Primary Research Participant List (Anonymized)
- Appendix K – Primary Research Questionnaire Framework
- Appendix L – Data Sources & Bibliography
- Appendix M – Market Size Divergence & Source Comparison
Chapter 17. Research Methodology
- 17.1 Research Framework & Philosophy
- 17.2 Secondary Research – Sources, Hierarchy & Data Extraction
- 17.3 Data Modeling – Bottom-Up & Top-Down Market Sizing
- 17.4 Primary Research – Stakeholder Framework, LOI & Sample Sizes
- 17.5 Forecast Methodology – Regression, Scenario & Sensitivity Analysis
- 17.6 Quality Control – Four-Layer Validation Framework
- 17.7 Limitations & Standard Assumptions
- 17.8 Disclaimer
