
AI-Based 3D Vision System Market: USD 372.4 million in 2025, One of the Fastest-Growing Machine Vision Fields
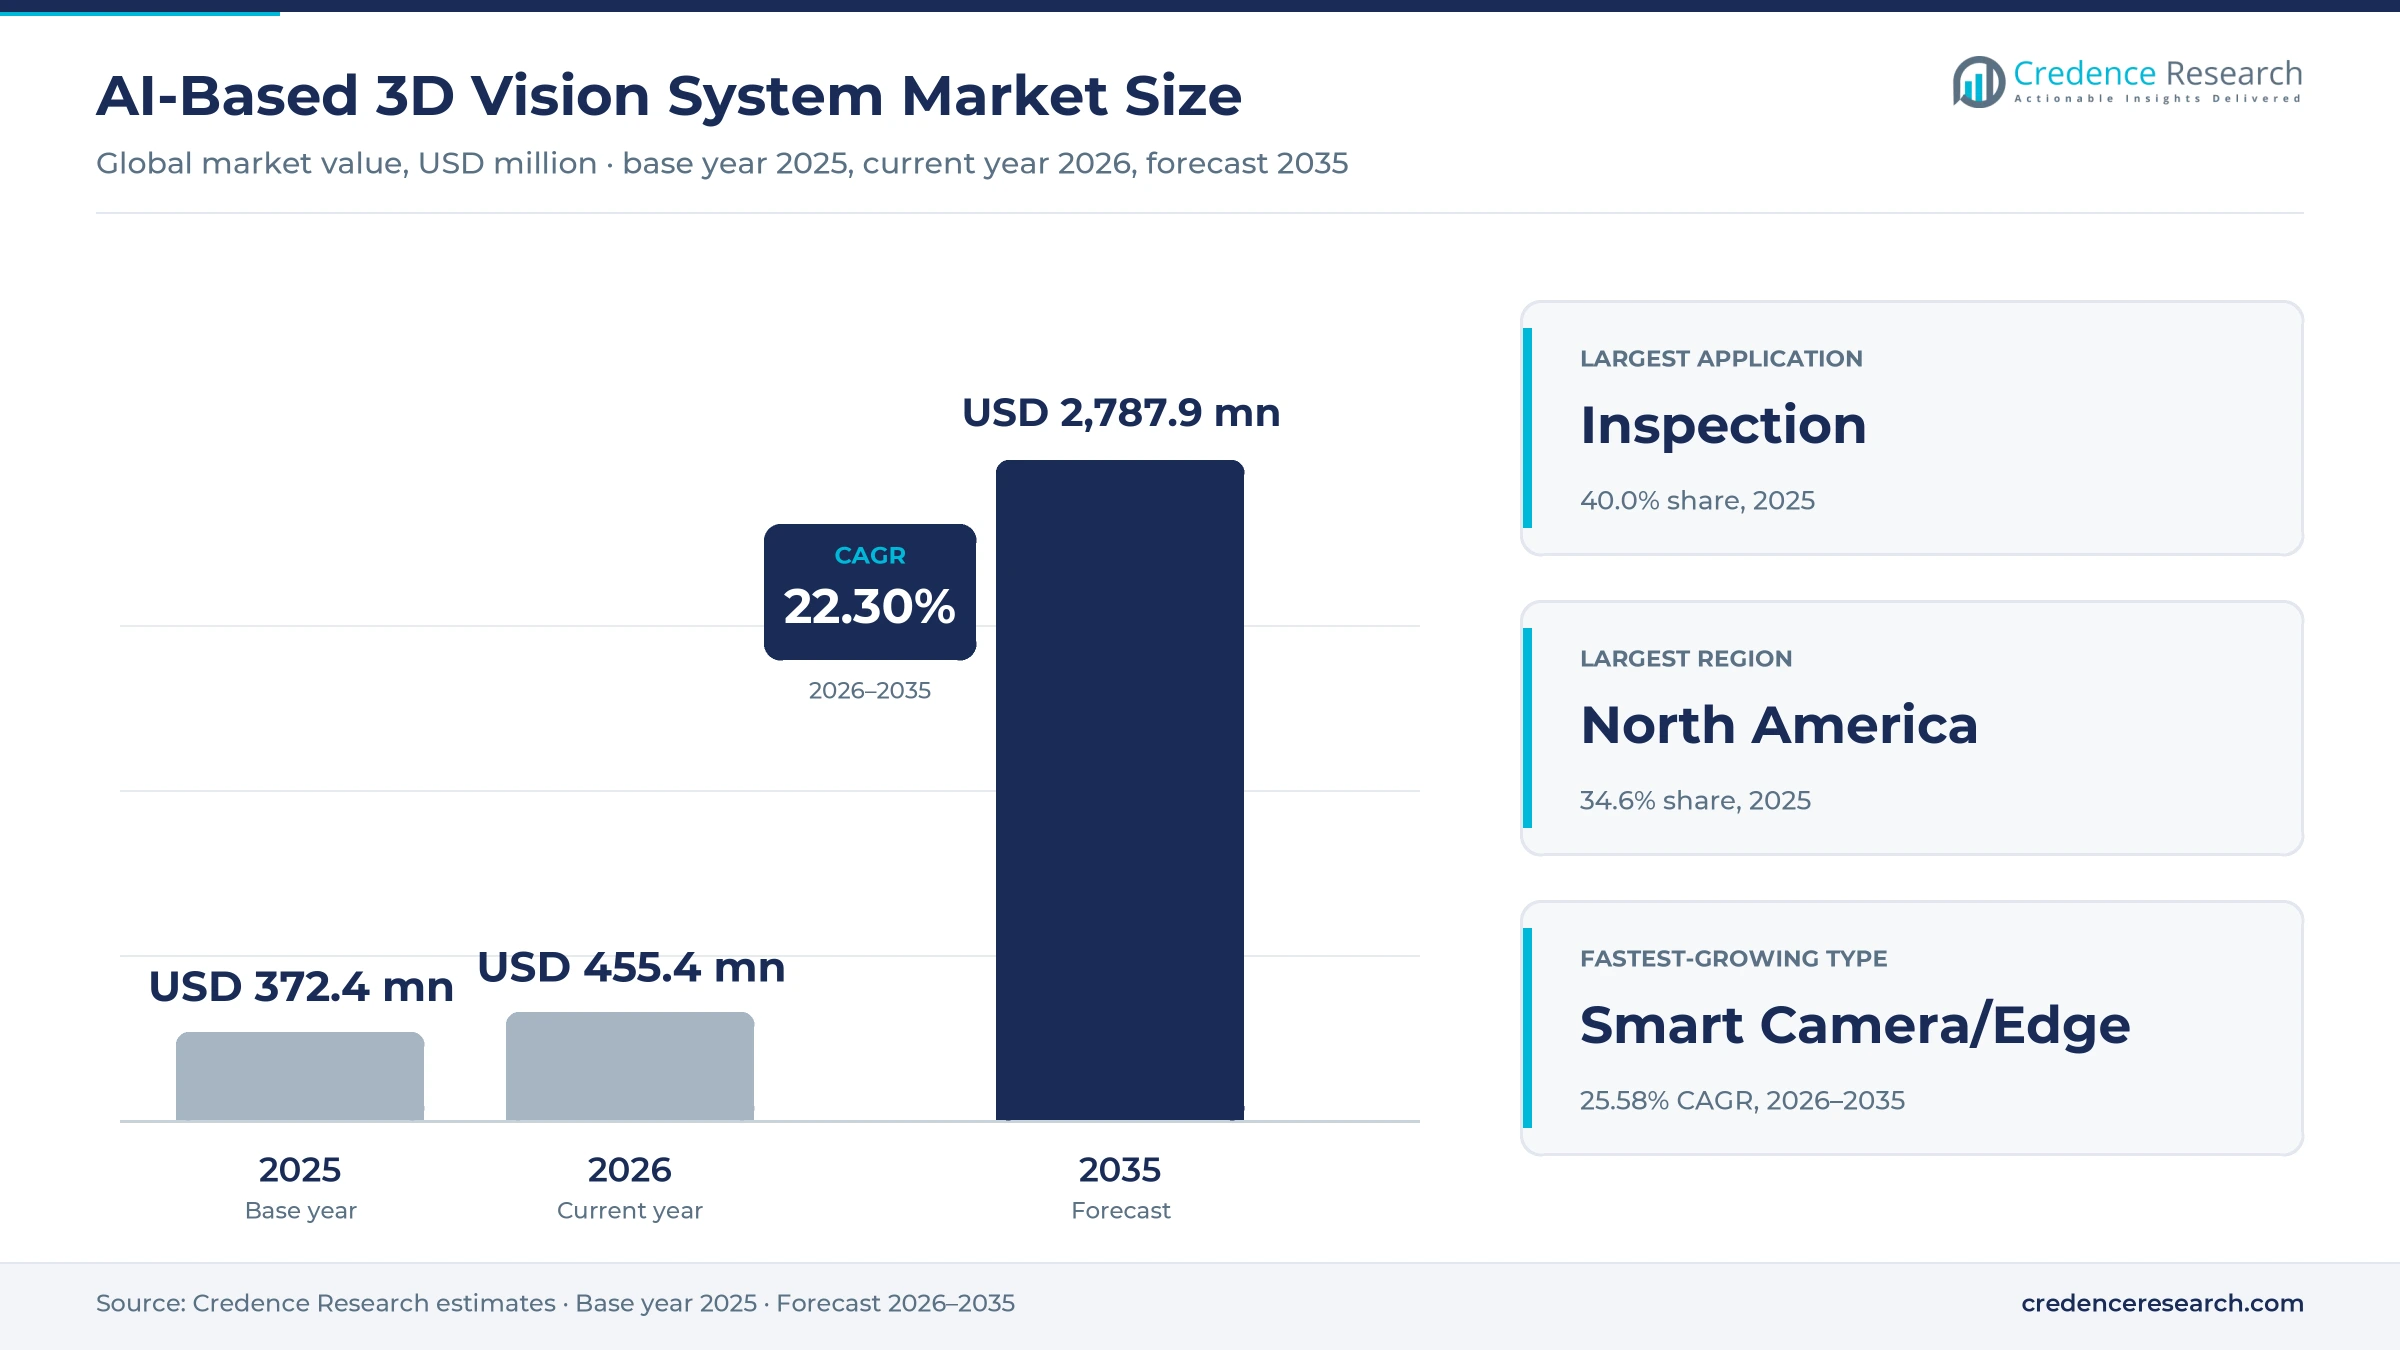
Factories installed 542,000 industrial robots worldwide in 2024, and more of them now see in three dimensions, lifting AI-based 3D vision systems to USD 372.4 million in 2025. Credence Research forecasts USD 2,787.9 million by 2035, a 22.30% CAGR over 2026–2035, with 2026 estimated at USD 455.4 million. Deep learning lets 3D cameras recognize parts, defects and shapes that rule-based vision could not handle reliably.
The market is small compared with all machine vision but grows several times faster, because robots, warehouses and inspection lines increasingly need depth data and AI together.
What does the market cover?
The market covers 3D vision hardware, AI software and services. The scope includes:
- Stereo, time-of-flight, structured-light and laser-triangulation 3D cameras and sensors.
- PC-based systems, smart cameras and other embedded systems running deep learning, pose estimation, 3D reconstruction or sensor fusion.
- Inspection, robot guidance, metrology and navigation uses, with integration, calibration and training services.
The scope excludes 2D-only vision, robots, lidar safety scanners and general-purpose AI chips sold outside vision systems. Values are in USD million at current prices, allocated to the region of the buyer. The wider field is covered in the machine vision market.
How was the estimate built?
All figures are Credence Research estimates, built from 3D camera and smart-camera shipments, the share sold with AI software, robot installations, average system prices and supplier disclosures.
Why are robot numbers a useful indicator?
Robots are the main buyers of 3D guidance. The International Federation of Robotics reported 542,000 installations in 2024 and an operating stock of about 4.66 million robots, more than double installations ten years earlier, according to IFR.
Report Attributes
| Attribute | Details |
|---|---|
| Historical Period | 2018–2024 |
| Base Year | 2025 |
| Forecast Period | 2026–2035 |
| Market Size 2025 | USD 372.4 million |
| Market Size 2026 (estimate) | USD 455.4 million |
| Market Size 2035 (forecast) | USD 2,787.9 million |
| CAGR (2026–2035) | 22.30% |
| Segments Covered | By Component, By Type, By 3D Sensing Technology, By Application, By Industry Vertical, By AI Capability |
| Regions Covered | North America, Europe, Asia Pacific, Latin America, Middle East & Africa |
| Companies Covered | Cognex Corporation, Keyence Corporation, NVIDIA Corporation, Intel Corporation, Basler AG, Teledyne Technologies, SICK AG, OMRON Corporation, LMI Technologies, Microsoft Corporation |
AI Based 3D Vision System Market Insights
- The AI-based 3D vision system market was worth USD 372.4 million in 2025 and is forecast to reach USD 2,787.9 million by 2035, a 22.30% CAGR over 2026–2035.
- Credence Research estimates the market at USD 455.4 million in 2026, the current year.
- Factory automation and robot guidance is the strongest driver, adding about 6.0 percentage points to the forecast CAGR.
- Inspection leads applications with 40.0%; navigation grows fastest at 26.10%.
- Smart camera and edge systems grow fastest by type at 25.58% a year.
- North America is the largest region at 34.6%; Asia Pacific grows fastest at 24.19%.
Hardware for Inspection in Automotive Plants Holds the Largest Share
Which component and type lead?
Hardware leads with a 55.0% share in 2025, mainly 3D cameras and sensors. Software grows fastest at 25.96% a year. PC-based systems lead types with 44.0%, while smart camera and edge systems grow fastest at 25.58%.
Which 3D sensing technology leads?
Stereo vision leads with 30.0% because it handles moving objects and works outdoors. Structured light serves high-accuracy inspection, laser triangulation serves inline profiling, and time-of-flight grows fastest at 25.29%.
Which application leads?
Quality assurance and inspection leads with 40.0%, followed by positioning and guidance, measurement and navigation. Navigation grows fastest at 26.10%.
Which vertical and AI capability lead?
Automotive leads verticals with 27.0%, and postal and logistics grows fastest at 25.59%. Deep-learning detection leads AI capabilities with 46.0%, while sensor fusion grows fastest at 26.59%. Inspection systems are also tracked in the machine vision and inspection system market.
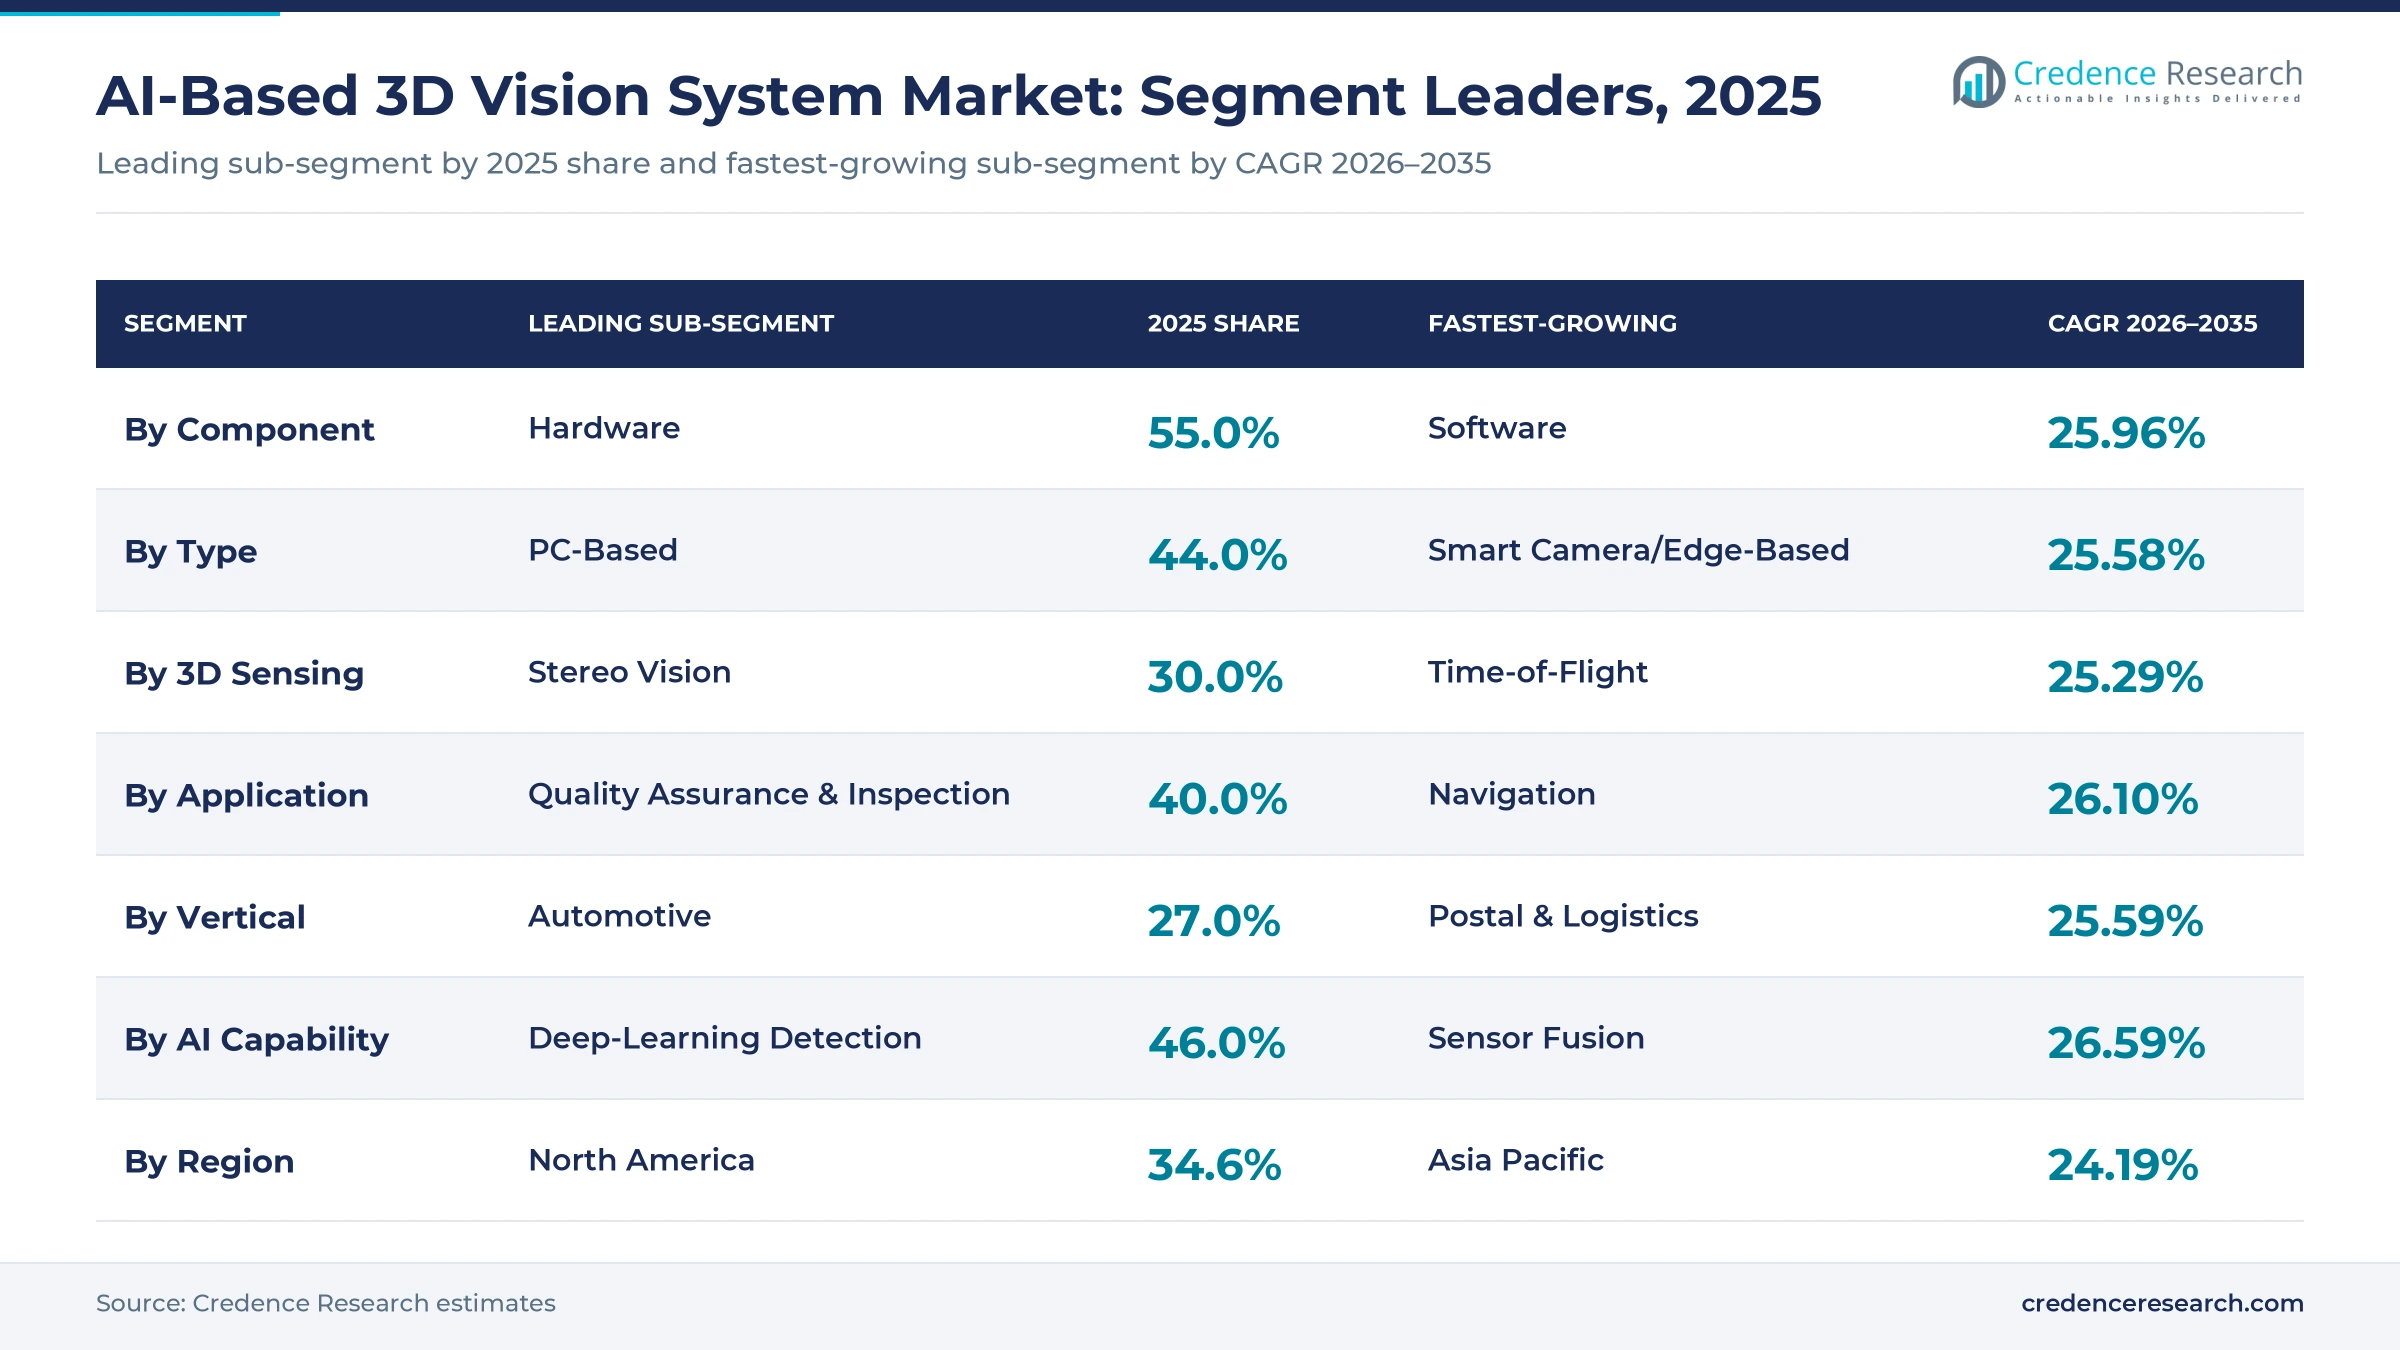
| Segment Group | Leading Sub-segment | 2025 Share | Fastest-growing Sub-segment | CAGR 2026–2035 |
|---|---|---|---|---|
| By Component | Hardware | 55.0% | Software | 25.96% |
| By Type | PC-Based | 44.0% | Smart Camera/Edge-Based | 25.58% |
| By 3D Sensing Technology | Stereo Vision | 30.0% | Time-of-Flight | 25.29% |
| By Application | Quality Assurance & Inspection | 40.0% | Navigation | 26.10% |
| By Industry Vertical | Automotive | 27.0% | Postal & Logistics | 25.59% |
| By AI Capability | Deep-Learning Detection | 46.0% | Sensor Fusion | 26.59% |
Request a Free Sample
Fill in your details and we'll send you a free sample report.
- Sample data tables & charts
- Research methodology
Robot Guidance, AI Inspection and Edge Hardware Drive Growth
Why does robot guidance matter most? (~+6.0% impact on forecast CAGR)
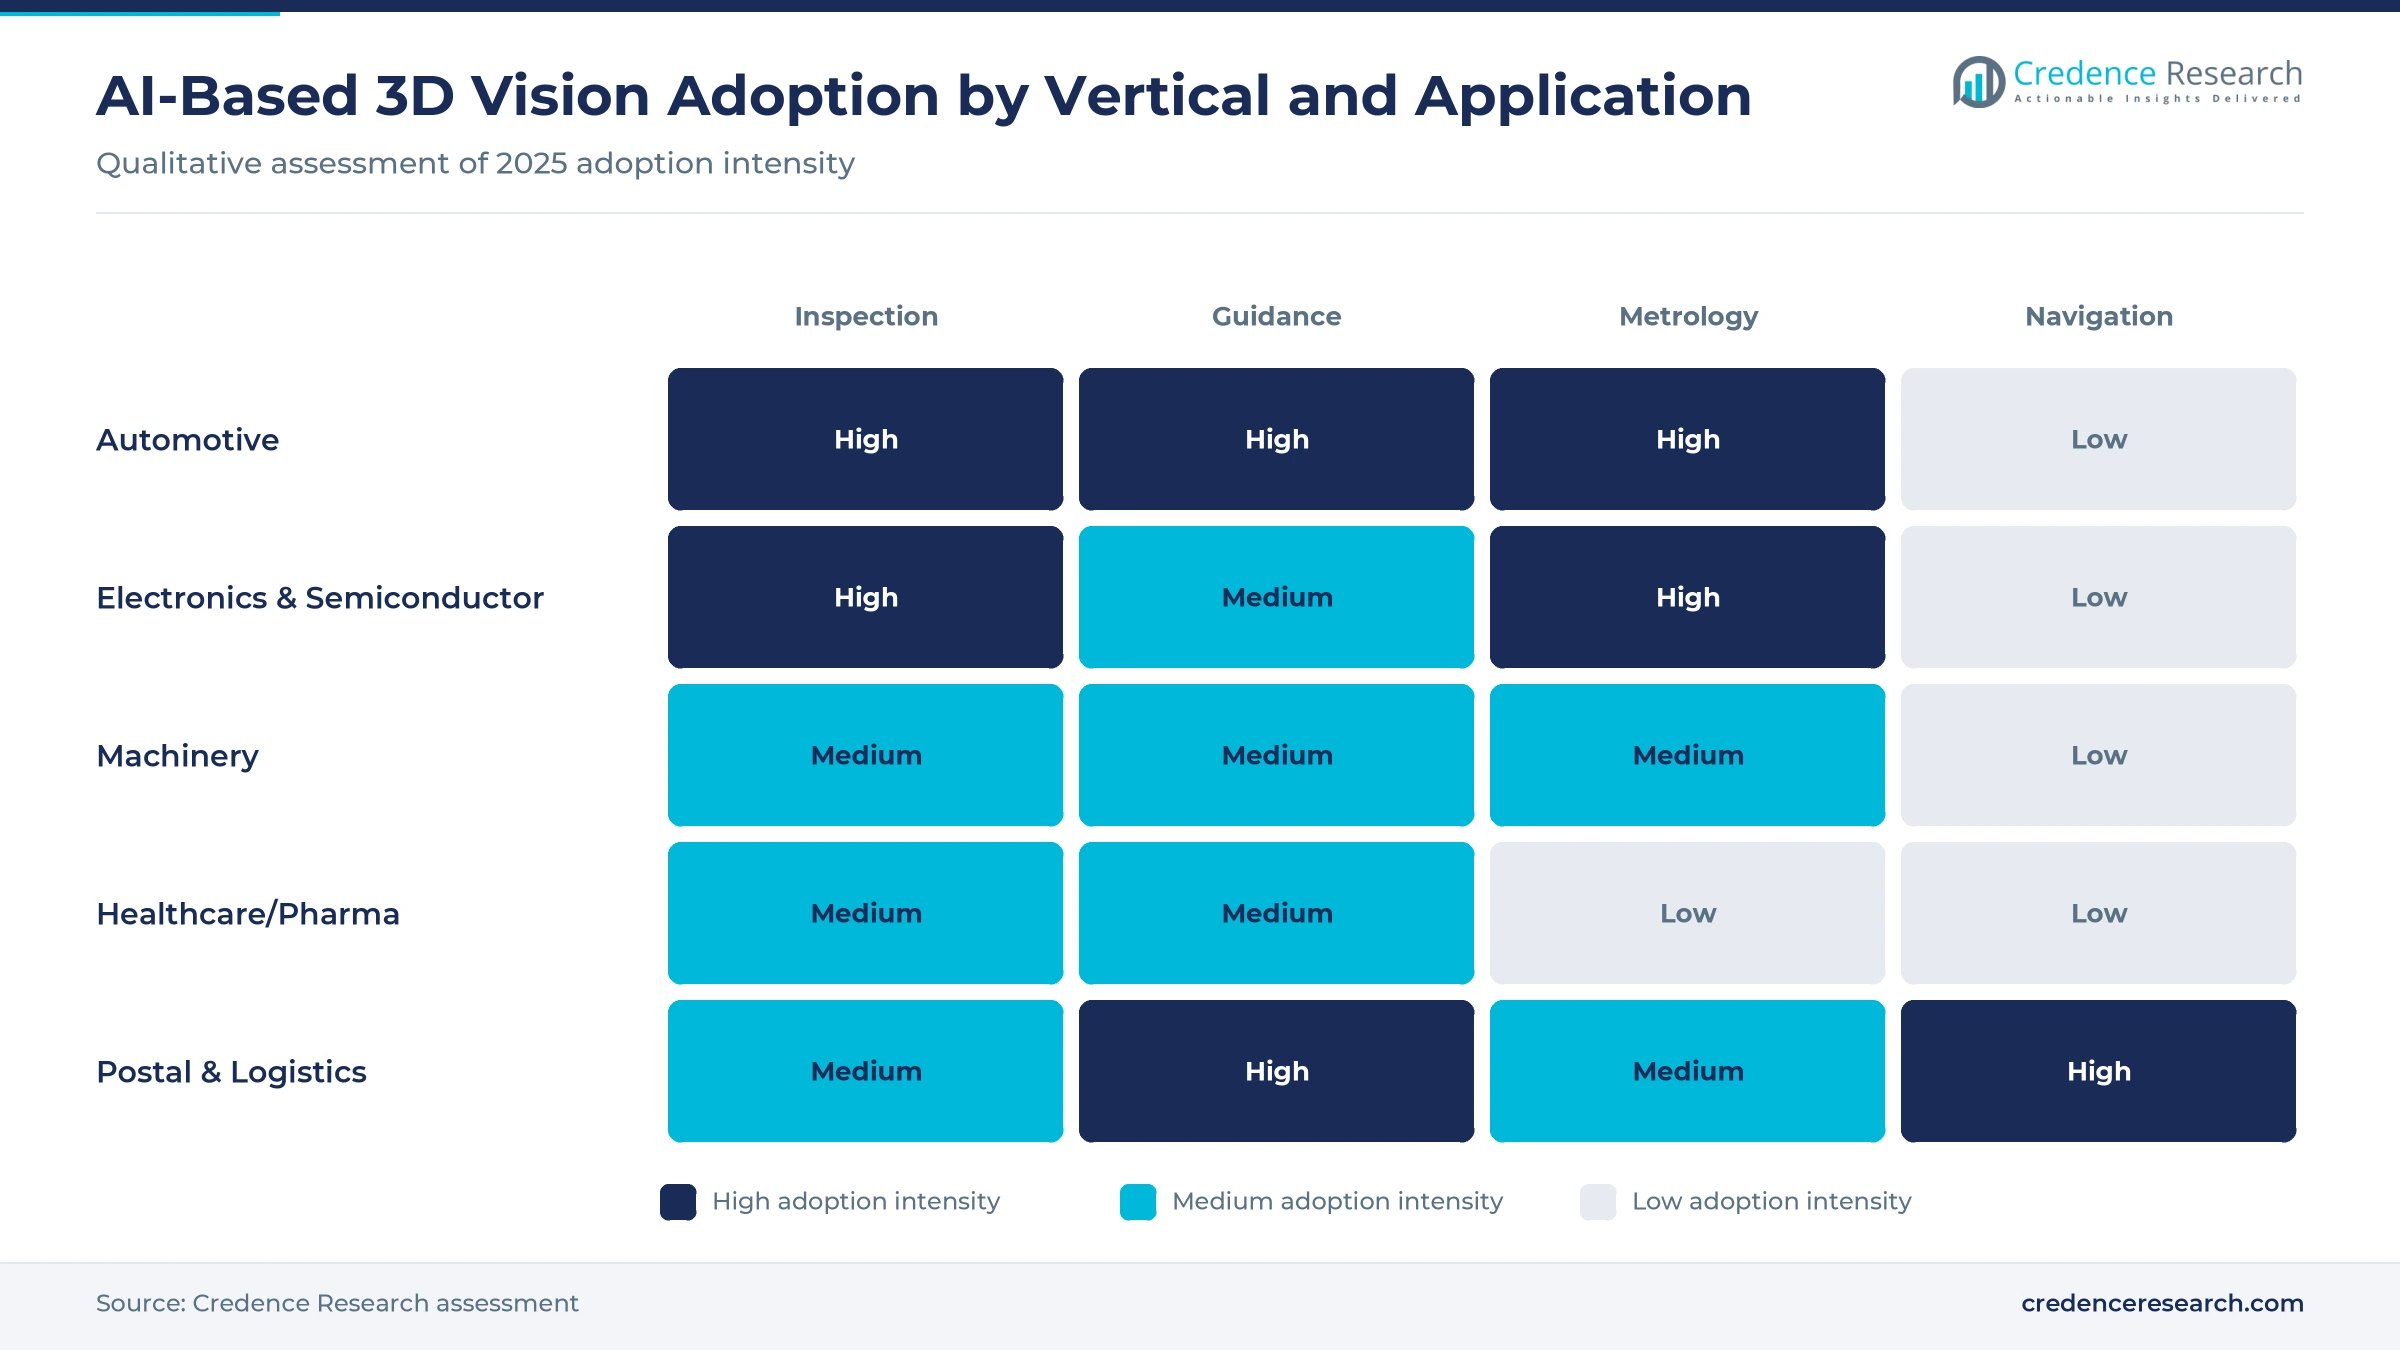
Factory automation and robot guidance that need better spatial awareness are the strongest driver, adding about 6.0 percentage points to the forecast CAGR. Bin picking, depalletizing and assembly require robots to find parts in 3D and grasp them at the right angle, which AI pose estimation makes reliable for mixed and shiny parts. North American robot orders reached 17,995 units in the first half of 2026, with orders from semiconductor and electronics makers up 35% and life sciences up 32%, according to the Association for Advancing Automation. Positioning and guidance is the second-largest application, and pose estimation is one of the faster-growing AI capabilities. The main limit is integration effort for each new part type. Packaged AI-based 3D vision system cells for bin picking and depalletizing reduce this effort, which lets mid-sized plants without vision engineers adopt robot guidance.
How does AI inspection add demand? (~+4.6% impact on forecast CAGR)
AI-enabled quality inspection and metrology that replace manual checks add about 4.6 percentage points to the forecast CAGR. 3D inspection can measure height, flatness and volume, and deep learning can separate real defects from harmless surface variation. Nearly two-thirds of companies in a VDMA survey named AI as a key business driver, as reported by optics.org. Cognex made its OneVision cloud platform for training AI vision models generally available in 2026. Quality assurance and inspection leads applications with a 40.0% share. Electronics makers use 3D checks for solder joints, connector pins and component height, where small errors cause costly failures later in assembly.
Why does edge hardware matter? (~+3.5% impact on forecast CAGR)
Edge AI, smart cameras and faster 3D sensors that lower deployment barriers add about 3.5 percentage points to the forecast CAGR. NVIDIA's Jetson AGX Thor module, available from August 2025, offers up to 2,070 FP4 teraflops at 130 watts, with a developer kit from USD 3,499, according to NVIDIA. Smart camera and edge systems grow fastest by type at 25.58% a year, and software grows fastest by component at 25.96%.
Logistics Vision, Mobile Robots and Cloud Model Training
Trend 1: Is logistics the fastest-growing vertical?
Yes. Postal and logistics grows fastest at 25.59% a year as parcel hubs use 3D vision for singulation, dimensioning and pallet checks. SICK launched a 3D pallet inspection system in 2025, and Cognex added logistics devices.
Trend 2: Are mobile robots adding navigation demand?
Yes. Navigation is the fastest-growing application at 26.10% a year. SICK launched Visionary AI-Assist in September 2025, a stereo 3D camera with an AI chip that detects people around outdoor vehicles.
Trend 3: Is model training moving to the cloud?
Yes. Vendors offer cloud tools that let engineers label images and train models without coding, then deploy them to cameras on the line. This lowers the skill needed to use AI vision.
Trend 4: Is the depth-camera supply base changing?
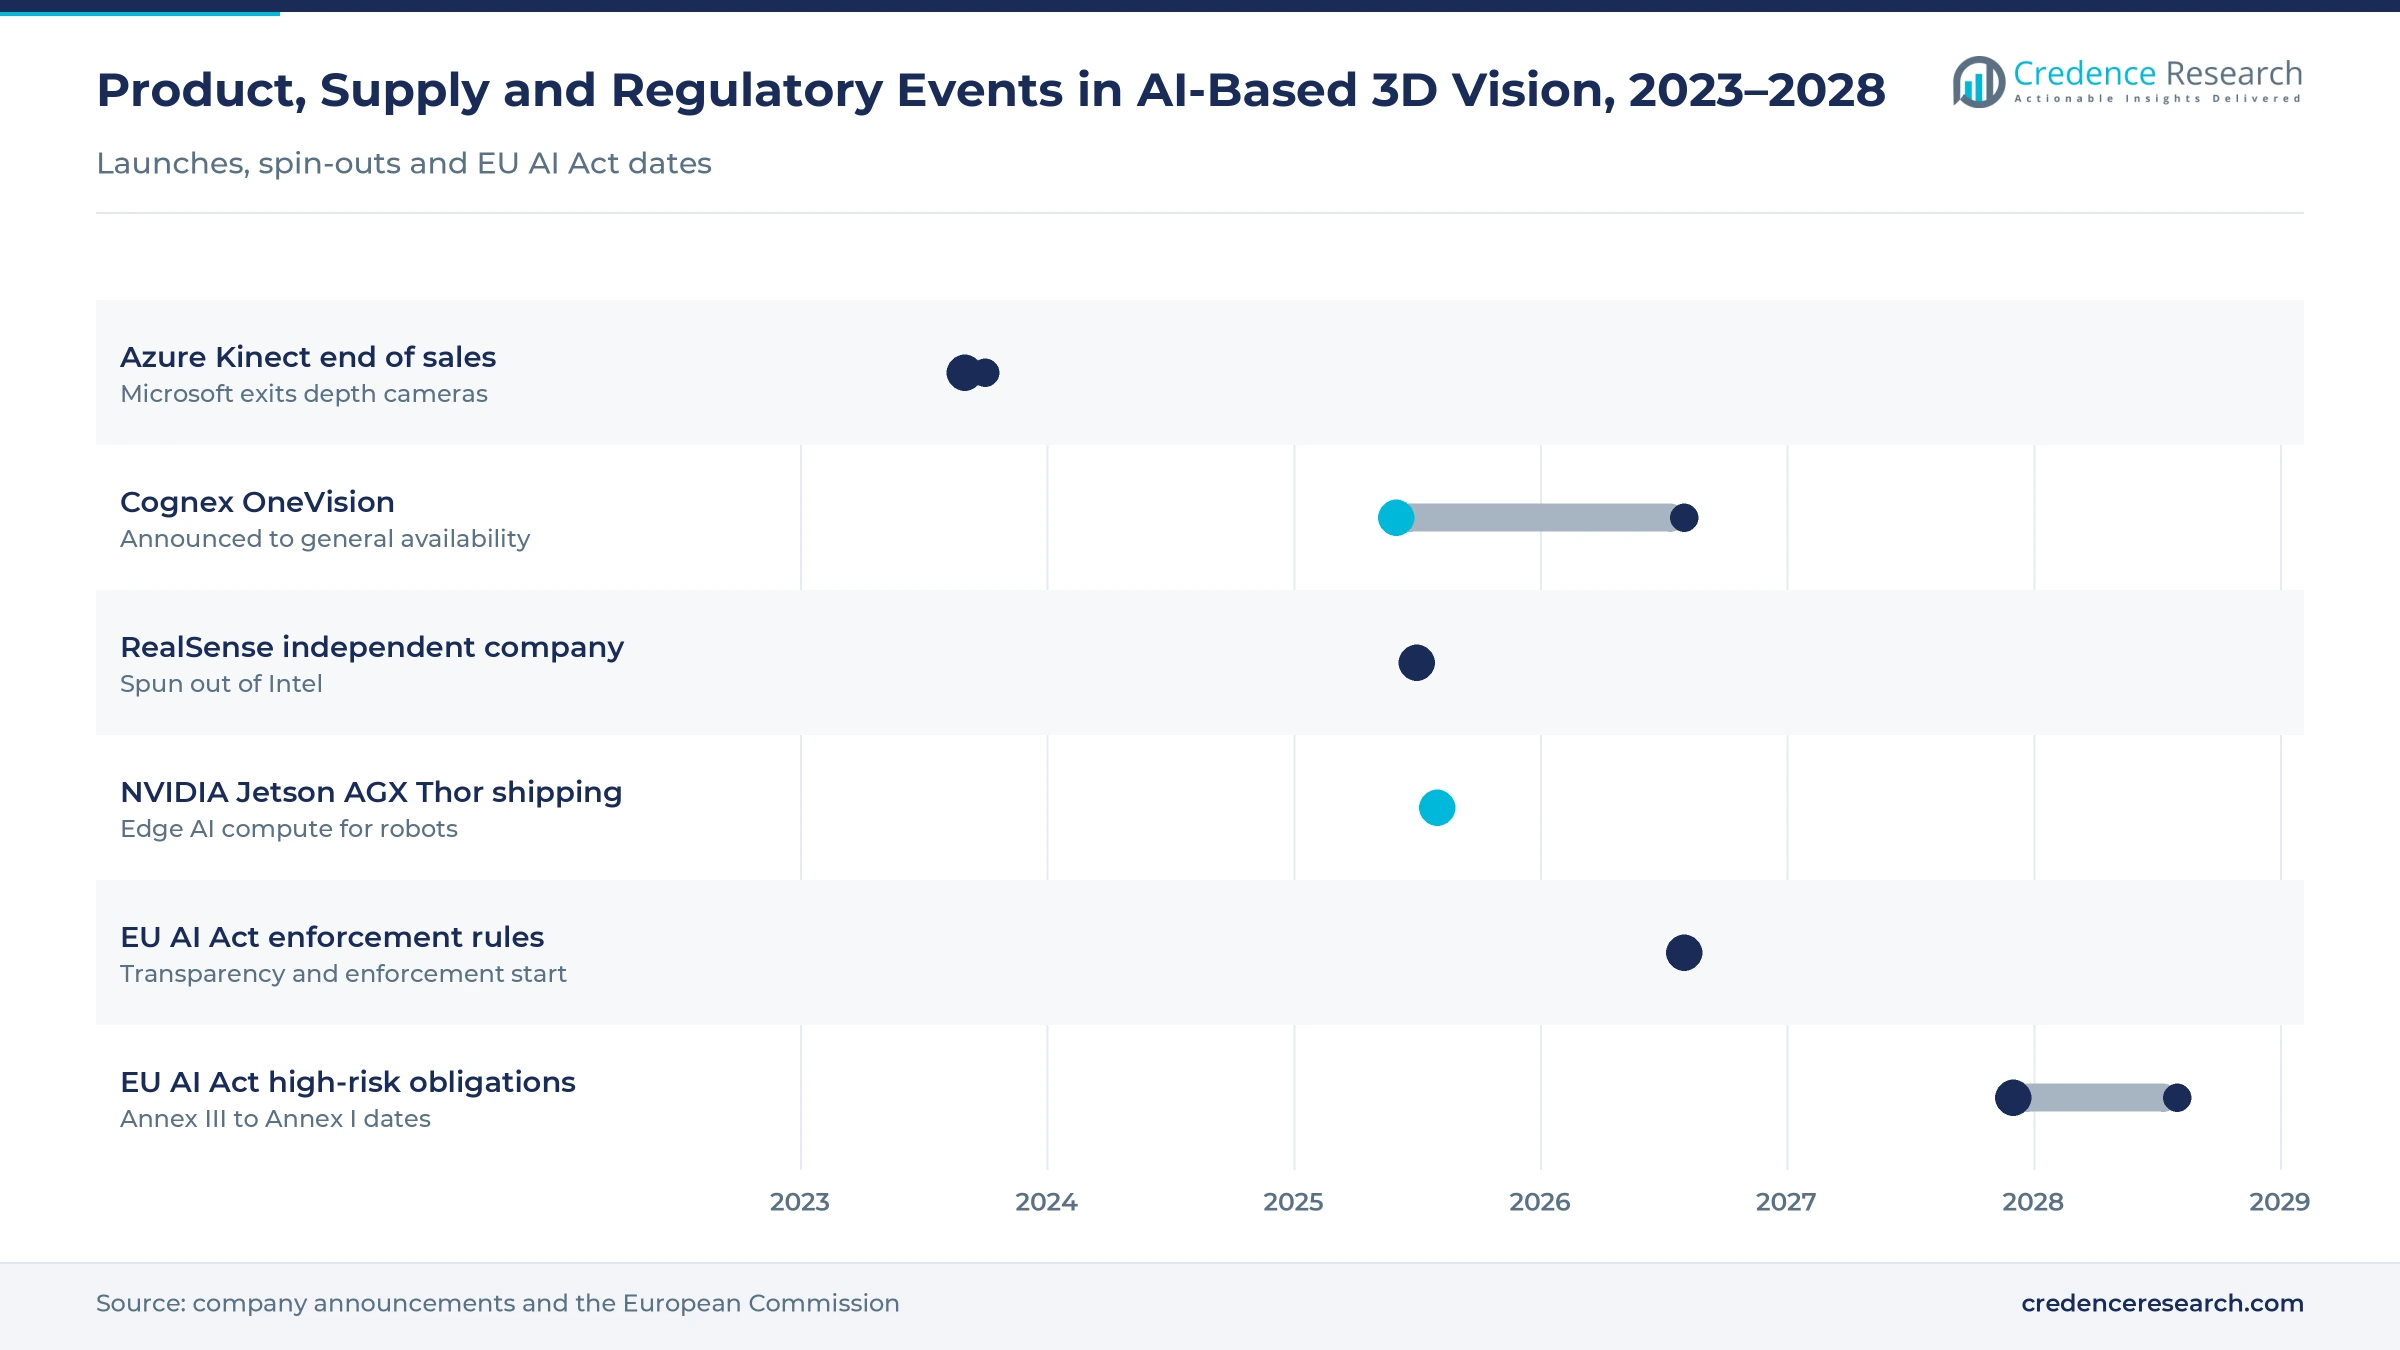
Yes. Microsoft ended Azure Kinect production in 2023, Intel spun out its RealSense business in July 2025, and Cognex agreed in 2026 to buy RealSense. Buyers that relied on these cameras have had to requalify hardware. Time-of-flight sensing grows fastest at 25.29% a year.
Weak Automotive Demand, Trade Costs and AI Rules Slow Adoption
Is automotive demand weak?
Yes. Automotive robot orders in North America fell 25% in the first half of 2026, and European machine vision system sales fell 6% in 2025, according to VDMA. Automotive remains the largest vertical, but its growth is slower than other buyers.
Do tariffs and export controls matter?
Yes. Cognex said in its annual report that tariffs raised component costs and export controls affected sales in China. Many 3D sensors and processors cross several borders before assembly.
Will AI rules add cost?
Partly. The EU AI Act sets duties for high-risk AI systems, now due from December 2027, with rules for AI embedded in regulated products from August 2028, according to the European Commission. Vision used in safety functions may need more documentation.
Is integration still hard?
Yes. 3D cameras need calibration, lighting control and labeled training data. Shiny, dark and transparent parts remain difficult for many sensors.
Where are the opportunities?
Pre-trained models and packaged bin-picking and depalletizing cells for small and mid-sized factories offer the clearest growth path. Suppliers that cut setup time from weeks to days can reach buyers without vision specialists. The execution risk is supporting many part types without custom engineering.
North America Leads, Asia Pacific Grows Fastest on Robot Installations
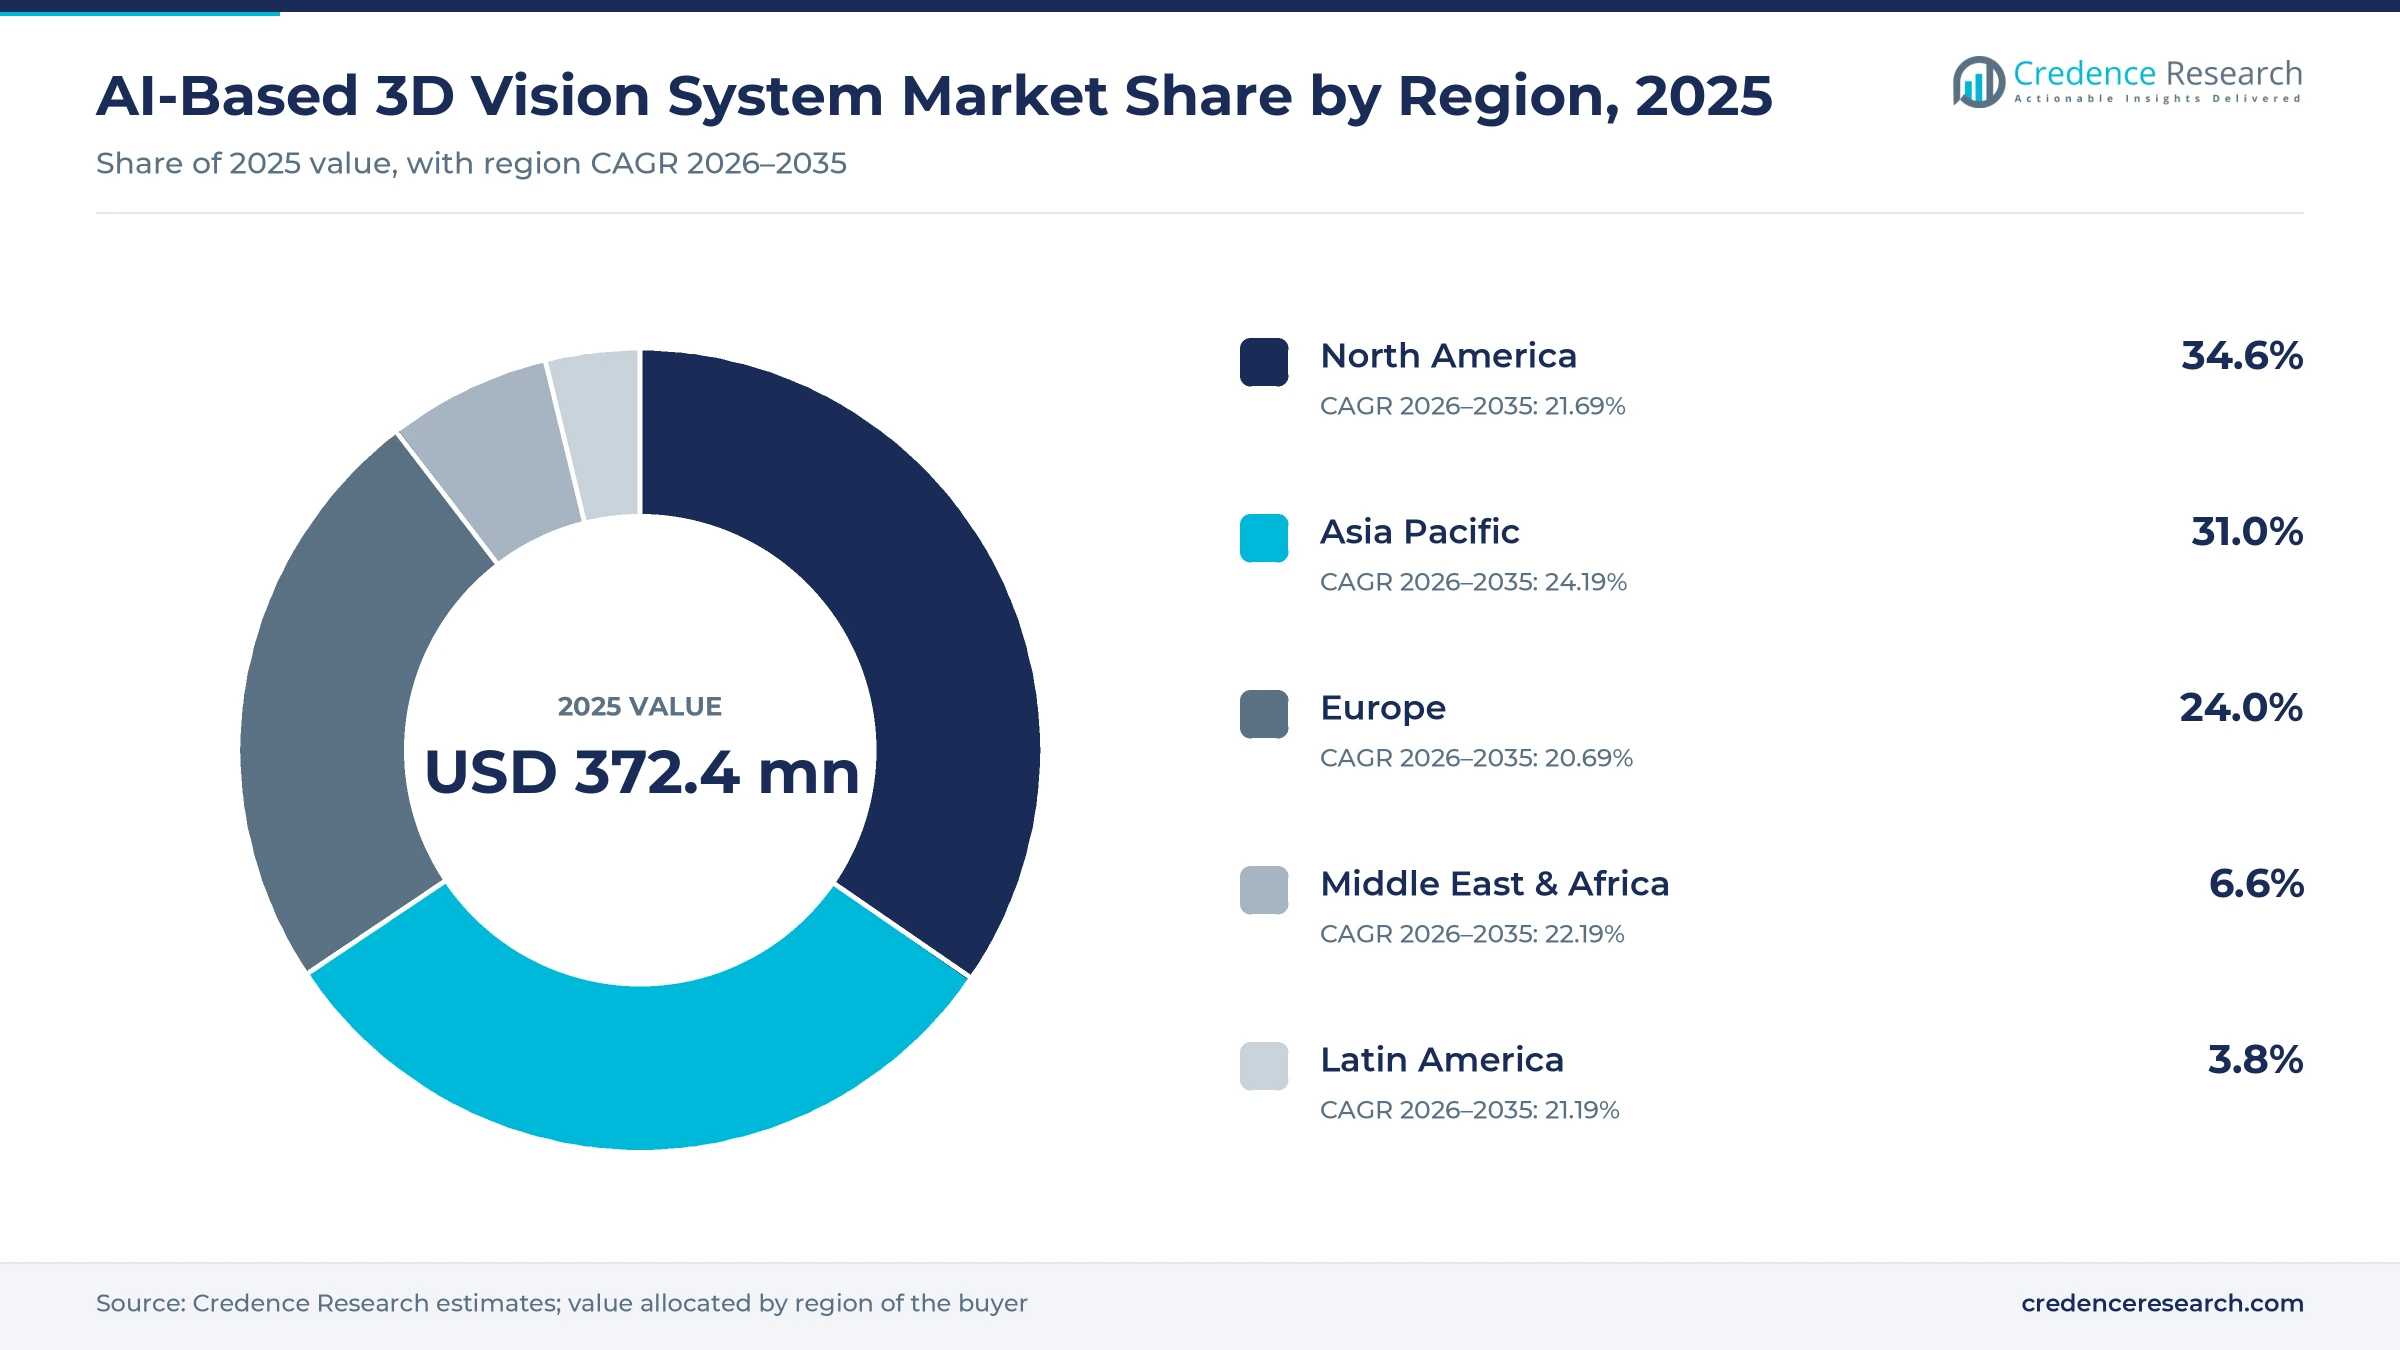
AI-based 3D vision system value is allocated to the region of the buyer.
| Region | Share 2025 | CAGR 2026–2035 |
|---|---|---|
| North America | 34.6% | 21.69% |
| Asia Pacific | 31.0% | 24.19% |
| Europe | 24.0% | 20.69% |
| Middle East & Africa | 6.6% | 22.19% |
| Latin America | 3.8% | 21.19% |
Why does North America lead?
North America holds a 34.6% share in 2025 and grows at 21.69% a year. Large warehouses, electronics and pharma plants, and AI software suppliers support demand, even as automotive orders soften.
Why does Asia Pacific grow fastest?
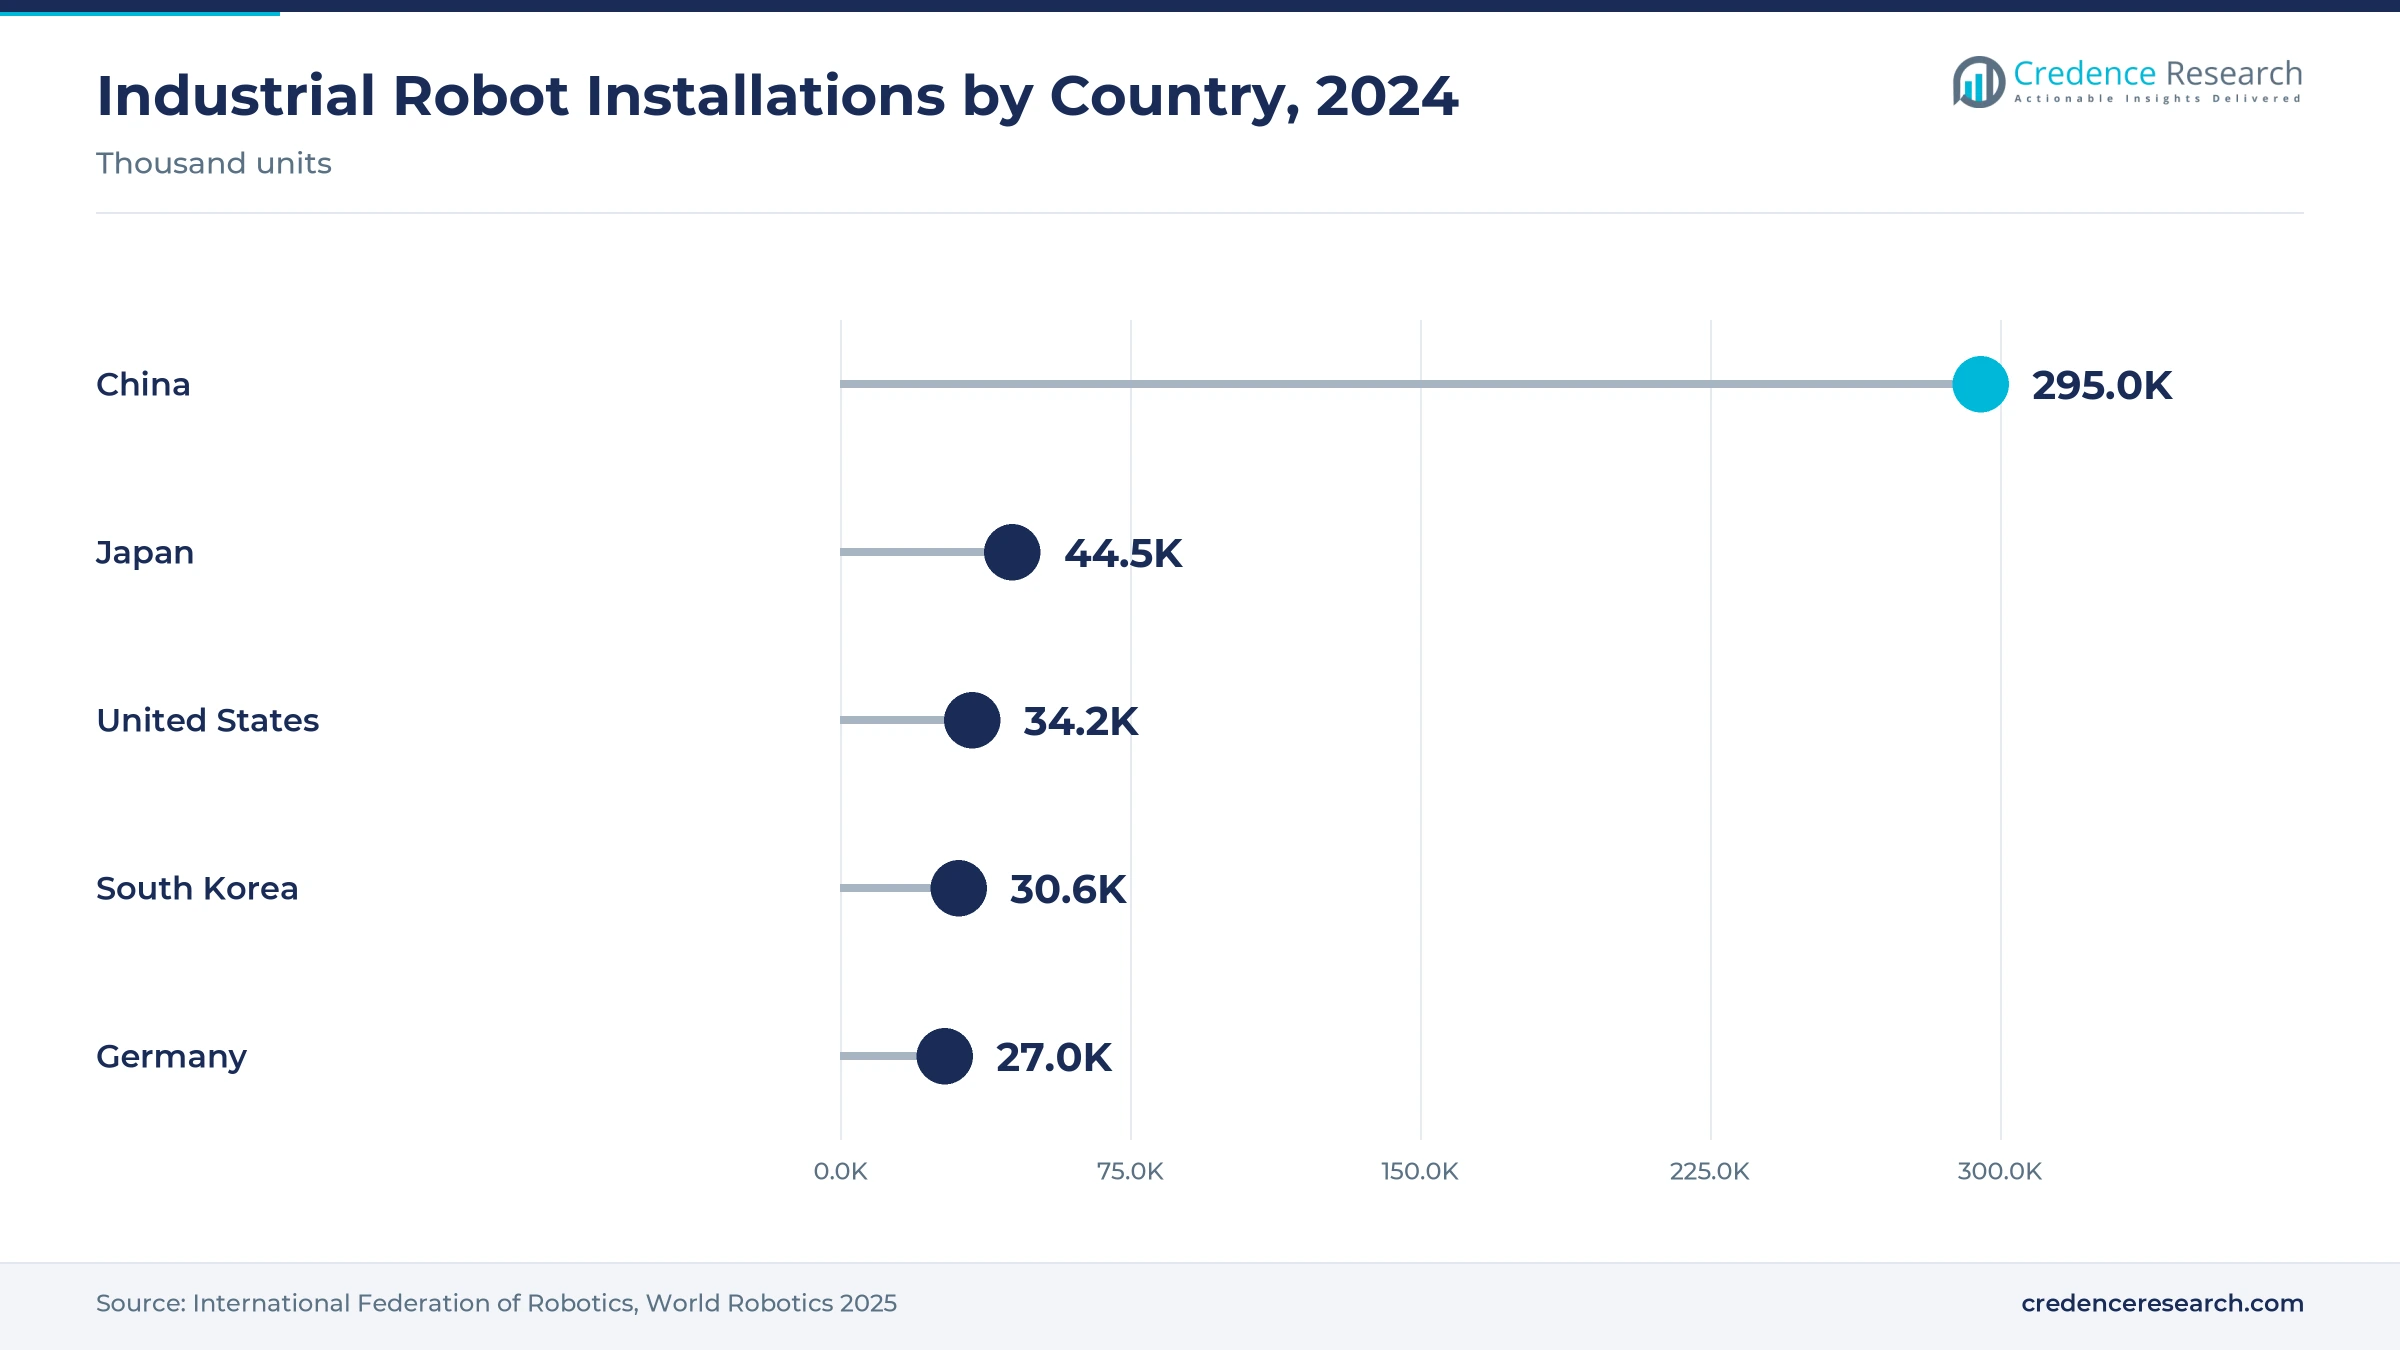
Asia Pacific holds 31.0% and is the fastest-growing region at 24.19% a year. China installed about 295,000 robots in 2024, more than half the world total, and Japan and South Korea are major robot and camera makers.
What shapes Europe?
Europe holds 24.0% and grows at 20.69%. Germany is a center for machine vision suppliers, and VDMA expects European machine vision to grow again in 2026 after three weaker years.
What about Latin America and the Middle East & Africa?
Latin America holds 3.8% and grows at 21.19%, led by automotive and food plants in Mexico and Brazil. The Middle East & Africa region holds 6.6% and grows at 22.19%, supported by logistics hubs in the Gulf.
Launches, Spin-Outs and Platform Releases, 2025–2026
| Development | Status and why it matters |
|---|---|
| In October 2026, VDMA announced that European machine vision should grow about 3% in 2026 after three years of decline. | Published. Signals recovery in a key region. |
| In September 2026, Cognex announced an agreement to acquire RealSense, the depth-camera business spun out of Intel. | Announced. Combines 3D sensing with AI vision. |
| In August 2026, Cognex announced general availability of its OneVision cloud AI platform. | Launched. Makes AI model training easier. |
| In September 2025, SICK launched Visionary AI-Assist for people detection on outdoor vehicles. | Launched. Extends 3D AI vision to mobile machines. |
| In August 2025, NVIDIA launched the Jetson AGX Thor module for robotics. | Launched. Raises edge AI compute. |
| In August 2025, Teledyne DALSA launched the Z-Trak Express 1K5 3D laser profiler. | Launched. Speeds inline 3D inspection. |
| In July 2025, RealSense completed its spin-out from Intel and raised USD 50 million. | Completed. Creates an independent depth-camera supplier. |
| In January 2025, SICK announced the acquisition of Accerion, an AI localization start-up for mobile robots. | Completed. Adds navigation software. |
Need a Custom Version of This Report?
Tailor the scope, geography, or segments to your exact requirements.
- Custom geography or segment scope
- Direct access to our analyst team
Vision Specialists, Sensor Makers and AI Compute Suppliers Compete
The market combines machine vision specialists, sensor makers and AI compute suppliers. No share ranking is given because few firms report 3D AI vision sales separately.
Which machine vision firms add AI to 3D sensing?
Cognex Corporation sells In-Sight vision systems with OneVision cloud AI and 3D vision for robot guidance, and agreed in 2026 to buy depth-camera maker RealSense. Keyence Corporation sells AI vision systems and 3D inline inspection with micron-level accuracy. OMRON Corporation sells vision systems alongside its robots and controllers. LMI Technologies, part of TKH Group, makes Gocator 3D smart sensors with built-in AI tools.
Who makes 3D cameras and sensors?
Basler AG makes time-of-flight and stereo 3D cameras. Teledyne Technologies, through Teledyne DALSA, launched the Z-Trak Express 1K5 laser profiler in August 2025 with up to 5,000 profiles per second. SICK AG makes Visionary stereo 3D cameras and AI-assisted safety and pallet inspection products.
Who supplies AI compute, and who has exited?
NVIDIA Corporation supplies Jetson modules and robotics software used to run 3D vision models but does not sell cameras. Intel Corporation no longer owns RealSense after its 2025 spin-out and remains only an investor. Microsoft Corporation ended Azure Kinect production in 2023 and now relies on partners for depth cameras.
How do suppliers compete?
Suppliers compete on accuracy, speed, ease of training, robot integration and price. Firms with pre-trained models and simple setup tools are gaining against those that require custom programming. Partnerships between camera makers, robot builders and AI compute suppliers are becoming common, as buyers want complete, tested AI-based 3D vision system packages.
Frequently Asked Questions
How big is the AI-based 3D vision system market?
What is an AI-based 3D vision system?
What drives the market?
Which sensing technology leads?
Which region leads?
What holds the market back?
Table of Content
Chapter 1 Market Segmentation
- 1.1 Segmentation Framework
- 1.1.1 Product and Service Classification
- 1.1.2 Application and End-Use Classification
- 1.1.3 Technology and Solution Classification
- 1.1.4 Customer and Distribution Channel Classification
- 1.1.5 Geographic Segmentation
- 1.1.6 Market Segment Definitions and Boundaries
- 1.2 By Component
- 1.2.1 Hardware
- 1.2.2 Software
- 1.2.3 Services
- 1.3 By Type
- 1.3.1 PC-Based
- 1.3.2 Smart Camera/Edge-Based
- 1.3.3 Other Embedded Systems
- 1.4 By 3D Sensing Technology
- 1.4.1 Stereo Vision
- 1.4.2 Time-of-Flight
- 1.4.3 Structured Light
- 1.4.4 Laser Triangulation
- 1.5 By Application
- 1.5.1 Quality Assurance & Inspection
- 1.5.2 Positioning & Guidance
- 1.5.3 Measurement/Metrology
- 1.5.4 Navigation
- 1.6 By Industry Vertical
- 1.6.1 Automotive
- 1.6.2 Electronics & Semiconductor
- 1.6.3 Machinery
- 1.6.4 Healthcare/Pharma
- 1.6.5 Postal & Logistics
- 1.7 By AI Capability
- 1.7.1 Deep-Learning Detection
- 1.7.2 Pose Estimation
- 1.7.3 3D Reconstruction
- 1.7.4 Sensor Fusion
Chapter 2 Introduction
- 2.1 Report Objectives and Scope
- 2.2 Product Definition and Industry Terminology
- 2.3 Market Inclusions and Exclusions
- 2.4 Research Process
- 2.4.1 Primary Research and Expert Interviews
- 2.4.2 Secondary Research and Source Review
- 2.4.3 Top-Down and Bottom-Up Estimation
- 2.4.4 Data Triangulation and Verification
- 2.5 Market Size Measurement Basis
- 2.5.1 2025: USD 372.4 million → 2035: USD 2,787.9 million
- 2.6 Historical and Forecast Reference Periods
- 2.6.1 Historical Period: 2018-2025
- 2.6.2 Base Year: 2025
- 2.6.3 Forecast Period: 2025-2035
- 2.7 Research Assumptions and Limitations
Chapter 3 Executive Summary
- 3.1 Market Snapshot and Key Findings
- 3.2 Base-Year Market Size, 2025
- 3.3 Forecast Market Size, 2035
- 3.4 Revenue and Volume Growth Outlook
- 3.5 Key Demand and Supply Indicators
- 3.6 Leading Market Segments
- 3.7 Fastest-Growing Market Opportunities
- 3.8 Regional Performance Highlights
- 3.9 Technology and Industry Transformation
- 3.10 Competitive Landscape Summary
- 3.11 Analyst View and Strategic Implications
Chapter 4 Global AI Based 3D Vision System Market Trends and Developments
- 4.1 Historical Industry Development, 2018-2025
- 4.2 Recent Market Trends and Developments
- 4.3 Demand and Customer Behavior Trends
- 4.4 Technology and Product Innovation
- 4.5 Artificial Intelligence, Automation and Digitalization
- 4.6 Local Manufacturing and Supply Chain Realignment
- 4.7 Industry Partnerships, Mergers and Acquisitions
- 4.8 Sustainability and Circular Economy Developments
- 4.9 Government and Private Sector Investment Trends
- 4.10 Emerging Business Models and Commercialization
- 4.11 Industry Developments and Announcements
Chapter 5 Global AI Based 3D Vision System Market Production, Supply and Demand Analysis
- 5.1 Demand Trend and Consumption Analysis, 2018-2025
- 5.2 Demand Forecast, 2025-2035
- 5.3 Production and Output Trend, 2018-2025
- 5.4 Production and Output Forecast, 2025-2035
- 5.5 Installed Capacity and Capacity Utilization
- 5.6 Company-Wise Production Plants and Statistics
- 5.6.1 Installed Production Capacity
- 5.6.2 Actual Production
- 5.6.3 Planned Capacity and Expansion Targets
- 5.7 Supply Chain Structure and Procurement Trends
- 5.8 Supply-Demand Gap and Bottlenecks
- 5.9 Import Dependence and Sourcing Structure
- 5.10 Contract Manufacturing and Outsourcing
- 5.11 Regional Supply and Demand Concentration
Chapter 6 Global AI Based 3D Vision System Market Pricing Analysis
- 6.1 Pricing Structure and Measurement
- 6.2 Historical Pricing Trends, 2018-2025
- 6.3 Pricing Outlook, 2025-2035
- 6.4 Average Selling Price and Unit Economics
- 6.5 Pricing by Product and Market Segment
- 6.6 Geographic Pricing Differences
- 6.7 Key Input, Energy, Labor and Logistics Costs
- 6.8 Contract Pricing and Purchasing Models
- 6.9 Pricing Sensitivity and Competitive Positioning
- 6.10 Price, Margin and Profitability Implications
Chapter 7 Global AI Based 3D Vision System Market Dynamics
- 7.1 Market Growth Drivers
- 7.1.1 Demand-Side Drivers
- 7.1.2 Technology and Innovation Drivers
- 7.1.3 Infrastructure and Investment Drivers
- 7.1.4 Regulatory and Policy Drivers
- 7.2 Market Restraints
- 7.2.1 Cost and Affordability Constraints
- 7.2.2 Technology and Adoption Barriers
- 7.2.3 Supply Chain and Operational Constraints
- 7.3 Market Challenges
- 7.3.1 Competitive Pressure and Margin Erosion
- 7.3.2 Skills, Infrastructure and Implementation Gaps
- 7.4 Emerging Market Opportunities
- 7.5 Market Dynamics Impact and Time-Horizon Assessment
Chapter 8 Global AI Based 3D Vision System Value Chain Analysis
- 8.1 Industry Value Chain Overview
- 8.2 Upstream Suppliers and Critical Inputs
- 8.3 Technology and Component Providers
- 8.4 Manufacturing or Service Delivery
- 8.5 Distribution, Channel Partners and Integrators
- 8.6 Downstream Applications and End Users
- 8.7 Value Addition and Profit Pools
- 8.8 Vertical Integration and Outsourcing
- 8.9 Supplier Concentration and Risk
- 8.10 Supply Chain Localization and Resilience
Chapter 9 Global AI Based 3D Vision System Market Regulations and Policies
- 9.1 Relevant Laws, Standards and Compliance Frameworks
- 9.2 Product, Service, Safety and Quality Requirements
- 9.3 Government Policies, Incentives and Subsidies
- 9.4 Imports, Exports and Trade Barriers
- 9.5 Public Procurement and Local Content Requirements
- 9.6 Environmental and Sustainability Compliance
- 9.7 Upcoming Policy Changes and Market Implications
Chapter 10 Global AI Based 3D Vision System Market Hotspots and Opportunities
- 10.1 Market Opportunity Mapping and Growth Hotspots
- 10.2 High-Growth Applications and Customer Groups
- 10.3 Underserved Markets and White-Space Opportunities
- 10.4 Emerging Technology and Product Opportunities
- 10.5 New Capacity and Investment Hotspots
- 10.6 Market Entry and Expansion Opportunities
- 10.7 Distribution and Partnership Opportunities
- 10.8 Near-Term and Long-Term Commercial Potential
- 10.9 Opportunity Attractiveness and Execution Risks
Chapter 11 Global AI Based 3D Vision System Market Outlook, 2025-2035
- 11.1 Market Size and Analysis
- 11.1.1 Revenue (Market Measurement: 2025: USD 372.4 million → 2035: USD 2,787.9 million)
- 11.1.2 Market Volume and Quantity Sold
- 11.1.3 Historical Market Size, 2018-2025
- 11.1.4 Base-Year Market Size, 2025
- 11.2 Market Forecast, 2025-2035
- 11.2.1 Revenue Forecast to 2035
- 11.2.2 Volume Forecast to 2035
- 11.2.3 CAGR and Year-on-Year Growth
- 11.2.4 Incremental Revenue Opportunity
- 11.3 Forecast Assumptions and Scenario Analysis
- 11.3.1 Base-Case Forecast
- 11.3.2 Optimistic and Conservative Scenarios
- 11.3.3 Technology, Pricing and Policy Sensitivities
- 11.4 Market Attractiveness and Growth Outlook
Chapter 12 Global AI Based 3D Vision System Market Segmentation and Outlook
- 12.1 Segmentation Summary and Market Shares, 2025
- 12.2 Largest and Fastest-Growing Segments
- 12.3 By Component - Market Size and Forecast, 2025-2035
- 12.3.1 Segment Definition and Scope
- 12.3.2 Historical Market Size, 2018-2025
- 12.3.3 Revenue Forecast, 2025-2035
- 12.3.4 Volume Forecast, 2025-2035
- 12.3.5 Base-Year Market Share, 2025
- 12.3.6 Segment CAGR and Growth Drivers
- 12.3.7 Subsegment Market Size and Forecast
- 12.3.7.1 Hardware
- 12.3.7.2 Software
- 12.3.7.3 Services
- 12.3.8 Subsegment Pricing and Adoption Trends
- 12.3.9 Leading Suppliers and Competition
- 12.3.10 Regional Demand and Opportunities
- 12.4 By Type - Market Size and Forecast, 2025-2035
- 12.4.1 Segment Definition and Scope
- 12.4.2 Historical Market Size, 2018-2025
- 12.4.3 Revenue Forecast, 2025-2035
- 12.4.4 Volume Forecast, 2025-2035
- 12.4.5 Base-Year Market Share, 2025
- 12.4.6 Segment CAGR and Growth Drivers
- 12.4.7 Subsegment Market Size and Forecast
- 12.4.7.1 PC-Based
- 12.4.7.2 Smart Camera/Edge-Based
- 12.4.7.3 Other Embedded Systems
- 12.4.8 Subsegment Pricing and Adoption Trends
- 12.4.9 Leading Suppliers and Competition
- 12.4.10 Regional Demand and Opportunities
- 12.5 By 3D Sensing Technology - Market Size and Forecast, 2025-2035
- 12.5.1 Segment Definition and Scope
- 12.5.2 Historical Market Size, 2018-2025
- 12.5.3 Revenue Forecast, 2025-2035
- 12.5.4 Volume Forecast, 2025-2035
- 12.5.5 Base-Year Market Share, 2025
- 12.5.6 Segment CAGR and Growth Drivers
- 12.5.7 Subsegment Market Size and Forecast
- 12.5.7.1 Stereo Vision
- 12.5.7.2 Time-of-Flight
- 12.5.7.3 Structured Light
- 12.5.7.4 Laser Triangulation
- 12.5.8 Subsegment Pricing and Adoption Trends
- 12.5.9 Leading Suppliers and Competition
- 12.5.10 Regional Demand and Opportunities
- 12.6 By Application - Market Size and Forecast, 2025-2035
- 12.6.1 Segment Definition and Scope
- 12.6.2 Historical Market Size, 2018-2025
- 12.6.3 Revenue Forecast, 2025-2035
- 12.6.4 Volume Forecast, 2025-2035
- 12.6.5 Base-Year Market Share, 2025
- 12.6.6 Segment CAGR and Growth Drivers
- 12.6.7 Subsegment Market Size and Forecast
- 12.6.7.1 Quality Assurance & Inspection
- 12.6.7.2 Positioning & Guidance
- 12.6.7.3 Measurement/Metrology
- 12.6.7.4 Navigation
- 12.6.8 Subsegment Pricing and Adoption Trends
- 12.6.9 Leading Suppliers and Competition
- 12.6.10 Regional Demand and Opportunities
- 12.7 By Industry Vertical - Market Size and Forecast, 2025-2035
- 12.7.1 Segment Definition and Scope
- 12.7.2 Historical Market Size, 2018-2025
- 12.7.3 Revenue Forecast, 2025-2035
- 12.7.4 Volume Forecast, 2025-2035
- 12.7.5 Base-Year Market Share, 2025
- 12.7.6 Segment CAGR and Growth Drivers
- 12.7.7 Subsegment Market Size and Forecast
- 12.7.7.1 Automotive
- 12.7.7.2 Electronics & Semiconductor
- 12.7.7.3 Machinery
- 12.7.7.4 Healthcare/Pharma
- 12.7.7.5 Postal & Logistics
- 12.7.8 Subsegment Pricing and Adoption Trends
- 12.7.9 Leading Suppliers and Competition
- 12.7.10 Regional Demand and Opportunities
- 12.8 By AI Capability - Market Size and Forecast, 2025-2035
- 12.8.1 Segment Definition and Scope
- 12.8.2 Historical Market Size, 2018-2025
- 12.8.3 Revenue Forecast, 2025-2035
- 12.8.4 Volume Forecast, 2025-2035
- 12.8.5 Base-Year Market Share, 2025
- 12.8.6 Segment CAGR and Growth Drivers
- 12.8.7 Subsegment Market Size and Forecast
- 12.8.7.1 Deep-Learning Detection
- 12.8.7.2 Pose Estimation
- 12.8.7.3 3D Reconstruction
- 12.8.7.4 Sensor Fusion
- 12.8.8 Subsegment Pricing and Adoption Trends
- 12.8.9 Leading Suppliers and Competition
- 12.8.10 Regional Demand and Opportunities
- 12.9 Segment Growth Comparison
- 12.10 Segment Attractiveness and Priority Matrix
Chapter 13 Global AI Based 3D Vision System End-Use and Application Market Outlook
- 13.1 End-Use Industry and Customer Demand Structure
- 13.2 Leading Applications and Customer Groups
- 13.3 End-Use Market Size, Share and Forecast
- 13.4 Major End-Use Industry Deep Dives
- 13.4.1 Customer Requirements and Use Cases
- 13.4.2 Demand and Replacement Cycles
- 13.4.3 Technical and Regulatory Considerations
- 13.4.4 Purchasing and Procurement Models
- 13.4.5 Leading Vendors and Distribution Channels
- 13.4.6 Forecast and Commercial Opportunities
- 13.5 Emerging Applications and Cross-Segment Demand
- 13.6 End-Use Industry Investment Priorities
Chapter 14 Global AI Based 3D Vision System Geographic Market Outlook, 2025-2035
- 14.1 Regional Market Size and Share, 2025
- 14.2 Regional Market Forecast, 2025-2035
- 14.3 Regional Pricing, Production and Demand Differences
- 14.4 North America
- 14.4.1 United States
- 14.4.2 Canada
- 14.4.3 Mexico
- 14.5 Europe
- 14.5.1 Germany
- 14.5.2 France
- 14.5.3 Italy
- 14.5.4 United Kingdom
- 14.5.5 Spain
- 14.5.6 Poland
- 14.5.7 Russia
- 14.5.8 Netherlands
- 14.5.9 Belgium
- 14.5.10 Sweden
- 14.5.11 Denmark
- 14.5.12 Norway
- 14.5.13 Rest of Europe
- 14.6 Asia Pacific
- 14.6.1 China
- 14.6.2 India
- 14.6.3 Japan
- 14.6.4 South Korea
- 14.6.5 Thailand
- 14.6.6 Indonesia
- 14.6.7 Vietnam
- 14.6.8 Malaysia
- 14.6.9 Australia
- 14.6.10 Rest of Asia Pacific
- 14.7 Latin America
- 14.7.1 Brazil
- 14.7.2 Argentina
- 14.7.3 Colombia
- 14.7.4 Chile
- 14.7.5 Rest of Latin America
- 14.8 Middle East
- 14.8.1 Saudi Arabia
- 14.8.2 United Arab Emirates
- 14.8.3 Turkey
- 14.8.4 Israel
- 14.8.5 Iran
- 14.8.6 Rest of the Middle East
- 14.9 Africa
- 14.9.1 South Africa
- 14.9.2 Egypt
- 14.9.3 Nigeria
- 14.9.4 Morocco
- 14.9.5 Rest of Africa
- 14.10 Regional Investment, Policy and Supply Chain Differences
- 14.11 Regional Competitive Landscape
- 14.12 Geographic Growth Hotspots
Chapter 15 Global AI Based 3D Vision System Technology, Innovation and Sustainability Outlook
- 15.1 Technology Landscape and Maturity
- 15.2 Product, Process and Service Innovation
- 15.3 AI, Automation and Digital Tools in the Industry
- 15.4 Technology Adoption and Performance Benchmarking
- 15.5 Innovation Pipeline and R&D Investment
- 15.6 Patent and Intellectual Property Trends
- 15.7 Energy Efficiency and Resource Management
- 15.8 Sustainability, Recycling and Circularity
- 15.9 Technology Roadmap, 2025-2035
- 15.10 Risks of Obsolescence and Technology Substitution
Chapter 16 Global AI Based 3D Vision System Market Key Strategic Imperatives
- 16.1 Growth and Market Entry Priorities
- 16.2 High-Return Products and Segments
- 16.3 Pricing, Profitability and Cost Optimization
- 16.4 Technology Investment and Product Differentiation
- 16.5 Supply Chain Localization and Resilience
- 16.6 Distribution and Customer Acquisition
- 16.7 Partnership, Acquisition and Capacity Strategy
- 16.8 Regional Expansion Priorities
- 16.9 Short-, Medium- and Long-Term Actions
Chapter 17 Competition Outlook
- 17.1 Industry Competition Characteristics
- 17.2 Market Structure and Concentration
- 17.3 Market Share and Competitive Positioning, 2025
- 17.4 Company-Wise Revenue and Product Benchmarking
- 17.5 Production and Service Capacity Benchmarking
- 17.6 Technology, Pricing and Differentiation
- 17.7 Regional Footprint and Distribution Strength
- 17.8 Mergers, Acquisitions and Strategic Alliances
- 17.9 New Entrants and Competitive Threats
- 17.10 Porter's Five Forces and Industry Attractiveness
- 17.11 Competitive Outlook, 2025-2035
Chapter 18 Company Profiles
- 18.1 Company Coverage and Selection Criteria
- 18.2 Cognex Corporation
- 18.2.1 Business Description
- 18.2.2 Company Ownership and Geographic Presence
- 18.2.3 Product and Service Portfolio
- 18.2.4 Manufacturing and Operating Footprint
- 18.2.5 Production Capacity and Expansion Plans
- 18.2.6 Financial Performance and Investment
- 18.2.7 Market Share and Competitive Position
- 18.2.8 Technology and Innovation Capabilities
- 18.2.9 Strategic Alliances or Partnerships
- 18.2.10 Recent Developments
- 18.2.11 Growth Strategy and Outlook
- 18.3 Keyence Corporation
- 18.4 NVIDIA Corporation
- 18.5 Intel Corporation
- 18.6 Basler AG
- 18.7 Teledyne Technologies
- 18.8 SICK AG
- 18.9 OMRON Corporation
- 18.10 LMI Technologies
- 18.11 Microsoft Corporation
- 18.12 Other Relevant Market Participants
Note: Every listed company is profiled on the structure shown under the first company. The company list is preliminary and may change based on research findings, market developments, data availability and client requirements.
Chapter 19 Disclaimer
- 19.1 Research and Forecast Disclaimer
- 19.2 Data Source and Estimation Limitations
Note: The depth of individual sections depends on data availability for this market. Volume, capacity, trade and other unit-based metrics are included where applicable.

