
An aging fleet keeps replacement at the center of demand
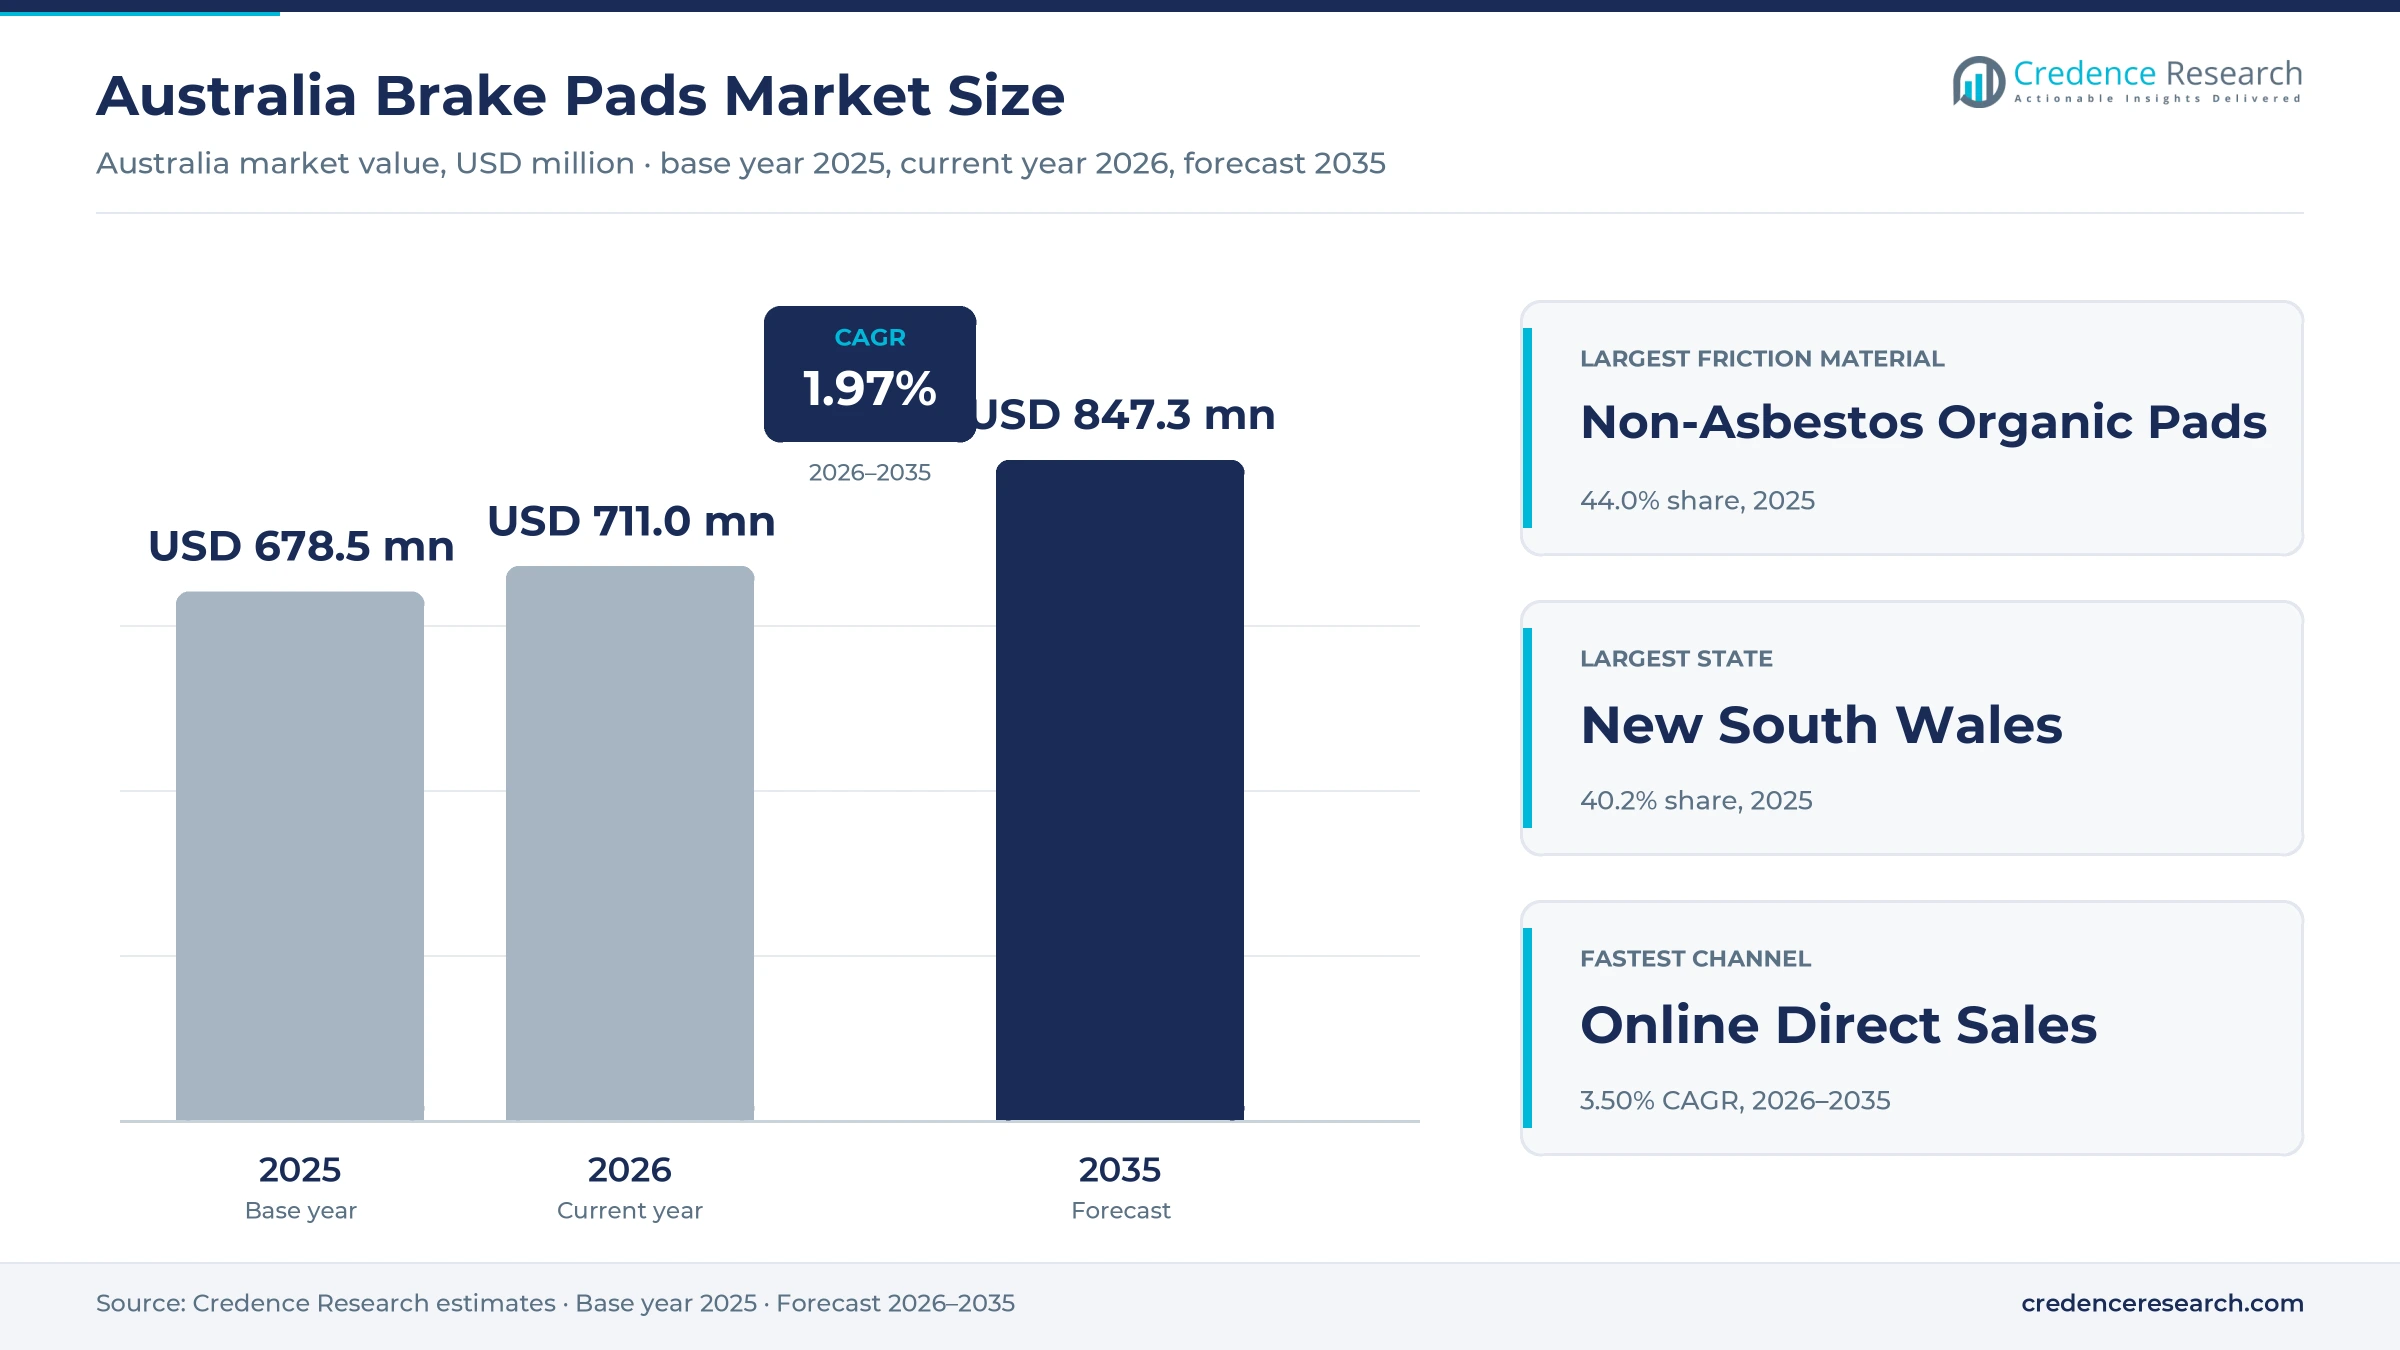
The Australia brake pads market was valued at USD 678.5 million in 2025 and is projected to increase from USD 711.0 million in 2026 to USD 847.3 million by 2035, registering a CAGR of 1.97% during 2026–2035. Demand comes mainly from the replacement of worn pads on the registered fleet, with independent trade distributors and workshops placing most orders and new-vehicle allocation adding a smaller stream. New South Wales held the largest state share, 40.2% in 2025, because Sydney concentrates vehicle kilometers, workshops and parts distribution. Queensland is the fastest-growing state at 2.24% a year because its registered fleet grew 2.7% in the year to January 2022, against 1.6% in New South Wales. Hybrid deliveries of 199,133 units in 2025 are pulling pad ranges toward copper-free and lower-dust formulas. FMP Group (Australia), owner of the Bendix brand and the Ballarat plant, entered voluntary administration on Oct. 26, 2026, with FTI Consulting receivers and managers appointed the same day, according to Grant Thornton, which has put local supply under close watch.
What does Australian brake pad spending actually cover?
The market counts disc brake friction pads for cars, sport utility vehicles, utes, vans, trucks, buses and motorcycles, valued at retail-equivalent prices, before workshop labor. Most purchases are replacement sets bought through trade distributors, retail chains and online sellers, and new-vehicle allocation makes up a smaller share.
Workshop labor, rotors, calipers, drum shoes and brake fluid are excluded, so the figures do not represent the full cost of a brake service. The value chain runs from local and imported friction manufacturers through national distributors to about 35,000 servicing and repair businesses, the count Treasury gave in its information-sharing scheme fact sheet.
Australia Brake Pads Market Insights
- Spending rises from USD 678.5 million in 2025 to USD 847.3 million by 2035, a 1.97% annual pace that tracks fleet growth more closely than new-vehicle sales.
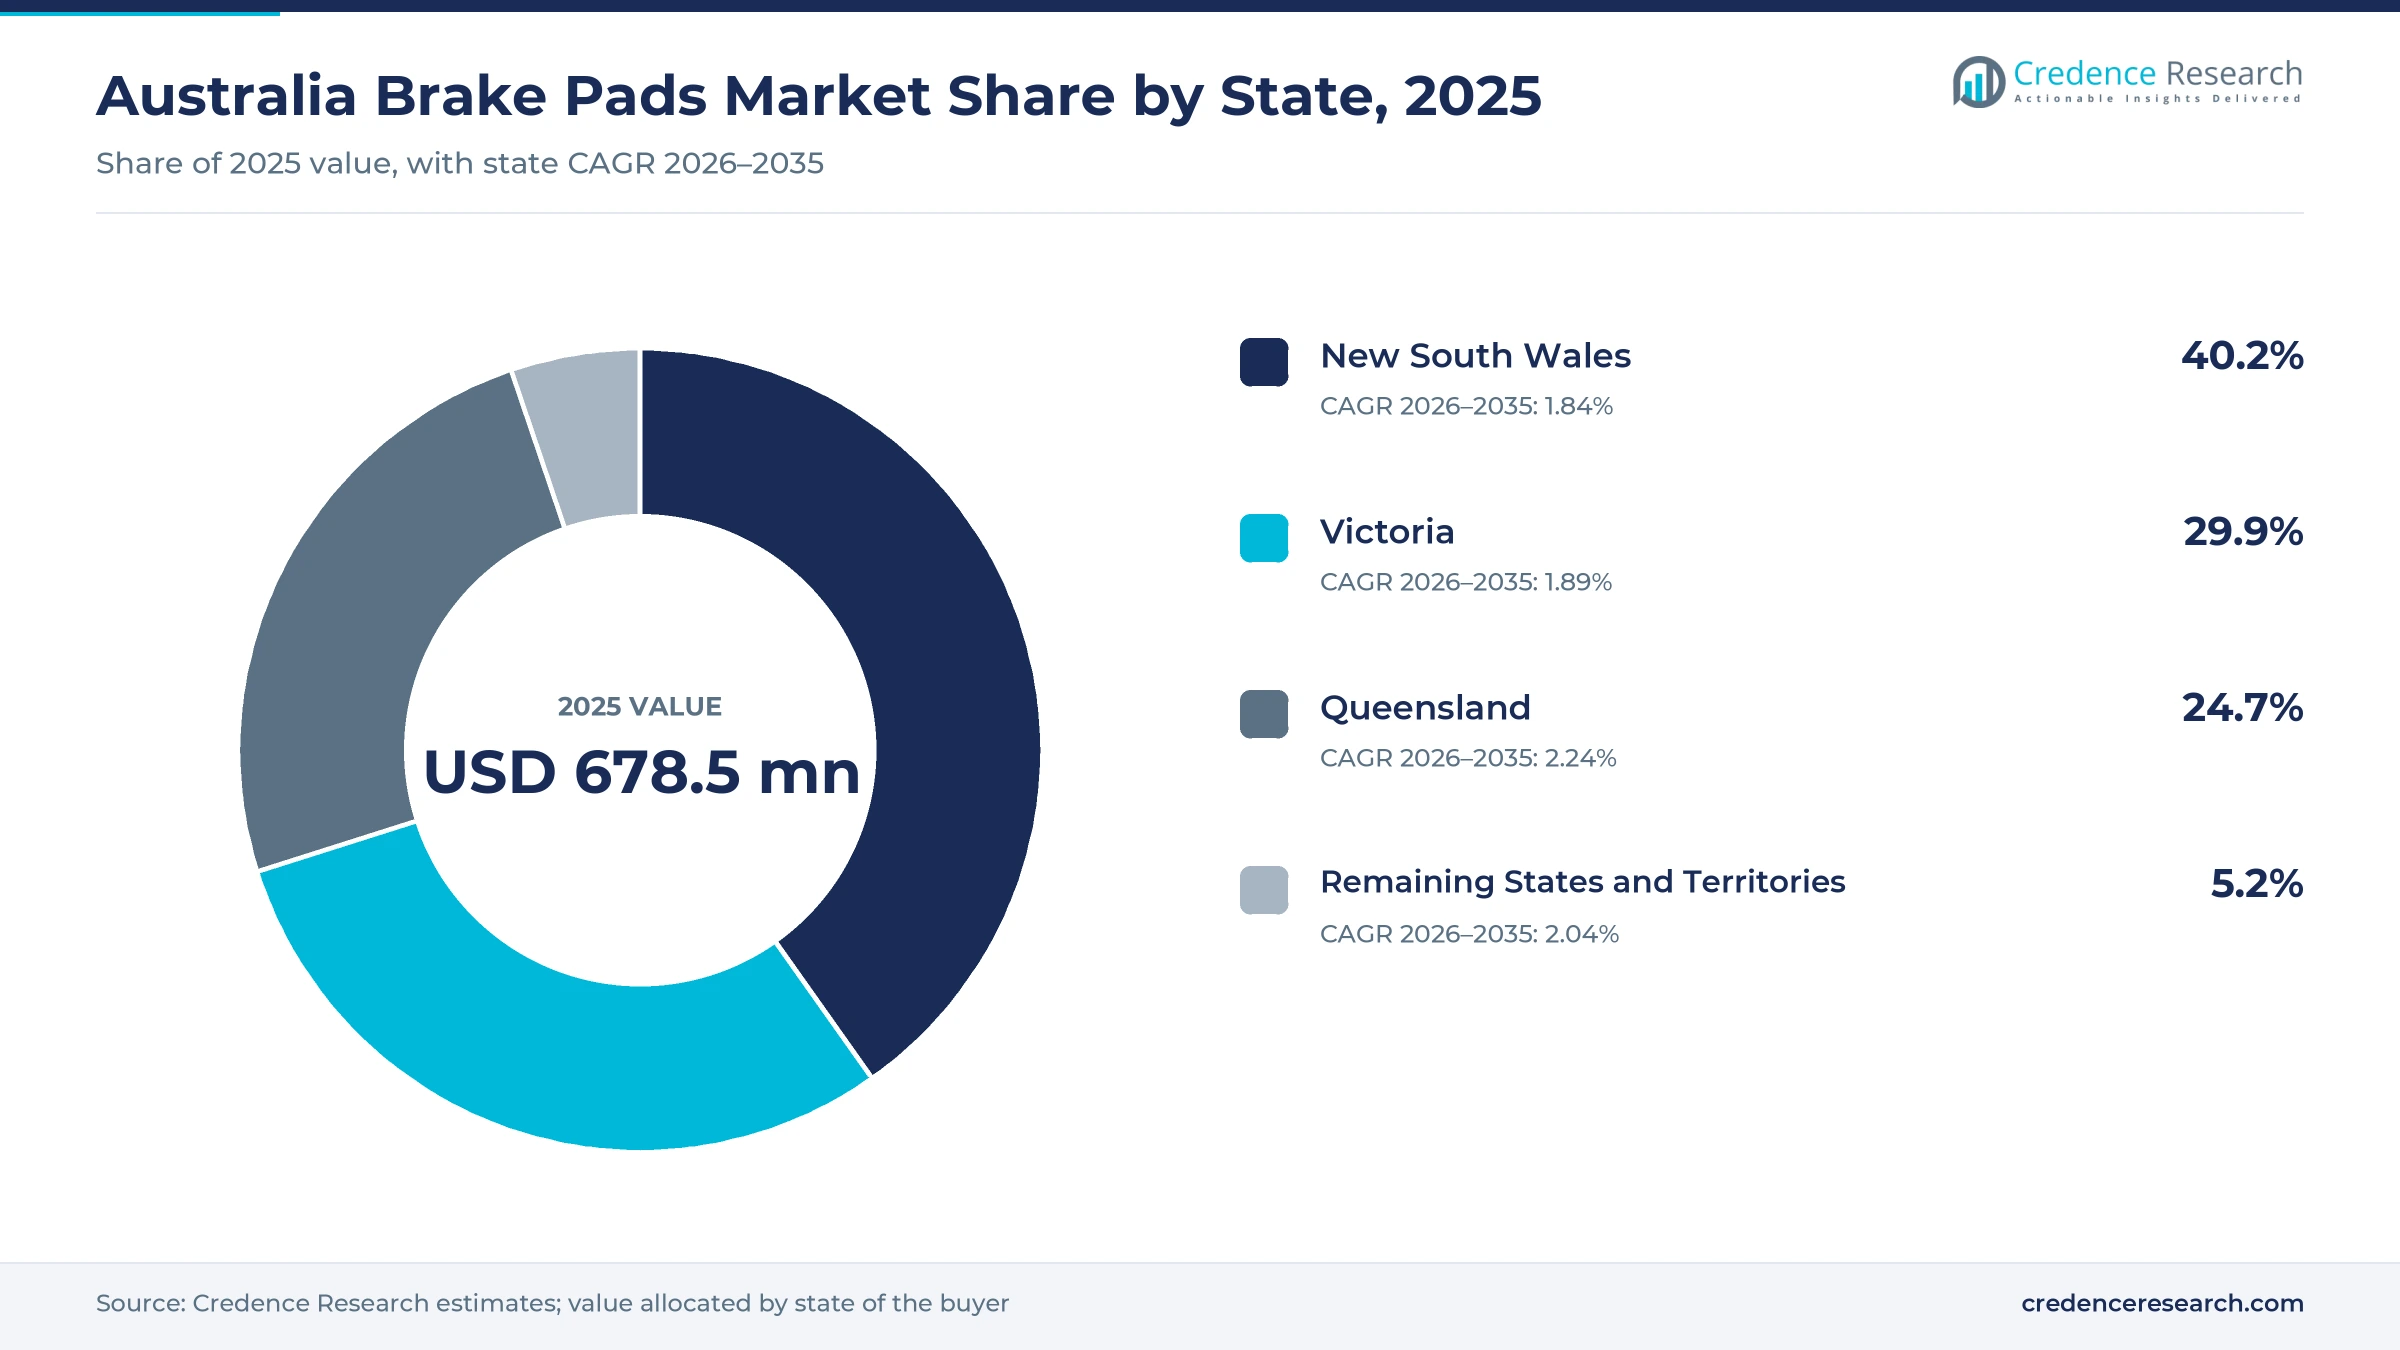
- New South Wales held the largest state share at 40.2% in 2025, ahead of Victoria at 29.9% and Queensland at 24.7%.
- Non-asbestos organic pads led friction materials with 44.0% of 2025 value, supported by a national asbestos ban in force since Dec. 31, 2003.
- FMP Group (Australia), whose Ballarat plant makes more than 1.3 million pad sets a year, entered voluntary administration on Oct. 26, 2026, and still trades under FTI Consulting receivers and managers.
- Bendix added 14 vehicle models in January 2025, including BYD and GWM applications, showing how quickly catalog coverage now follows new brands into the fleet.
Organic formulas and independent trade carry most sales
Why do organic formulas still lead pad sales?
Based on friction material, the market is categorized into metallic pads, non-asbestos organic pads, ceramic pads and specialty pads. Non-Asbestos Organic Pads led with 44.0% of 2025 value because the national asbestos ban, in force since Dec. 31, 2003, closed older formulas, and copper-free Bendix EV-Hybrid pads still use an organic base. Ceramic Pads grow fastest at 2.70% a year as mainstream ranges move that way, with Bosch describing its ceramic QuietCast pads for Australia as exceeding ECE R90 requirements and DBA using a ceramic and semi-metallic blend in Street Series. Workshops often order them alongside other friction products such as shoes and linings.
Which vehicles wear through the most pad value?
Based on vehicle type, the market is categorized into passenger cars and sport utility vehicles, light commercial vehicles, heavy commercial vehicles and buses and motorcycles. Passenger Cars and Sport Utility Vehicles led with 66.0% of 2025 value because the Australian Bureau of Statistics counted 179,761 million passenger vehicle kilometers in the year to June 2018, and VFACTS shows 922,544 cars and SUVs delivered in 2025. Light Commercial Vehicles grow fastest at 2.43% a year as 273,229 utes and vans joined the fleet in 2025, keeping pickup trucks central to trade stock. Buses and motorcycles keep a small share, even with 92,967 motorcycles sold in 2025, according to GoAuto.
How do pads reach Australian workshops and motorists?
Based on distribution channel, the market is categorized into independent aftermarket trade, authorised service centres, original equipment allocation and online direct sales. Independent Aftermarket Trade led with 58.0% of 2025 value because Treasury counted about 35,000 servicing and repair businesses employing more than 106,000 people, and Repco runs six Australian distribution centers with multiple daily trade deliveries. Online Direct Sales grow fastest at 3.50% a year as price comparison spreads, with GSS Auto Parts listing a Bendix GCT front set at A$100.14 against a A$109.20 recommended price and Bosch naming Amazon Australia among its QuietCast stockists.
How is electrification changing the pad mix?
Based on powertrain, the market is categorized into internal combustion vehicles, hybrid vehicles and battery electric vehicles. Internal Combustion Vehicles led with 84.0% of 2025 value because CarExpert's 2025 figures leave about 885,000 deliveries after hybrids, plug-ins and battery electric models, and the older installed fleet is more combustion-heavy still. Hybrid Vehicles grow fastest at 5.29% a year as hybrid deliveries climbed 15.3% to 199,133 units in 2025, while plug-in hybrids more than doubled to 53,484. Battery electric deliveries reached 103,269, although Bendix warned in August 2023 that regenerative braking cuts friction wear and shifts service toward annual corrosion checks.
| Segment Group | Leading Sub-segment | Share, 2025 | Fastest-growing Sub-segment | CAGR, 2026–2035 |
|---|---|---|---|---|
| By Friction Material | Non-Asbestos Organic Pads | 44.0% | Ceramic Pads | 2.70% |
| By Vehicle Type | Passenger Cars and Sport Utility Vehicles | 66.0% | Light Commercial Vehicles | 2.43% |
| By Distribution Channel | Independent Aftermarket Trade | 58.0% | Online Direct Sales | 3.50% |
| By Powertrain | Internal Combustion Vehicles | 84.0% | Hybrid Vehicles | 5.29% |
Request a Free Sample
Fill in your details and we'll send you a free sample report.
- Sample data tables & charts
- Research methodology
Fleet kilometers and heavy vehicle checks sustain orders
Installed fleet replacement demand sets the base volume
Replacement of worn pads on the installed fleet provides the steadiest source of demand, since every vehicle returns to the market on a wear cycle regardless of the new-car year. Demand for brake pads stays anchored to a national fleet of 20,680,152 registered vehicles in January 2022, at an average age of 11.0 years, according to the Victorian Automotive Chamber of Commerce summary of federal data. The Australian Bureau of Statistics counted 255,031 million vehicle kilometers in the year to June 2018, a distance that also shapes tire replacement cycles. As a result, Independent Aftermarket Trade held 58.0% of 2025 value, because older vehicles leave dealer servicing and move to independent workshops.
Premium formulation migration lifts value per set
Migration toward premium brake pads raises the value of each replacement set, even when unit volumes grow slowly. Bosch says its QuietCast range for Australia and New Zealand combines ceramic formulations, zirconia coating and premium shims, and exceeds ECE R90 requirements. DBA separates its road ranges into Street Series, Street Performance and Xtreme Performance, and the latter two carry R90 certification. Price points confirm the step, because Superspares listed Bendix 4WD front pads for the Toyota Hilux at A$104.95 against a A$125.95 list price. In turn, Ceramic Pads grow at 2.70% a year, the fastest rate among friction materials, as motorists and fleets trade up from entry products.
Commercial brake compliance keeps heavy fleets buying
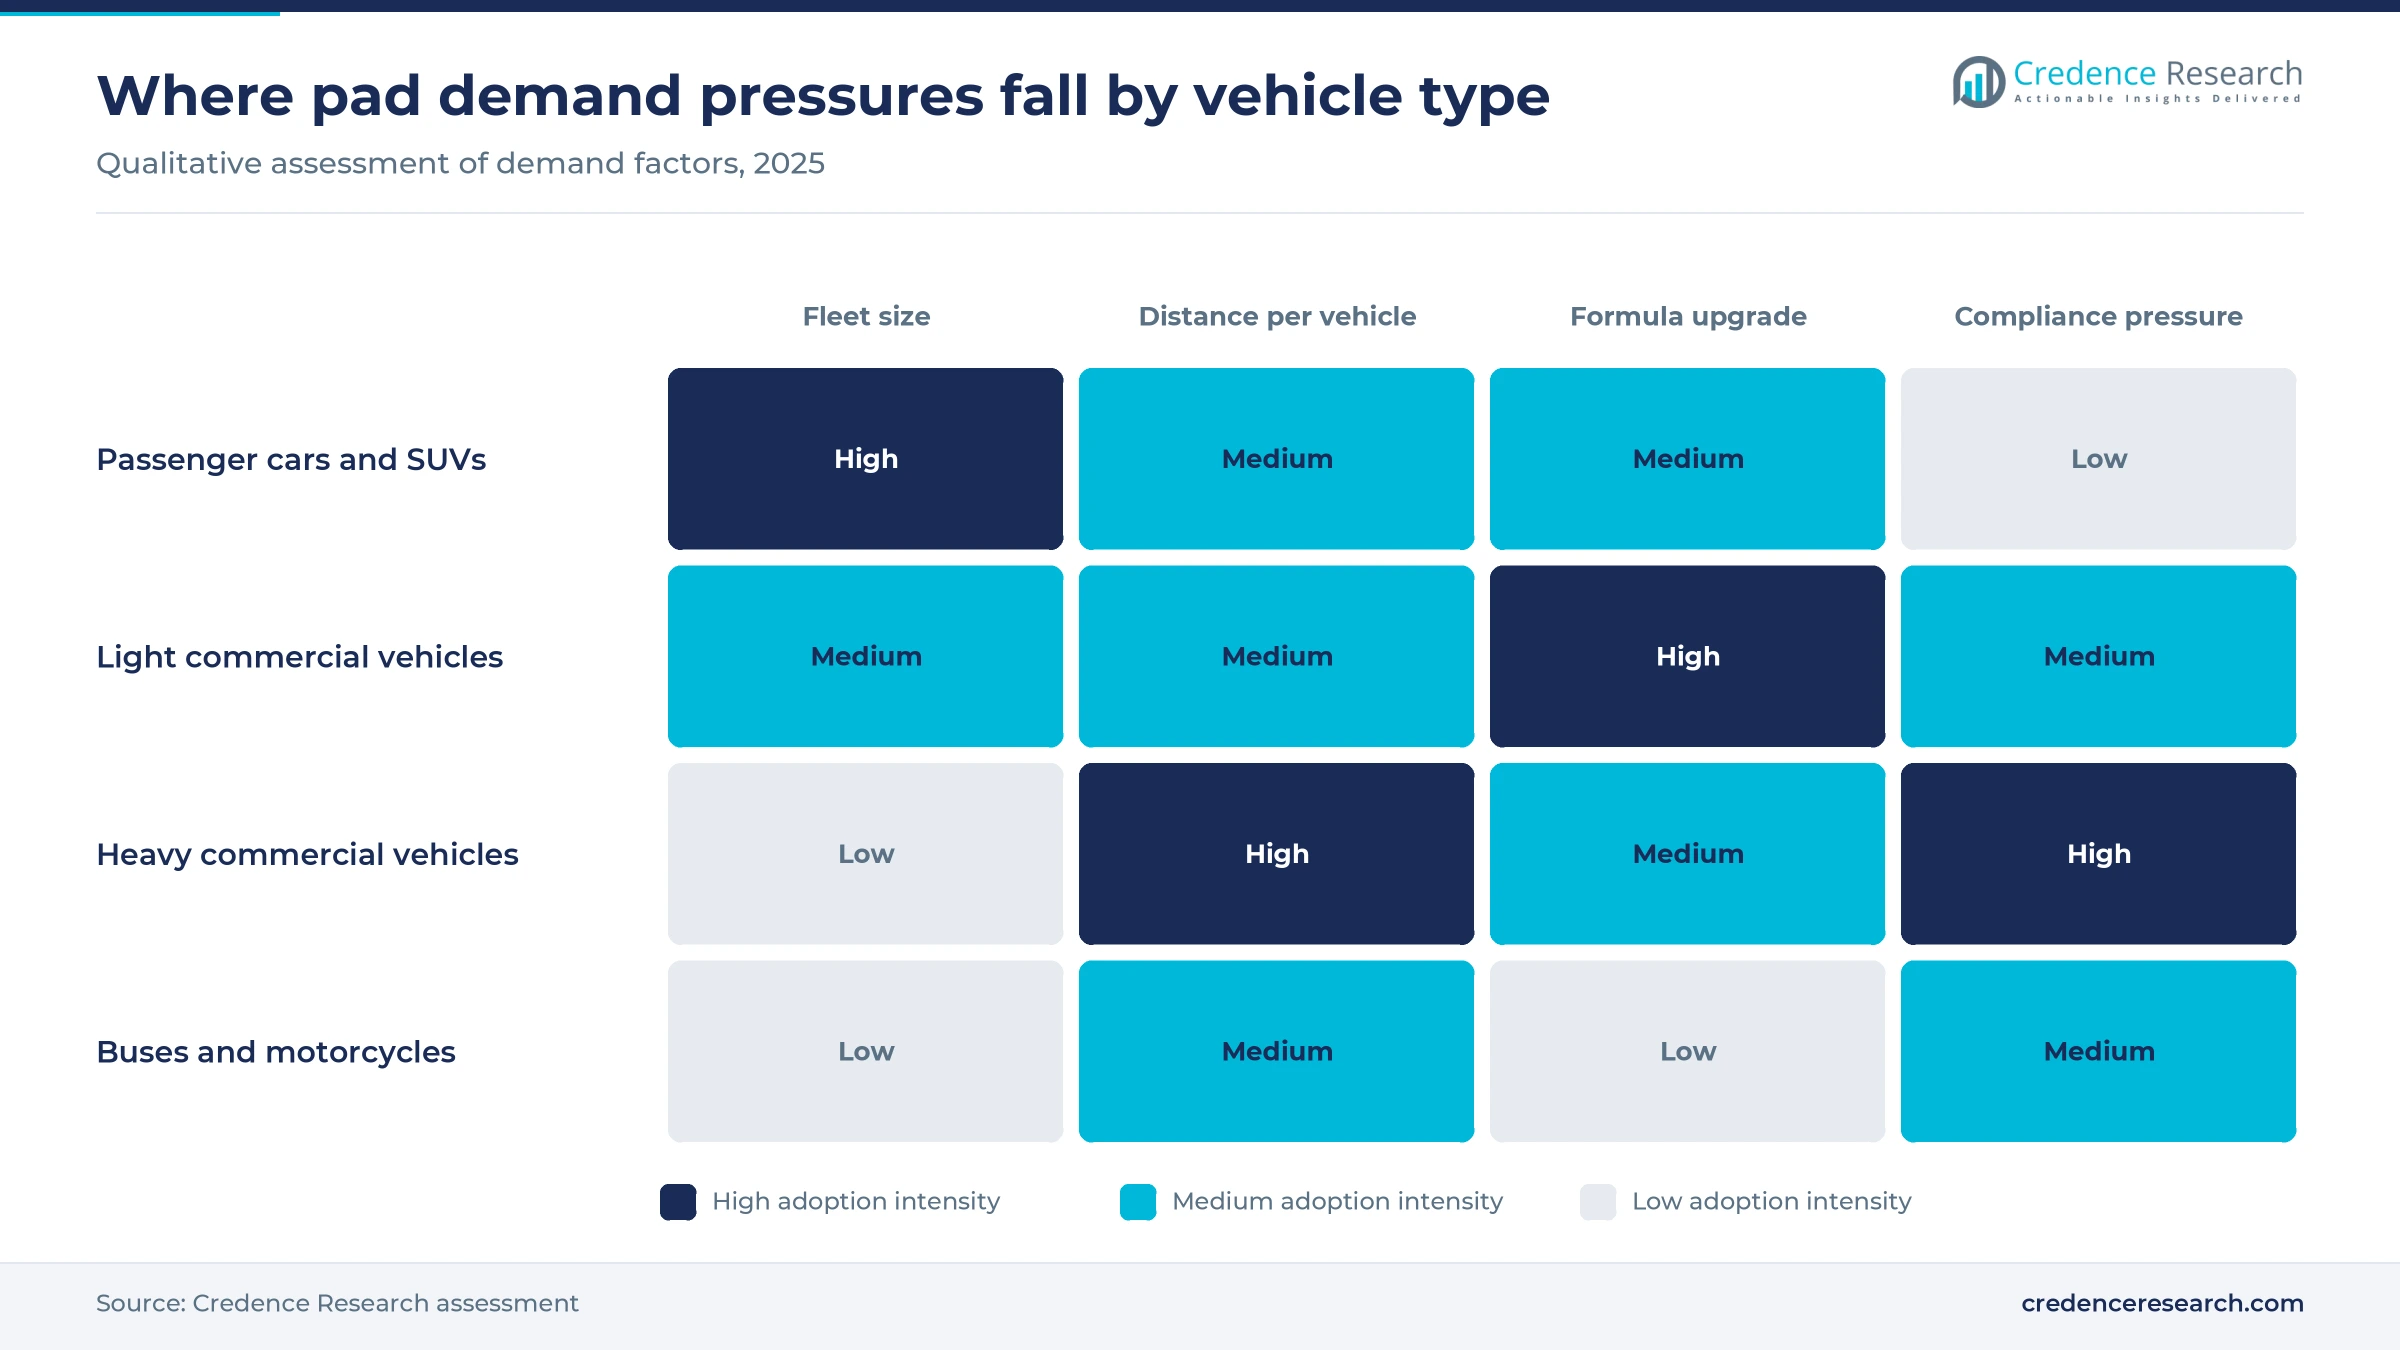
Roadworthiness enforcement turns brake wear into a compliance cost for truck and bus operators, who replace pads before an inspection can ground a vehicle. The National Heavy Vehicle Regulator inspected 9,082 vehicles and combinations in its 2024 survey, reported in March 2025, and brakes were the most common defect. Its inspection manual rejects bonded pads within 3 mm of the mounting surface when the maker's minimum is unknown. Design rules add pressure, since ADR 35/04 brought antilock brakes to medium and heavy trucks from July 1, 2014, according to Trailer Magazine. Exposure is high too, because the Australian Bureau of Statistics recorded 79,400 kilometers a year per articulated truck.
New model coverage pulls demand toward broader catalogs
Rapid brand turnover in new-vehicle sales forces suppliers to add applications, and each new part number creates fresh inventory demand across the trade. The Brake Report recorded on Jan. 31, 2025, that Bendix had expanded its range with pads and shoes covering 14 models, including the BYD ATTO 3, GWM ORA, Hyundai IONIQ 5 and LDV Deliver 9. VFACTS data show why this demand matters, with SUVs alone reaching 757,697 deliveries, or 61.1% of the 2025 market. The Australian Automotive Aftermarket Association also named rapid growth of Chinese-built vehicles as a service-mix issue in its 2025 Critical Issues Report. As a result, distributors with deep catalogs win workshop orders that thin ranges miss.
Copper-free pads and new Chinese models reshape ranges
A shift to copper-free and lower-dust formulas
Copper-free friction material is moving from a niche claim to a standard catalog feature in Australian ranges. Bendix introduced EV-Hybrid pads in 2022 with the AASA LeafMark N rating, which confirms less than 0.5% copper by weight, according to the company. DBA lists its Street Series and Street Performance pads as copper-free, and Bosch makes the same claim for QuietCast. Overseas regulation reinforces this direction, because the European Commission says Euro 7 will regulate brake emissions for the first time worldwide, and a European Parliament summary dates new car and van types from Nov. 29, 2026. Global brands design one formula for many markets, so local catalogs follow.
The rise of Chinese brands and electric models in catalogs
Chinese brands and electric models are now entering pad catalogs within a few years of their local launch, which shortens the old wait for aftermarket coverage. The January 2025 Bendix expansion included the BYD Dolphin, BYD ATTO 3 and GWM ORA. A September 2023 AutoGuru report showed Bendix adding locally designed pads for the Tesla Model 3 and Model Y. VFACTS data reported by CarExpert show plug-in hybrids up 130.9% in 2025 and battery electric deliveries at 8.3% of the market. As a result, Hybrid Vehicles grow at 5.29% a year, the fastest rate among powertrains in the Credence Research estimate.
An opening for local low-volume pad manufacturing
Local manufacturing offers an opening for buyers who value short lead times and application-specific pads, particularly once ownership at Ballarat settles. CarExpert reported in October 2026 that the plant makes more than 1.3 million pad sets a year with about 120 people, and that about 70% of the pads the company sells in Australia are made there. FMP Group invested over A$1 million in a grinding machine in August 2023 to support low-volume, made-to-order production. Disc Brakes Australia separately offers pads and shoes for towing and off-road use. A new owner could therefore pursue fleet and four-wheel-drive programs that long-distance imports serve less quickly.
An opening in electric vehicle brake service
Electric vehicle service offers an opening for workshops and pad suppliers, since the service need changes rather than disappears. Service demand is outrunning skills, because the Australian Automotive Aftermarket Association reported in November 2025 that only 21% of workshops felt equipped for electric vehicles. Bendix advised in August 2023 that friction brakes on these vehicles should be checked at least once a year, because infrequent use can cause corrosion and caliper seizure. Battery electric deliveries reached 103,269 in 2025, and bus fleets add scale, as Transport for NSW plans 1,200 new electric buses in Greater Sydney by 2028. Suppliers that pair corrosion-resistant pads with technician training can therefore win service work that combustion-focused ranges do not address.
Supplier distress and technician gaps test the supply chain
Parent company failures unsettle the leading local brand
Ownership instability at the leading local brand creates supply risk for distributors. First Brands Group, which acquired the FMP business in 2024, filed for Chapter 11 in September 2025, and CarExpert reported the case moved to Chapter 7 on Sept. 1, 2026. FMP Group (Australia) then entered voluntary administration on Oct. 26, 2026, with FTI Consulting receivers and managers appointed the same day, according to Grant Thornton. Trade buyers therefore face uncertainty on terms and continuity, and many will qualify second sources until new owners are confirmed.
A technician shortfall limits how fast services get done
Workshop capacity limits how quickly worn brake pads turn into sales. The Australian Automotive Aftermarket Association put the national technician shortfall at around 40,000 in its 2025 Critical Issues Report, released in November 2025. Independent workshops feel this most, because they carry the largest share of older vehicles. Motorists may then defer brake work until inspection or noise forces it. Suppliers can respond with training, easier-fit kits and bedding-free pads that reduce time in the service bay.
Counterfeit and asbestos risks raise compliance costs
Imported brake pads bring a compliance burden that honest suppliers must absorb, because the national asbestos ban has applied since Dec. 31, 2003. The Department of Infrastructure lists brake pads as a high-risk asbestos component, and vehicles lacking adequate assurance may be held at the border for testing at the owner's cost. CarAdvice recorded a late-2015 recall of counterfeit Toyota brake pads from China that contained asbestos. Bendix says its pads are tested to SAE and ISO standards, which gives buyers a reference.
Weak truck sales and regeneration thin some volumes
Two separate forces reduce pad volume in parts of the market. Truck demand weakened, as Truck Industry Council data reported by Truck and Bus News showed 33,727 trucks and heavy vans sold in the first nine months of 2025, down 11.8%. This decline trims original equipment allocation for trucks and heavier vans. Regenerative braking also cuts friction wear on hybrids and electric vehicles, so a growing part of the fleet replaces pads less often. Suppliers must therefore defend revenue through higher-value formulas and corrosion-focused service products.
New South Wales leads while Queensland grows fastest
| State | Value, 2025 (USD million) | Share, 2025 | CAGR, 2026–2035 |
|---|---|---|---|
| New South Wales | 272.8 | 40.2% | 1.84% |
| Victoria | 202.9 | 29.9% | 1.89% |
| Queensland | 167.6 | 24.7% | 2.24% |
| Remaining States and Territories | 35.3 | 5.2% | 2.04% |
New South Wales leads on distance and bus fleet scale
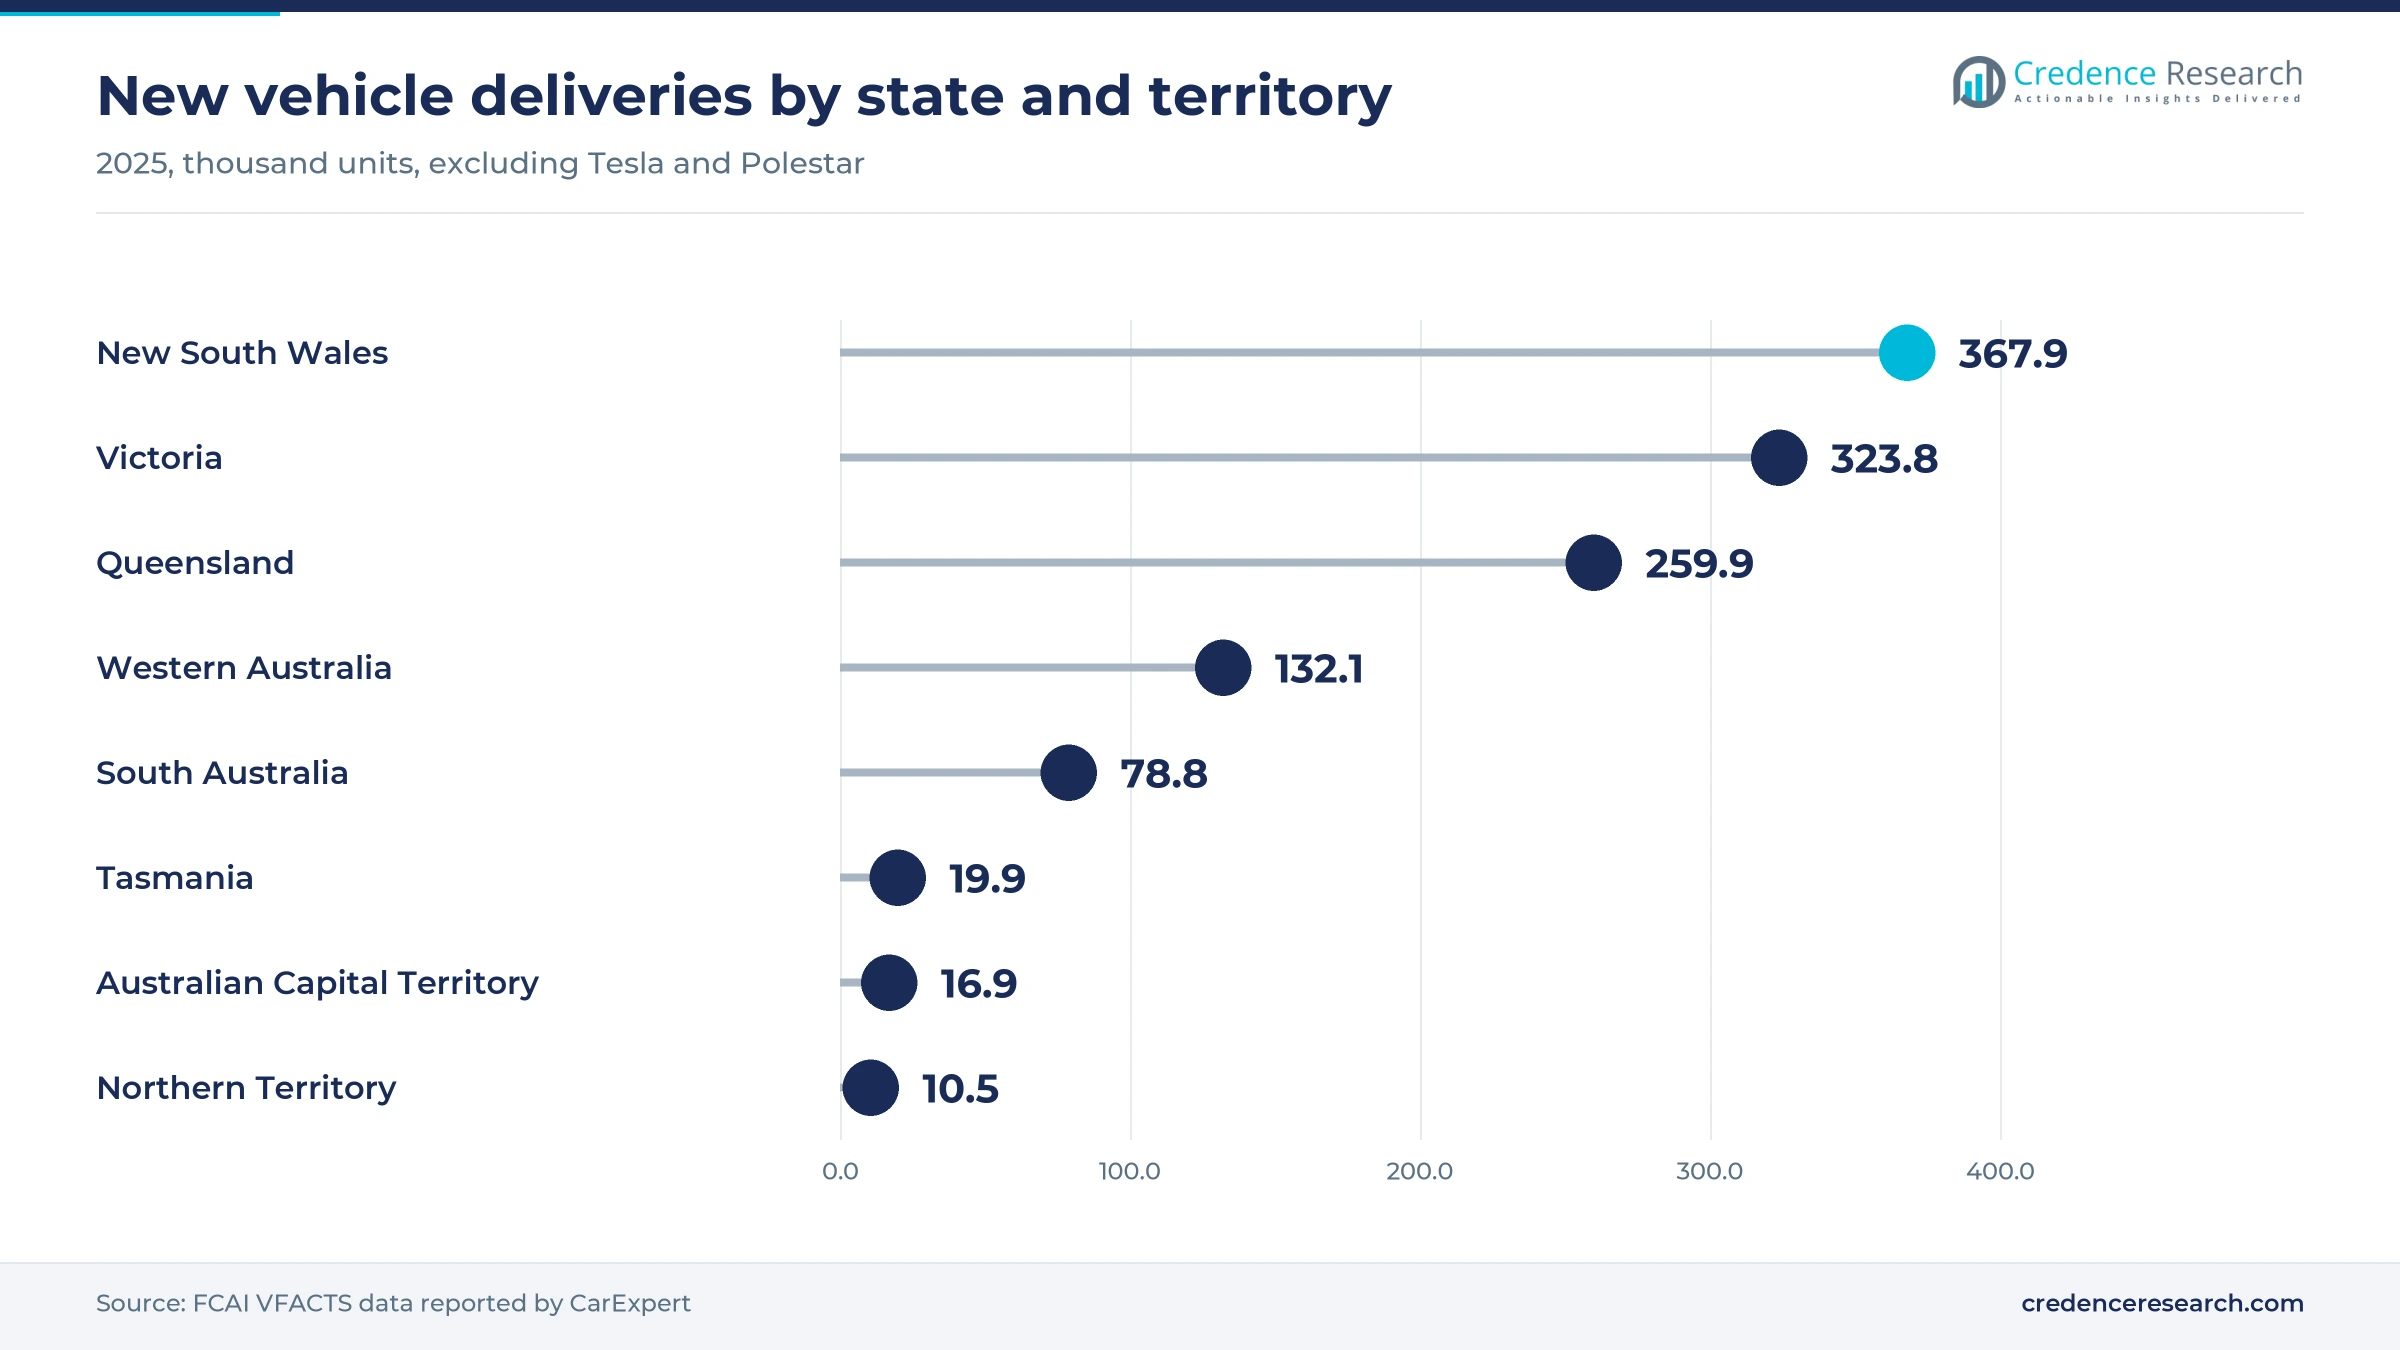
New South Wales held 40.2% of 2025 value and grows at 1.84% a year. The Australian Bureau of Statistics recorded 74,566 million vehicle kilometers there in the year to June 2018, ahead of Victoria, and VFACTS counted 367,947 deliveries in 2025. Bus operators add heavy-duty demand, since Transport for NSW plans to move roughly 8,000 public transport buses to zero emissions by 2047. Because Sydney also hosts dense stop-start traffic, pad wear per kilometer tends to run high.
Victoria pairs high vehicle use with local manufacturing
Victoria held 29.9% of 2025 value and grows at 1.89% a year. Its vehicles averaged 14,100 kilometers a year in the Australian Bureau of Statistics survey for 2018, the highest of any state, across 68,030 million total kilometers. VFACTS recorded 323,768 new vehicle deliveries in the state during 2025. State demand also sits beside the Ballarat plant that makes more than 1.3 million pad sets a year, and the company keeps a Melbourne sales office, so ownership news from FMP Group affects Victorian jobs directly.
Queensland grows fastest on fleet expansion
Queensland held 24.7% of 2025 value and grows at 2.24% a year, the fastest rate among the states. Demand here rests on a registered fleet that expanded 2.7% in the year to January 2022, well ahead of 1.6% in New South Wales, according to the Victorian Automotive Chamber of Commerce summary of federal data. Vehicles there averaged 13,700 kilometers a year in the 2018 federal survey, and VFACTS counted 259,903 deliveries in 2025. Long regional distances and towing also favor heavy-duty and four-wheel-drive pads.
Remaining states hold less value share than delivery share
Remaining States and Territories held 5.2% of 2025 value and grow at 2.04% a year. VFACTS counted 132,067 deliveries in Western Australia and 78,811 in South Australia in 2025, with Tasmania, the Australian Capital Territory and the Northern Territory adding 47,312 more. These five areas took about 21% of state-reported deliveries, well above their value share in this report. That value share is a Credence Research estimate weighted to the eastern states, and it carries the widest margin in the regional model.
Dated moves that changed pad supply since 2025
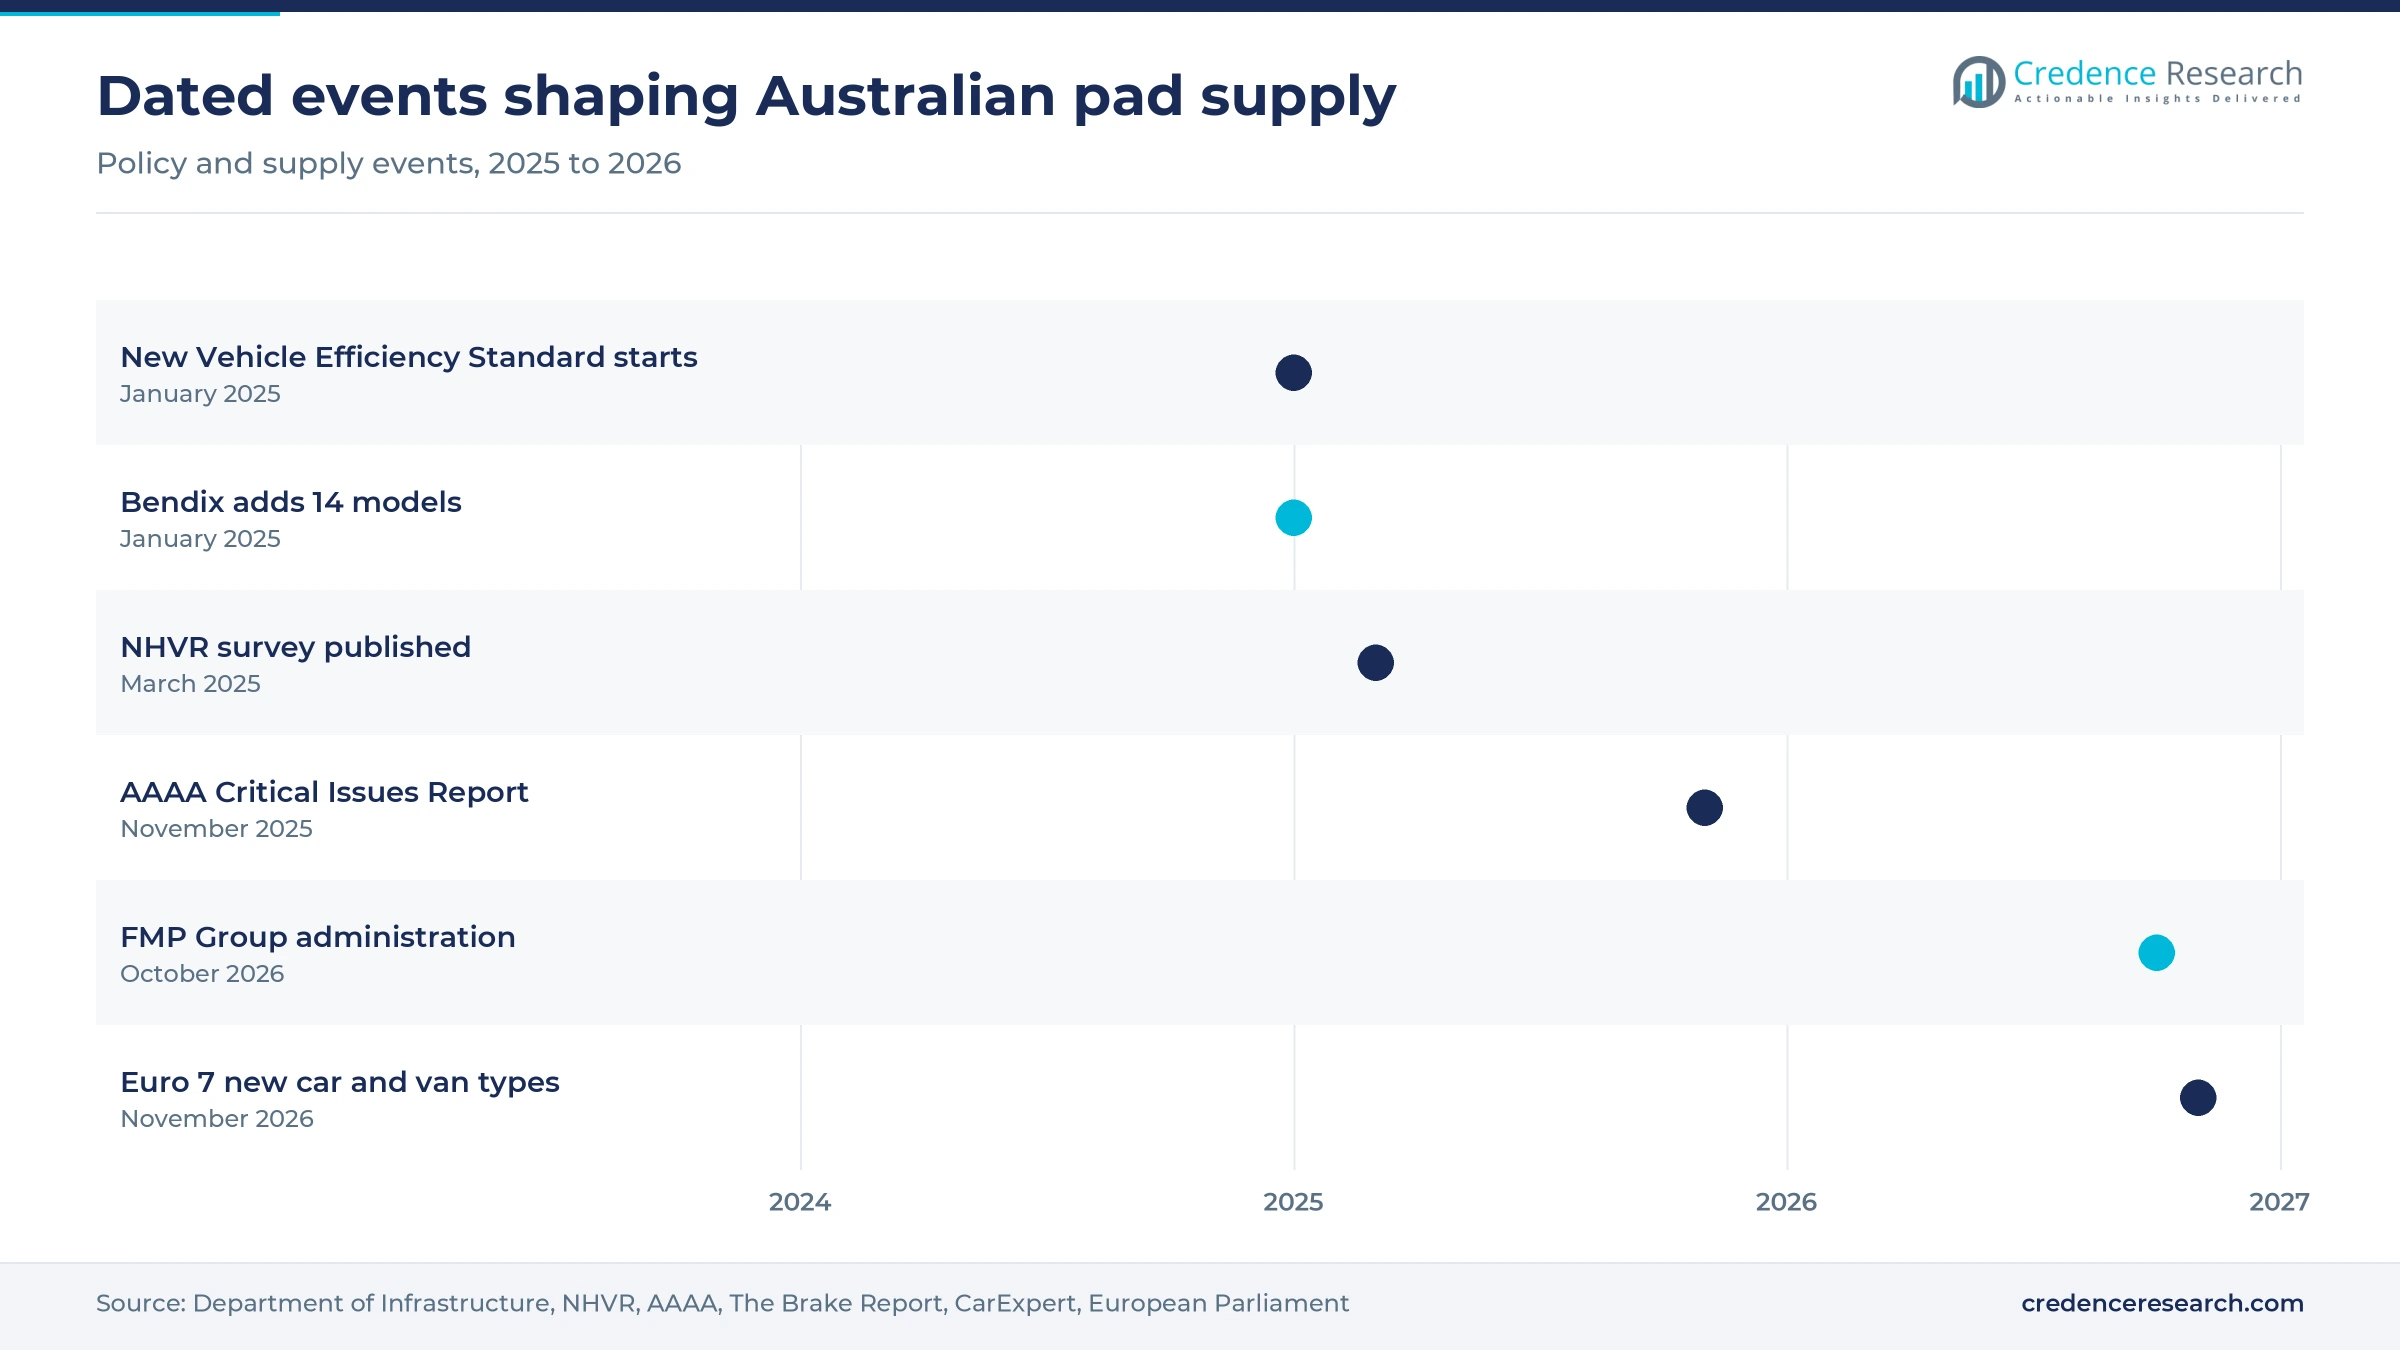
| Development | Status and market relevance |
|---|---|
| In January 2025, Bendix added pads and shoes for 14 models, including the BYD ATTO 3, BYD Dolphin and GWM ORA, according to The Brake Report. | Released, widening catalog coverage for new brands |
| In January 2025, the New Vehicle Efficiency Standard commenced, with manufacturers earning credits and accruing penalties from July 1, 2025, according to the Department of Infrastructure. | In force, supporting hybrid and electric supply |
| In March 2025, the National Heavy Vehicle Regulator published its 2024 survey of 9,082 vehicles and combinations, with brakes the most common defect. | Published, sharpening fleet attention on brake condition |
| In November 2025, the Australian Automotive Aftermarket Association released its Critical Issues Report, citing a shortfall of around 40,000 technicians. | Published, showing workshop capacity limits |
| In October 2026, FMP Group (Australia), the company behind Bendix, entered voluntary administration on Oct. 26, with FTI Consulting receivers and managers appointed the same day, according to Grant Thornton. | In administration and receivership, still trading |
Formulation and backing design now separate the ranges
- Copper-free friction material limits copper to under 0.5% by weight on pads with the AASA LeafMark N rating, as on the Bendix EV-Hybrid range.
- Ceramic formulations combine with zirconia coating on Bosch QuietCast pads to reduce wear on both the pad and the rotor, according to Bosch.
- Transfer film chemistry keeps a protective layer on the rotor of hybrid and electric vehicles, which Bendix says helps prevent corrosion when friction brakes see little use.
- Precision grinding cuts angled grooves and chamfers into finished pads, a capability FMP Group added at Ballarat through a custom machine in August 2023.
Need a Custom Version of This Report?
Tailor the scope, geography, or segments to your exact requirements.
- Custom geography or segment scope
- Direct access to our analyst team
Local engineering competes with global friction brands
Competition splits between brands with local engineering and global friction suppliers that sell through Australian distributors. Bendix holds a strong local position, because its Ballarat plant supplies most of the pads the company sells in Australia and its catalog added 14 models in January 2025. Disc Brakes Australia competes on application-specific ranges for street, towing and off-road use, with two R90-certified road ranges. Bosch sells QuietCast through named Australian stockists, including Supercheap Auto on an order-in basis, and competes on ceramic chemistry and noise control. ZF Aftermarket (TRW), Ferodo (DRiV), Akebono Brake Industry, ATE, Nisshinbo Brake, EBC Brakes and Brembo are also tracked in the competitive field. Trade buyers compare catalog depth, delivery frequency and warranty support, and price comparison is sharper online. The FMP Group administration may open shelf space for rivals if distributors decide to qualify second sources during the sale process.
Companies profiled and their roles in this market
| Company | Type | Role in the market |
|---|---|---|
| Bendix (FMP Group Australia) | Local manufacturer | Ballarat plant, more than 1.3 million pad sets a year, in administration and receivership since Oct. 26, 2026, still trading |
| Disc Brakes Australia | Australian brand | Street, Street Performance, Xtreme and Race pad ranges, two with R90 certification |
| Bosch Mobility Aftermarket | Global supplier | QuietCast ceramic pads with zirconia coating, sold through named Australian stockists |
Replacement stability hides a supply question at Ballarat
Credence Research's view is that the market looks stable on the surface, but its supply side is less settled than at any recent point. Slow value growth of 1.97% a year suits a mature fleet, and replacement demand will not fade because the fleet keeps traveling. The sharper question is who owns and funds the country's main pad plant after the administration of FMP Group. Distributors should qualify second sources now, while suppliers with deep hybrid and Chinese-brand catalogs should expect shelf gains, because those vehicles enter the replacement cycle within this decade.
How Credence Research built these estimates
The report uses 2025 as the base year and 2035 as the forecast year. Market values come from the Credence Research model, and state, segment and growth splits are Credence Research estimates checked against vehicle, distance and price data. Public sources used include Australian Bureau of Statistics and federal transport data, regulator publications, industry association reports, company releases, retailer price listings and trade press. No interviews or surveys were conducted for this edition of the report.
Slow value growth with a richer product mix to 2035
The market reaches USD 847.3 million by 2035, with growth tied to fleet size and distance traveled rather than new-vehicle volume. Value per set of brake pads should keep rising as ceramic and copper-free formulas spread, while hybrids and electric vehicles reduce replacement frequency on a growing share of the fleet. Queensland should keep gaining state share through the forecast period. Buyers will watch the outcome at Ballarat closely, since local capacity influences lead times and fleet programs. Suppliers that combine broad catalogs with workshop training are best placed through the next decade.
Frequently Asked Questions
How big is the Australia brake pads market?
Which state leads Australian brake pad demand?
Which friction material is largest?
What is the fastest-growing distribution channel?
How do hybrids and electric vehicles affect pad demand?
Why does the FMP Group administration matter?
Which rules affect heavy vehicle brake pads?
Which companies does the report track?
Table of Content
Chapter 1 Market Segmentation
- 1.1 Segmentation Framework
- 1.1.1 Product and Service Classification
- 1.1.2 Application and End-Use Classification
- 1.1.3 Technology and Solution Classification
- 1.1.4 Customer and Distribution Channel Classification
- 1.1.5 Geographic Segmentation
- 1.1.6 Market Segment Definitions and Boundaries
- 1.2 By Friction Material
- 1.2.1 Non-Asbestos Organic Pads
- 1.2.2 Ceramic Pads
- 1.2.3 Metallic Pads
- 1.2.4 Specialty Pads
- 1.3 By Vehicle Type
- 1.3.1 Passenger Cars and Sport Utility Vehicles
- 1.3.2 Light Commercial Vehicles
- 1.3.3 Heavy Commercial Vehicles
- 1.3.4 Buses and Motorcycles
- 1.4 By Powertrain
- 1.4.1 Internal Combustion Vehicles
- 1.4.2 Hybrid Vehicles
- 1.4.3 Battery Electric Vehicles
- 1.5 By State
- 1.5.1 New South Wales
- 1.5.2 Victoria
- 1.5.3 Queensland
- 1.5.4 Remaining States and Territories
Chapter 2 Introduction
- 2.1 Report Objectives and Scope
- 2.2 Product Definition and Industry Terminology
- 2.3 Market Inclusions and Exclusions
- 2.4 Research Process
- 2.4.1 Primary Research and Expert Interviews
- 2.4.2 Secondary Research and Source Review
- 2.4.3 Top-Down and Bottom-Up Estimation
- 2.4.4 Data Triangulation and Verification
- 2.5 Market Size Measurement Basis
- 2.5.1 2025: USD 678.5 million → 2035: USD 847.3 million
- 2.6 Historical and Forecast Reference Periods
- 2.6.1 Historical Period: 2018-2025
- 2.6.2 Base Year: 2025
- 2.6.3 Forecast Period: 2025-2035
- 2.7 Research Assumptions and Limitations
Chapter 3 Executive Summary
- 3.1 Market Snapshot and Key Findings
- 3.2 Base-Year Market Size, 2025
- 3.3 Forecast Market Size, 2035
- 3.4 Revenue and Volume Growth Outlook
- 3.5 Key Demand and Supply Indicators
- 3.6 Leading Market Segments
- 3.7 Fastest-Growing Market Opportunities
- 3.8 Regional Performance Highlights
- 3.9 Technology and Industry Transformation
- 3.10 Competitive Landscape Summary
- 3.11 Analyst View and Strategic Implications
Chapter 4 Australia Brake Pads Market Trends and Developments
- 4.1 Historical Industry Development, 2018-2025
- 4.2 Recent Market Trends and Developments
- 4.3 Demand and Customer Behavior Trends
- 4.4 Technology and Product Innovation
- 4.5 Artificial Intelligence, Automation and Digitalization
- 4.6 Local Manufacturing and Supply Chain Realignment
- 4.7 Industry Partnerships, Mergers and Acquisitions
- 4.8 Sustainability and Circular Economy Developments
- 4.9 Government and Private Sector Investment Trends
- 4.10 Emerging Business Models and Commercialization
- 4.11 Industry Developments and Announcements
Chapter 5 Australia Brake Pads Market Production, Supply and Demand Analysis
- 5.1 Demand Trend and Consumption Analysis, 2018-2025
- 5.2 Demand Forecast, 2025-2035
- 5.3 Production and Output Trend, 2018-2025
- 5.4 Production and Output Forecast, 2025-2035
- 5.5 Installed Capacity and Capacity Utilization
- 5.6 Company-Wise Production Plants and Statistics
- 5.6.1 Installed Production Capacity
- 5.6.2 Actual Production
- 5.6.3 Planned Capacity and Expansion Targets
- 5.7 Supply Chain Structure and Procurement Trends
- 5.8 Supply-Demand Gap and Bottlenecks
- 5.9 Import Dependence and Sourcing Structure
- 5.10 Contract Manufacturing and Outsourcing
- 5.11 Regional Supply and Demand Concentration
Chapter 6 Australia Brake Pads Market Pricing Analysis
- 6.1 Pricing Structure and Measurement
- 6.2 Historical Pricing Trends, 2018-2025
- 6.3 Pricing Outlook, 2025-2035
- 6.4 Average Selling Price and Unit Economics
- 6.5 Pricing by Product and Market Segment
- 6.6 Geographic Pricing Differences
- 6.7 Key Input, Energy, Labor and Logistics Costs
- 6.8 Contract Pricing and Purchasing Models
- 6.9 Pricing Sensitivity and Competitive Positioning
- 6.10 Price, Margin and Profitability Implications
Chapter 7 Australia Brake Pads Market Dynamics
- 7.1 Market Growth Drivers
- 7.1.1 Demand-Side Drivers
- 7.1.2 Technology and Innovation Drivers
- 7.1.3 Infrastructure and Investment Drivers
- 7.1.4 Regulatory and Policy Drivers
- 7.2 Market Restraints
- 7.2.1 Cost and Affordability Constraints
- 7.2.2 Technology and Adoption Barriers
- 7.2.3 Supply Chain and Operational Constraints
- 7.3 Market Challenges
- 7.3.1 Competitive Pressure and Margin Erosion
- 7.3.2 Skills, Infrastructure and Implementation Gaps
- 7.4 Emerging Market Opportunities
- 7.5 Market Dynamics Impact and Time-Horizon Assessment
Chapter 8 Australia Brake Pads Value Chain Analysis
- 8.1 Industry Value Chain Overview
- 8.2 Upstream Suppliers and Critical Inputs
- 8.3 Technology and Component Providers
- 8.4 Manufacturing or Service Delivery
- 8.5 Distribution, Channel Partners and Integrators
- 8.6 Downstream Applications and End Users
- 8.7 Value Addition and Profit Pools
- 8.8 Vertical Integration and Outsourcing
- 8.9 Supplier Concentration and Risk
- 8.10 Supply Chain Localization and Resilience
Chapter 9 Australia Brake Pads Market Regulations and Policies
- 9.1 Relevant Laws, Standards and Compliance Frameworks
- 9.2 Product, Service, Safety and Quality Requirements
- 9.3 Government Policies, Incentives and Subsidies
- 9.4 Imports, Exports and Trade Barriers
- 9.5 Public Procurement and Local Content Requirements
- 9.6 Environmental and Sustainability Compliance
- 9.7 Upcoming Policy Changes and Market Implications
Chapter 10 Australia Brake Pads Market Hotspots and Opportunities
- 10.1 Market Opportunity Mapping and Growth Hotspots
- 10.2 High-Growth Applications and Customer Groups
- 10.3 Underserved Markets and White-Space Opportunities
- 10.4 Emerging Technology and Product Opportunities
- 10.5 New Capacity and Investment Hotspots
- 10.6 Market Entry and Expansion Opportunities
- 10.7 Distribution and Partnership Opportunities
- 10.8 Near-Term and Long-Term Commercial Potential
- 10.9 Opportunity Attractiveness and Execution Risks
Chapter 11 Australia Brake Pads Market Outlook, 2025-2035
- 11.1 Market Size and Analysis
- 11.1.1 Revenue (Market Measurement: 2025: USD 678.5 million → 2035: USD 847.3 million)
- 11.1.2 Market Volume and Quantity Sold
- 11.1.3 Historical Market Size, 2018-2025
- 11.1.4 Base-Year Market Size, 2025
- 11.2 Market Forecast, 2025-2035
- 11.2.1 Revenue Forecast to 2035
- 11.2.2 Volume Forecast to 2035
- 11.2.3 CAGR and Year-on-Year Growth
- 11.2.4 Incremental Revenue Opportunity
- 11.3 Forecast Assumptions and Scenario Analysis
- 11.3.1 Base-Case Forecast
- 11.3.2 Optimistic and Conservative Scenarios
- 11.3.3 Technology, Pricing and Policy Sensitivities
- 11.4 Market Attractiveness and Growth Outlook
Chapter 12 Australia Brake Pads Market Segmentation and Outlook
- 12.1 Segmentation Summary and Market Shares, 2025
- 12.2 Largest and Fastest-Growing Segments
- 12.3 By Friction Material - Market Size and Forecast, 2025-2035
- 12.3.1 Segment Definition and Scope
- 12.3.2 Historical Market Size, 2018-2025
- 12.3.3 Revenue Forecast, 2025-2035
- 12.3.4 Volume Forecast, 2025-2035
- 12.3.5 Base-Year Market Share, 2025
- 12.3.6 Segment CAGR and Growth Drivers
- 12.3.7 Subsegment Market Size and Forecast
- 12.3.7.1 Non-Asbestos Organic Pads
- 12.3.7.2 Ceramic Pads
- 12.3.7.3 Metallic Pads
- 12.3.7.4 Specialty Pads
- 12.3.8 Subsegment Pricing and Adoption Trends
- 12.3.9 Leading Suppliers and Competition
- 12.3.10 Regional Demand and Opportunities
- 12.4 By Vehicle Type - Market Size and Forecast, 2025-2035
- 12.4.1 Segment Definition and Scope
- 12.4.2 Historical Market Size, 2018-2025
- 12.4.3 Revenue Forecast, 2025-2035
- 12.4.4 Volume Forecast, 2025-2035
- 12.4.5 Base-Year Market Share, 2025
- 12.4.6 Segment CAGR and Growth Drivers
- 12.4.7 Subsegment Market Size and Forecast
- 12.4.7.1 Passenger Cars and Sport Utility Vehicles
- 12.4.7.2 Light Commercial Vehicles
- 12.4.7.3 Heavy Commercial Vehicles
- 12.4.7.4 Buses and Motorcycles
- 12.4.8 Subsegment Pricing and Adoption Trends
- 12.4.9 Leading Suppliers and Competition
- 12.4.10 Regional Demand and Opportunities
- 12.5 By Powertrain - Market Size and Forecast, 2025-2035
- 12.5.1 Segment Definition and Scope
- 12.5.2 Historical Market Size, 2018-2025
- 12.5.3 Revenue Forecast, 2025-2035
- 12.5.4 Volume Forecast, 2025-2035
- 12.5.5 Base-Year Market Share, 2025
- 12.5.6 Segment CAGR and Growth Drivers
- 12.5.7 Subsegment Market Size and Forecast
- 12.5.7.1 Internal Combustion Vehicles
- 12.5.7.2 Hybrid Vehicles
- 12.5.7.3 Battery Electric Vehicles
- 12.5.8 Subsegment Pricing and Adoption Trends
- 12.5.9 Leading Suppliers and Competition
- 12.5.10 Regional Demand and Opportunities
- 12.6 By State - Market Size and Forecast, 2025-2035
- 12.6.1 Segment Definition and Scope
- 12.6.2 Historical Market Size, 2018-2025
- 12.6.3 Revenue Forecast, 2025-2035
- 12.6.4 Volume Forecast, 2025-2035
- 12.6.5 Base-Year Market Share, 2025
- 12.6.6 Segment CAGR and Growth Drivers
- 12.6.7 Subsegment Market Size and Forecast
- 12.6.7.1 New South Wales
- 12.6.7.2 Victoria
- 12.6.7.3 Queensland
- 12.6.7.4 Remaining States and Territories
- 12.6.8 Subsegment Pricing and Adoption Trends
- 12.6.9 Leading Suppliers and Competition
- 12.6.10 Regional Demand and Opportunities
- 12.7 Segment Growth Comparison
- 12.8 Segment Attractiveness and Priority Matrix
Chapter 13 Australia Brake Pads Geographic Market Outlook, 2025-2035
- 13.1 Domestic Market Distribution and Demand Clusters
- 13.2 State- or Province-Wise Market Size and Forecast, 2025-2035
- 13.3 City and Metropolitan Market Outlook
- 13.4 Industrial, Manufacturing and Commercial Clusters
- 13.5 Geographic Concentration of Key End Users
- 13.6 Local Pricing and Purchasing Differences
- 13.7 Domestic Production Facilities and Capacity Map
- 13.8 Local Infrastructure and Project Pipeline
- 13.9 State-Level Policy and Incentive Differences
- 13.10 Subnational Investment Hotspots and Opportunities
- 13.11 Distribution and Logistics Networks
- 13.12 Domestic Competitive Footprint
Chapter 14 Australia Brake Pads Technology, Innovation and Sustainability Outlook
- 14.1 Technology Landscape and Maturity
- 14.2 Product, Process and Service Innovation
- 14.3 AI, Automation and Digital Tools in the Industry
- 14.4 Technology Adoption and Performance Benchmarking
- 14.5 Innovation Pipeline and R&D Investment
- 14.6 Patent and Intellectual Property Trends
- 14.7 Energy Efficiency and Resource Management
- 14.8 Sustainability, Recycling and Circularity
- 14.9 Technology Roadmap, 2025-2035
- 14.10 Risks of Obsolescence and Technology Substitution
Chapter 15 Australia Brake Pads Market Key Strategic Imperatives
- 15.1 Growth and Market Entry Priorities
- 15.2 High-Return Products and Segments
- 15.3 Pricing, Profitability and Cost Optimization
- 15.4 Technology Investment and Product Differentiation
- 15.5 Supply Chain Localization and Resilience
- 15.6 Distribution and Customer Acquisition
- 15.7 Partnership, Acquisition and Capacity Strategy
- 15.8 Regional Expansion Priorities
- 15.9 Short-, Medium- and Long-Term Actions
Chapter 16 Competition Outlook
- 16.1 Industry Competition Characteristics
- 16.2 Market Structure and Concentration
- 16.3 Market Share and Competitive Positioning, 2025
- 16.4 Company-Wise Revenue and Product Benchmarking
- 16.5 Production and Service Capacity Benchmarking
- 16.6 Technology, Pricing and Differentiation
- 16.7 Regional Footprint and Distribution Strength
- 16.8 Mergers, Acquisitions and Strategic Alliances
- 16.9 New Entrants and Competitive Threats
- 16.10 Porter's Five Forces and Industry Attractiveness
- 16.11 Competitive Outlook, 2025-2035
Chapter 17 Company Profiles
- 17.1 Company Coverage and Selection Criteria
- 17.2 Bendix (FMP Group Australia)
- 17.2.1 Business Description
- 17.2.2 Company Ownership and Geographic Presence
- 17.2.3 Product and Service Portfolio
- 17.2.4 Manufacturing and Operating Footprint
- 17.2.5 Production Capacity and Expansion Plans
- 17.2.6 Financial Performance and Investment
- 17.2.7 Market Share and Competitive Position
- 17.2.8 Technology and Innovation Capabilities
- 17.2.9 Strategic Alliances or Partnerships
- 17.2.10 Recent Developments
- 17.2.11 Growth Strategy and Outlook
- 17.3 Bosch Mobility Aftermarket
- 17.4 ZF Aftermarket (TRW)
- 17.5 Ferodo (DRiV)
- 17.6 Disc Brakes Australia
- 17.7 Akebono Brake Industry
- 17.8 ATE
- 17.9 Nisshinbo Brake
- 17.10 EBC Brakes
- 17.11 Brembo
- 17.12 Other Relevant Market Participants
Note: Every listed company is profiled on the structure shown under the first company. The company list is preliminary and may change based on research findings, market developments, data availability and client requirements.
Chapter 18 Disclaimer
- 18.1 Research and Forecast Disclaimer
- 18.2 Data Source and Estimation Limitations
Note: The depth of individual sections depends on data availability for this market. Volume, capacity, trade and other unit-based metrics are included where applicable.

