
Asia Pacific transportation automation tracks vehicle output
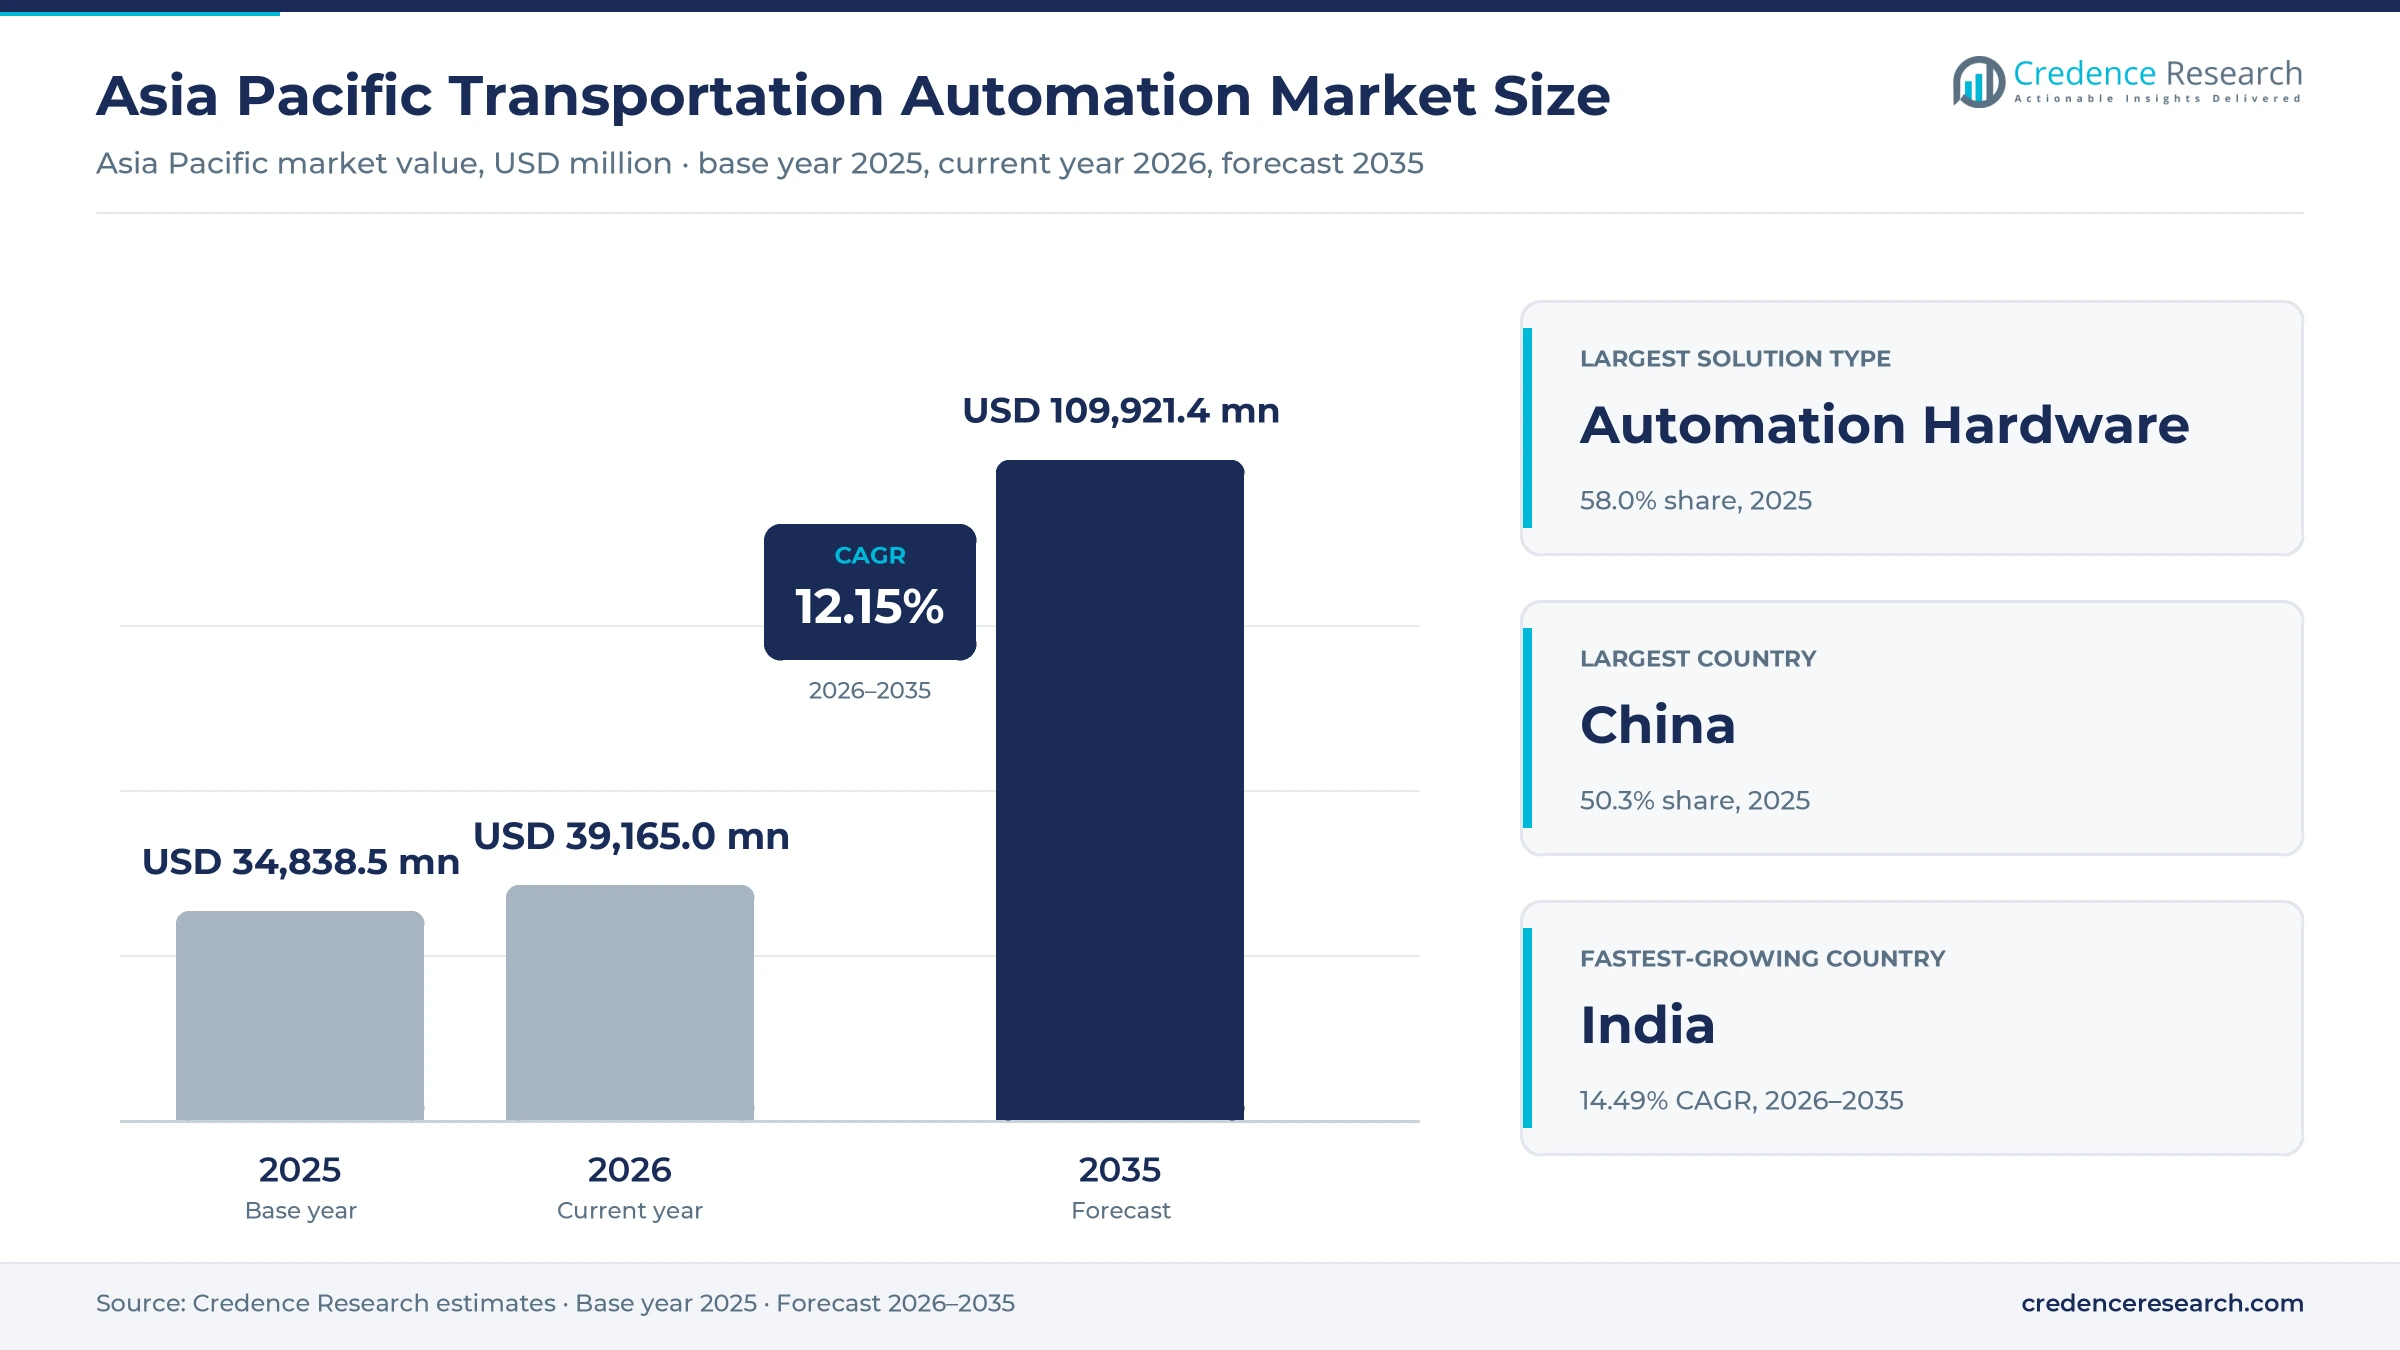
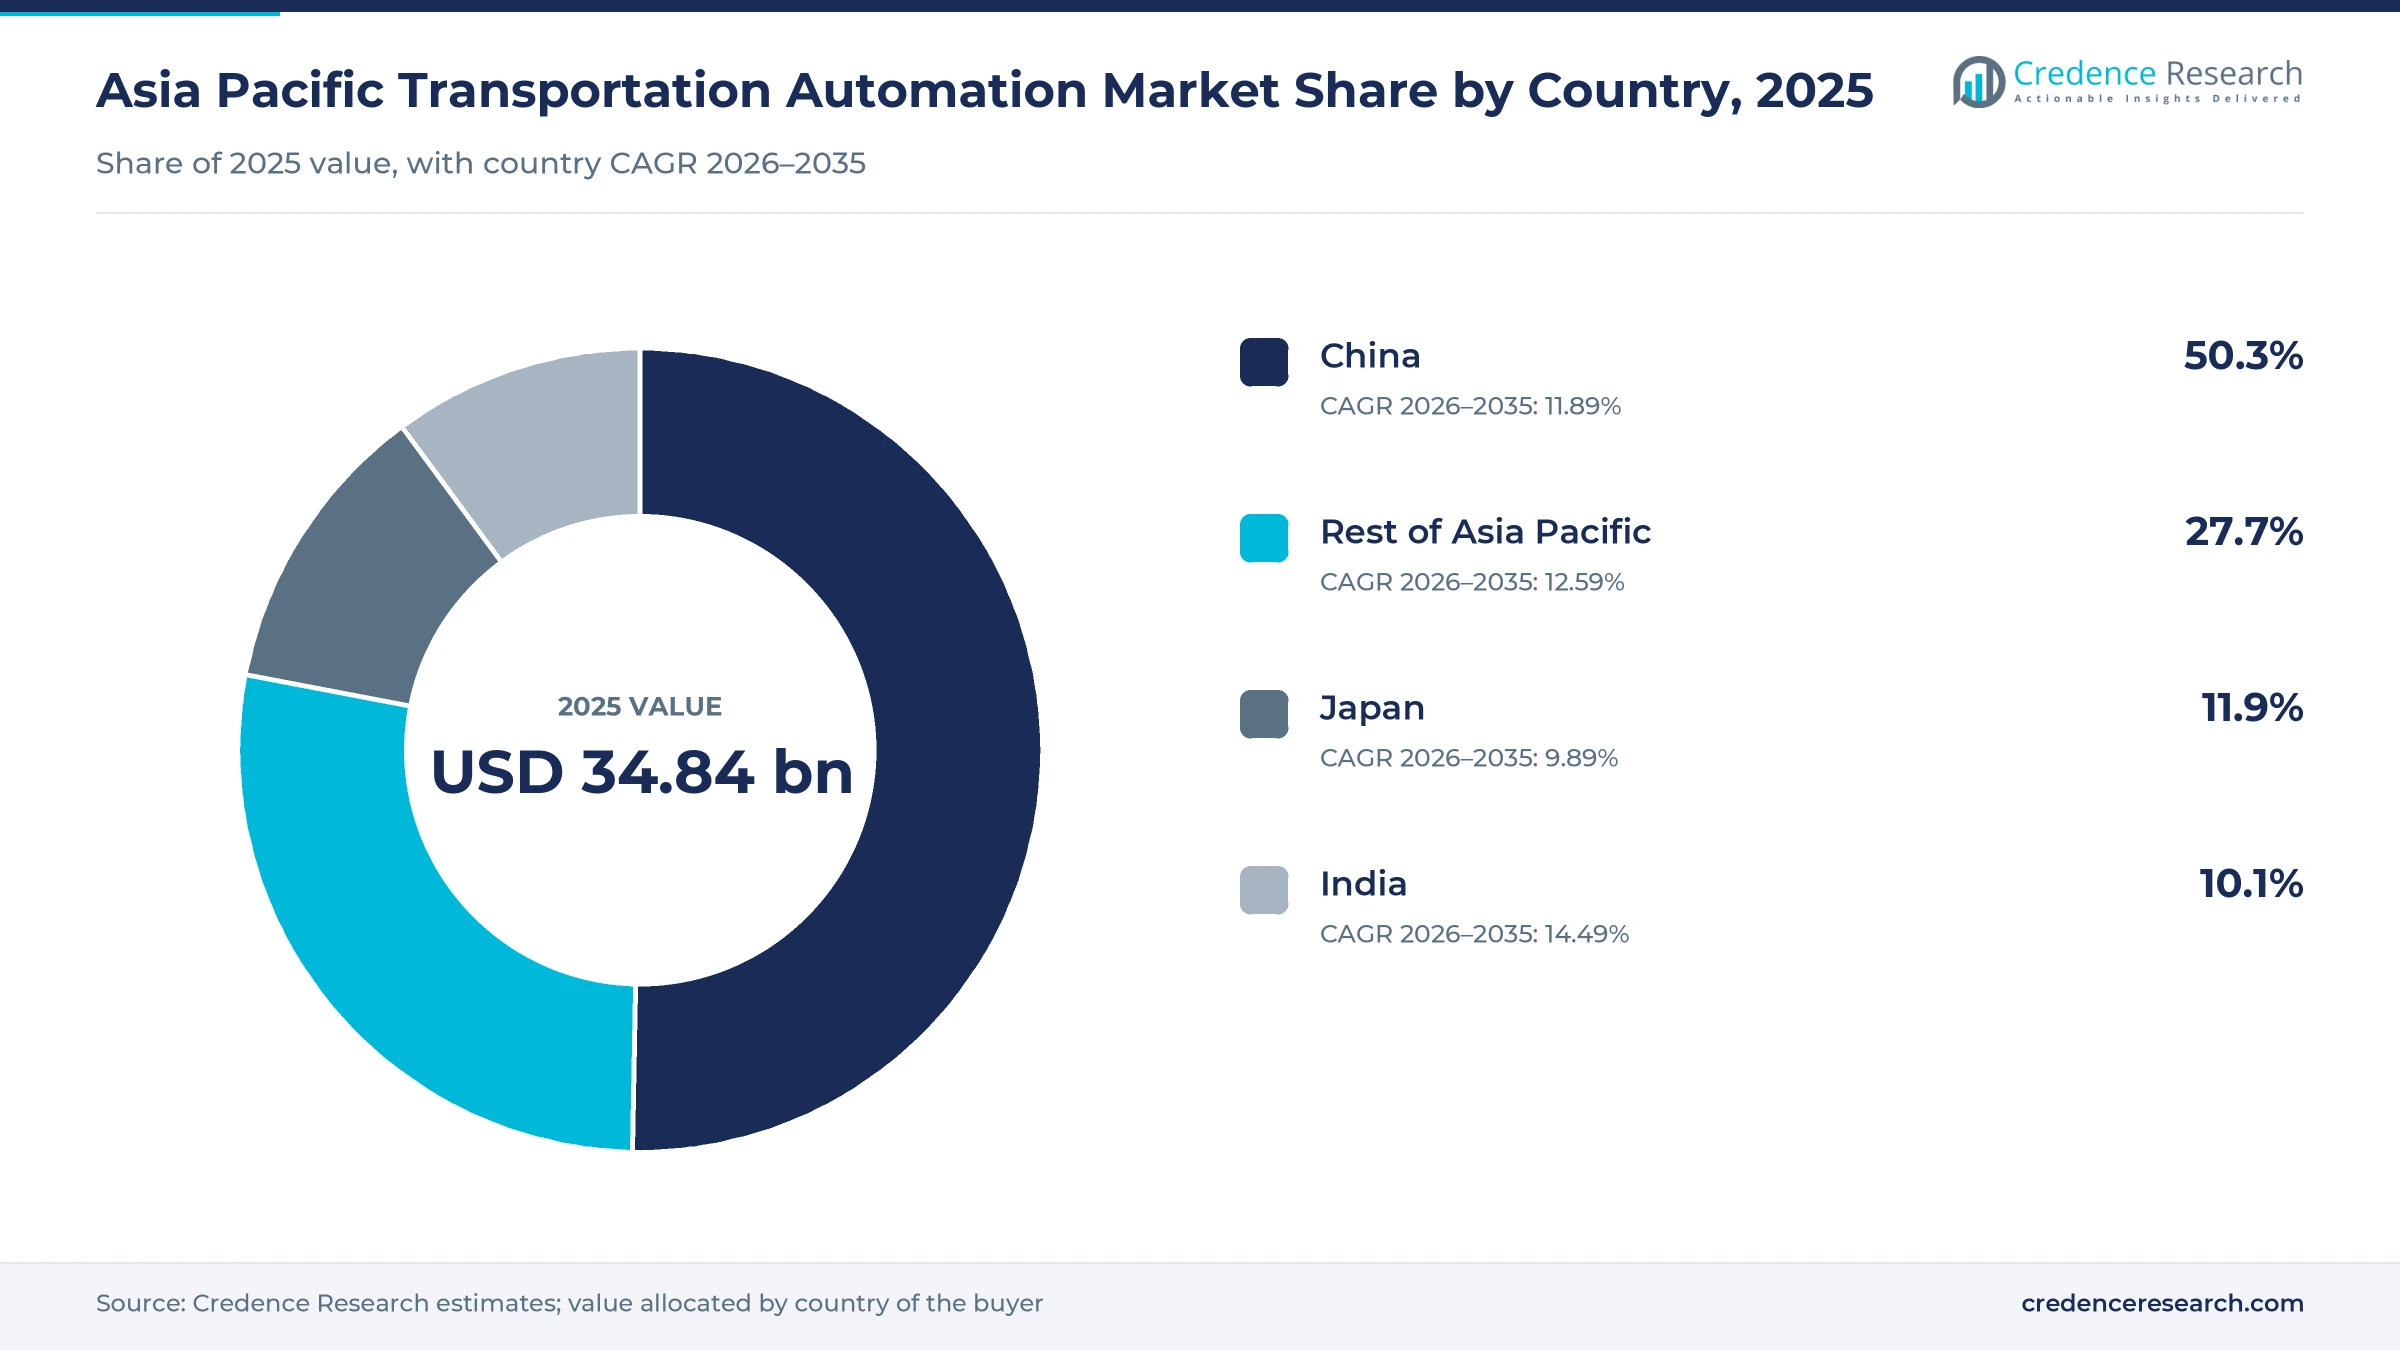
The Asia Pacific transportation automation market was valued at USD 34.84 billion in 2025 and is projected to increase from USD 39.17 billion in 2026 to USD 109.92 billion by 2035, registering a CAGR of 12.15% during 2026–2035. Demand comes from three large capital programs, namely driver assistance fitted to new vehicles, signaling and train control on expanding rail networks, and automated handling at container ports. China held the largest share, 50.3% in 2025, because it builds the most vehicles and runs the largest rail and port systems in the region. India is the fastest-growing country at 14.49% a year, as national train protection and new metro lines move from pilots into volume procurement. A key commercial change arrived in December 2025, when China conditionally approved its first two Level 3 car models for pilot use on public roads, which moved liability and software validation to the center of supplier contracts.
What does automation spending cover across road, rail, sea and air?
The market counts automation hardware, control software and integration services bought to automate vehicles, control traffic on networks, optimize fleets and run terminals across road, rail, maritime and aviation. Buyers include vehicle manufacturers, rail operators, metro authorities, port operators, airlines, airports and fleet owners, and they buy through equipment purchases, subscription licenses and project contracts.
The estimate excludes the vehicles, trains, ships and aircraft themselves, along with civil works, track and berth construction. Warehouse automation and general logistics software also sit outside the scope, unless they directly control a transport asset or terminal. In the value chain, chip and sensor suppliers feed system integrators, which then deliver finished systems to manufacturers and network operators.
Asia Pacific Transportation Automation Market Insights
- The Asia Pacific transportation automation market grows from USD 34.84 billion in 2025 to USD 109.92 billion by 2035, a 12.15% CAGR over 2026–2035, as vehicle, rail and port programs scale together.
- China held 50.3% of 2025 value, supported by 34.5 million vehicles built that year and the largest rail network in the region.
- Vehicle Automation led applications with 55.0% of 2025 value, as assistance features became standard on new energy passenger cars in China.
- Control moved toward unattended operation when Chengdu Metro opened two GoA4 lines around January 2026, using CRRC trains without staff in the cab.
- Competition splits between rail signaling groups holding long network contracts and Chinese vehicle software suppliers such as Huawei, whose ADS system targets 80 models.
Hardware and Embedded Systems still hold most of the value
Why does equipment still outweigh software in automation budgets?
Based on solution type, the market is categorized into Automation Hardware, Control Software and Integration Services. Automation Hardware led with 58.0% of 2025 value because automation programs begin with equipment fitted to vehicles, locomotives and roadsides. Indian Railways, for example, had fitted 6,290 locomotives with Kavach train protection by July 31, 2026, and work on another 7,190 was underway, according to Indian Infrastructure. Control Software grows fastest at 13.38% a year as functions move into updatable code. Huawei said on Jan. 17, 2026, that its ADS driving software would reach more than 80 vehicle models and 3 million cumulative installations during the year.
How does road volume compare with faster port and airport projects?
Based on end-use industry, the market is categorized into Road Transportation, Rail Transportation, Maritime Transportation and Aviation. Road Transportation led with 62.0% of 2025 value because vehicle output far exceeds additions of any other transport asset, and China Daily reported 59.2 million vehicles built across Asia-Pacific in 2025, up 7.6%. Maritime Transportation grows fastest at 13.73% a year as automated capacity keeps opening. Logistics Manager reported in September 2026 that Tuas Port in Singapore had handled 25 million TEUs since September 2022 and runs 14 berths, with 18 due by 2027. Aviation remains smaller, with Level 4 towing tractors at Tokyo Haneda.
Which applications take the budget, and which gain share?
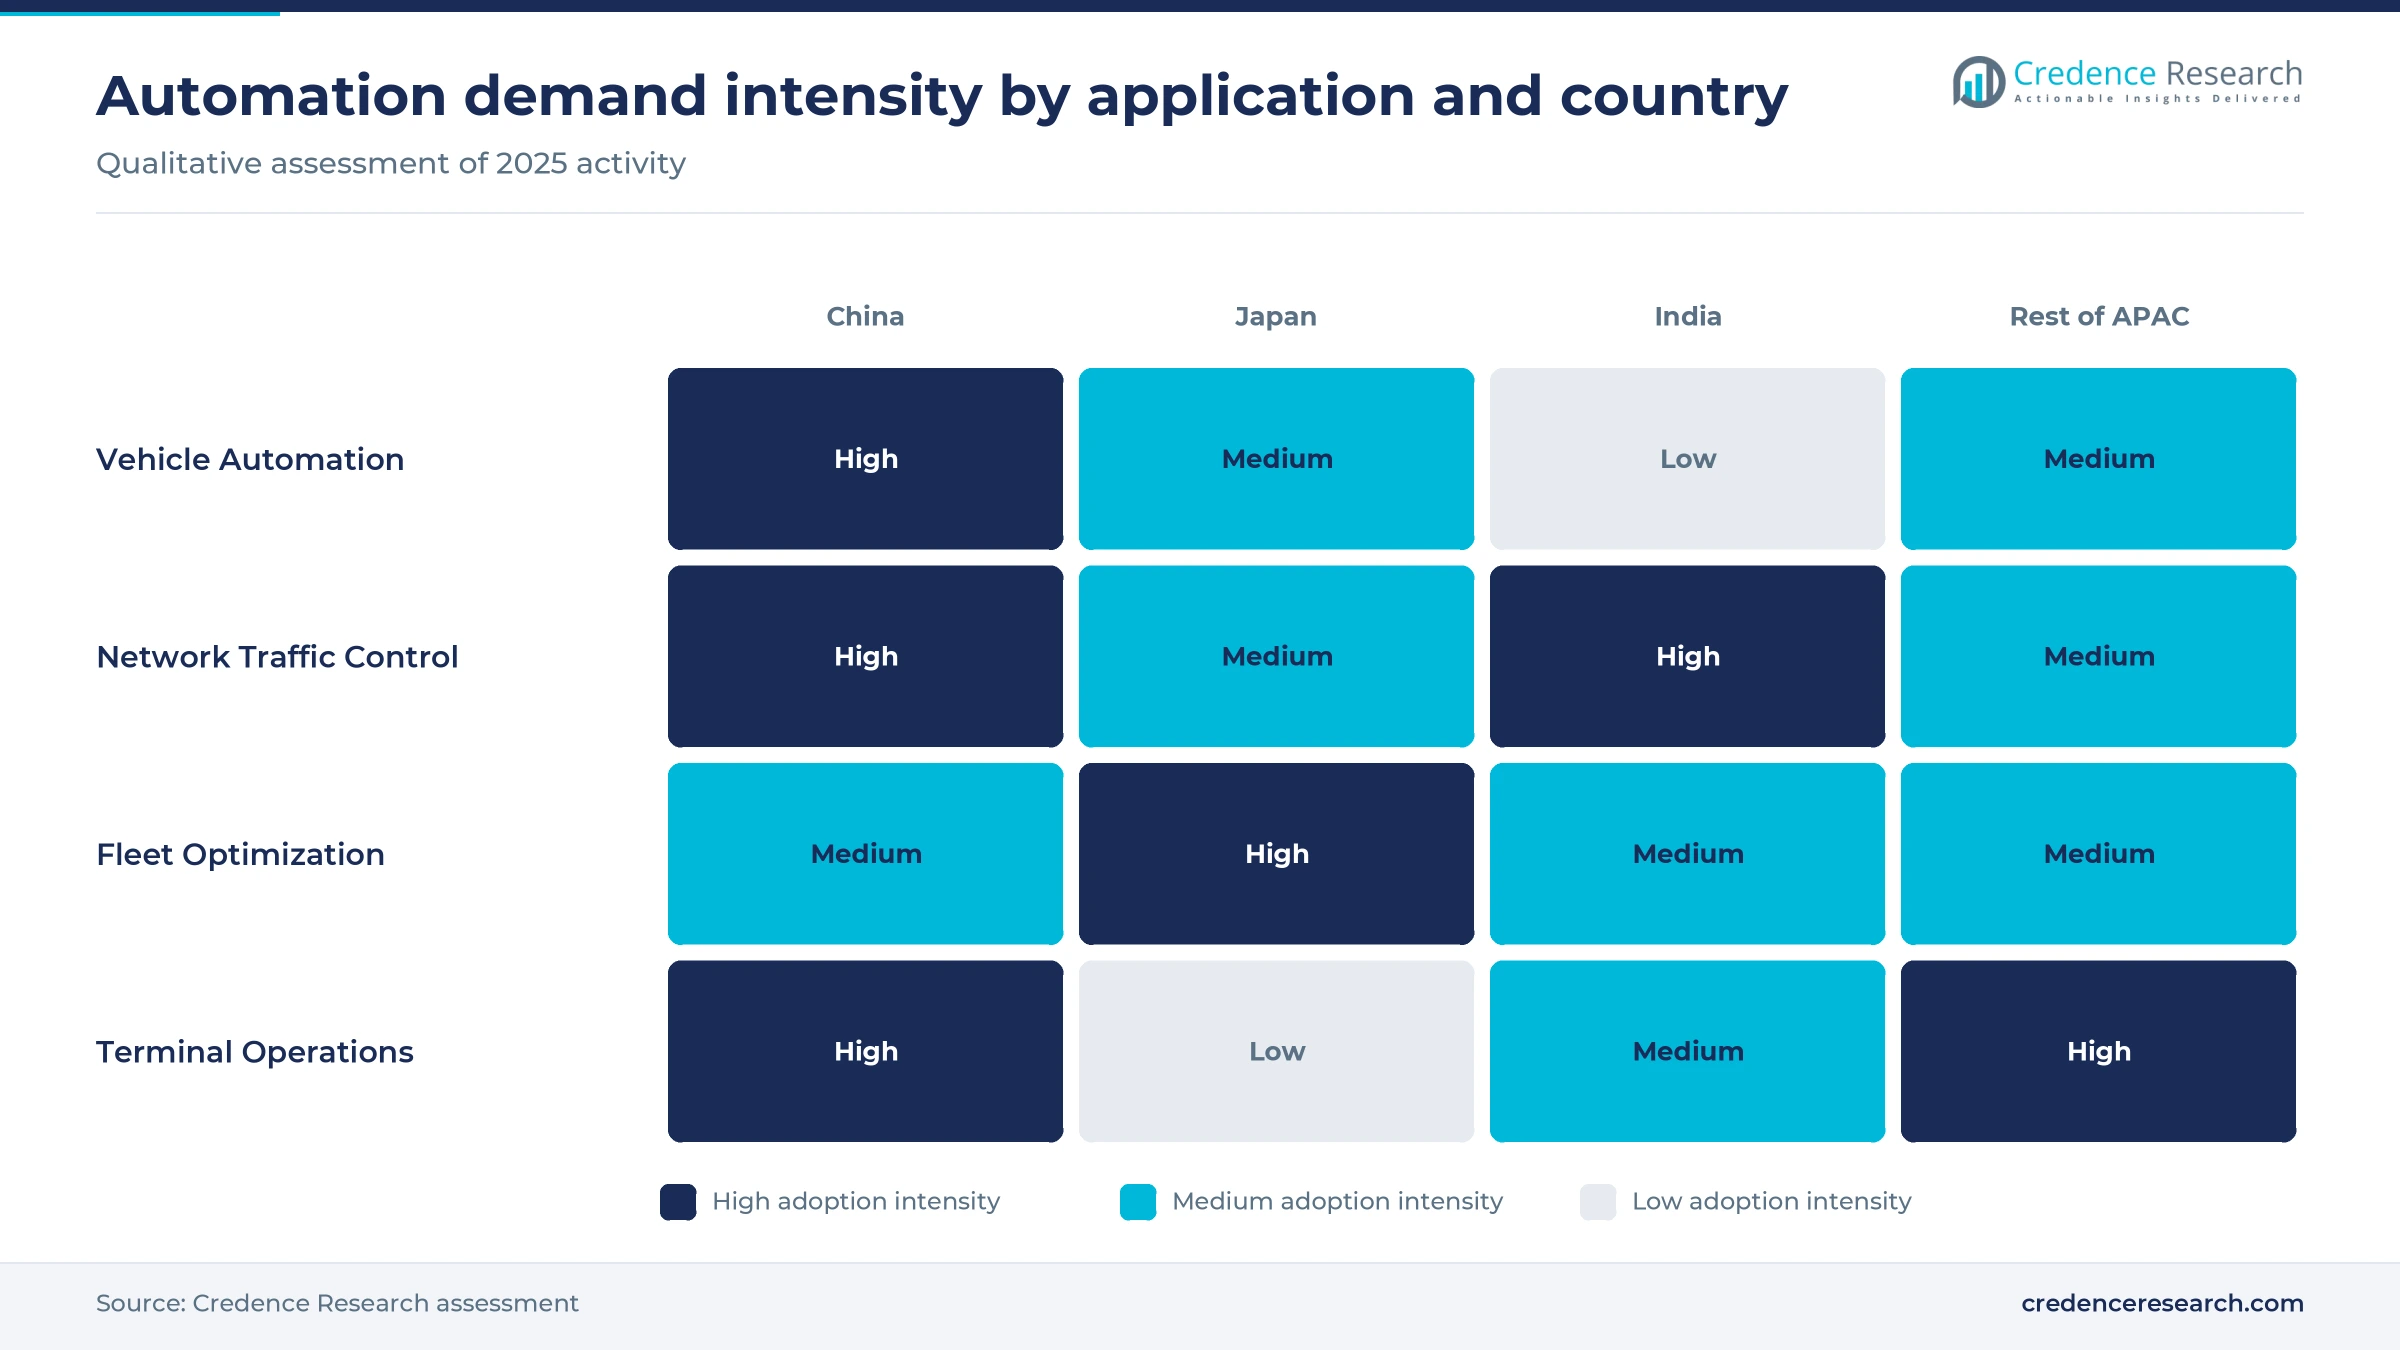
Based on application, the market is categorized into Vehicle Automation, Network Traffic Control, Fleet Optimization and Terminal Operations. Vehicle Automation led with 55.0% of 2025 value because assistance features have become routine on new cars. The China Passenger Car Association put L2-and-higher fitment on new energy passenger cars at 86.8% for January through August 2025, with automatic emergency braking at 71.4%. Terminal Operations grows fastest at 13.57% a year as port operators replace manual yard and quay work. According to Xinhua, a Ministry of Transport official said in October 2025 that China had built 60 automated container terminals.
Why does most control logic still run on the vehicle or train?
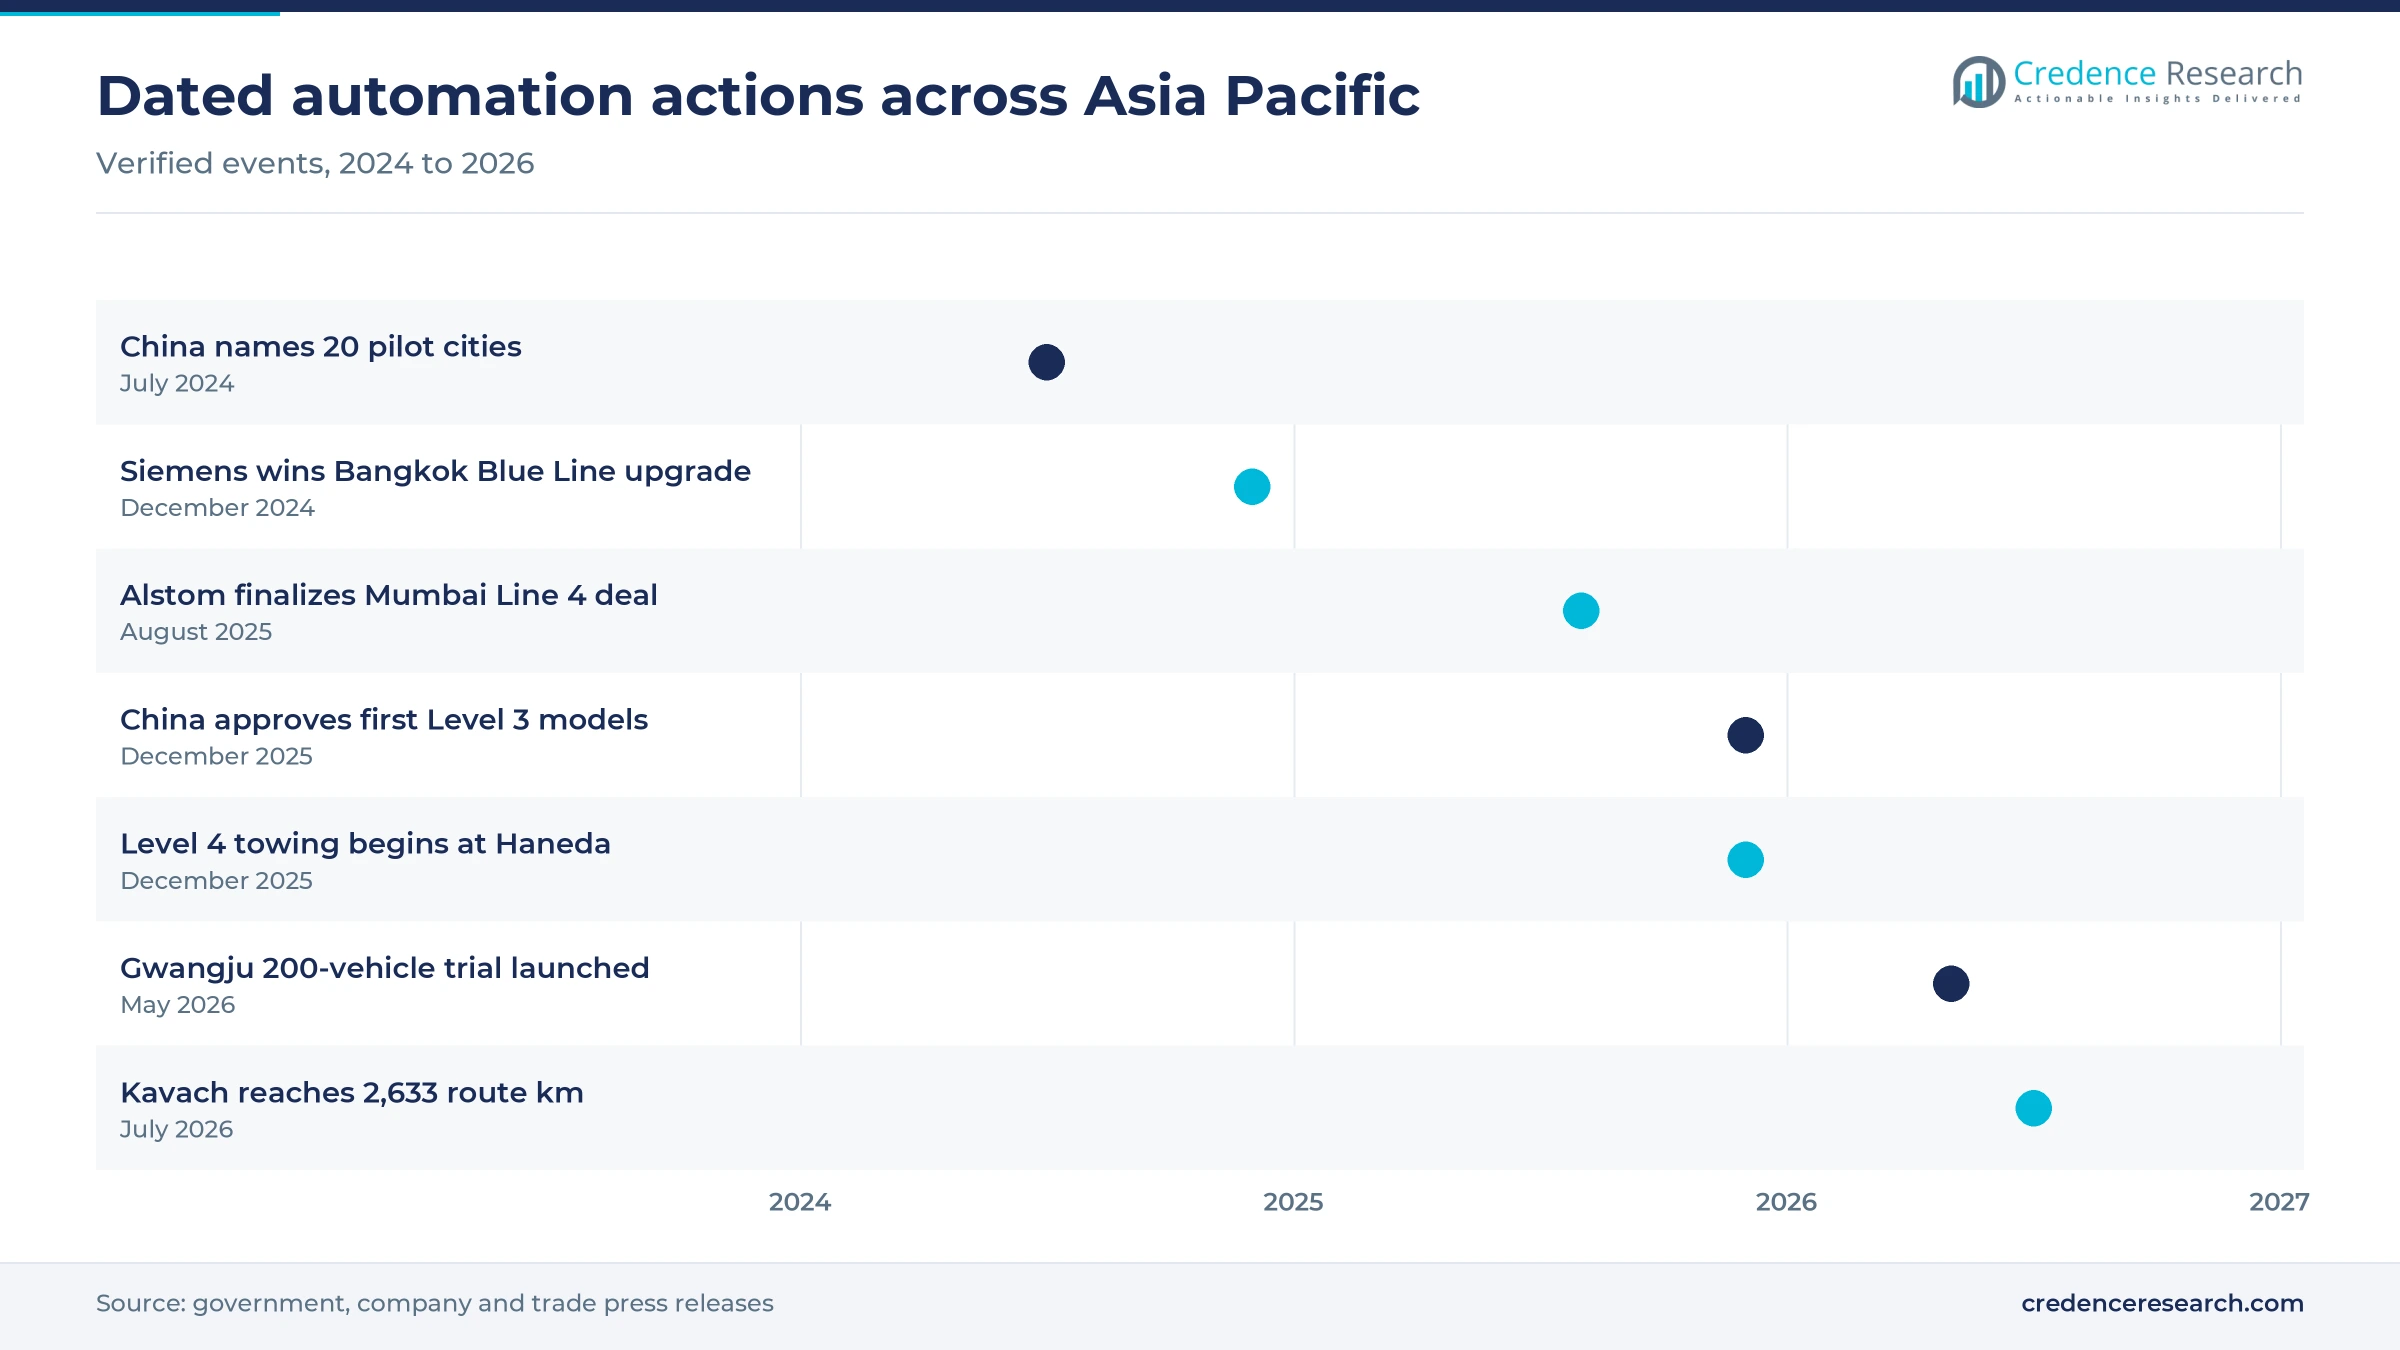
Based on deployment model, the market is categorized into Embedded Systems, On-Premises Systems and Cloud Platforms. Embedded Systems led with 64.0% of 2025 value because safety functions must run on board without network delay. Huawei reported 1 million vehicles with its ADS system installed in August 2025, and CRRC rolled out a Hangzhou Metro Line 12 train on April 17, 2026, that automates wake-up, depot exit and door operation. Cloud Platforms grows fastest at 14.80% a year as roadside data moves off site. China named 20 pilot cities in July 2024, and Yicai reported that they must build low-latency cloud control infrastructure.
| Segment Group | Leading Sub-segment | Share, 2025 | Fastest-growing Sub-segment | CAGR, 2026–2035 |
|---|---|---|---|---|
| By Solution Type | Automation Hardware | 58.0% | Control Software | 13.38% |
| By End-Use Industry | Road Transportation | 62.0% | Maritime Transportation | 13.73% |
| By Application | Vehicle Automation | 55.0% | Terminal Operations | 13.57% |
| By Deployment Model | Embedded Systems | 64.0% | Cloud Platforms | 14.80% |
Request a Free Sample
Fill in your details and we'll send you a free sample report.
- Sample data tables & charts
- Research methodology
Car electronics, rail capex and ports drive spending
Vehicle platform electronics expansion lifts content per car
Electronics content on new vehicle platforms is the largest single source of value in this market, because each model now ships with sensors, domain controllers and electronic braking. China built 34.5 million vehicles in 2025, and new energy vehicle output rose 29% to 16.63 million units, according to China Daily. Those platforms carry heavy assistance content, since Carz Malaysia reported that 7.76 million cars with L2 assistance were sold in China from January through July 2025, up 21.3%. India is following through regulation, because draft notification GSR 184(E) proposed lane departure and driver-attention warnings for new bus and truck models from April 1, 2026, alongside emergency braking, according to Motor India in April 2025. Spending on driver assistance systems therefore keeps road programs ahead through the forecast.
Rail network modernization funds signaling and train control
Rail modernization brings large, multi-year signaling budgets, because each new line and upgraded corridor needs control systems before it can carry traffic. China invested 901.5 billion yuan in railway fixed assets in 2025 and opened 3,109 kilometers of new line, according to China State Railway Group figures published by Xinhua. The same operator reported 248.5 billion yuan for the first five months of 2026, up 2.6%, and it targets about 180,000 kilometers by 2030. Procurement extends across Southeast Asia as well, since Siemens Mobility said on Dec. 18, 2024, that it would upgrade signaling on the 48-kilometer Bangkok Blue Line. As a result, railway signaling stays among the steadiest revenue lines for integrators.
Port throughput and terminal expansion justify automated yards
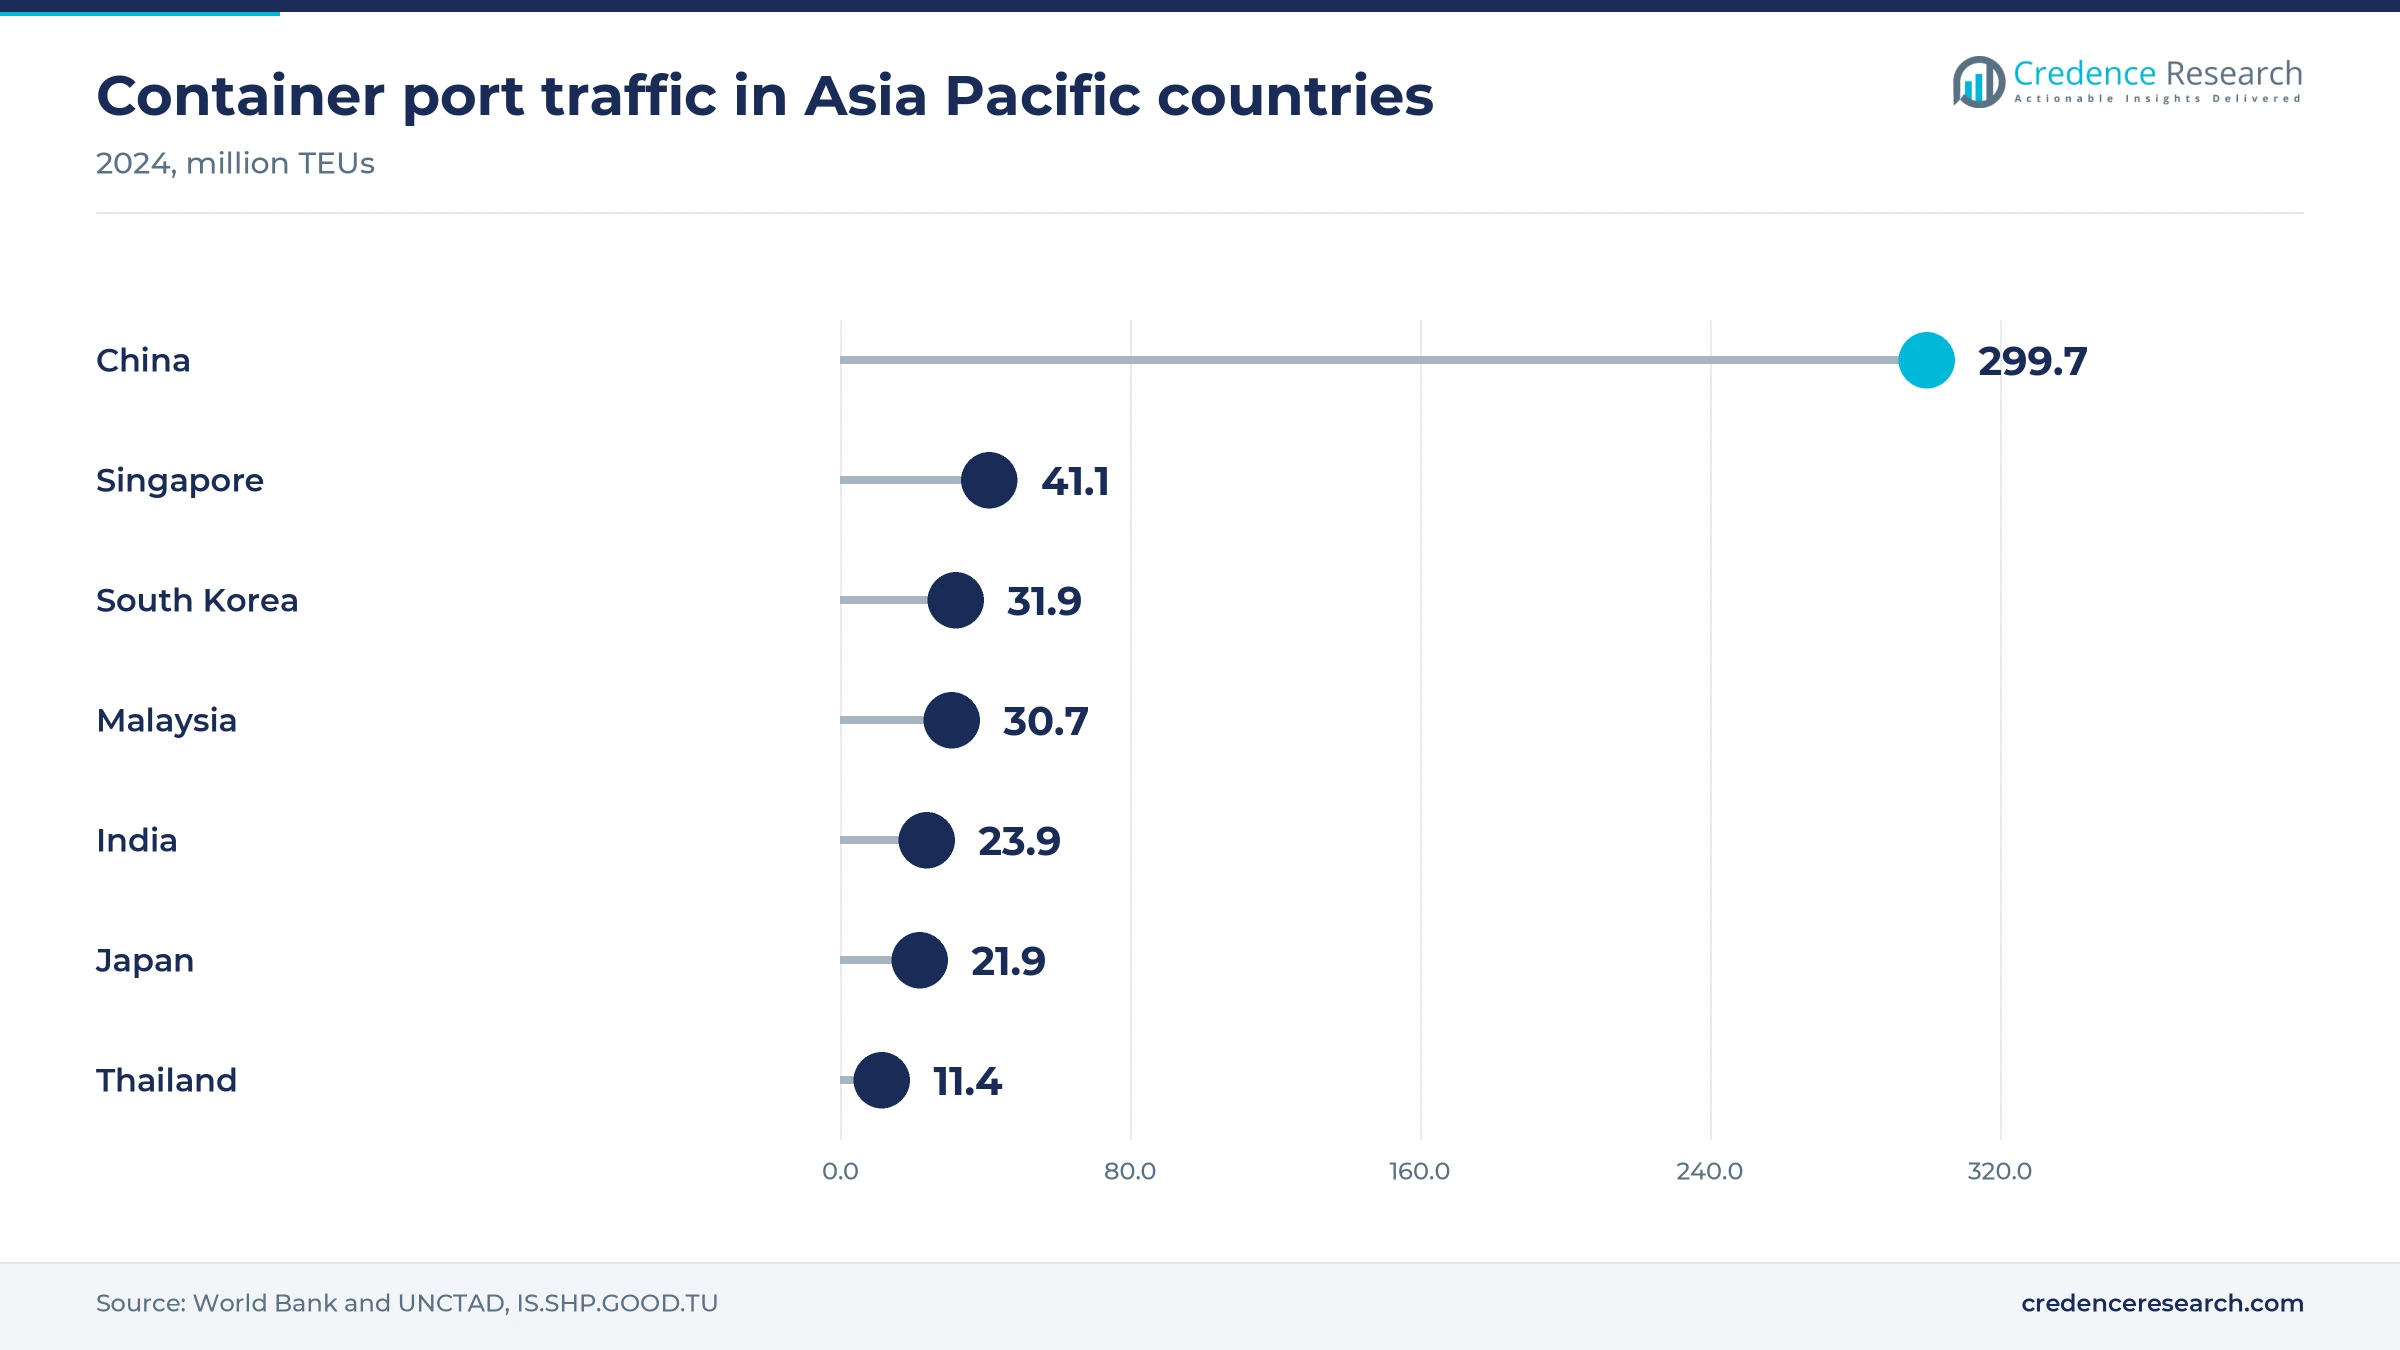
Rising box volumes push terminal owners toward automation, because adding quay and yard capacity by hand becomes harder as throughput climbs. China handled about 230 million TEUs in the first eight months of 2025, up 6.3%, according to Xinhua figures carried by Hellenic Shipping News. That follows 299.7 million TEUs in 2024, which exceeds the combined totals of Singapore, South Korea, India and Japan in World Bank and UNCTAD port data. New capacity is also planned in India, where Jawaharlal Nehru Port Authority signed agreements worth Rs 40,000 crore with PSA India and CMA CGM for the 24 million TEU Vadhavan project in June 2024. These projects widen the buyer base for container terminal equipment and control software.
Japan driver shortages turn automation into a labor policy
Labor shortages make automation a public priority, particularly in Japan, where the truck driver workforce fell from 980,000 in 1995 and is projected to reach about 520,000 by 2030. The World Economic Forum estimates that the resulting logistics gap could reach 34%, and working-hour limits for drivers took effect in April 2024. Government targets now reflect that pressure, because Automotive World reported in November 2025 that a transport ministry draft seeks 10,000 Level 4 vehicles by fiscal 2030. The economy ministry also plans driverless public bus tests from fiscal 2027, according to The Japan News in July 2026. Operators are responding with broader fleet management tools, because scarce drivers must be scheduled more tightly.
Level 3 pilots and unattended metros open new demand
The shift from assistance to conditional Level 3 driving
Regulators are moving from assisted driving toward conditional automation, and that shift raises software validation requirements for suppliers. China Daily reported in January 2026 that the Ministry of Industry and Information Technology had conditionally approved two electric models for Level 3 pilots in designated areas of Beijing and Chongqing the previous month. BYD, Harmony Intelligent Mobility Alliance, Li Auto, XPeng and Xiaomi also said they had obtained Level 3 road testing permits, which widens the field. The same report said a technology roadmap released in October 2025 projects full adoption of L2-and-above systems in new car sales by 2030, while Carz Malaysia put L2 penetration at 62.6% in 2025. Control Software gains most from this change, because each approval depends on tested code and recorded data.
The rise of unattended metro lines as the default specification
Unattended operation is becoming the normal specification for new metro lines in the region, which raises the value of each signaling package. Railway-News reported in January 2026 that Chengdu Metro Lines 13 and 30 entered service at GoA4 with CRRC trains, and Line 30 adds train-to-train communication for shorter headways. Xi’an opened a fully autonomous line in December 2025, taking its network to 422 kilometers, according to China Services Info. Singapore is making the same choice, since Siemens Mobility holds a contract of about SGD 450 million, awarded in April 2023, for GoA4 control on roughly 50 kilometers of the Cross Island Line. Suppliers with proven unattended references therefore hold an advantage in later tenders.
An opening in Indian train protection and metro signaling
India offers the clearest volume opening for rail suppliers, because its national train protection program has only just begun commissioning at scale. Indian Railways had commissioned Kavach 4.0 on 2,633 route kilometers by July 31, 2026, while trackside work was underway on 21,794 route kilometers, according to Indian Infrastructure. Fresh approvals continue, and Business Today reported on Sept. 2, 2026, that Rs 170 crore was sanctioned for 712 route kilometers in the Moradabad division. Urban rail adds a second pipeline, as Alstom finalized a deal in August 2025 for CBTC on the 35.2-kilometer Mumbai Metro Line 4. India therefore records the fastest growth among the four geographies in this report.
An opening in robotaxi fleets and public autonomous services
Commercial driverless services are opening a new buyer group, namely fleet operators that pay for complete driving systems. China Services Info reported in February 2026 that Pony.ai ran 1,159 robotaxis and WeRide ran 1,023, with Pony.ai targeting more than 3,000 during 2026. City planners are supporting this demand, because a Shanghai plan announced on Jan. 14, 2026, seeks more than 6 million Level 4 passenger trips across about 2,000 square kilometers of open test area. Falling costs help the economics too, since Pony.ai cut the materials cost of its seventh-generation kit by nearly 70%. Fleet Optimization and Cloud Platforms stand to gain, as these operators need dispatch, remote monitoring and data services.
Liability rules, chip supply and cost slow rollouts
Tighter safety rules raise the cost of driver assistance
Regulation is tightening after rapid L2 adoption, and suppliers now carry more validation work. Carz Malaysia reported in September 2025 that China’s industry ministry had put a mandatory safety standard for combined driver assistance out for consultation, covering road trials, data recording, gaze monitoring and temporary lockouts for repeat offenders. Vehicle makers and software suppliers therefore face longer test cycles and more post-sale reporting. The strongest mitigation is to build monitoring and data recording into platforms early, instead of adding them after certification.
Semiconductor disputes can stop electronics supply quickly
Automation hardware depends on a chip supply that can be interrupted by politics. Autofile reported in October 2025 that Beijing banned Nexperia exports from China on Oct. 4, after the Dutch government took control of the company on Sept. 30. Japan Automobile Manufacturers Association chairman Masanori Katayama warned that this could seriously affect member production. Smaller electronics suppliers have the least room to absorb such shocks, so buyers are now qualifying second sources and holding more inventory of basic components.
Fragmented cloud control limits scale in connected roads
Connected road programs struggle to scale when each city builds its own control platform. Yicai reported in July 2024 that China’s cloud control network remained fragmented, even with more than 8,700 roadside units installed, and said this makes large-scale deployment difficult. Vehicle makers then face separate integrations, and local governments struggle to show a return on roadside spending. Unified test evaluation, which the 20 pilot cities were asked to develop, is the main route to reducing that duplication over the forecast period.
Long rollouts tie up public capital across big networks
Network automation takes years to pay back, because operators must fund trackside and onboard work at the same time. The Moradabad approval works out at about Rs 24 lakh per route kilometer, based on Rs 170 crore for 712 route kilometers reported by Business Today in September 2026. Multiplied across India’s planned sections, that creates a heavy budget call well before safety benefits appear. Phasing work by corridor, as Indian Railways did by starting on its Delhi-Mumbai and Delhi-Howrah routes, reduces that early funding pressure.
China leads while India adds train control and ports
| Country | Value, 2025 (USD billion) | Share, 2025 | CAGR, 2026–2035 |
|---|---|---|---|
| China | 17.52 | 50.3% | 11.89% |
| Rest of Asia Pacific | 9.65 | 27.7% | 12.59% |
| Japan | 4.15 | 11.9% | 9.89% |
| India | 3.52 | 10.1% | 14.49% |
China holds the largest base across every transport mode
China held 50.3% of 2025 value and grows at 11.89% a year. Its position rests on connected road programs as well as vehicle output, because Yicai counted more than 32,000 kilometers of open autonomous test roads in July 2024, and China Services Info put that figure above 35,000 kilometers by February 2026. Metro tenders add steady demand, since CRRC supplies many of the unattended trains now entering service. Growth moderates slightly from this large base, as assistance fitment approaches saturation on new energy models.
Rest of Asia Pacific blends Korean road pilots and Singapore rail
Rest of Asia Pacific held 27.7% of 2025 value and grows at 12.59% a year. South Korea launched a trial on May 13, 2026, that puts 200 Hyundai vehicles across 500 square kilometers of Gwangju and aims for Level 4 by 2027, according to The Korea Times. Singapore adds rail demand, since Hitachi Rail is integrating two new North-South Line stations, NS3A and NS6, for the Land Transport Authority using its SelTrac control system. World Bank data also show Singapore at 41.1 million TEUs in 2024.
Japan pairs an aging workforce with airport automation
Japan held 11.9% of 2025 value and grows at 9.89% a year, the slowest rate here because its vehicle output of about 8.41 million units in 2025 is mature. Aviation stands out as a local strength, since ANA and Toyota Industries began Level 4 towing at Haneda in December 2025, with six tractors due by March 2026. Japan Airlines said on Oct. 30, 2026, that it will test tunnel routes at Haneda from November, alongside shared infrastructure from the Japan Civil Aviation Bureau.
India grows fastest on rail safety and port capacity
India held 10.1% of 2025 value and grows at 14.49% a year, the fastest rate among the four geographies. Its current automation base is small relative to its size, as World Bank data show 23.9 million TEUs in 2024 against 299.7 million in China. Capacity pressure is visible at Jawaharlal Nehru Port, which handled a record 6.43 million TEUs in fiscal 2023-24, according to India Seatrade News. Vehicle output of about 6.49 million units in 2025 also gives draft assistance rules a broad base to reach.
Haneda, Mumbai and Chengdu mark the latest deployments
| Development | Status and market relevance |
|---|---|
| In December 2025, Japan Airlines launched commercial Level 4 towing at Tokyo Haneda Airport, according to the airline. | Live, with trials of a Toyota Industries tractor on tunnel routes starting in November 2026. |
| In December 2025, China’s industry ministry conditionally approved two electric models for Level 3 pilots in Beijing and Chongqing. | Pilot stage, which sets an early template for liability. |
| In August 2025, Alstom finalized a deal with the Mumbai Metropolitan Region Development Authority covering CBTC on Metro Line 4. | In delivery, covering 35.2 kilometers and 32 elevated stations. |
| In January 2026, Railway-News reported that Chengdu Metro Lines 13 and 30 had entered service at GoA4 using CRRC trains. | In service, including train-to-train communication on Line 30. |
| In May 2026, South Korea’s land ministry launched a 200-vehicle autonomous driving trial across the Gwangju urban area. | Vehicles deploying from June, with a Level 4 goal for 2027. |
Train control and driving software set the technology pace
- Communications-based train control replaces fixed track blocks with continuous train positioning, which allows shorter headways and supports GoA4 service on lines such as the Singapore Cross Island Line.
- Automatic train protection enforces speed and signal limits from onboard and trackside equipment, and Kavach 4.0 in India and ETCS Level 1 on the 219-kilometer northern Thai double-track line are the regional examples.
- Driving software stacks combine perception, planning and control in one vehicle system, as with Huawei ADS, and they now require recorded data to support Level 3 approvals.
- Cloud control platforms link vehicles with roadside units and city traffic systems, although China’s 20 pilot cities are still working toward a unified test evaluation system.
Need a Custom Version of This Report?
Tailor the scope, geography, or segments to your exact requirements.
- Custom geography or segment scope
- Direct access to our analyst team
Rail signaling majors meet Chinese vehicle software players
Competition in transportation automation falls into two camps with very different buying cycles. Rail signaling groups, including Alstom, Hitachi Rail and Siemens Mobility, win long network contracts through public tenders, and installed references matter most because authorities rarely change a line’s control system. Alstom’s Mumbai Line 4 award and Siemens Mobility’s Cross Island Line package show how signaling is now often bundled with trains or platform doors. CRRC competes from the rolling stock side, supplying unattended trains for Chengdu and Hangzhou, with its own subsidiary building health management systems. Vehicle automation works differently, because model cycles are short and suppliers win platform by platform. Huawei sells its ADS system to carmakers on this basis, and scale in fitted vehicles gives it training data. Mid-sized fleets and ports buy mostly through integrators, so local partnerships often decide who reaches smaller buyers.
Companies profiled and their roles in this market
| Company | Type | Role in the market |
|---|---|---|
| CRRC Corporation | Rolling stock and train systems maker | Supplies GoA4 trains for Chengdu Metro and built the first fully automated Hangzhou Metro Line 12 train in April 2026. |
| Alstom | Rail signaling and train supplier | Delivers CBTC and metro cars for the 35.2-kilometer Mumbai Metro Line 4. |
| Hitachi Rail | Signaling integrator | Integrates stations NS3A and NS6 into the Singapore North-South Line using SelTrac CBTC. |
| Siemens Mobility | Signaling and rail systems supplier | Holds GoA4 control on the Singapore Cross Island Line and signaling upgrades on the Bangkok Blue Line. |
| Huawei Technologies | Vehicle software and systems supplier | Supplies the ADS driving system to carmakers in China, reaching 1 million installed vehicles in August 2025. |
Why buyers should separate vehicle from network spending
Credence Research’s view is that buyers of transportation automation should treat vehicle and network spending as two different markets that share one label. Vehicle programs move with model cycles and carry the most value, yet they face the fastest price decline, as Pony.ai’s nearly 70% kit cost cut shows. Network programs move more slowly, although they lock in suppliers for decades through installed signaling. The most assumption-sensitive figure in this report is automation content per vehicle, so readers should weigh it first. India and port automation offer the clearest growth through 2035, while China still sets the size of regional demand in every forecast year.
How the estimates were built and what they exclude
The report uses 2025 as the base year and forecasts to 2035. Market values come from the Credence Research model, and regional and segment splits are Credence Research estimates. Those estimates were checked against public data, including vehicle production reported by China Daily, railway investment reported by China State Railway Group, and container port traffic from the World Bank and UNCTAD. Other inputs were government releases, regulator statements, company press releases and named trade publications. No interviews or surveys were conducted for this edition, and content per vehicle is an assumption and not a reported statistic.
Network projects gain share of spending through 2035
The Asia Pacific transportation automation market reaches USD 109.92 billion by 2035, and its mix changes more slowly than its size. Vehicle Automation remains the largest application, although network and terminal projects gain share as China’s rail target of about 60,000 high-speed kilometers by 2030 and Tuas expansion add control contracts. Control Software and Cloud Platforms also grow ahead of the total, because approvals increasingly rely on recorded data and remote supervision. Japan’s fiscal 2030 Level 4 target of 10,000 vehicles and Korea’s 2027 goal are the demand milestones to watch. The main risk is a liability ruling or parts shock that delays volume orders.
Frequently Asked Questions
How big is the Asia Pacific transportation automation market?
Which country leads the market?
Which country grows fastest?
Which application is largest?
Which solution type grows fastest?
What holds back wider adoption?
Who are the main companies?
What is excluded from the estimate?
Table of Content
Chapter 1 Market Segmentation
- 1.1 Segmentation Framework
- 1.1.1 Product and Service Classification
- 1.1.2 Application and End-Use Classification
- 1.1.3 Technology and Solution Classification
- 1.1.4 Customer and Distribution Channel Classification
- 1.1.5 Geographic Segmentation
- 1.1.6 Market Segment Definitions and Boundaries
- 1.2 By Solution Type
- 1.2.1 Automation Hardware
- 1.2.2 Control Software
- 1.2.3 Integration Services
- 1.3 By End-Use Industry
- 1.3.1 Road Transportation
- 1.3.2 Rail Transportation
- 1.3.3 Maritime Transportation
- 1.3.4 Aviation
- 1.4 By Application
- 1.4.1 Vehicle Automation
- 1.4.2 Network Traffic Control
- 1.4.3 Fleet Optimization
- 1.4.4 Terminal Operations
- 1.5 By Deployment Model
- 1.5.1 Embedded Systems
- 1.5.2 On-Premises Systems
- 1.5.3 Cloud Platforms
- 1.6 By Country
- 1.6.1 China
- 1.6.2 Japan
- 1.6.3 India
- 1.6.4 Rest of Asia Pacific
Chapter 2 Introduction
- 2.1 Report Objectives and Scope
- 2.2 Product Definition and Industry Terminology
- 2.3 Market Inclusions and Exclusions
- 2.4 Research Process
- 2.4.1 Primary Research and Expert Interviews
- 2.4.2 Secondary Research and Source Review
- 2.4.3 Top-Down and Bottom-Up Estimation
- 2.4.4 Data Triangulation and Verification
- 2.5 Market Size Measurement Basis
- 2.5.1 2025: USD 34.84 billion → 2035: USD 109.92 billion
- 2.6 Historical and Forecast Reference Periods
- 2.6.1 Historical Period: 2018-2025
- 2.6.2 Base Year: 2025
- 2.6.3 Forecast Period: 2025-2035
- 2.7 Research Assumptions and Limitations
Chapter 3 Executive Summary
- 3.1 Market Snapshot and Key Findings
- 3.2 Base-Year Market Size, 2025
- 3.3 Forecast Market Size, 2035
- 3.4 Revenue and Volume Growth Outlook
- 3.5 Key Demand and Supply Indicators
- 3.6 Leading Market Segments
- 3.7 Fastest-Growing Market Opportunities
- 3.8 Regional Performance Highlights
- 3.9 Technology and Industry Transformation
- 3.10 Competitive Landscape Summary
- 3.11 Analyst View and Strategic Implications
Chapter 4 Asia Pacific Transportation Automation Market Trends and Developments
- 4.1 Historical Industry Development, 2018-2025
- 4.2 Recent Market Trends and Developments
- 4.3 Demand and Customer Behavior Trends
- 4.4 Technology and Product Innovation
- 4.5 Artificial Intelligence, Automation and Digitalization
- 4.6 Local Manufacturing and Supply Chain Realignment
- 4.7 Industry Partnerships, Mergers and Acquisitions
- 4.8 Sustainability and Circular Economy Developments
- 4.9 Government and Private Sector Investment Trends
- 4.10 Emerging Business Models and Commercialization
- 4.11 Industry Developments and Announcements
Chapter 5 Asia Pacific Transportation Automation Market Production, Supply and Demand Analysis
- 5.1 Demand Trend and Consumption Analysis, 2018-2025
- 5.2 Demand Forecast, 2025-2035
- 5.3 Production and Output Trend, 2018-2025
- 5.4 Production and Output Forecast, 2025-2035
- 5.5 Installed Capacity and Capacity Utilization
- 5.6 Company-Wise Production Plants and Statistics
- 5.6.1 Installed Production Capacity
- 5.6.2 Actual Production
- 5.6.3 Planned Capacity and Expansion Targets
- 5.7 Supply Chain Structure and Procurement Trends
- 5.8 Supply-Demand Gap and Bottlenecks
- 5.9 Import Dependence and Sourcing Structure
- 5.10 Contract Manufacturing and Outsourcing
- 5.11 Regional Supply and Demand Concentration
Chapter 6 Asia Pacific Transportation Automation Market Pricing Analysis
- 6.1 Pricing Structure and Measurement
- 6.2 Historical Pricing Trends, 2018-2025
- 6.3 Pricing Outlook, 2025-2035
- 6.4 Average Selling Price and Unit Economics
- 6.5 Pricing by Product and Market Segment
- 6.6 Geographic Pricing Differences
- 6.7 Key Input, Energy, Labor and Logistics Costs
- 6.8 Contract Pricing and Purchasing Models
- 6.9 Pricing Sensitivity and Competitive Positioning
- 6.10 Price, Margin and Profitability Implications
Chapter 7 Asia Pacific Transportation Automation Market Dynamics
- 7.1 Market Growth Drivers
- 7.1.1 Demand-Side Drivers
- 7.1.2 Technology and Innovation Drivers
- 7.1.3 Infrastructure and Investment Drivers
- 7.1.4 Regulatory and Policy Drivers
- 7.2 Market Restraints
- 7.2.1 Cost and Affordability Constraints
- 7.2.2 Technology and Adoption Barriers
- 7.2.3 Supply Chain and Operational Constraints
- 7.3 Market Challenges
- 7.3.1 Competitive Pressure and Margin Erosion
- 7.3.2 Skills, Infrastructure and Implementation Gaps
- 7.4 Emerging Market Opportunities
- 7.5 Market Dynamics Impact and Time-Horizon Assessment
Chapter 8 Asia Pacific Transportation Automation Value Chain Analysis
- 8.1 Industry Value Chain Overview
- 8.2 Upstream Suppliers and Critical Inputs
- 8.3 Technology and Component Providers
- 8.4 Manufacturing or Service Delivery
- 8.5 Distribution, Channel Partners and Integrators
- 8.6 Downstream Applications and End Users
- 8.7 Value Addition and Profit Pools
- 8.8 Vertical Integration and Outsourcing
- 8.9 Supplier Concentration and Risk
- 8.10 Supply Chain Localization and Resilience
Chapter 9 Asia Pacific Transportation Automation Market Regulations and Policies
- 9.1 Relevant Laws, Standards and Compliance Frameworks
- 9.2 Product, Service, Safety and Quality Requirements
- 9.3 Government Policies, Incentives and Subsidies
- 9.4 Imports, Exports and Trade Barriers
- 9.5 Public Procurement and Local Content Requirements
- 9.6 Environmental and Sustainability Compliance
- 9.7 Upcoming Policy Changes and Market Implications
Chapter 10 Asia Pacific Transportation Automation Market Hotspots and Opportunities
- 10.1 Market Opportunity Mapping and Growth Hotspots
- 10.2 High-Growth Applications and Customer Groups
- 10.3 Underserved Markets and White-Space Opportunities
- 10.4 Emerging Technology and Product Opportunities
- 10.5 New Capacity and Investment Hotspots
- 10.6 Market Entry and Expansion Opportunities
- 10.7 Distribution and Partnership Opportunities
- 10.8 Near-Term and Long-Term Commercial Potential
- 10.9 Opportunity Attractiveness and Execution Risks
Chapter 11 Asia Pacific Transportation Automation Market Outlook, 2025-2035
- 11.1 Market Size and Analysis
- 11.1.1 Revenue (Market Measurement: 2025: USD 34.84 billion → 2035: USD 109.92 billion)
- 11.1.2 Market Volume and Quantity Sold
- 11.1.3 Historical Market Size, 2018-2025
- 11.1.4 Base-Year Market Size, 2025
- 11.2 Market Forecast, 2025-2035
- 11.2.1 Revenue Forecast to 2035
- 11.2.2 Volume Forecast to 2035
- 11.2.3 CAGR and Year-on-Year Growth
- 11.2.4 Incremental Revenue Opportunity
- 11.3 Forecast Assumptions and Scenario Analysis
- 11.3.1 Base-Case Forecast
- 11.3.2 Optimistic and Conservative Scenarios
- 11.3.3 Technology, Pricing and Policy Sensitivities
- 11.4 Market Attractiveness and Growth Outlook
Chapter 12 Asia Pacific Transportation Automation Market Segmentation and Outlook
- 12.1 Segmentation Summary and Market Shares, 2025
- 12.2 Largest and Fastest-Growing Segments
- 12.3 By Solution Type - Market Size and Forecast, 2025-2035
- 12.3.1 Segment Definition and Scope
- 12.3.2 Historical Market Size, 2018-2025
- 12.3.3 Revenue Forecast, 2025-2035
- 12.3.4 Volume Forecast, 2025-2035
- 12.3.5 Base-Year Market Share, 2025
- 12.3.6 Segment CAGR and Growth Drivers
- 12.3.7 Subsegment Market Size and Forecast
- 12.3.7.1 Automation Hardware
- 12.3.7.2 Control Software
- 12.3.7.3 Integration Services
- 12.3.8 Subsegment Pricing and Adoption Trends
- 12.3.9 Leading Suppliers and Competition
- 12.3.10 Regional Demand and Opportunities
- 12.4 By End-Use Industry - Market Size and Forecast, 2025-2035
- 12.4.1 Segment Definition and Scope
- 12.4.2 Historical Market Size, 2018-2025
- 12.4.3 Revenue Forecast, 2025-2035
- 12.4.4 Volume Forecast, 2025-2035
- 12.4.5 Base-Year Market Share, 2025
- 12.4.6 Segment CAGR and Growth Drivers
- 12.4.7 Subsegment Market Size and Forecast
- 12.4.7.1 Road Transportation
- 12.4.7.2 Rail Transportation
- 12.4.7.3 Maritime Transportation
- 12.4.7.4 Aviation
- 12.4.8 Subsegment Pricing and Adoption Trends
- 12.4.9 Leading Suppliers and Competition
- 12.4.10 Regional Demand and Opportunities
- 12.5 By Application - Market Size and Forecast, 2025-2035
- 12.5.1 Segment Definition and Scope
- 12.5.2 Historical Market Size, 2018-2025
- 12.5.3 Revenue Forecast, 2025-2035
- 12.5.4 Volume Forecast, 2025-2035
- 12.5.5 Base-Year Market Share, 2025
- 12.5.6 Segment CAGR and Growth Drivers
- 12.5.7 Subsegment Market Size and Forecast
- 12.5.7.1 Vehicle Automation
- 12.5.7.2 Network Traffic Control
- 12.5.7.3 Fleet Optimization
- 12.5.7.4 Terminal Operations
- 12.5.8 Subsegment Pricing and Adoption Trends
- 12.5.9 Leading Suppliers and Competition
- 12.5.10 Regional Demand and Opportunities
- 12.6 By Deployment Model - Market Size and Forecast, 2025-2035
- 12.6.1 Segment Definition and Scope
- 12.6.2 Historical Market Size, 2018-2025
- 12.6.3 Revenue Forecast, 2025-2035
- 12.6.4 Volume Forecast, 2025-2035
- 12.6.5 Base-Year Market Share, 2025
- 12.6.6 Segment CAGR and Growth Drivers
- 12.6.7 Subsegment Market Size and Forecast
- 12.6.7.1 Embedded Systems
- 12.6.7.2 On-Premises Systems
- 12.6.7.3 Cloud Platforms
- 12.6.8 Subsegment Pricing and Adoption Trends
- 12.6.9 Leading Suppliers and Competition
- 12.6.10 Regional Demand and Opportunities
- 12.7 By Country - Market Size and Forecast, 2025-2035
- 12.7.1 Segment Definition and Scope
- 12.7.2 Historical Market Size, 2018-2025
- 12.7.3 Revenue Forecast, 2025-2035
- 12.7.4 Volume Forecast, 2025-2035
- 12.7.5 Base-Year Market Share, 2025
- 12.7.6 Segment CAGR and Growth Drivers
- 12.7.7 Subsegment Market Size and Forecast
- 12.7.7.1 China
- 12.7.7.2 Japan
- 12.7.7.3 India
- 12.7.7.4 Rest of Asia Pacific
- 12.7.8 Subsegment Pricing and Adoption Trends
- 12.7.9 Leading Suppliers and Competition
- 12.7.10 Regional Demand and Opportunities
- 12.8 Segment Growth Comparison
- 12.9 Segment Attractiveness and Priority Matrix
Chapter 13 Asia Pacific Transportation Automation End-Use and Application Market Outlook
- 13.1 End-Use Industry and Customer Demand Structure
- 13.2 Leading Applications and Customer Groups
- 13.3 End-Use Market Size, Share and Forecast
- 13.4 Major End-Use Industry Deep Dives
- 13.4.1 Customer Requirements and Use Cases
- 13.4.2 Demand and Replacement Cycles
- 13.4.3 Technical and Regulatory Considerations
- 13.4.4 Purchasing and Procurement Models
- 13.4.5 Leading Vendors and Distribution Channels
- 13.4.6 Forecast and Commercial Opportunities
- 13.5 Emerging Applications and Cross-Segment Demand
- 13.6 End-Use Industry Investment Priorities
Chapter 14 Asia Pacific Transportation Automation Geographic Market Outlook, 2025-2035
- 14.1 Regional Market Size and Country-Level Shares, 2025
- 14.2 Country Market Size Comparison, 2025
- 14.3 Country Market Forecasts, 2025-2035
- 14.4 Subregional Industrial and Demand Clusters
- 14.5 Intra-Regional Pricing and Cost Differences
- 14.6 Cross-Border Trade and Supply Networks
- 14.7 Regional Supply and Demand Balances
- 14.8 Country Opportunity Comparison and Prioritization
Note: Every listed country is covered on the structure shown under the first country.
Chapter 15 Asia Pacific Transportation Automation Technology, Innovation and Sustainability Outlook
- 15.1 Technology Landscape and Maturity
- 15.2 Product, Process and Service Innovation
- 15.3 AI, Automation and Digital Tools in the Industry
- 15.4 Technology Adoption and Performance Benchmarking
- 15.5 Innovation Pipeline and R&D Investment
- 15.6 Patent and Intellectual Property Trends
- 15.7 Energy Efficiency and Resource Management
- 15.8 Sustainability, Recycling and Circularity
- 15.9 Technology Roadmap, 2025-2035
- 15.10 Risks of Obsolescence and Technology Substitution
Chapter 16 Asia Pacific Transportation Automation Market Key Strategic Imperatives
- 16.1 Growth and Market Entry Priorities
- 16.2 High-Return Products and Segments
- 16.3 Pricing, Profitability and Cost Optimization
- 16.4 Technology Investment and Product Differentiation
- 16.5 Supply Chain Localization and Resilience
- 16.6 Distribution and Customer Acquisition
- 16.7 Partnership, Acquisition and Capacity Strategy
- 16.8 Regional Expansion Priorities
- 16.9 Short-, Medium- and Long-Term Actions
Chapter 17 Competition Outlook
- 17.1 Industry Competition Characteristics
- 17.2 Market Structure and Concentration
- 17.3 Market Share and Competitive Positioning, 2025
- 17.4 Company-Wise Revenue and Product Benchmarking
- 17.5 Production and Service Capacity Benchmarking
- 17.6 Technology, Pricing and Differentiation
- 17.7 Regional Footprint and Distribution Strength
- 17.8 Mergers, Acquisitions and Strategic Alliances
- 17.9 New Entrants and Competitive Threats
- 17.10 Porter's Five Forces and Industry Attractiveness
- 17.11 Competitive Outlook, 2025-2035
Chapter 18 Company Profiles
- 18.1 Company Coverage and Selection Criteria
- 18.2 CRRC Corporation
- 18.2.1 Business Description
- 18.2.2 Company Ownership and Geographic Presence
- 18.2.3 Product and Service Portfolio
- 18.2.4 Manufacturing and Operating Footprint
- 18.2.5 Production Capacity and Expansion Plans
- 18.2.6 Financial Performance and Investment
- 18.2.7 Market Share and Competitive Position
- 18.2.8 Technology and Innovation Capabilities
- 18.2.9 Strategic Alliances or Partnerships
- 18.2.10 Recent Developments
- 18.2.11 Growth Strategy and Outlook
- 18.3 Alstom
- 18.4 Hitachi Rail
- 18.5 Siemens Mobility
- 18.6 Huawei Technologies
- 18.7 Other Relevant Market Participants
Note: Every listed company is profiled on the structure shown under the first company. The company list is preliminary and may change based on research findings, market developments, data availability and client requirements.
Chapter 19 Disclaimer
- 19.1 Research and Forecast Disclaimer
- 19.2 Data Source and Estimation Limitations
Note: The depth of individual sections depends on data availability for this market. Volume, capacity, trade and other unit-based metrics are included where applicable.

