
An aging vehicle parc sets the rubber replacement cycle
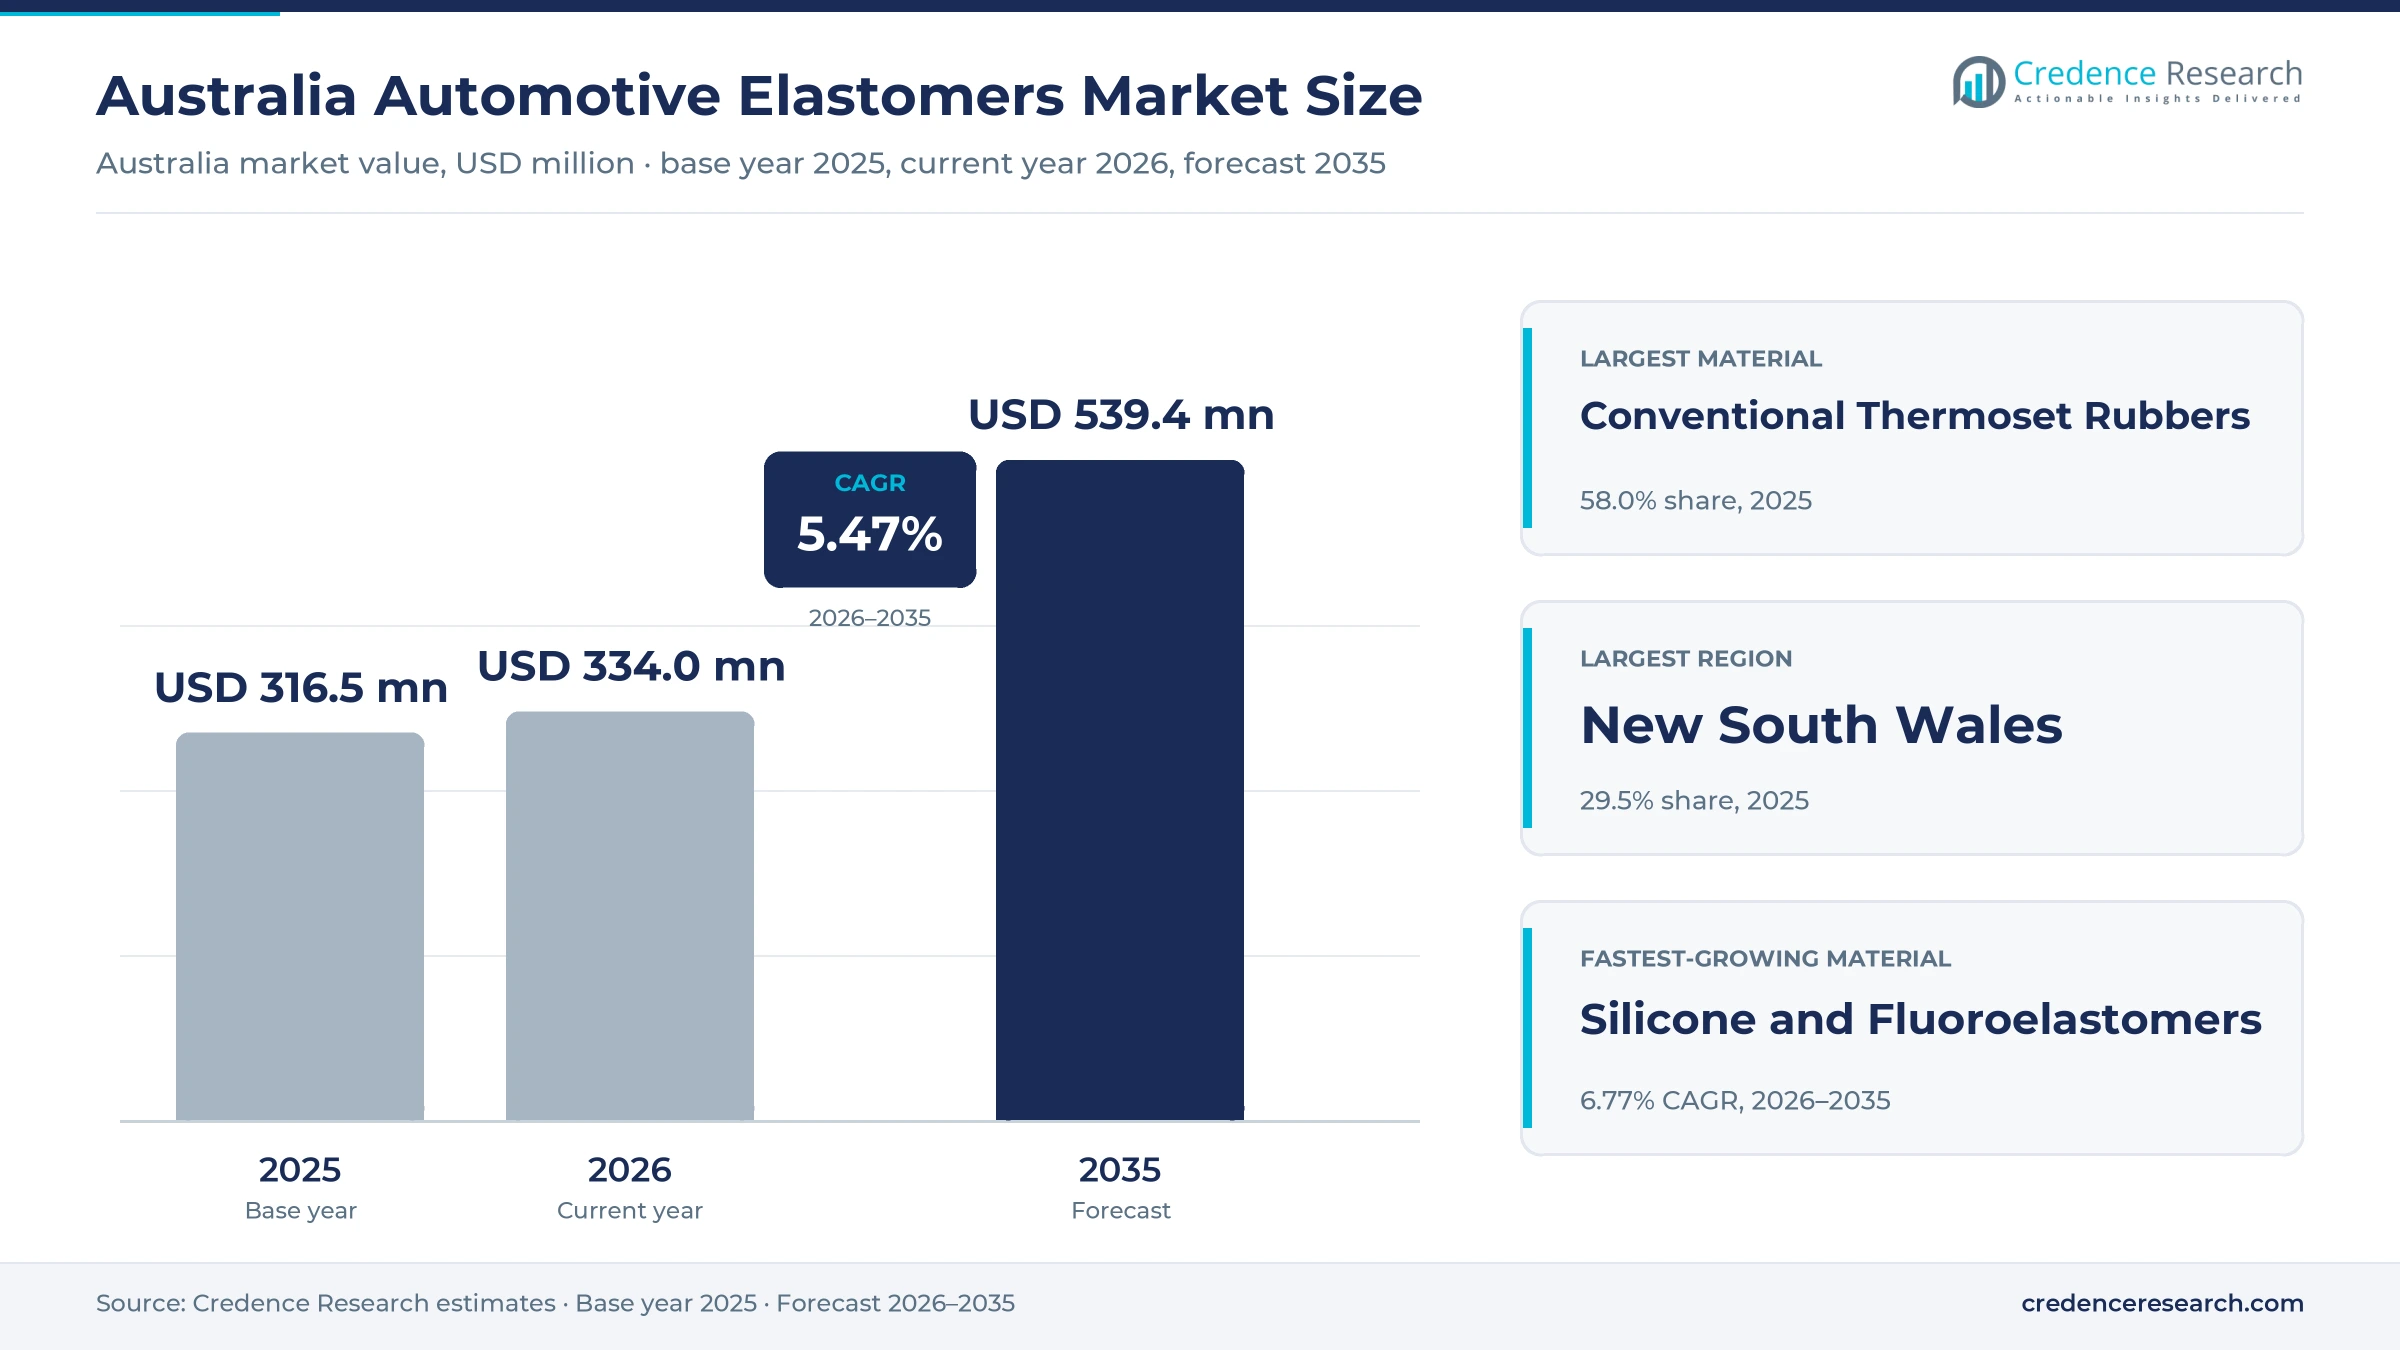
The Australia automotive elastomers market was valued at USD 316.5 million in 2025 and is projected to increase from USD 334.0 million in 2026 to USD 539.4 million by 2035, registering a CAGR of 5.47% during 2026–2035. Demand follows a fleet that keeps getting older and a replacement cycle served by trade stores, dealers and specialist seal suppliers, because the country no longer assembles passenger cars at scale. New South Wales held the largest regional share, 29.5% in 2025, on the back of the biggest registered fleet and the highest new vehicle deliveries among the states. Western Australia is the fastest-growing region at 5.93% a year, supported by the quickest registration growth in the federal fleet count. Electrification is the main technical change, since hybrids and battery electric vehicles add cooling circuits that need silicone hoses and fluid-resistant seals. Truck duty adds a second layer of demand, and local electric truck production began at Wacol in Queensland in July 2026.
What does the Australian automotive rubber parts market actually count?
The market counts the value of elastomer sealing components, hoses, vibration components, profiles and belts sold for vehicles on Australian roads, at the price paid by workshops, dealers, fleets and truck builders. Replacement purchases make up most of this value, because local vehicle assembly is largely limited to trucks. Buyers purchase through trade distributors, franchised dealer parts counters and specialist seal or suspension suppliers.
The scope excludes tires, adhesives and the rubber content built into fully imported new vehicles, since that value is paid to the overseas vehicle maker rather than to a local parts supplier. Raw polymers are counted only once they become a finished part sold for a vehicle. The value chain runs from compounders and molders, mostly overseas, through importers and local manufacturers to trade stores and workshops.
Australia Automotive Elastomers Market Insights
- The market grows from USD 316.5 million in 2025 to USD 539.4 million by 2035, a 5.47% CAGR that rests on replacement demand from an older registered fleet.
- New South Wales held 29.5% of 2025 value, while Western Australia advances fastest at 5.93% a year on quicker fleet growth.
- Conventional Thermoset Rubbers led materials with 58.0% in 2025, because older petrol and diesel vehicles still dominate the parts that wear out.
- Volvo began building battery electric trucks at Wacol in July 2026, which brings a new local buyer of coolant hoses and seals.
- Independent trade distribution leads because Bapcor and Repco run national store networks, so stock depth and delivery speed decide most workshop purchases.
Thermoset seals and hoses still anchor elastomer value
Why do conventional thermoset rubbers still lead material demand?
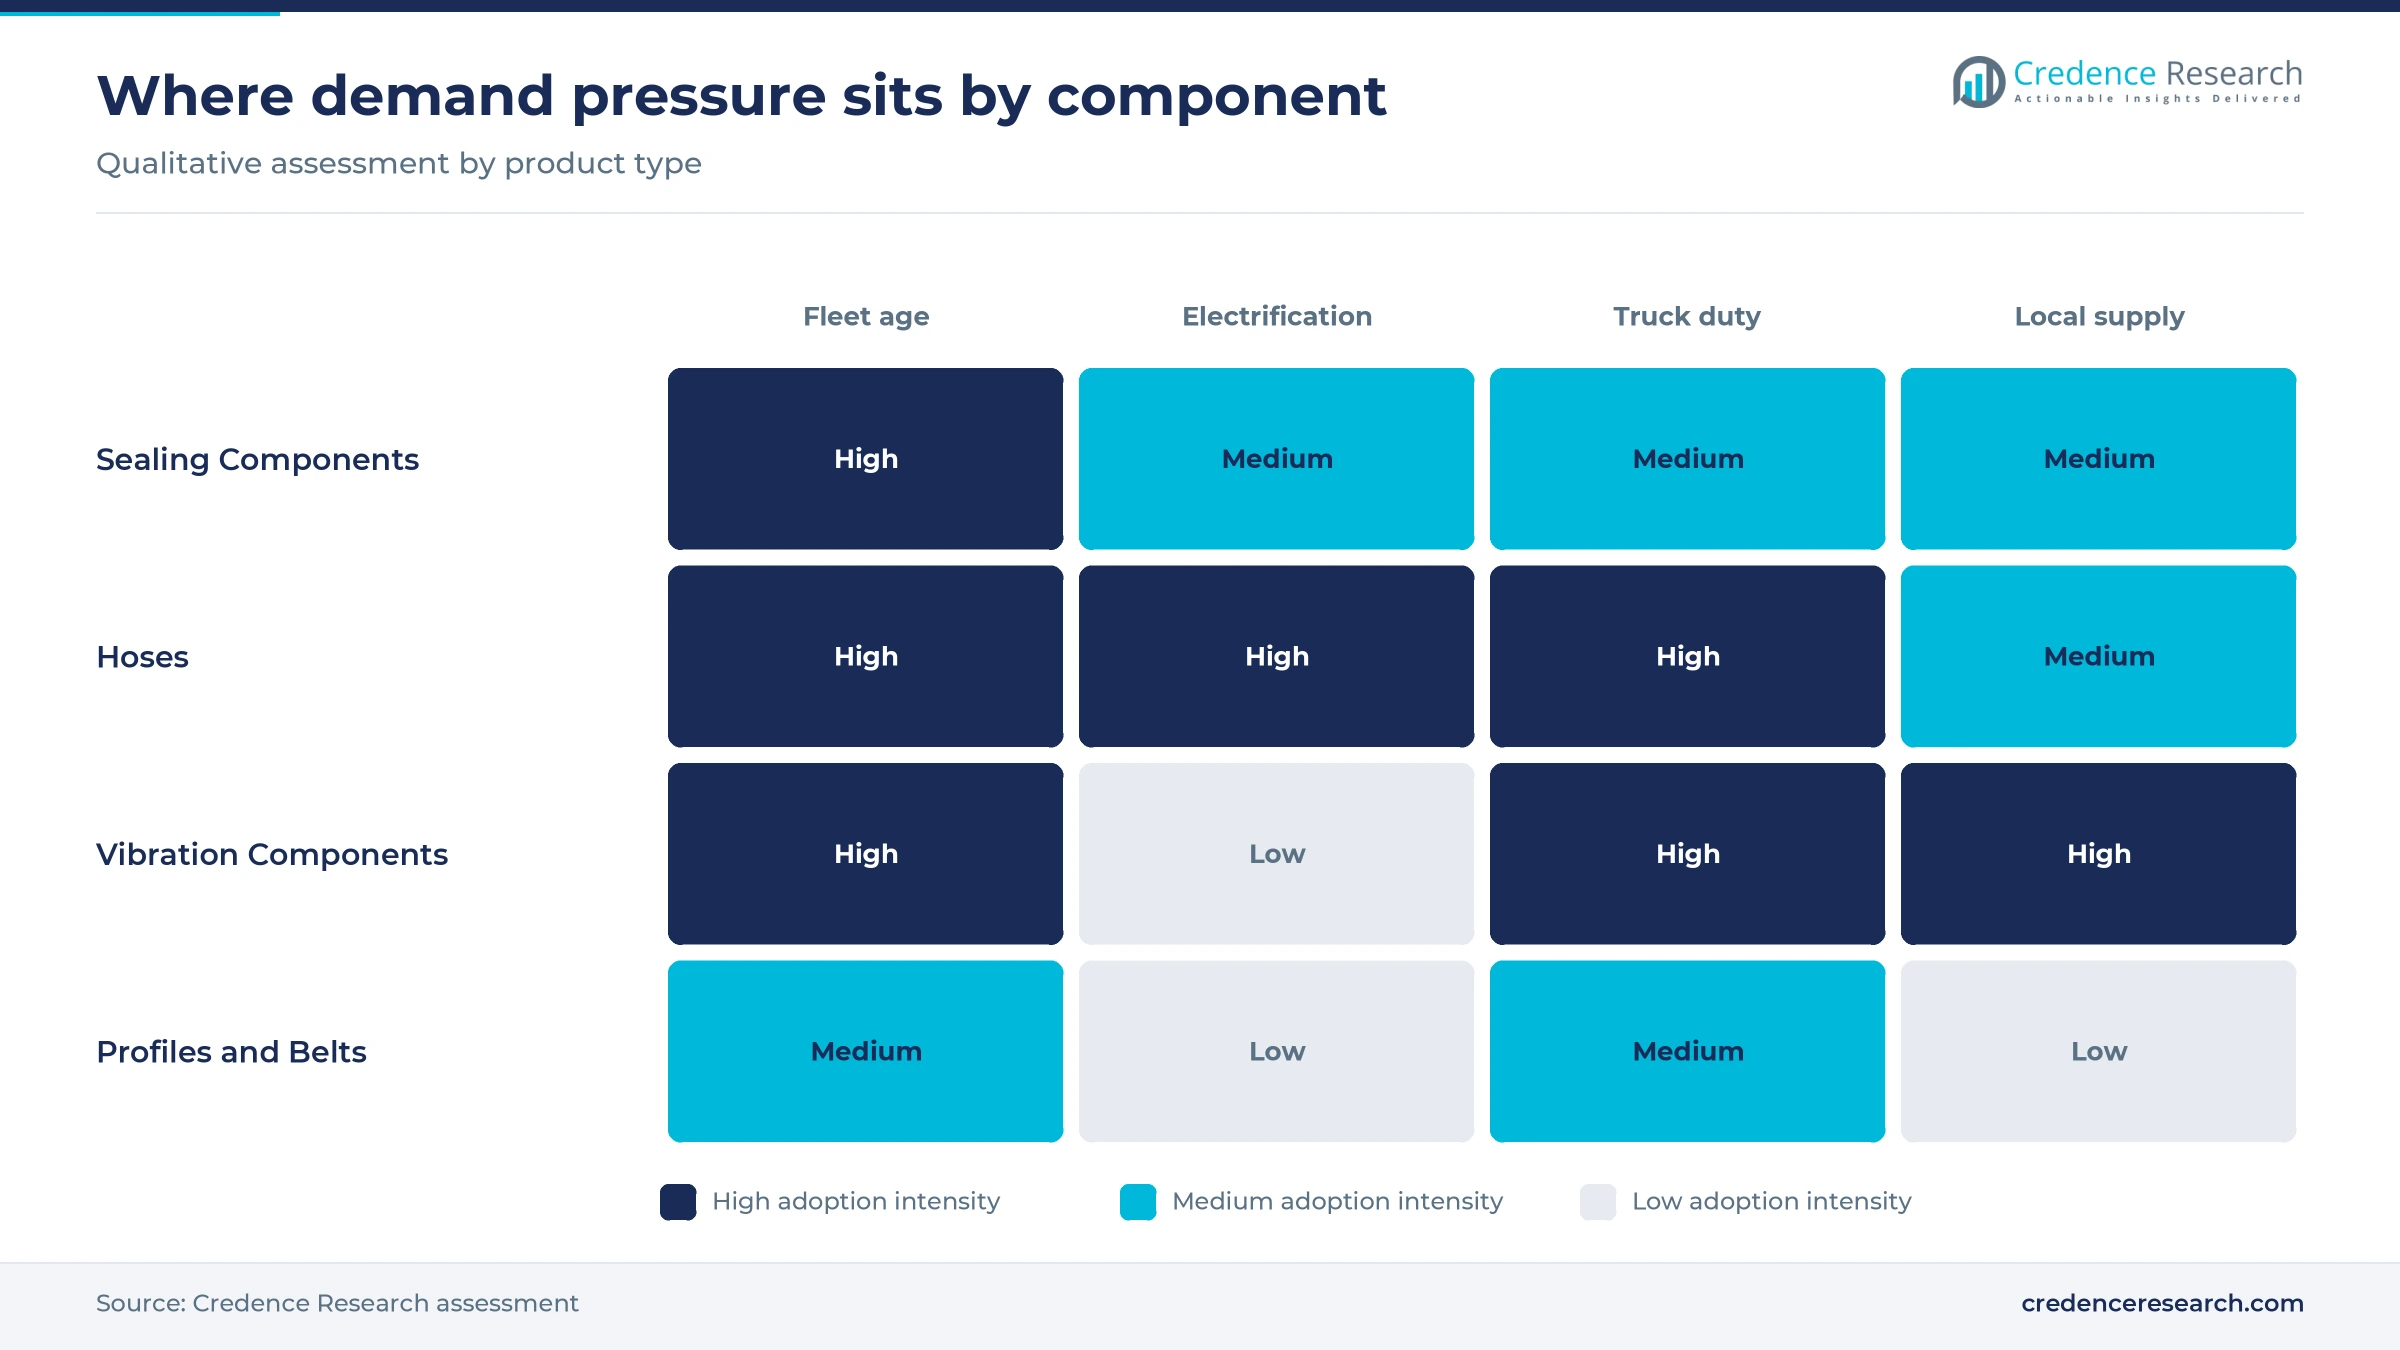
Based on material type, the market is categorized into conventional thermoset rubbers, silicone and fluoroelastomers, thermoplastic elastomers and cast polyurethane elastomers. Conventional Thermoset Rubbers led with 58.0% of 2025 value because petrol and diesel vehicles still made up 67.3% and 29% of the aging fleet, according to GoAuto in November 2025. Silicone and fluoroelastomers grow fastest at 6.77% a year as hybrid sales rose 15.3% to 199,133 in 2025, as the Federal Chamber of Automotive Industries reported. Mackay Australia, founded in 1932 and manufacturing in Melbourne, also lists silicone and urethane in its range.
Which components carry the most replacement value?
Based on product type, the market is categorized into sealing components, hoses, vibration components and profiles and belts. Sealing Components led with 34.0% of 2025 value because every engine, driveline and body opening uses them, and Freudenberg supplies Corteco aftermarket seals from Brendale in Queensland with next-day express delivery. Hoses grow fastest at 6.06% a year as the federal fleet count showed about 709,100 hybrids at January 2025. Gates also sells complete cooling system parts through its distribution center at Dandenong South in Victoria, serving every state and territory through field sales teams.
How does vehicle mix shape rubber parts volume?
Based on vehicle type, the market is categorized into passenger cars and sport utility vehicles, light commercial vehicles, heavy commercial vehicles and motorcycles. Passenger Cars and Sport Utility Vehicles led with 62.0% of 2025 value because the federal count listed 16,080,012 passenger vehicles at January 2025, which was 72.1% of all registrations. Heavy commercial vehicles grow fastest at 6.39% a year as heavy rigid trucks reached 403,870 and articulated trucks reached 128,568 in the same count. Motorcycles remain the smallest group, with 981,068 registered bikes generating far fewer fluid and sealing parts per unit.
Where do workshops and fleets buy elastomer parts?
Based on sales channel, the market is categorized into OEM dealer networks, independent trade distribution and specialist direct supply. Independent Trade Distribution led with 52.0% of 2025 value because Genuine Parts Company Asia Pacific cites about 550 stores across Australia and New Zealand, alongside the wide Bapcor network serving independent workshops. Specialist direct supply grows fastest at 6.18% a year as Freudenberg offers a webshop and small series custom seals in Australia. SuperPro adds to this route, since it engineers and tests polyurethane suspension parts on site at its Brisbane facilities.
| Segment Group | Leading Sub-segment | Share, 2025 | Fastest-growing Sub-segment | CAGR, 2026–2035 |
|---|---|---|---|---|
| By Material Type | Conventional Thermoset Rubbers | 58.0% | Silicone and Fluoroelastomers | 6.77% |
| By Product Type | Sealing Components | 34.0% | Hoses | 6.06% |
| By Vehicle Type | Passenger Cars and Sport Utility Vehicles | 62.0% | Heavy Commercial Vehicles | 6.39% |
| By Sales Channel | Independent Trade Distribution | 52.0% | Specialist Direct Supply | 6.18% |
Request a Free Sample
Fill in your details and we'll send you a free sample report.
- Sample data tables & charts
- Research methodology
Fleet age, electrified cooling and truck duty lift demand
Aging fleet replacement demand sets the base volume
Vehicle age decides how often rubber parts wear out, and the fleet keeps getting older. The Bureau of Infrastructure and Transport Research Economics counted 22,304,349 registered vehicles at January 2025, with average age rising from 11.40 to 11.54 years in twelve months. The same data shows Tasmania at 13.7 years, which marks how long owners now keep vehicles on the road. In turn, more vehicles reach the service points where heat-aged hoses and belts get changed, and Gates advises inspection at 100,000 km and replacement of worn parts at 150,000 km. Purchase price reinforces the habit, because the Federal Chamber of Automotive Industries put the average new vehicle at A$57,951 in 2025, against A$42,505 in 2016.
Electrified thermal-management requirements change the parts mix
Electrified vehicles add coolant circuits for batteries and power electronics, along with the wiring behind electric vehicle copper demand, and that reshapes the hose and seal mix. Registered battery and fuel-cell vehicles rose 54.6% to 259,710 at January 2025, while hybrids climbed about 46% in the same federal count. New sales keep feeding that base because CarExpert reported 103,270 battery electric and 53,484 plug-in hybrid deliveries in 2025. The International Energy Agency put electric cars at around 15% of new car sales that year. Its policy record lists a New Vehicle Efficiency Standard target of 141 grams of carbon dioxide per km for light-duty vehicles from January 2025. As a result, silicone and fluoroelastomers, the fastest material group, advance at 6.77% a year through the forecast.
Commercial fleet service intensity raises parts use per vehicle
Trucks and vans run longer hours under heavier loads, so their mounts, hoses and belts come up for replacement sooner. Rigid trucks grew about 6.2% and articulated trucks about 3.3% in the year to January 2025, ahead of the 2.4% recorded for passenger vehicles in the federal count. Those vehicles also stay in service for a long time, because GoAuto reported in November 2025 that trucks average 16.2 years and buses 13 years. Light commercial buying remains strong too, with 273,229 deliveries in 2025, or 22.0% of the market on VFACTS data. Fleet budgets matter as well, since the Australian Automotive Aftermarket Association attributes about A$3 billion of yearly service and repair spending to fleets.
Mandatory repair data widens the independent workshop base
A mandatory information scheme lets independent workshops keep servicing newer vehicles, and those workshops are major buyers of trade hoses, seals and belts, as well as air filters. The Australian Competition and Consumer Commission states that manufacturers must sell service and repair information at no more than fair market value for passenger and light goods vehicles built from January 2002 onward. That matters because the aftermarket association counts almost 28,000 service and repair workshops, of which about 15,900 employ staff. Trade supply has scaled alongside them, with Bapcor reporting more than 210 Burson Auto Parts stores and more than 1,200 delivery vehicles. Consequently, independent trade distribution held 52.0% of 2025 value in the sales channel split.
Chinese brands and local electric trucks reshape demand
Shift toward Chinese-built vehicles widens the part-number task
The incoming fleet is changing origin, which forces distributors to stock parts for models they have never carried. National Collision Repairer reported in September 2025 that 20,070 Chinese-made vehicles sold in August, 67% more than a year earlier and 20% of new sales that month. BYD, GWM, MG and Chery all entered the top ten brands for the first time in that result. Sourcing is moving in the same direction, because the aftermarket association names China as the largest single origin of imported vehicle parts, at about 21% of the import market. As these vehicles leave warranty, seal and hose catalogs must add new fitments, which favors distributors with fast data and range management.
Rise of locally built electric trucks creates a new domestic buyer
Local truck assembly is the one original-equipment route left at scale, and it is now electrifying. Volvo presented the start of battery electric truck production at its Wacol plant in Queensland on July 8, 2026, and Prime Mover Magazine reported that Linfox will be the first customer. The plant has built trucks for more than 50 years, and local staff trained with international specialists to build these first OEM-manufactured electric heavy vehicles. Heavy commercial deliveries reached 45,264 in 2025, or 3.6% of the market, which gives a sizeable base for this shift. As a result, heavy commercial vehicles, the fastest vehicle group, advance at 6.39% a year as cooling hoses join conventional truck parts.
Opening for locally made polyurethane and molded rubber parts
Local manufacture offers an opening because importers remain exposed on price and lead time. The aftermarket association put vehicle parts and accessories imports at about A$4.0 billion in 2023, up almost 50% over a decade, against exports of about A$1.1 billion. SuperPro shows the local model, designing and manufacturing polyurethane suspension bushes in Australia with engineering and testing on site in Brisbane. Mackay Australia offers the same route for rubber, with molded and bonded products from Dandenong South under ISO 9001 and ISO 14001 certification, according to the Industry Capability Network. Its parent, Derwent Industries, also added machining and fabrication assets in March 2023, which gives suppliers a broader local base for bonded metal and rubber parts.
Opportunity in off-road, four-wheel-drive and motorcycle parts
Off-road use presents a clear opportunity, because dust, heat and rough tracks shorten the life of bushes, boots and mounts. The Federal Chamber of Automotive Industries recorded 92,967 motorcycle and off-highway vehicle deliveries in 2025, and Just Bikes reported first-half 2026 motorcycle sales up 8.2% to 46,023. Off-road motorcycles led that gain, rising 21.6% to 20,417 units in the six months. Diesel deliveries add a parallel base of work vehicles and four-wheel drives, reaching 364,605 in 2025 on VFACTS data. Bapcor also runs Opposite Lock, an Australia-wide chain of four-wheel-drive accessory stores, so specialist polyurethane and upgraded rubber lines already have a retail route to these owners.
Technician gaps, imports and part lead times limit supply
How does the technician shortage limit parts demand?
Parts only sell when a workshop has capacity to fit them. The aftermarket association estimates a shortage of about 28,000 qualified technicians, rising to about 32,000 by 2030, with a gap of about 16,000 apprentice roles by the same year. As a result, owners wait longer for service, and preventive hose or belt changes get deferred until failure. Suppliers respond with complete kits and clearer fitment data, which shorten labor time and help a smaller workforce complete more jobs per day.
Why does import dependence raise cost risk?
Like other aftermarket parts, most finished rubber items arrive from overseas, so currency and input swings reach local buyers quickly. The aftermarket association reports that inflation added 20% to 35% to raw material prices for manufacturers over the past decade. Natural rubber remains volatile as well, with the Rubber Trade Association of Europe showing TSR 20 sliding from just under 160 to just under 150 euro cents per kg during June 2025. Importers therefore hold more safety stock, which ties up working capital and squeezes smaller distributors.
What do long part lead times mean for new brands?
New entrants have not yet built deep local parts stock, which pushes some repairs off the road. TrueEV, the Australian distributor of Xpeng, told CarExpert in December 2025 that part waits range from the same day to about six weeks, depending on air or sea shipping from China. It plans to expand from 18 retail sites to at least 25 by the end of 2026. Until networks mature, dealers carry the risk, and aftermarket seal suppliers find little fitment data to work from.
How does the PFAS ban affect fluorinated seal imports?
Chemical regulation adds a compliance step for importers of fluorinated seal and hose compounds. From July 1, 2025, Australia banned importing, manufacturing and using products containing PFOA, PFHxS and PFOS, including their salts and precursors, according to Maersk. Goods already in service before the ban are exempt, but new shipments are not, apart from trace contamination below defined limits. Importers of fluoroelastomer parts therefore need supplier declarations, which adds paperwork and can slow the qualification of low-cost sources.
Registrations and depots concentrate demand in three states
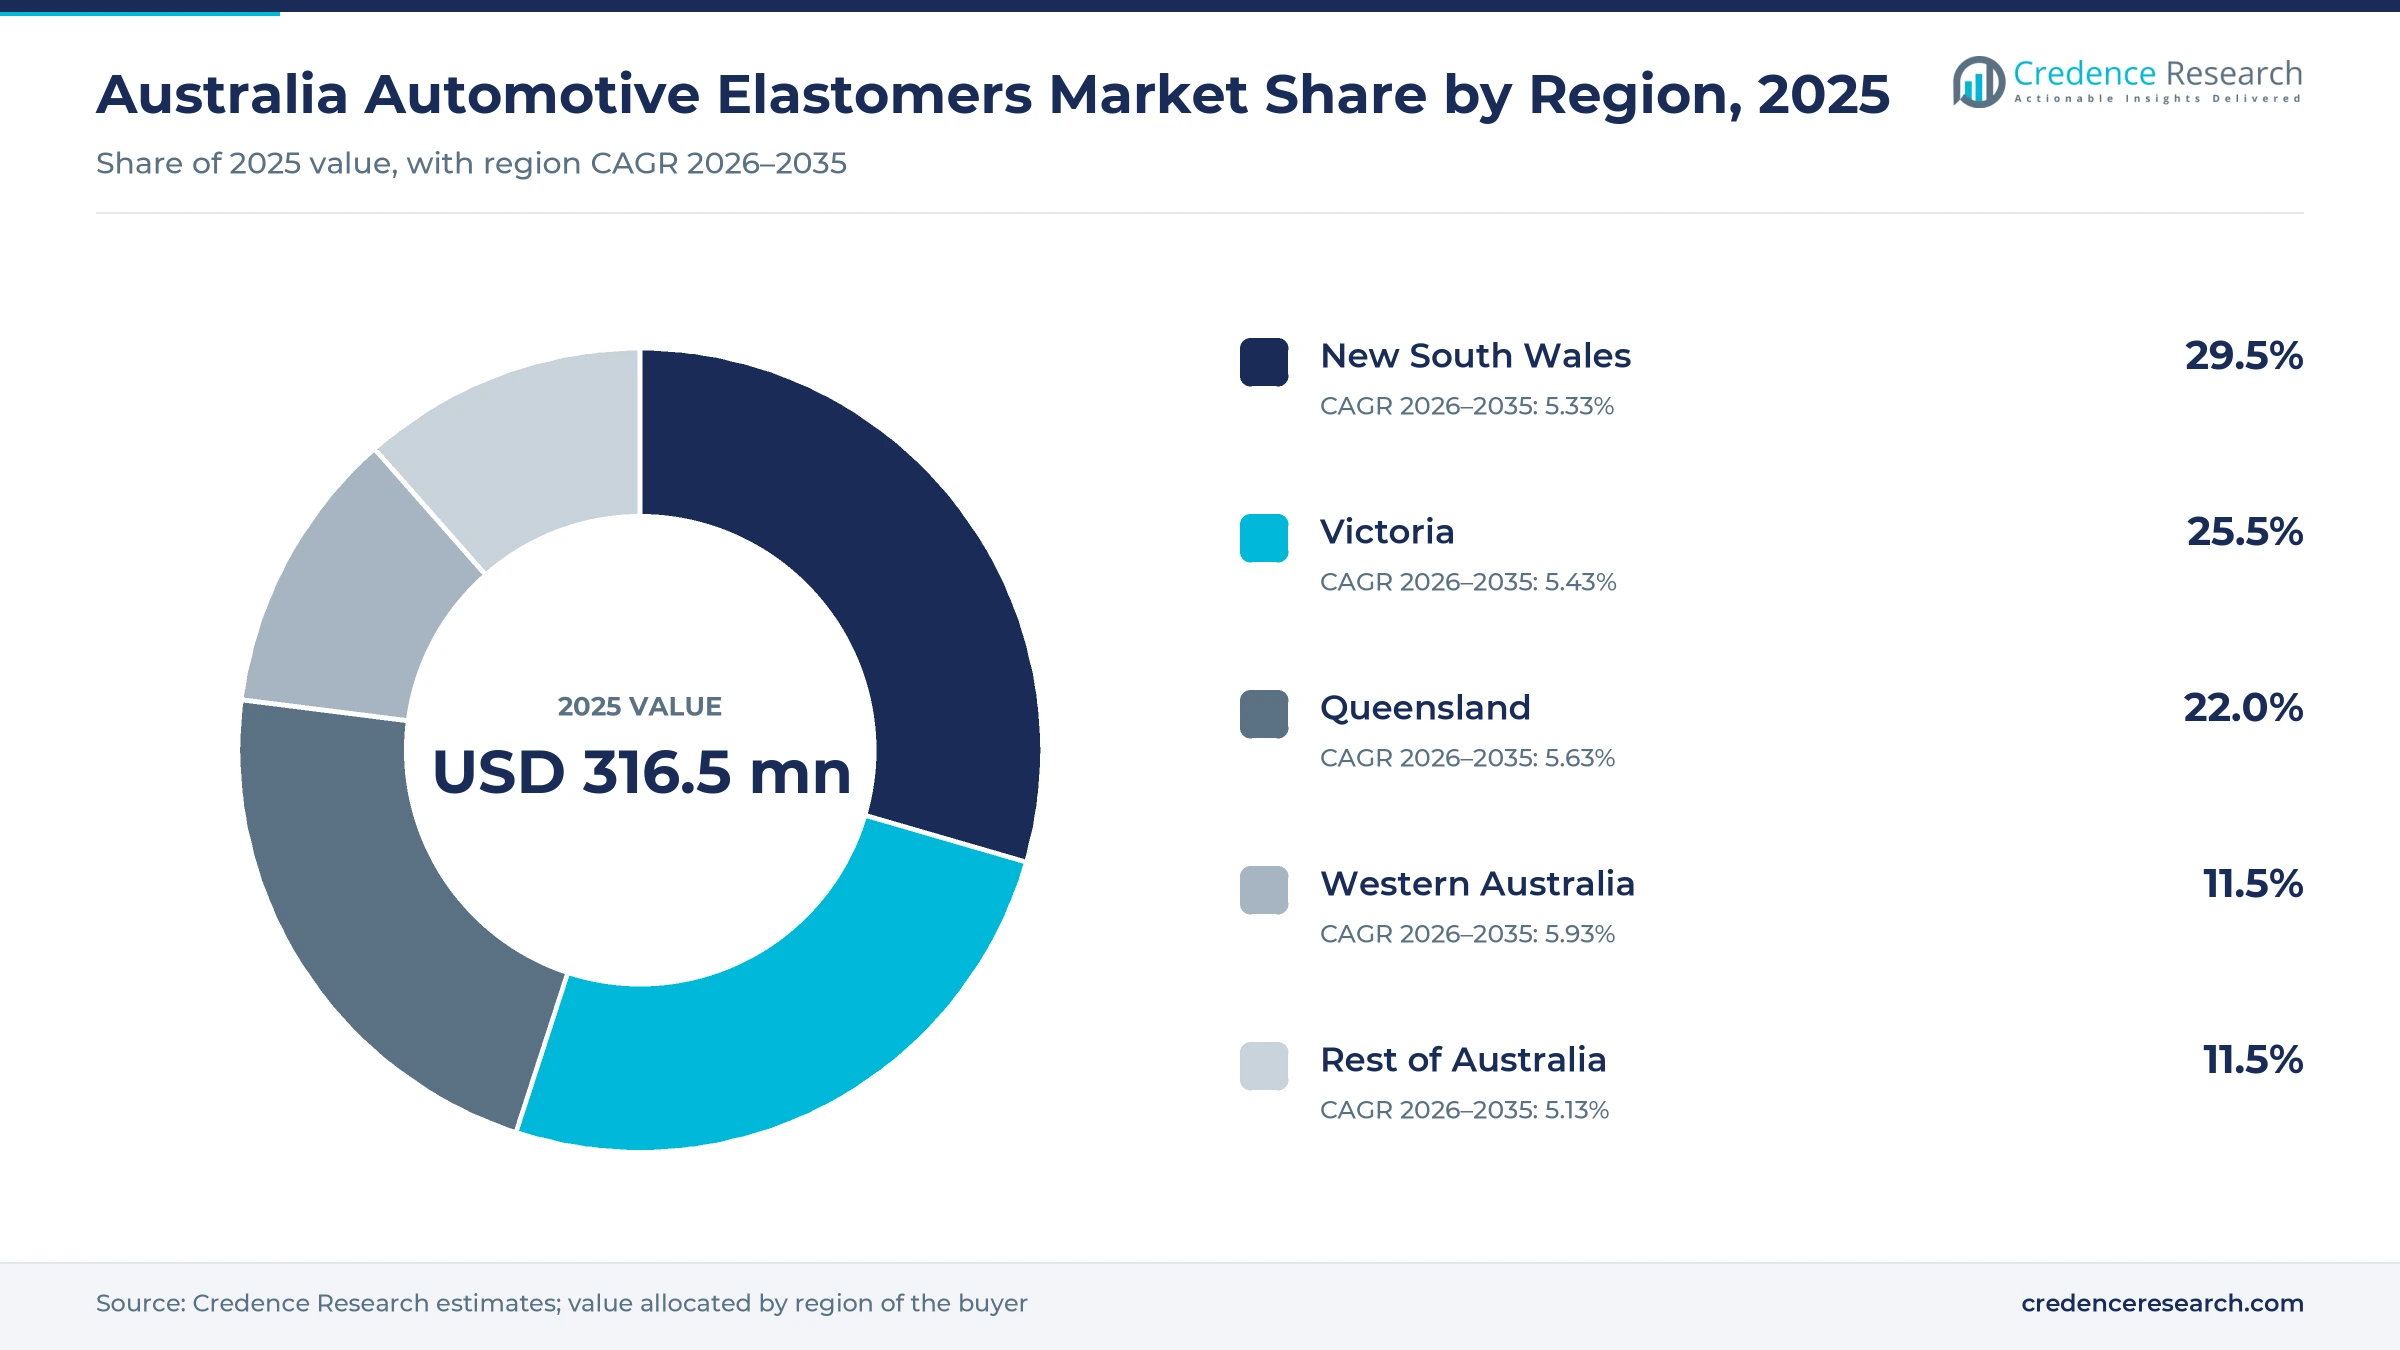
| Region | Value, 2025 (USD million) | Share, 2025 | CAGR, 2026–2035 |
|---|---|---|---|
| New South Wales | 93.4 | 29.5% | 5.33% |
| Victoria | 80.7 | 25.5% | 5.43% |
| Queensland | 69.6 | 22.0% | 5.63% |
| Western Australia | 36.4 | 11.5% | 5.93% |
| Rest of Australia | 36.4 | 11.5% | 5.13% |
New South Wales leads on fleet size and deliveries
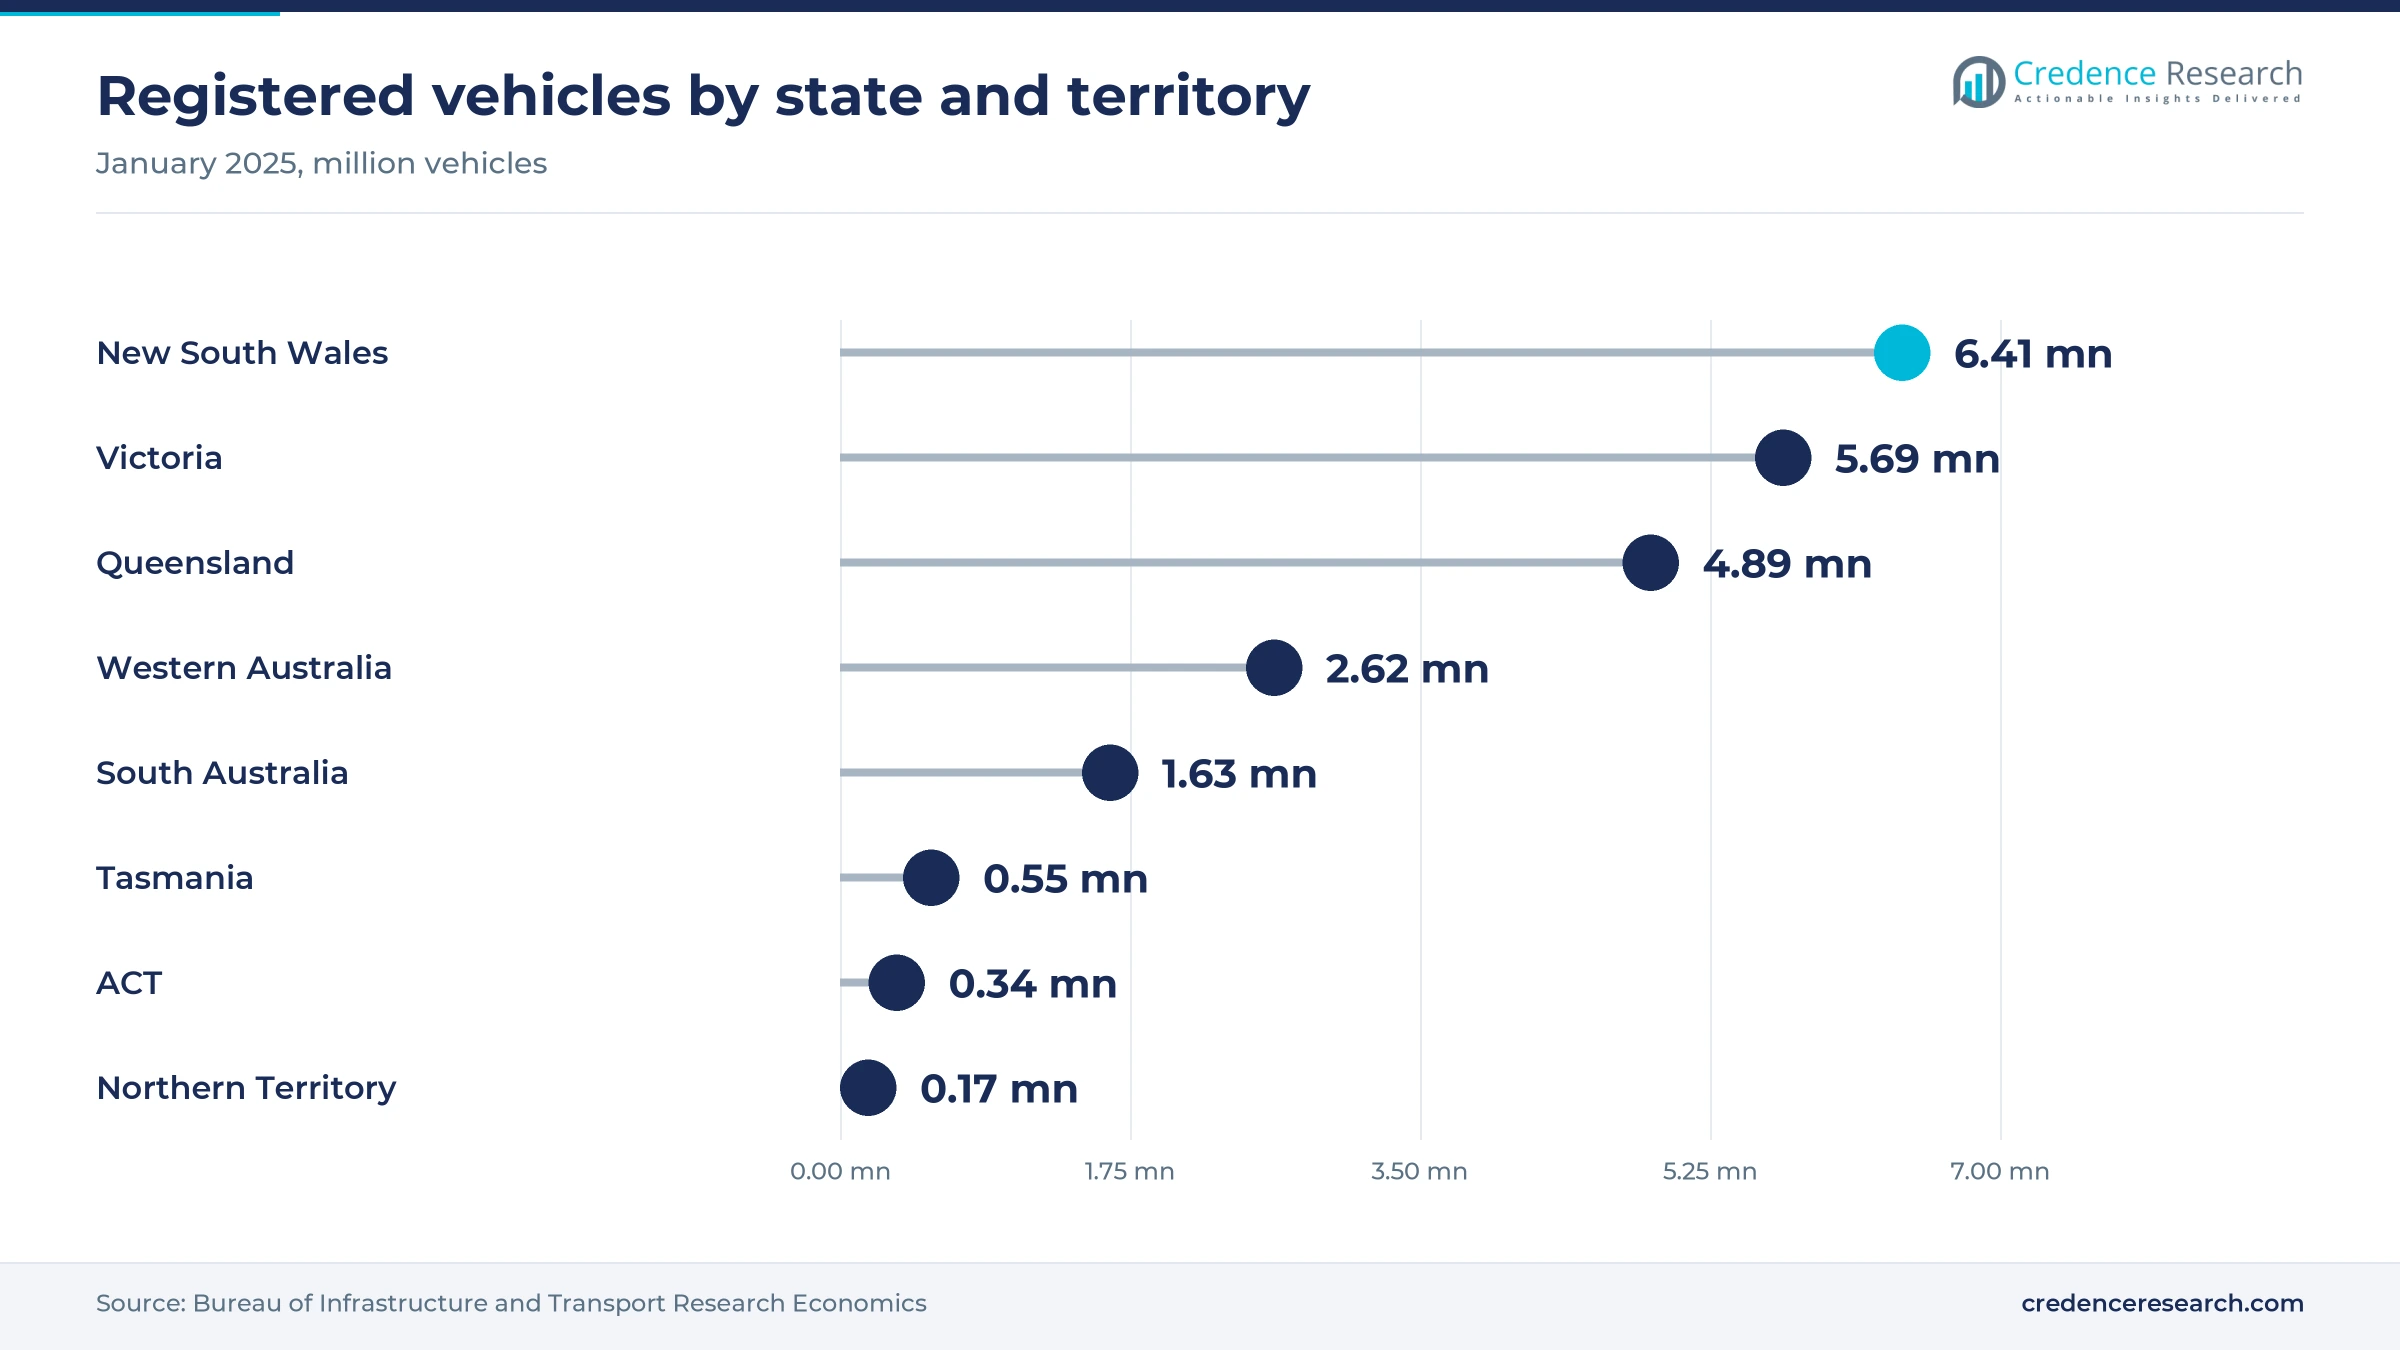
New South Wales held 29.5% of 2025 value and grows at 5.33% a year. The state had 6,407,874 registered vehicles at January 2025, the largest count in the federal data, and took 367,947 new vehicles in 2025 on VFACTS figures. Trade supply is well placed here, because Genuine Parts Company Asia Pacific lists distribution centers at Ingleburn and Glendenning covering about 20,800 square meters. Growth stays slightly below the national rate since the fleet is already large and deliveries fell 0.3% last year.
Victoria combines a large fleet with local manufacturing
Victoria held 25.5% of 2025 value and grows at 5.43% a year. Registrations reached 5,685,173 at January 2025, up 3.05% on the previous year, which was the second-fastest rate among the states and territories. The state also hosts much of the local supply base, since Mackay Australia manufactures in Dandenong South and Gates runs its national distribution center in the same suburb. New vehicle deliveries of 323,768 in 2025 keep dealer parts counters busy, even though they slipped 1.4% from the prior year.
Queensland links truck building with specialist suppliers
Queensland held 22.0% of 2025 value and grows at 5.63% a year, helped by distance and heavy freight duty. The state counted 4,892,464 registered vehicles at January 2025 and took 259,903 new vehicles during 2025. Its supplier base is unusually specialized, with Volvo building trucks at Wacol, SuperPro engineering polyurethane parts in Brisbane and Freudenberg running its Australian sealing office from Brendale. Repco also holds a Brisbane distribution center of about 25,000 square meters, its largest listed site in the country.
Western Australia grows fastest on fleet expansion
Western Australia held 11.5% of 2025 value and grows at 5.93% a year, the fastest regional rate. Registrations rose 3.65% to 2,621,125 at January 2025, the quickest increase in the federal count, while deliveries rose 1.0% to 132,067 in 2025 as most other states declined. Long distances also keep commercial vehicles working hard, which supports hose, mount and belt replacement. Genuine Parts Company Asia Pacific serves this demand from two Welshpool distribution centers totaling about 15,000 square meters.
Rest of Australia carries the oldest vehicles
Rest of Australia, covering South Australia, Tasmania, the Australian Capital Territory and the Northern Territory, held 11.5% of 2025 value and grows at 5.13% a year. South Australia is the largest part with 1,632,496 registered vehicles, while the Northern Territory had only 170,990. Age varies widely across this group, from about 10.7 years in the Australian Capital Territory to much older fleets in Tasmania. Combined growth stays lowest because South Australian deliveries fell 2.4% in 2025, to 78,811 vehicles.
Rules and truck production reset the 2025 to 2026 agenda
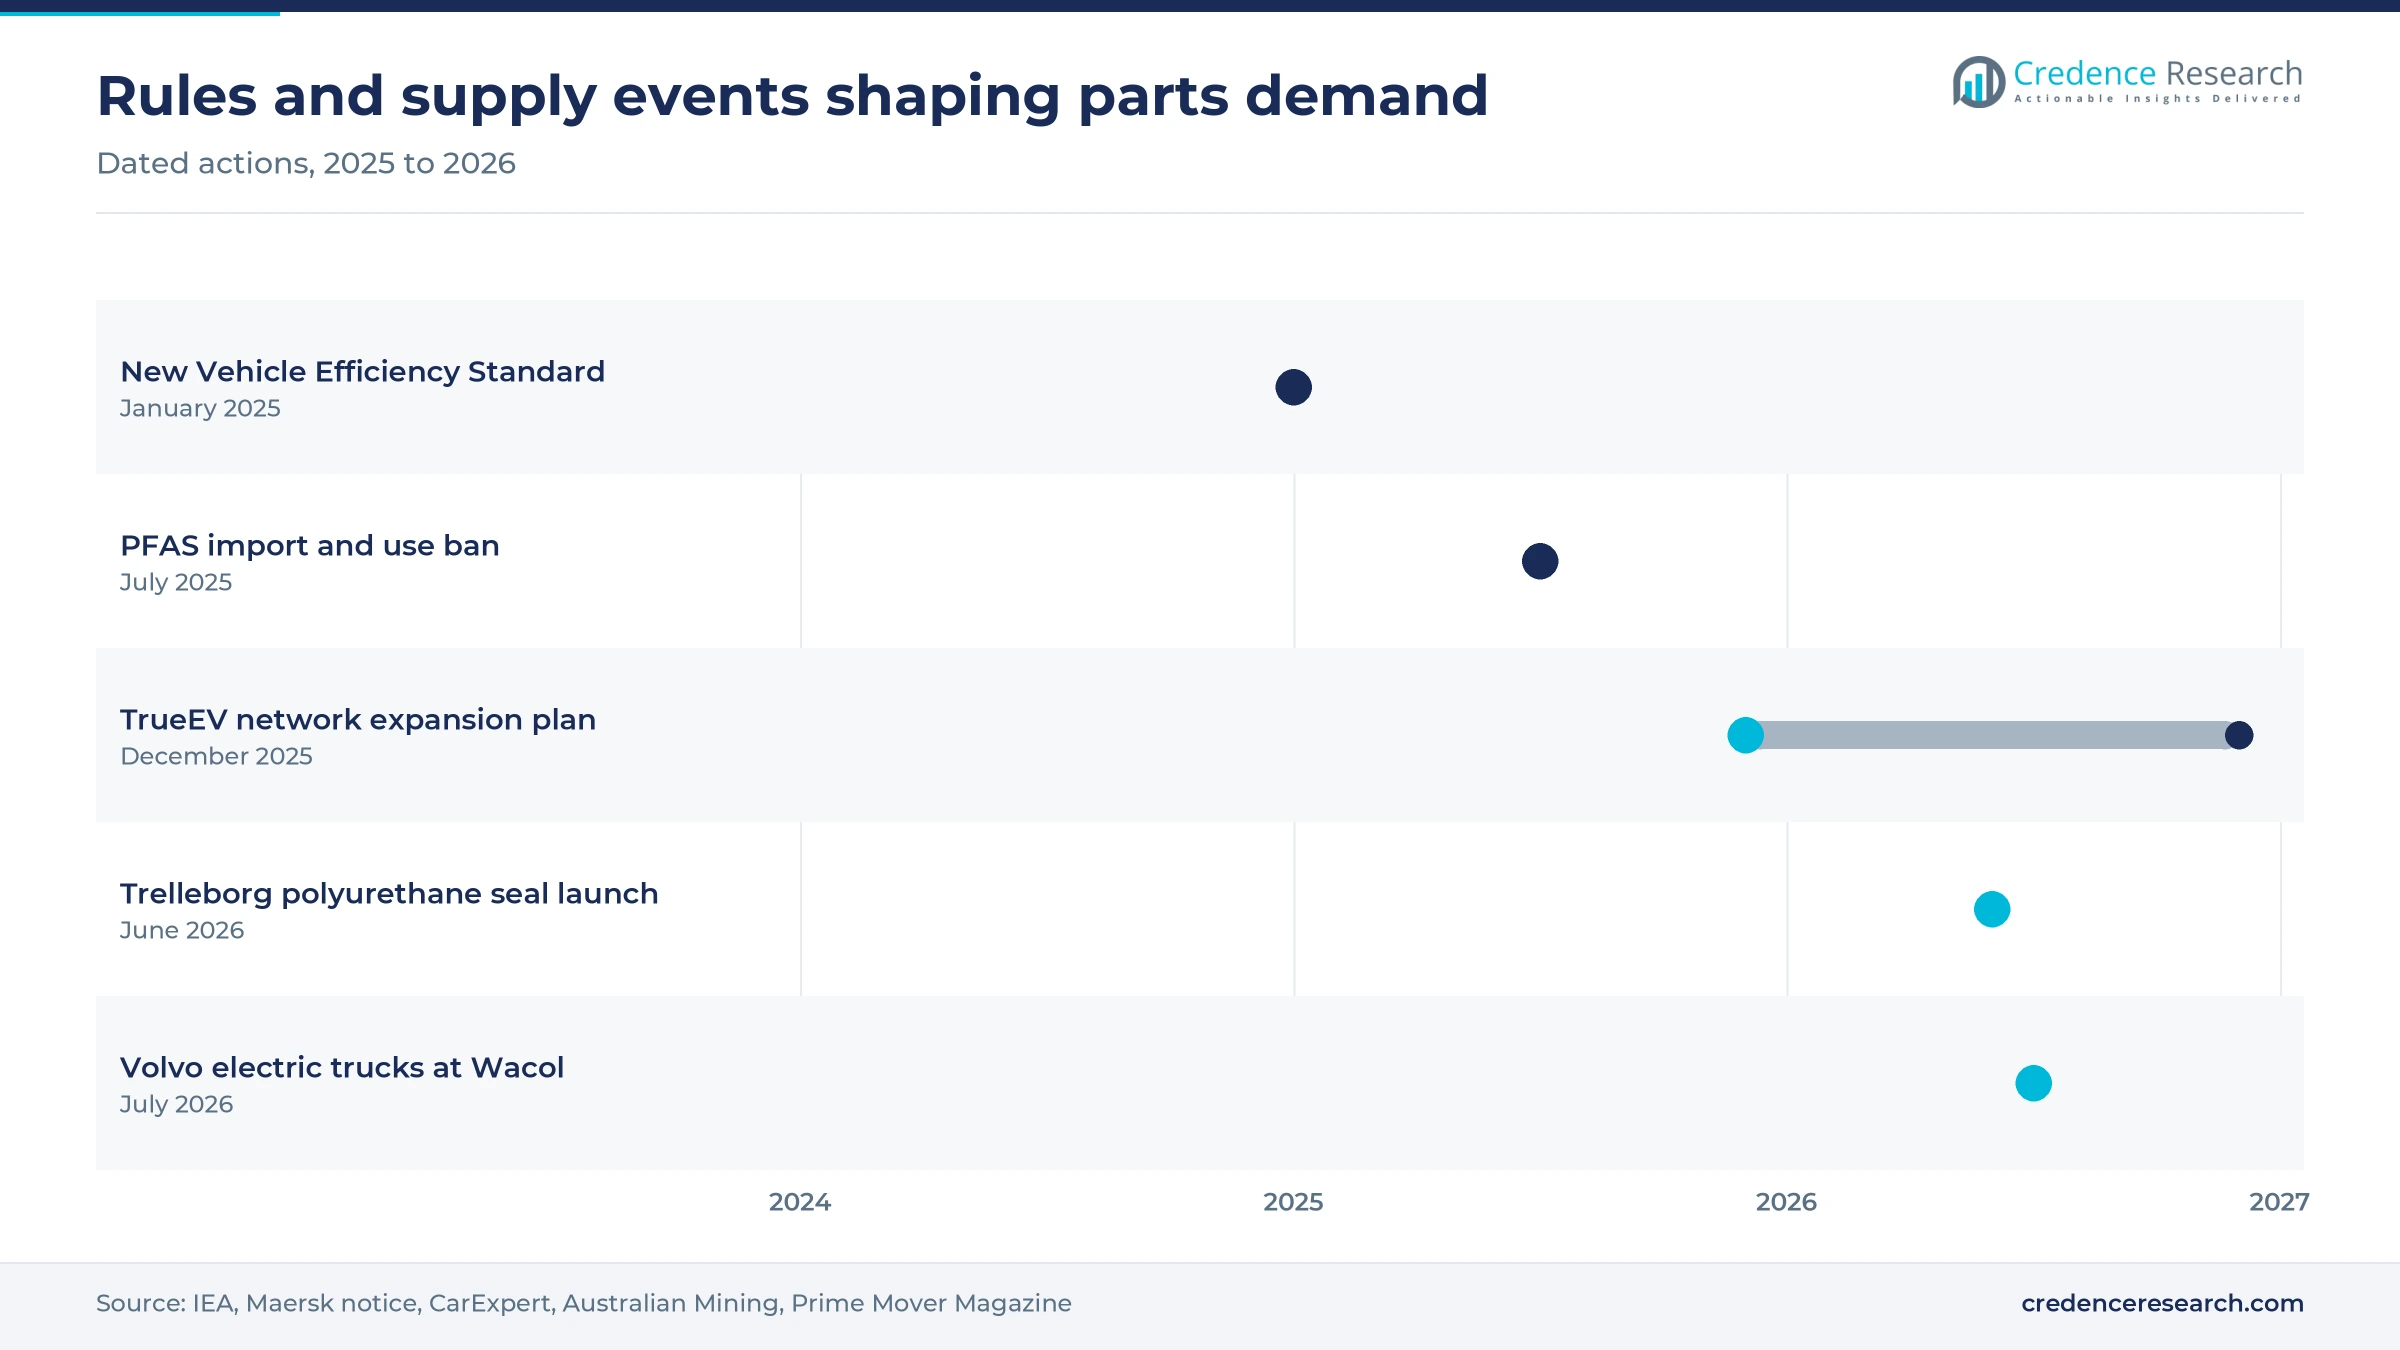
| Development | Status and market relevance |
|---|---|
| In July 2026, Volvo presented the start of battery electric truck production at its Wacol plant in Queensland, with Linfox as first customer. | In production; adds a domestic buyer of cooling hoses and seals |
| In June 2026, Australian Mining reported that Trelleborg launched polyurethane piston, rod and buffer seals and wipers for fluid power customers. | Launched; extends polyurethane sealing options for hydraulic users |
| In December 2025, TrueEV said it plans to expand Xpeng retail sites in Australia from 18 to at least 25 by the end of 2026. | Planned; shortens parts waits as service centers hold more stock |
| In July 2025, Australia banned importing and using products containing PFOA, PFHxS and PFOS, under national industrial chemical rules. | In force; importers of fluorinated compounds must check supply chains |
| In January 2025, the New Vehicle Efficiency Standard took effect, with unit accumulation for suppliers beginning in July 2025. | In force; tightens through 2029 and favors electrified vehicle sales |
Compound choices shift toward heat, fluid and duty needs
- Polyurethane bushes replace rubber in demanding suspension positions, and SuperPro describes the material as a thermosetting polymer with both rubber-like and plastic-like qualities.
- Bonded rubber and metal parts remain central to mounts and isolators, and Mackay Australia produces molded and bonded items alongside silicone and urethane grades in Melbourne.
- Automatic belt tensioners help serpentine drives hold correct load through long service intervals, and Gates sells its DriveAlign tensioners with belts and pulleys through Australian trade channels.
- High-grade polyurethane seals extend fluid compatibility for hydraulic systems, and Trelleborg offers its Zurcon grade for synthetic, fire-resistant and biodegradable fluids.
Need a Custom Version of This Report?
Tailor the scope, geography, or segments to your exact requirements.
- Custom geography or segment scope
- Direct access to our analyst team
Trade reach and local stock decide who wins the workshop
Competition in automotive elastomers turns on catalog breadth, local stock and delivery speed rather than on compound science alone, because most buyers are workshops replacing a failed part. Global sealing and power transmission groups reach those workshops through a mix of their own distribution and national trade chains. Gates runs a Dandenong South distribution center with field sales in each state, while Freudenberg gained its local base when it bought Ludowici Sealing Solutions in 2015. Local manufacturers compete differently, since Mackay Australia and SuperPro can engineer and test near the customer. Bapcor and Repco act as gatekeepers because their store networks decide which brands sit on the shelf. New fitments for Chinese-built vehicles and electrified cooling circuits are the likeliest area for share movement over the forecast, so range management is becoming as important as price.
Companies profiled and their roles in this market
| Company | Type | Role in the market |
|---|---|---|
| Gates Corporation | Global manufacturer | Belts, hoses and cooling parts through a Dandenong South distribution center |
| Freudenberg Sealing Technologies | Global manufacturer | Corteco aftermarket seals and custom sealing from Brendale, Queensland |
| Mackay Australia | Local manufacturer | Molded and bonded rubber, hoses, mounts and seals from Dandenong South |
| SuperPro | Local manufacturer | Polyurethane suspension bushes engineered and tested in Brisbane |
| Trelleborg Sealing Solutions | Global manufacturer | Polyurethane and PTFE hydraulic seals reported by Australian Mining in June 2026 |
Credence Research view on replacement and electrified demand
Credence Research's view is that the automotive elastomers market should be read as a replacement business with an electrified layer on top. The registered fleet is large, aging and still mostly petrol and diesel, so conventional rubber parts will hold the bulk of value well into the next decade. The sharper growth sits in silicone hoses and fluid-resistant seals, because hybrids are reaching the end of warranty in rising numbers. Suppliers that add fitments for new Chinese brands early, and that hold stock close to workshops, should gain share even in slower years for new vehicle sales.
Model draws on fleet counts, sales data and trade reports
The report uses 2025 as the base year and forecasts to 2035. Market values come from the Credence Research model, and segment and regional splits are Credence Research estimates. Inputs include Bureau of Infrastructure and Transport Research Economics fleet counts, VFACTS deliveries as published by CarExpert, Federal Chamber of Automotive Industries reports, Australian Automotive Aftermarket Association industry data, International Energy Agency policy records, and company and supplier pages. Regional shares combine registered vehicles and new deliveries by state. The authors conducted no interviews or surveys for this edition of the report.
Replacement demand stays dominant as hybrids enter service
Through 2035, replacement remains the core of automotive elastomers demand, with the market rising from USD 334.0 million in 2026 to USD 539.4 million by the end of the period. Hybrids sold in large numbers during 2025 will reach typical hose and belt service points around the early 2030s, which should lift demand for higher-specification parts. Efficiency targets for light commercial vehicles fall to 110 grams per km by 2029, so electrified utes could add further cooling demand. Battery electric vehicles eventually remove belts and some engine mounts, although that effect stays gradual because the fleet turns over slowly.
Frequently Asked Questions
How big is the Australia automotive elastomers market?
What drives demand for automotive rubber parts in the country?
Which material leads the market?
Which product type holds the largest share?
Which state is the largest market?
How do workshops usually buy these parts?
Does electrification reduce demand for elastomer parts?
Which companies are active in this market?
Table of Content
Chapter 1 Market Segmentation
- 1.1 Segmentation Framework
- 1.1.1 Product and Service Classification
- 1.1.2 Application and End-Use Classification
- 1.1.3 Technology and Solution Classification
- 1.1.4 Customer and Distribution Channel Classification
- 1.1.5 Geographic Segmentation
- 1.1.6 Market Segment Definitions and Boundaries
- 1.2 By Material Type
- 1.2.1 Conventional Thermoset Rubbers
- 1.2.2 Thermoplastic Elastomers
- 1.2.3 Silicone and Fluoroelastomers
- 1.2.4 Cast Polyurethane Elastomers
- 1.3 By Product Type
- 1.3.1 Sealing Components
- 1.3.2 Hoses
- 1.3.3 Vibration Components
- 1.3.4 Profiles and Belts
- 1.4 By Vehicle Type
- 1.4.1 Passenger Cars and Sport Utility Vehicles
- 1.4.2 Light Commercial Vehicles
- 1.4.3 Heavy Commercial Vehicles
- 1.4.4 Motorcycles
- 1.5 By Sales Channel
- 1.5.1 Independent Trade Distribution
- 1.5.2 OEM Dealer Networks
- 1.5.3 Specialist Direct Supply
Chapter 2 Introduction
- 2.1 Report Objectives and Scope
- 2.2 Product Definition and Industry Terminology
- 2.3 Market Inclusions and Exclusions
- 2.4 Research Process
- 2.4.1 Primary Research and Expert Interviews
- 2.4.2 Secondary Research and Source Review
- 2.4.3 Top-Down and Bottom-Up Estimation
- 2.4.4 Data Triangulation and Verification
- 2.5 Market Size Measurement Basis
- 2.5.1 2025: USD 316.5 million → 2035: USD 539.4 million
- 2.6 Historical and Forecast Reference Periods
- 2.6.1 Historical Period: 2018-2025
- 2.6.2 Base Year: 2025
- 2.6.3 Forecast Period: 2025-2035
- 2.7 Research Assumptions and Limitations
Chapter 3 Executive Summary
- 3.1 Market Snapshot and Key Findings
- 3.2 Base-Year Market Size, 2025
- 3.3 Forecast Market Size, 2035
- 3.4 Revenue and Volume Growth Outlook
- 3.5 Key Demand and Supply Indicators
- 3.6 Leading Market Segments
- 3.7 Fastest-Growing Market Opportunities
- 3.8 Regional Performance Highlights
- 3.9 Technology and Industry Transformation
- 3.10 Competitive Landscape Summary
- 3.11 Analyst View and Strategic Implications
Chapter 4 Australia Automotive Elastomers Market Trends and Developments
- 4.1 Historical Industry Development, 2018-2025
- 4.2 Recent Market Trends and Developments
- 4.3 Demand and Customer Behavior Trends
- 4.4 Technology and Product Innovation
- 4.5 Artificial Intelligence, Automation and Digitalization
- 4.6 Local Manufacturing and Supply Chain Realignment
- 4.7 Industry Partnerships, Mergers and Acquisitions
- 4.8 Sustainability and Circular Economy Developments
- 4.9 Government and Private Sector Investment Trends
- 4.10 Emerging Business Models and Commercialization
- 4.11 Industry Developments and Announcements
Chapter 5 Australia Automotive Elastomers Market Production, Supply and Demand Analysis
- 5.1 Demand Trend and Consumption Analysis, 2018-2025
- 5.2 Demand Forecast, 2025-2035
- 5.3 Production and Output Trend, 2018-2025
- 5.4 Production and Output Forecast, 2025-2035
- 5.5 Installed Capacity and Capacity Utilization
- 5.6 Company-Wise Production Plants and Statistics
- 5.6.1 Installed Production Capacity
- 5.6.2 Actual Production
- 5.6.3 Planned Capacity and Expansion Targets
- 5.7 Supply Chain Structure and Procurement Trends
- 5.8 Supply-Demand Gap and Bottlenecks
- 5.9 Import Dependence and Sourcing Structure
- 5.10 Contract Manufacturing and Outsourcing
- 5.11 Regional Supply and Demand Concentration
Chapter 6 Australia Automotive Elastomers Market Pricing Analysis
- 6.1 Pricing Structure and Measurement
- 6.2 Historical Pricing Trends, 2018-2025
- 6.3 Pricing Outlook, 2025-2035
- 6.4 Average Selling Price and Unit Economics
- 6.5 Pricing by Product and Market Segment
- 6.6 Geographic Pricing Differences
- 6.7 Key Input, Energy, Labor and Logistics Costs
- 6.8 Contract Pricing and Purchasing Models
- 6.9 Pricing Sensitivity and Competitive Positioning
- 6.10 Price, Margin and Profitability Implications
Chapter 7 Australia Automotive Elastomers Market Dynamics
- 7.1 Market Growth Drivers
- 7.1.1 Demand-Side Drivers
- 7.1.2 Technology and Innovation Drivers
- 7.1.3 Infrastructure and Investment Drivers
- 7.1.4 Regulatory and Policy Drivers
- 7.2 Market Restraints
- 7.2.1 Cost and Affordability Constraints
- 7.2.2 Technology and Adoption Barriers
- 7.2.3 Supply Chain and Operational Constraints
- 7.3 Market Challenges
- 7.3.1 Competitive Pressure and Margin Erosion
- 7.3.2 Skills, Infrastructure and Implementation Gaps
- 7.4 Emerging Market Opportunities
- 7.5 Market Dynamics Impact and Time-Horizon Assessment
Chapter 8 Australia Automotive Elastomers Value Chain Analysis
- 8.1 Industry Value Chain Overview
- 8.2 Upstream Suppliers and Critical Inputs
- 8.3 Technology and Component Providers
- 8.4 Manufacturing or Service Delivery
- 8.5 Distribution, Channel Partners and Integrators
- 8.6 Downstream Applications and End Users
- 8.7 Value Addition and Profit Pools
- 8.8 Vertical Integration and Outsourcing
- 8.9 Supplier Concentration and Risk
- 8.10 Supply Chain Localization and Resilience
Chapter 9 Australia Automotive Elastomers Market Regulations and Policies
- 9.1 Relevant Laws, Standards and Compliance Frameworks
- 9.2 Product, Service, Safety and Quality Requirements
- 9.3 Government Policies, Incentives and Subsidies
- 9.4 Imports, Exports and Trade Barriers
- 9.5 Public Procurement and Local Content Requirements
- 9.6 Environmental and Sustainability Compliance
- 9.7 Upcoming Policy Changes and Market Implications
Chapter 10 Australia Automotive Elastomers Market Hotspots and Opportunities
- 10.1 Market Opportunity Mapping and Growth Hotspots
- 10.2 High-Growth Applications and Customer Groups
- 10.3 Underserved Markets and White-Space Opportunities
- 10.4 Emerging Technology and Product Opportunities
- 10.5 New Capacity and Investment Hotspots
- 10.6 Market Entry and Expansion Opportunities
- 10.7 Distribution and Partnership Opportunities
- 10.8 Near-Term and Long-Term Commercial Potential
- 10.9 Opportunity Attractiveness and Execution Risks
Chapter 11 Australia Automotive Elastomers Market Outlook, 2025-2035
- 11.1 Market Size and Analysis
- 11.1.1 Revenue (Market Measurement: 2025: USD 316.5 million → 2035: USD 539.4 million)
- 11.1.2 Market Volume and Quantity Sold
- 11.1.3 Historical Market Size, 2018-2025
- 11.1.4 Base-Year Market Size, 2025
- 11.2 Market Forecast, 2025-2035
- 11.2.1 Revenue Forecast to 2035
- 11.2.2 Volume Forecast to 2035
- 11.2.3 CAGR and Year-on-Year Growth
- 11.2.4 Incremental Revenue Opportunity
- 11.3 Forecast Assumptions and Scenario Analysis
- 11.3.1 Base-Case Forecast
- 11.3.2 Optimistic and Conservative Scenarios
- 11.3.3 Technology, Pricing and Policy Sensitivities
- 11.4 Market Attractiveness and Growth Outlook
Chapter 12 Australia Automotive Elastomers Market Segmentation and Outlook
- 12.1 Segmentation Summary and Market Shares, 2025
- 12.2 Largest and Fastest-Growing Segments
- 12.3 By Material Type - Market Size and Forecast, 2025-2035
- 12.3.1 Segment Definition and Scope
- 12.3.2 Historical Market Size, 2018-2025
- 12.3.3 Revenue Forecast, 2025-2035
- 12.3.4 Volume Forecast, 2025-2035
- 12.3.5 Base-Year Market Share, 2025
- 12.3.6 Segment CAGR and Growth Drivers
- 12.3.7 Subsegment Market Size and Forecast
- 12.3.7.1 Conventional Thermoset Rubbers
- 12.3.7.2 Thermoplastic Elastomers
- 12.3.7.3 Silicone and Fluoroelastomers
- 12.3.7.4 Cast Polyurethane Elastomers
- 12.3.8 Subsegment Pricing and Adoption Trends
- 12.3.9 Leading Suppliers and Competition
- 12.3.10 Regional Demand and Opportunities
- 12.4 By Product Type - Market Size and Forecast, 2025-2035
- 12.4.1 Segment Definition and Scope
- 12.4.2 Historical Market Size, 2018-2025
- 12.4.3 Revenue Forecast, 2025-2035
- 12.4.4 Volume Forecast, 2025-2035
- 12.4.5 Base-Year Market Share, 2025
- 12.4.6 Segment CAGR and Growth Drivers
- 12.4.7 Subsegment Market Size and Forecast
- 12.4.7.1 Sealing Components
- 12.4.7.2 Hoses
- 12.4.7.3 Vibration Components
- 12.4.7.4 Profiles and Belts
- 12.4.8 Subsegment Pricing and Adoption Trends
- 12.4.9 Leading Suppliers and Competition
- 12.4.10 Regional Demand and Opportunities
- 12.5 By Vehicle Type - Market Size and Forecast, 2025-2035
- 12.5.1 Segment Definition and Scope
- 12.5.2 Historical Market Size, 2018-2025
- 12.5.3 Revenue Forecast, 2025-2035
- 12.5.4 Volume Forecast, 2025-2035
- 12.5.5 Base-Year Market Share, 2025
- 12.5.6 Segment CAGR and Growth Drivers
- 12.5.7 Subsegment Market Size and Forecast
- 12.5.7.1 Passenger Cars and Sport Utility Vehicles
- 12.5.7.2 Light Commercial Vehicles
- 12.5.7.3 Heavy Commercial Vehicles
- 12.5.7.4 Motorcycles
- 12.5.8 Subsegment Pricing and Adoption Trends
- 12.5.9 Leading Suppliers and Competition
- 12.5.10 Regional Demand and Opportunities
- 12.6 By Sales Channel - Market Size and Forecast, 2025-2035
- 12.6.1 Segment Definition and Scope
- 12.6.2 Historical Market Size, 2018-2025
- 12.6.3 Revenue Forecast, 2025-2035
- 12.6.4 Volume Forecast, 2025-2035
- 12.6.5 Base-Year Market Share, 2025
- 12.6.6 Segment CAGR and Growth Drivers
- 12.6.7 Subsegment Market Size and Forecast
- 12.6.7.1 Independent Trade Distribution
- 12.6.7.2 OEM Dealer Networks
- 12.6.7.3 Specialist Direct Supply
- 12.6.8 Subsegment Pricing and Adoption Trends
- 12.6.9 Leading Suppliers and Competition
- 12.6.10 Regional Demand and Opportunities
- 12.7 Segment Growth Comparison
- 12.8 Segment Attractiveness and Priority Matrix
Chapter 13 Australia Automotive Elastomers Geographic Market Outlook, 2025-2035
- 13.1 Domestic Market Distribution and Demand Clusters
- 13.2 State- or Province-Wise Market Size and Forecast, 2025-2035
- 13.3 City and Metropolitan Market Outlook
- 13.4 Industrial, Manufacturing and Commercial Clusters
- 13.5 Geographic Concentration of Key End Users
- 13.6 Local Pricing and Purchasing Differences
- 13.7 Domestic Production Facilities and Capacity Map
- 13.8 Local Infrastructure and Project Pipeline
- 13.9 State-Level Policy and Incentive Differences
- 13.10 Subnational Investment Hotspots and Opportunities
- 13.11 Distribution and Logistics Networks
- 13.12 Domestic Competitive Footprint
Chapter 14 Australia Automotive Elastomers Technology, Innovation and Sustainability Outlook
- 14.1 Technology Landscape and Maturity
- 14.2 Product, Process and Service Innovation
- 14.3 AI, Automation and Digital Tools in the Industry
- 14.4 Technology Adoption and Performance Benchmarking
- 14.5 Innovation Pipeline and R&D Investment
- 14.6 Patent and Intellectual Property Trends
- 14.7 Energy Efficiency and Resource Management
- 14.8 Sustainability, Recycling and Circularity
- 14.9 Technology Roadmap, 2025-2035
- 14.10 Risks of Obsolescence and Technology Substitution
Chapter 15 Australia Automotive Elastomers Market Key Strategic Imperatives
- 15.1 Growth and Market Entry Priorities
- 15.2 High-Return Products and Segments
- 15.3 Pricing, Profitability and Cost Optimization
- 15.4 Technology Investment and Product Differentiation
- 15.5 Supply Chain Localization and Resilience
- 15.6 Distribution and Customer Acquisition
- 15.7 Partnership, Acquisition and Capacity Strategy
- 15.8 Regional Expansion Priorities
- 15.9 Short-, Medium- and Long-Term Actions
Chapter 16 Competition Outlook
- 16.1 Industry Competition Characteristics
- 16.2 Market Structure and Concentration
- 16.3 Market Share and Competitive Positioning, 2025
- 16.4 Company-Wise Revenue and Product Benchmarking
- 16.5 Production and Service Capacity Benchmarking
- 16.6 Technology, Pricing and Differentiation
- 16.7 Regional Footprint and Distribution Strength
- 16.8 Mergers, Acquisitions and Strategic Alliances
- 16.9 New Entrants and Competitive Threats
- 16.10 Porter's Five Forces and Industry Attractiveness
- 16.11 Competitive Outlook, 2025-2035
Chapter 17 Company Profiles
- 17.1 Company Coverage and Selection Criteria
- 17.2 Continental AG
- 17.2.1 Business Description
- 17.2.2 Company Ownership and Geographic Presence
- 17.2.3 Product and Service Portfolio
- 17.2.4 Manufacturing and Operating Footprint
- 17.2.5 Production Capacity and Expansion Plans
- 17.2.6 Financial Performance and Investment
- 17.2.7 Market Share and Competitive Position
- 17.2.8 Technology and Innovation Capabilities
- 17.2.9 Strategic Alliances or Partnerships
- 17.2.10 Recent Developments
- 17.2.11 Growth Strategy and Outlook
- 17.3 Gates Corporation
- 17.4 Dayco
- 17.5 Freudenberg Sealing Technologies
- 17.6 Parker Hannifin
- 17.7 Trelleborg Sealing Solutions
- 17.8 SKF
- 17.9 Dana Incorporated
- 17.10 Mackay Australia
- 17.11 SuperPro
- 17.12 Other Relevant Market Participants
Note: Every listed company is profiled on the structure shown under the first company. The company list is preliminary and may change based on research findings, market developments, data availability and client requirements.
Chapter 18 Disclaimer
- 18.1 Research and Forecast Disclaimer
- 18.2 Data Source and Estimation Limitations
Note: The depth of individual sections depends on data availability for this market. Volume, capacity, trade and other unit-based metrics are included where applicable.

