
Asia-Pacific cold chain outsourcing moves beyond storage
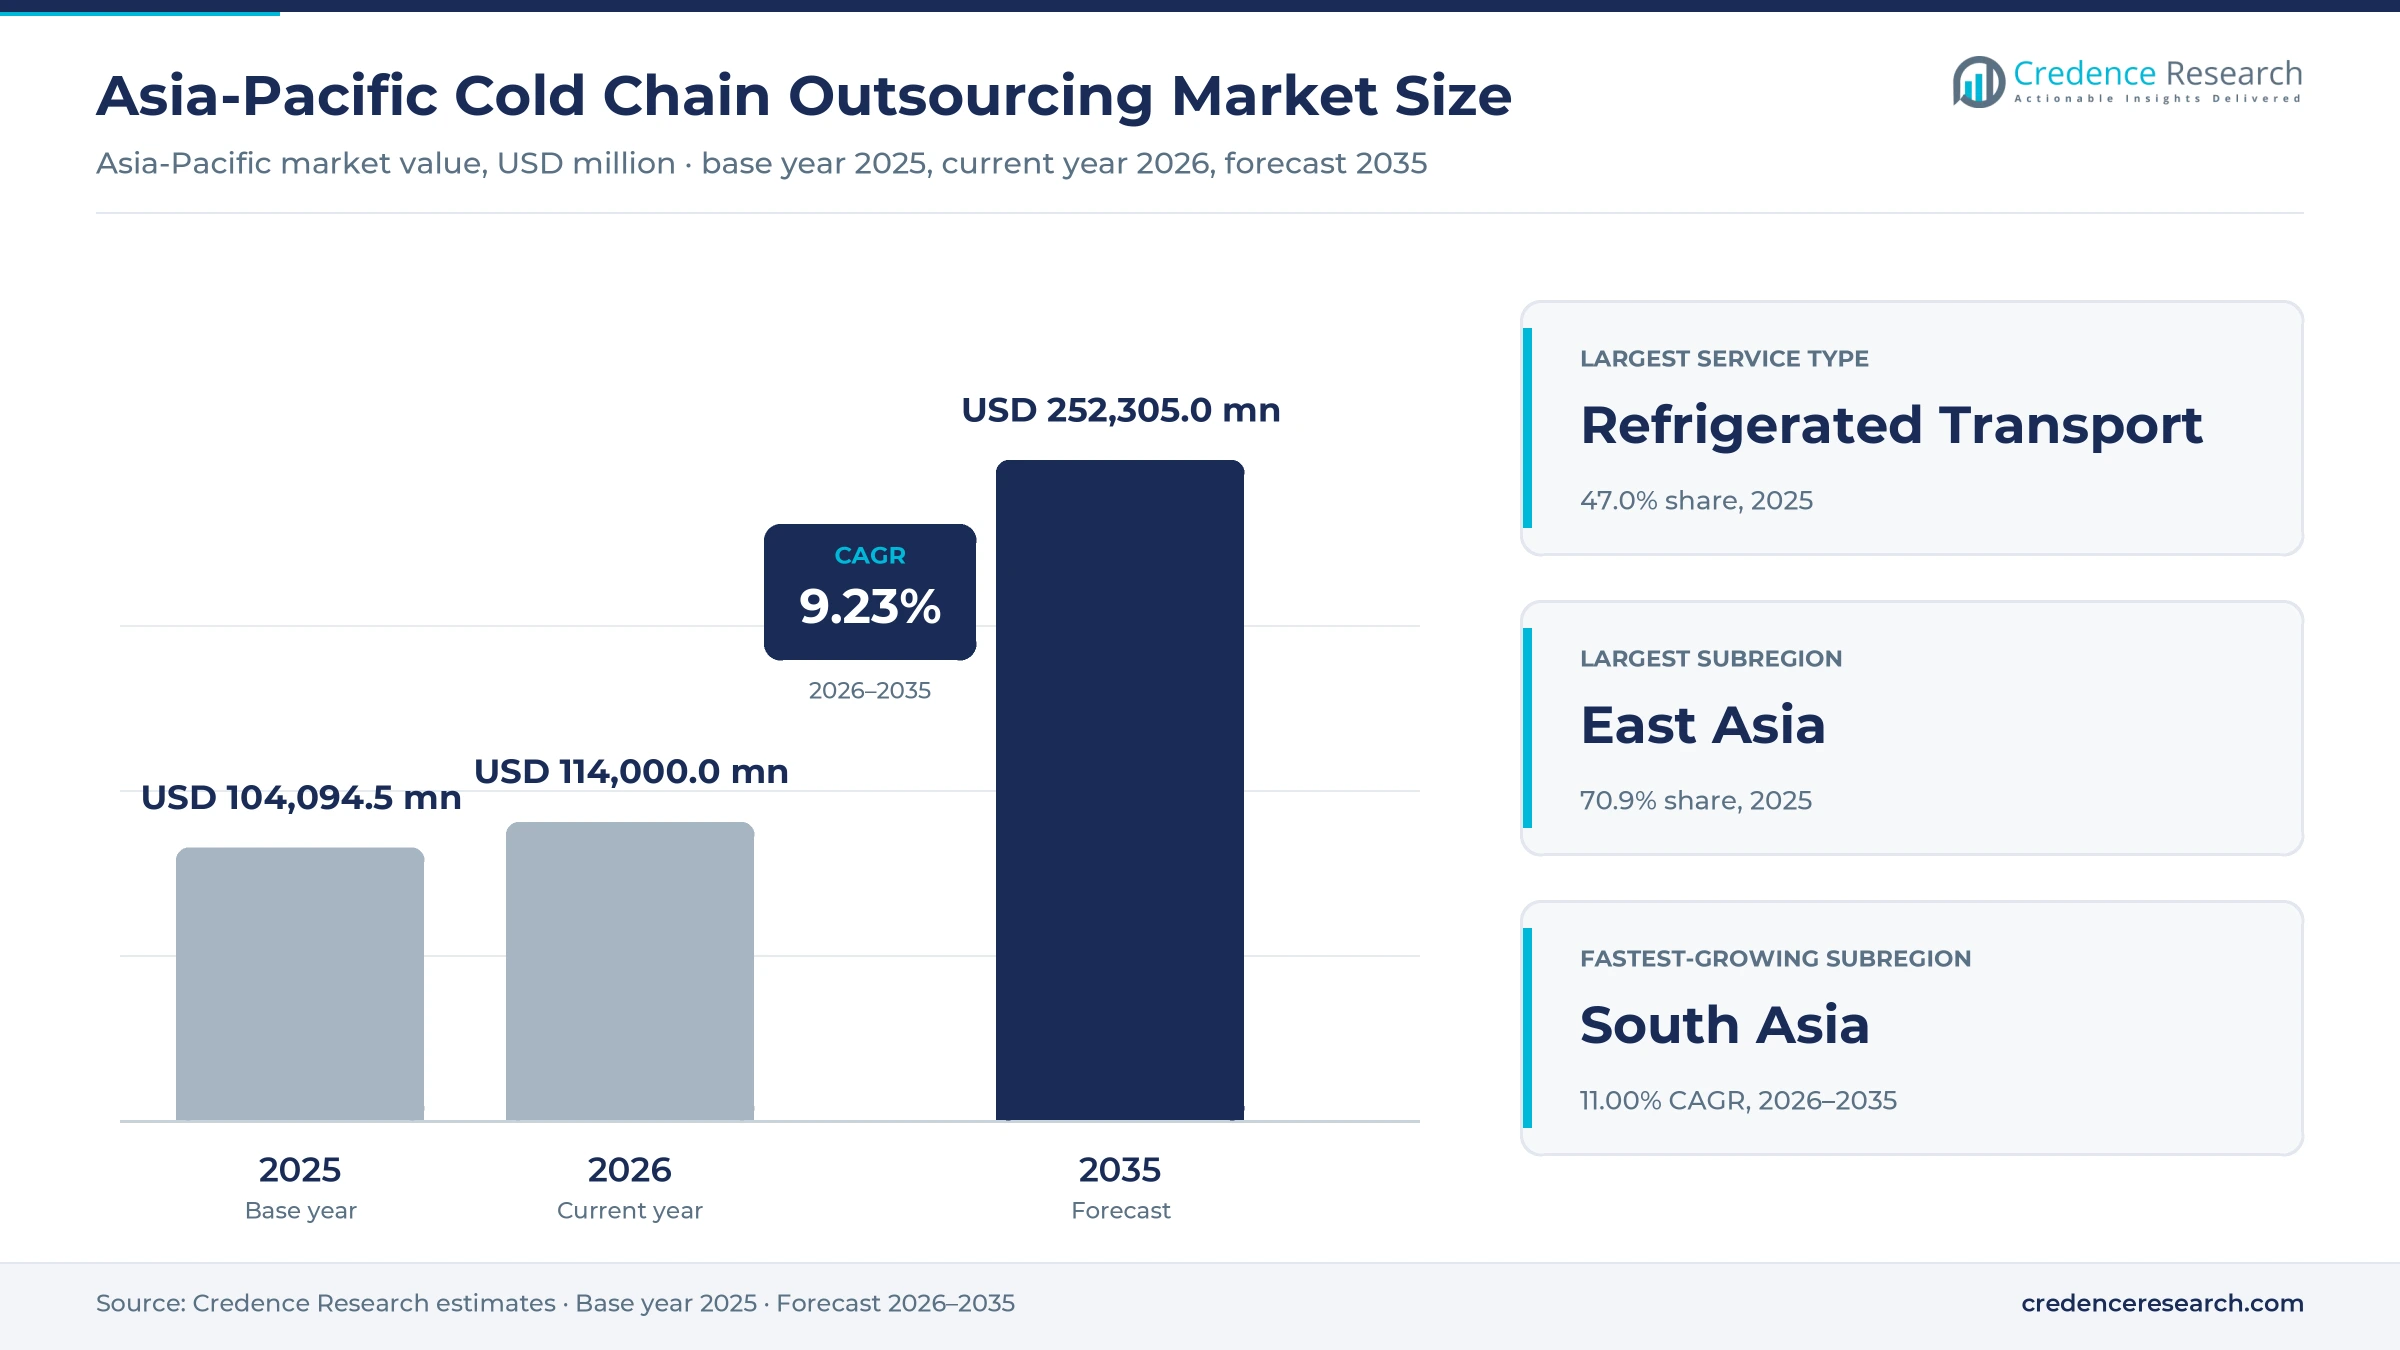
The Asia-Pacific cold chain outsourcing market was valued at USD 104.09 billion in 2025 and is projected to increase from USD 114.00 billion in 2026 to USD 252.30 billion by 2035, registering a CAGR of 9.23% during 2026–2035. Demand comes from food processors, retailers, restaurant chains and drug makers that hand refrigerated storage and transport to specialist operators rather than running their own. East Asia held the largest share, 70.9% in 2025, because China alone reported 267 million cubic meters of cold storage capacity that year, according to the China Federation of Logistics and Purchasing. South Asia is the fastest-growing subregion at 11.00% a year, helped by federal subsidies for Indian projects and new pallet capacity from listed operators. The most important commercial change is the pivot toward healthcare, shown when DHL Group set aside EUR 500 million for the region in April 2025. Operators that combine compliant sites with reach across several borders are gaining contracts from multinational shippers.
What does outsourced cold chain spending in Asia-Pacific cover?
The market counts fees paid to third parties for refrigerated storage, refrigerated transport by road, sea, air and rail, and related services such as packing, labeling, customs brokerage and returns. Buyers usually purchase these services through dedicated contracts, shared-user pallet rates or single-shipment bookings, depending on volume and compliance needs.
The estimate excludes refrigerated fleets and warehouses that shippers run for themselves, along with sales of refrigeration equipment, insulated packaging and software. The value chain runs from farm, plant or port through cold stores and carriers to retail shelves, restaurant kitchens, hospitals and pharmacies.
Asia-Pacific Cold Chain Outsourcing Market Insights
- Spending rises from USD 104.09 billion in 2025 to USD 252.30 billion by 2035, a 9.23% annual pace as food and drug shippers outsource more temperature-controlled work.
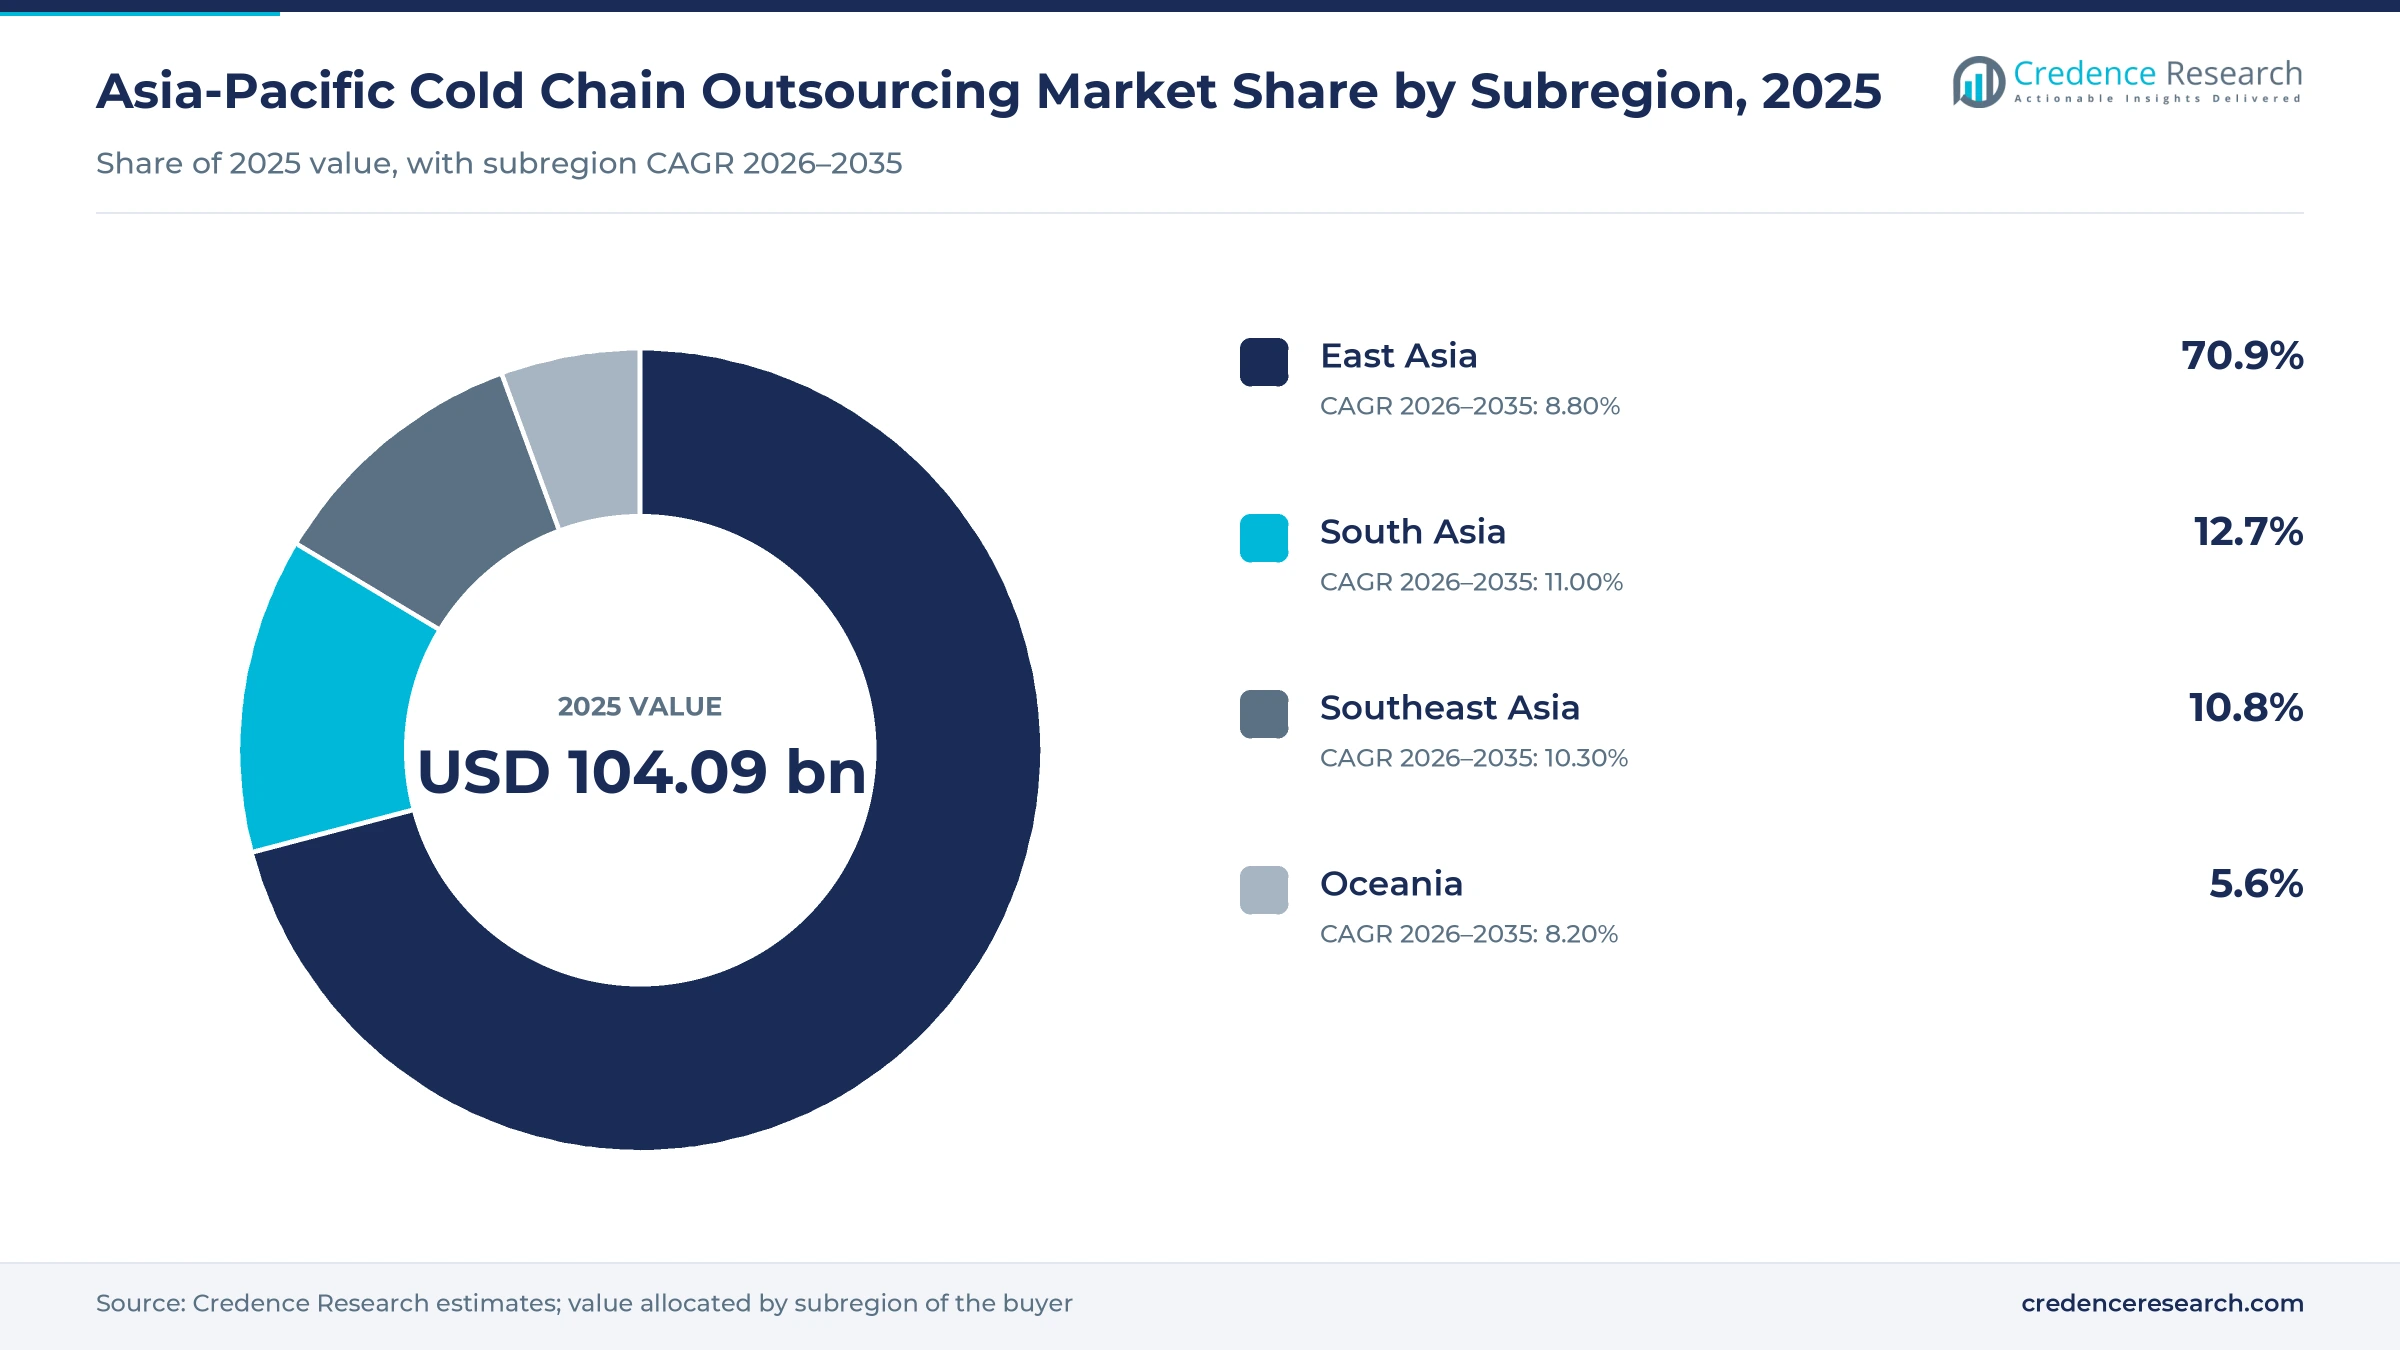
- East Asia held 70.9% of 2025 value, supported by China, Japan and South Korea, while South Asia expands fastest at 11.00% a year.
- Food and Beverages led the end-use split with 68.0% in 2025, reflecting meat, seafood and fresh produce volumes moved under contract across the region.
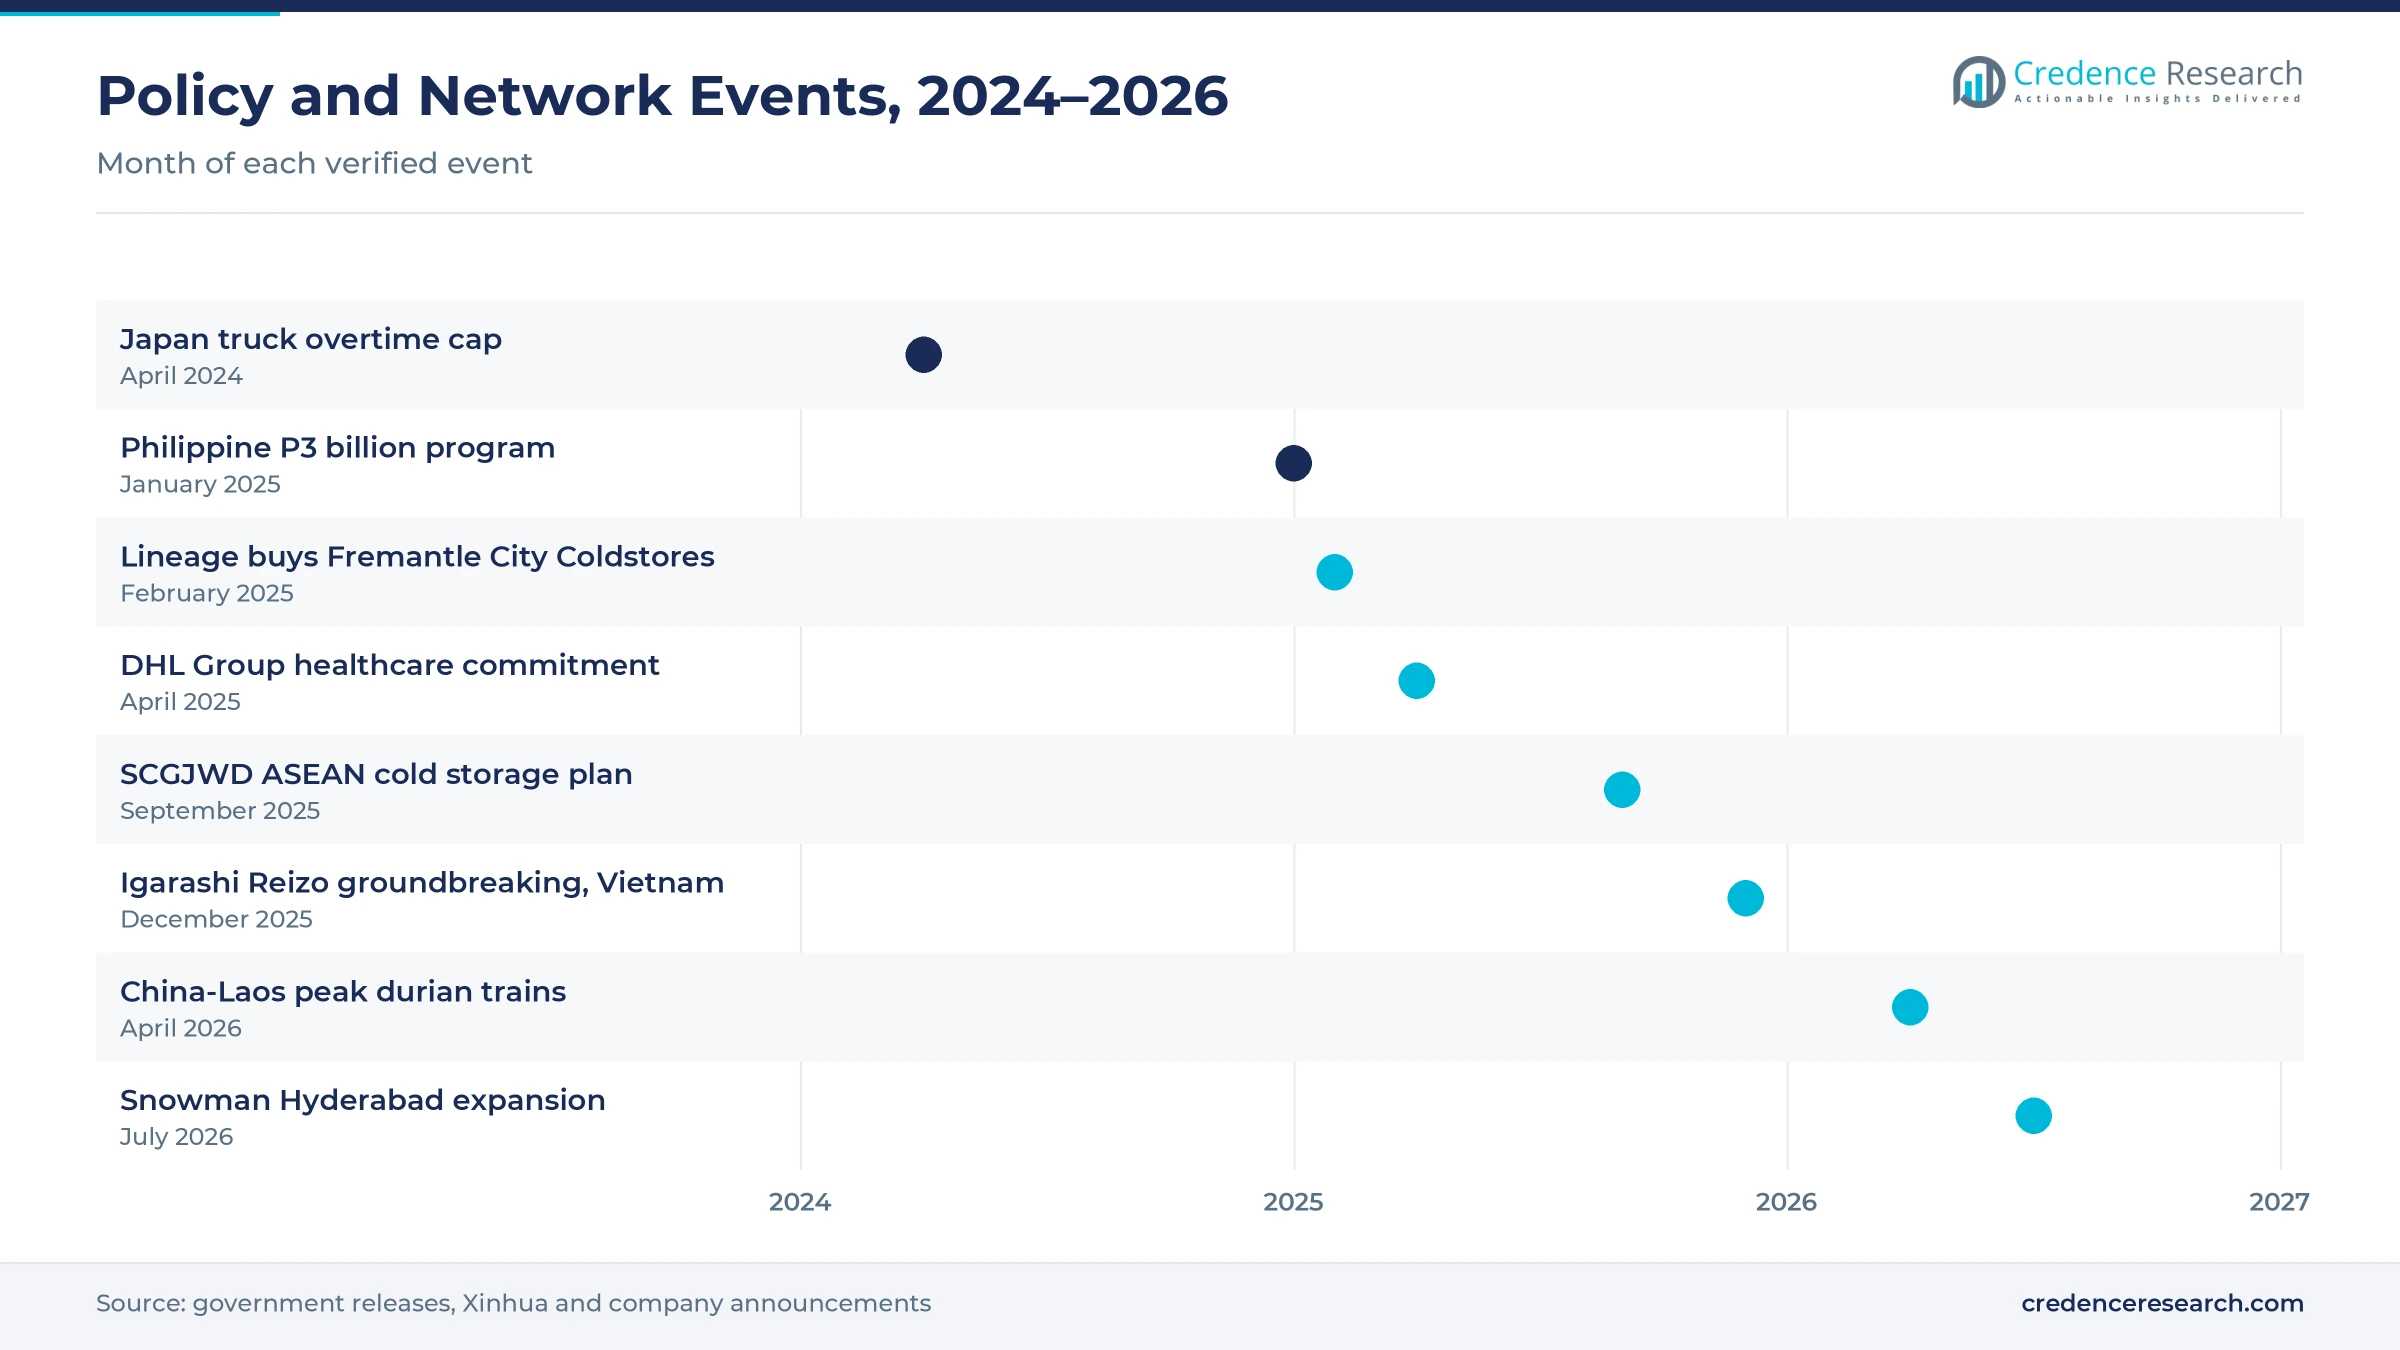
- DHL Group committed EUR 500 million to regional healthcare logistics in April 2025, which signals that drug lanes now attract specialized capital ahead of general food storage.
- The two largest operators in China held only about 15% of industry revenue in 2025, according to Rabobank, which leaves considerable room for acquisitions and regional consolidation.
Trucks, food and shared sites still carry most spending
Why does refrigerated transport outweigh storage in outsourcing budgets?
Based on service type, the market is categorized into refrigerated storage, refrigerated transport and value-added cold chain services. Refrigerated Transport led with 47.0% of 2025 value because long food routes consume more vehicle capacity than pallet space, and Rabobank counted 585,400 refrigerated trucks in China in 2025, 1.7 times the 2019 fleet. Value-Added Cold Chain Services grow fastest at 10.40% a year as drug shippers pay for more than storage. UPS Healthcare built its SGD 27.3 million Gul Circle site in Singapore, opened in May 2023, to bundle packaging, labeling, returns and customs brokerage with storage down to minus 80°C.
How far can rail cut into road dominance on refrigerated lanes?
Based on mode of transport, the market is categorized into road, sea, air and rail. Road led with 71.0% of 2025 value because island and intercity delivery still depends on trucks, and SCGJWD Logistics reports more than 200 trucks covering Java, Sumatra, Kalimantan, Sulawesi, Bali and Maluku in Indonesia alone. Rail grows fastest at 11.41% a year as cross-border fruit lanes open. Xinhua reported in April 2026 that Lancang-Mekong Express trains reach Kunming from Thailand in 26 hours, with China Railway Kunming Group deploying more than 4,000 refrigerated containers for durian.
Why do food volumes still outweigh pharmaceutical lanes?
Based on end-use industry, the market is categorized into food and beverages, pharmaceuticals and healthcare, specialty chemicals and consumer and electronic products. Food and Beverages led with 68.0% of 2025 value because protein tonnage is vast, and China's National Bureau of Statistics reported 100.72 million tons of meat and 76.57 million tons of aquatic products in 2025. Pharmaceuticals and Healthcare grow fastest at 10.49% a year as forwarders qualify sites for regulated cargo. NX China, part of Nippon Express, obtained Good Distribution Practice certification for its Shanghai and Lianyungang facilities on Feb. 21, 2025, covering air and ocean forwarding of drugs.
When do shippers choose a dedicated site over shared pallets?
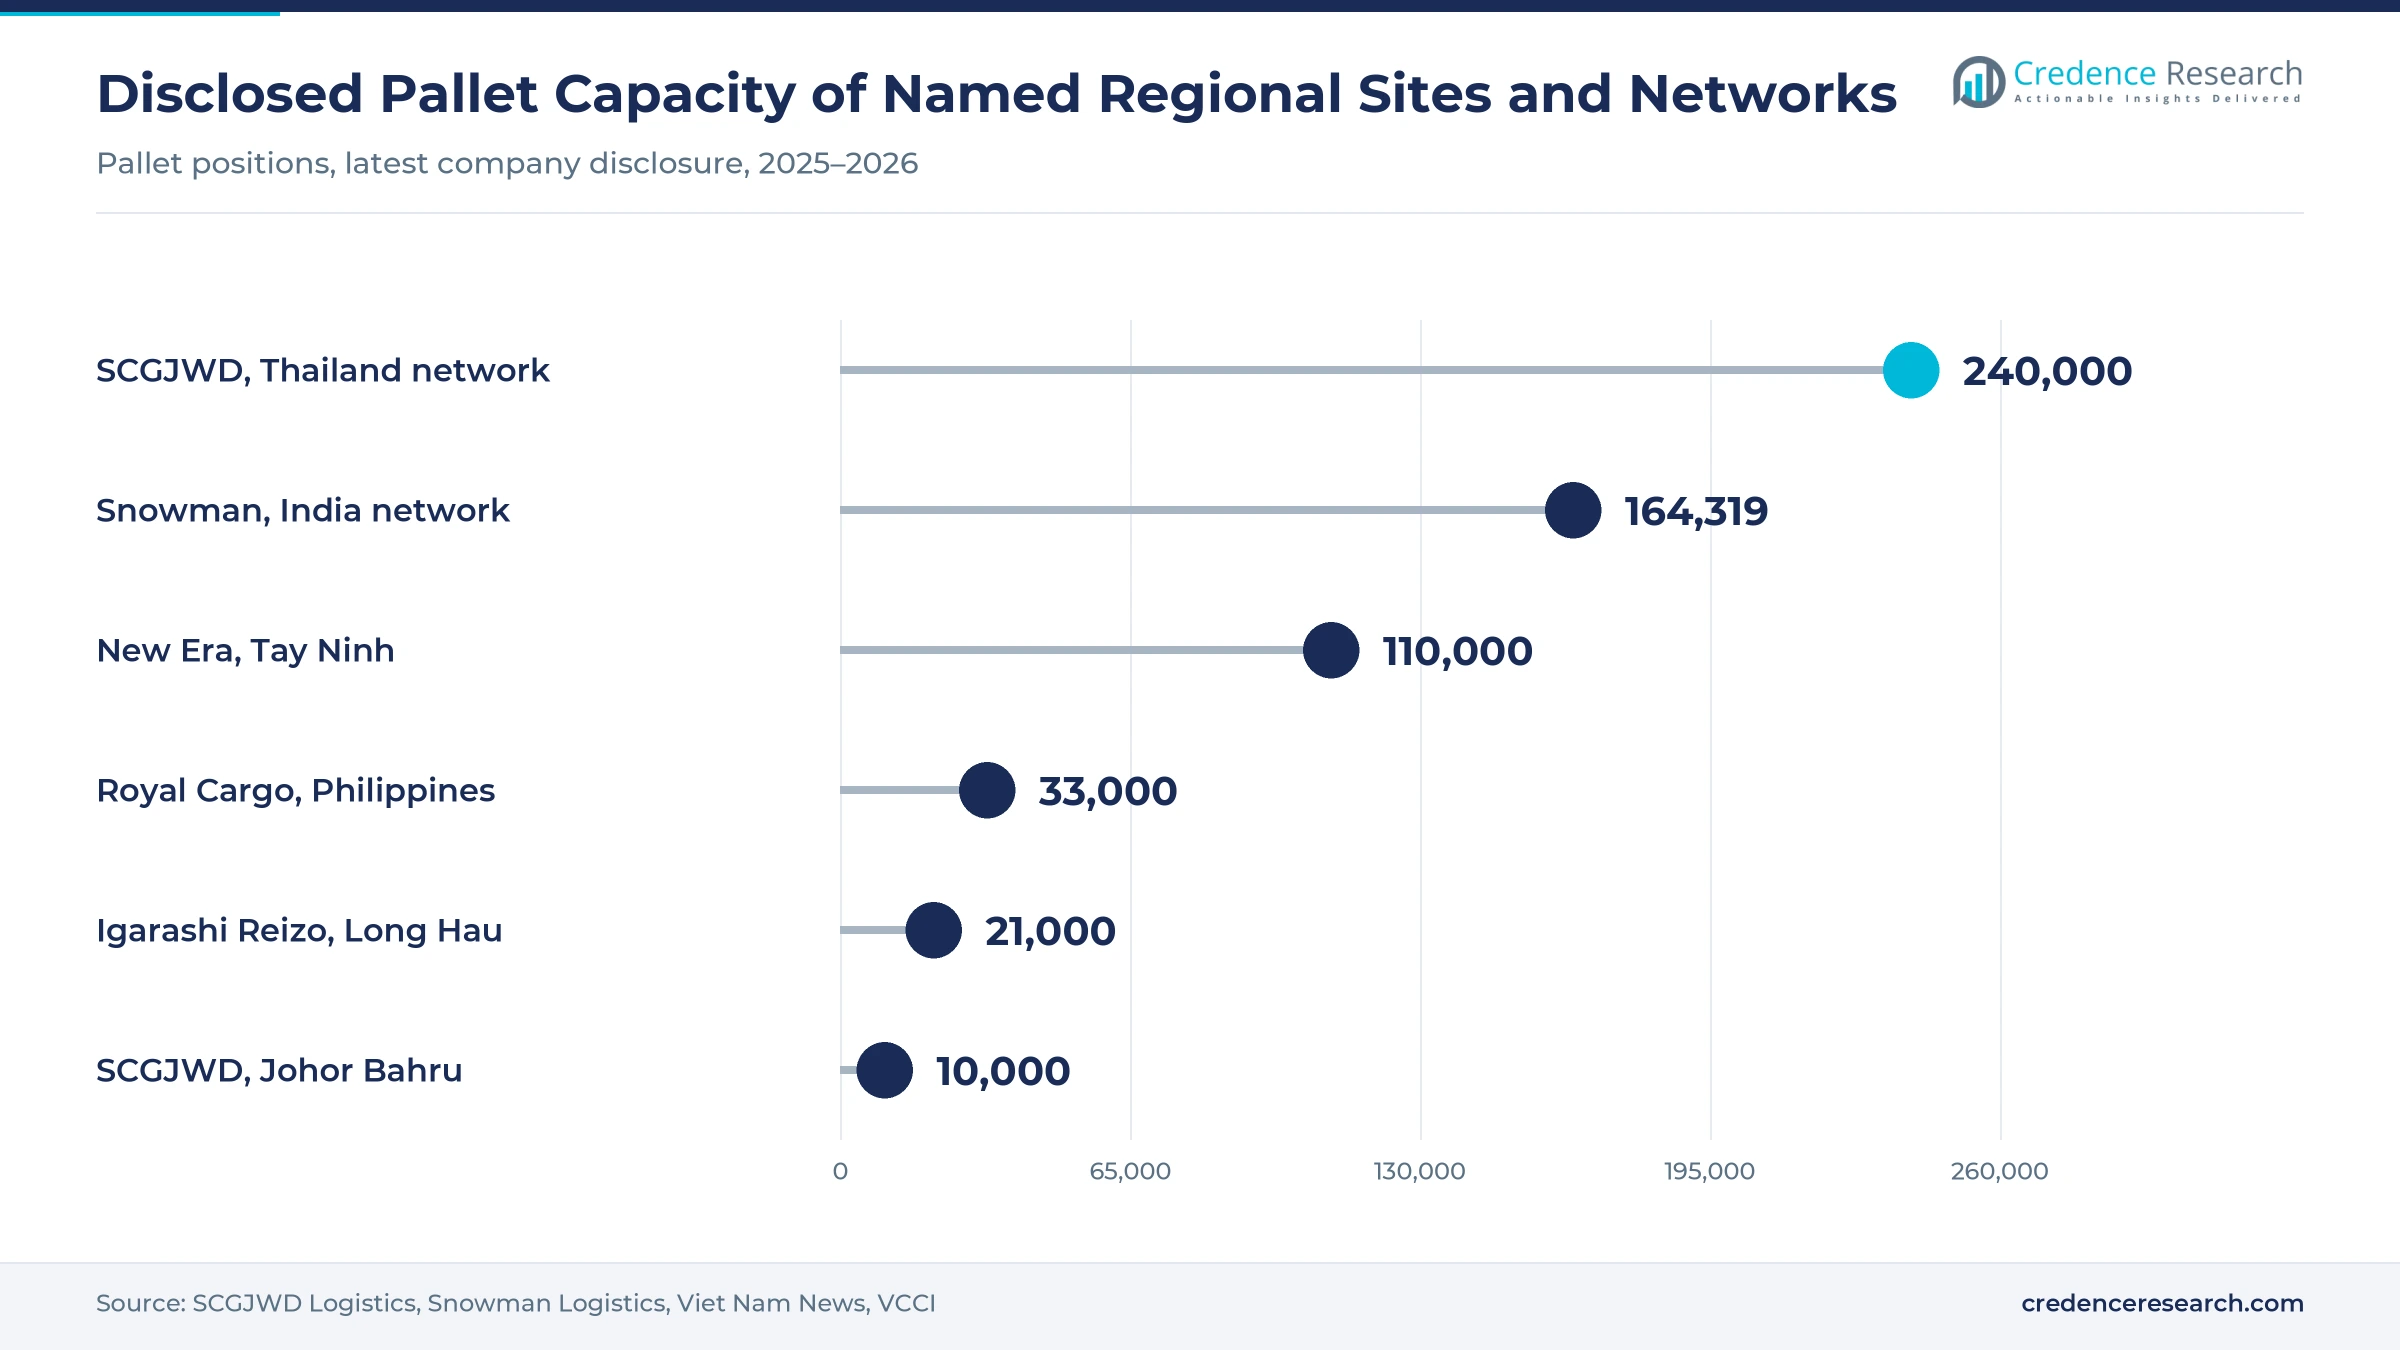
Based on business model, the market is categorized into dedicated contract logistics, shared-user logistics and transactional logistics. Shared-User Logistics led with 49.0% of 2025 value because mid-sized food and drug customers can share multi-temperature sites, and Snowman Logistics expects to reach 164,319 pallets across 21 Indian cities after its Hyderabad expansion. Dedicated Contract Logistics grows fastest at 10.03% a year as anchor customers underwrite single-purpose buildings. Lineage opened about 5,500 pallet positions in Hawke's Bay, New Zealand, in September 2025 mainly for pet food maker ZIWI.
| Segment Group | Leading Sub-segment | Share, 2025 | Fastest-growing Sub-segment | CAGR, 2026–2035 |
|---|---|---|---|---|
| By Service Type | Refrigerated Transport | 47.0% | Value-Added Cold Chain Services | 10.40% |
| By Mode of Transport | Road | 71.0% | Rail | 11.41% |
| By End-Use Industry | Food and Beverages | 68.0% | Pharmaceuticals and Healthcare | 10.49% |
| By Business Model | Shared-User Logistics | 49.0% | Dedicated Contract Logistics | 10.03% |
Request a Free Sample
Fill in your details and we'll send you a free sample report.
- Sample data tables & charts
- Research methodology
Drug lanes, food formalization and deals lift demand
How is pharmaceutical specialization reshaping provider networks?
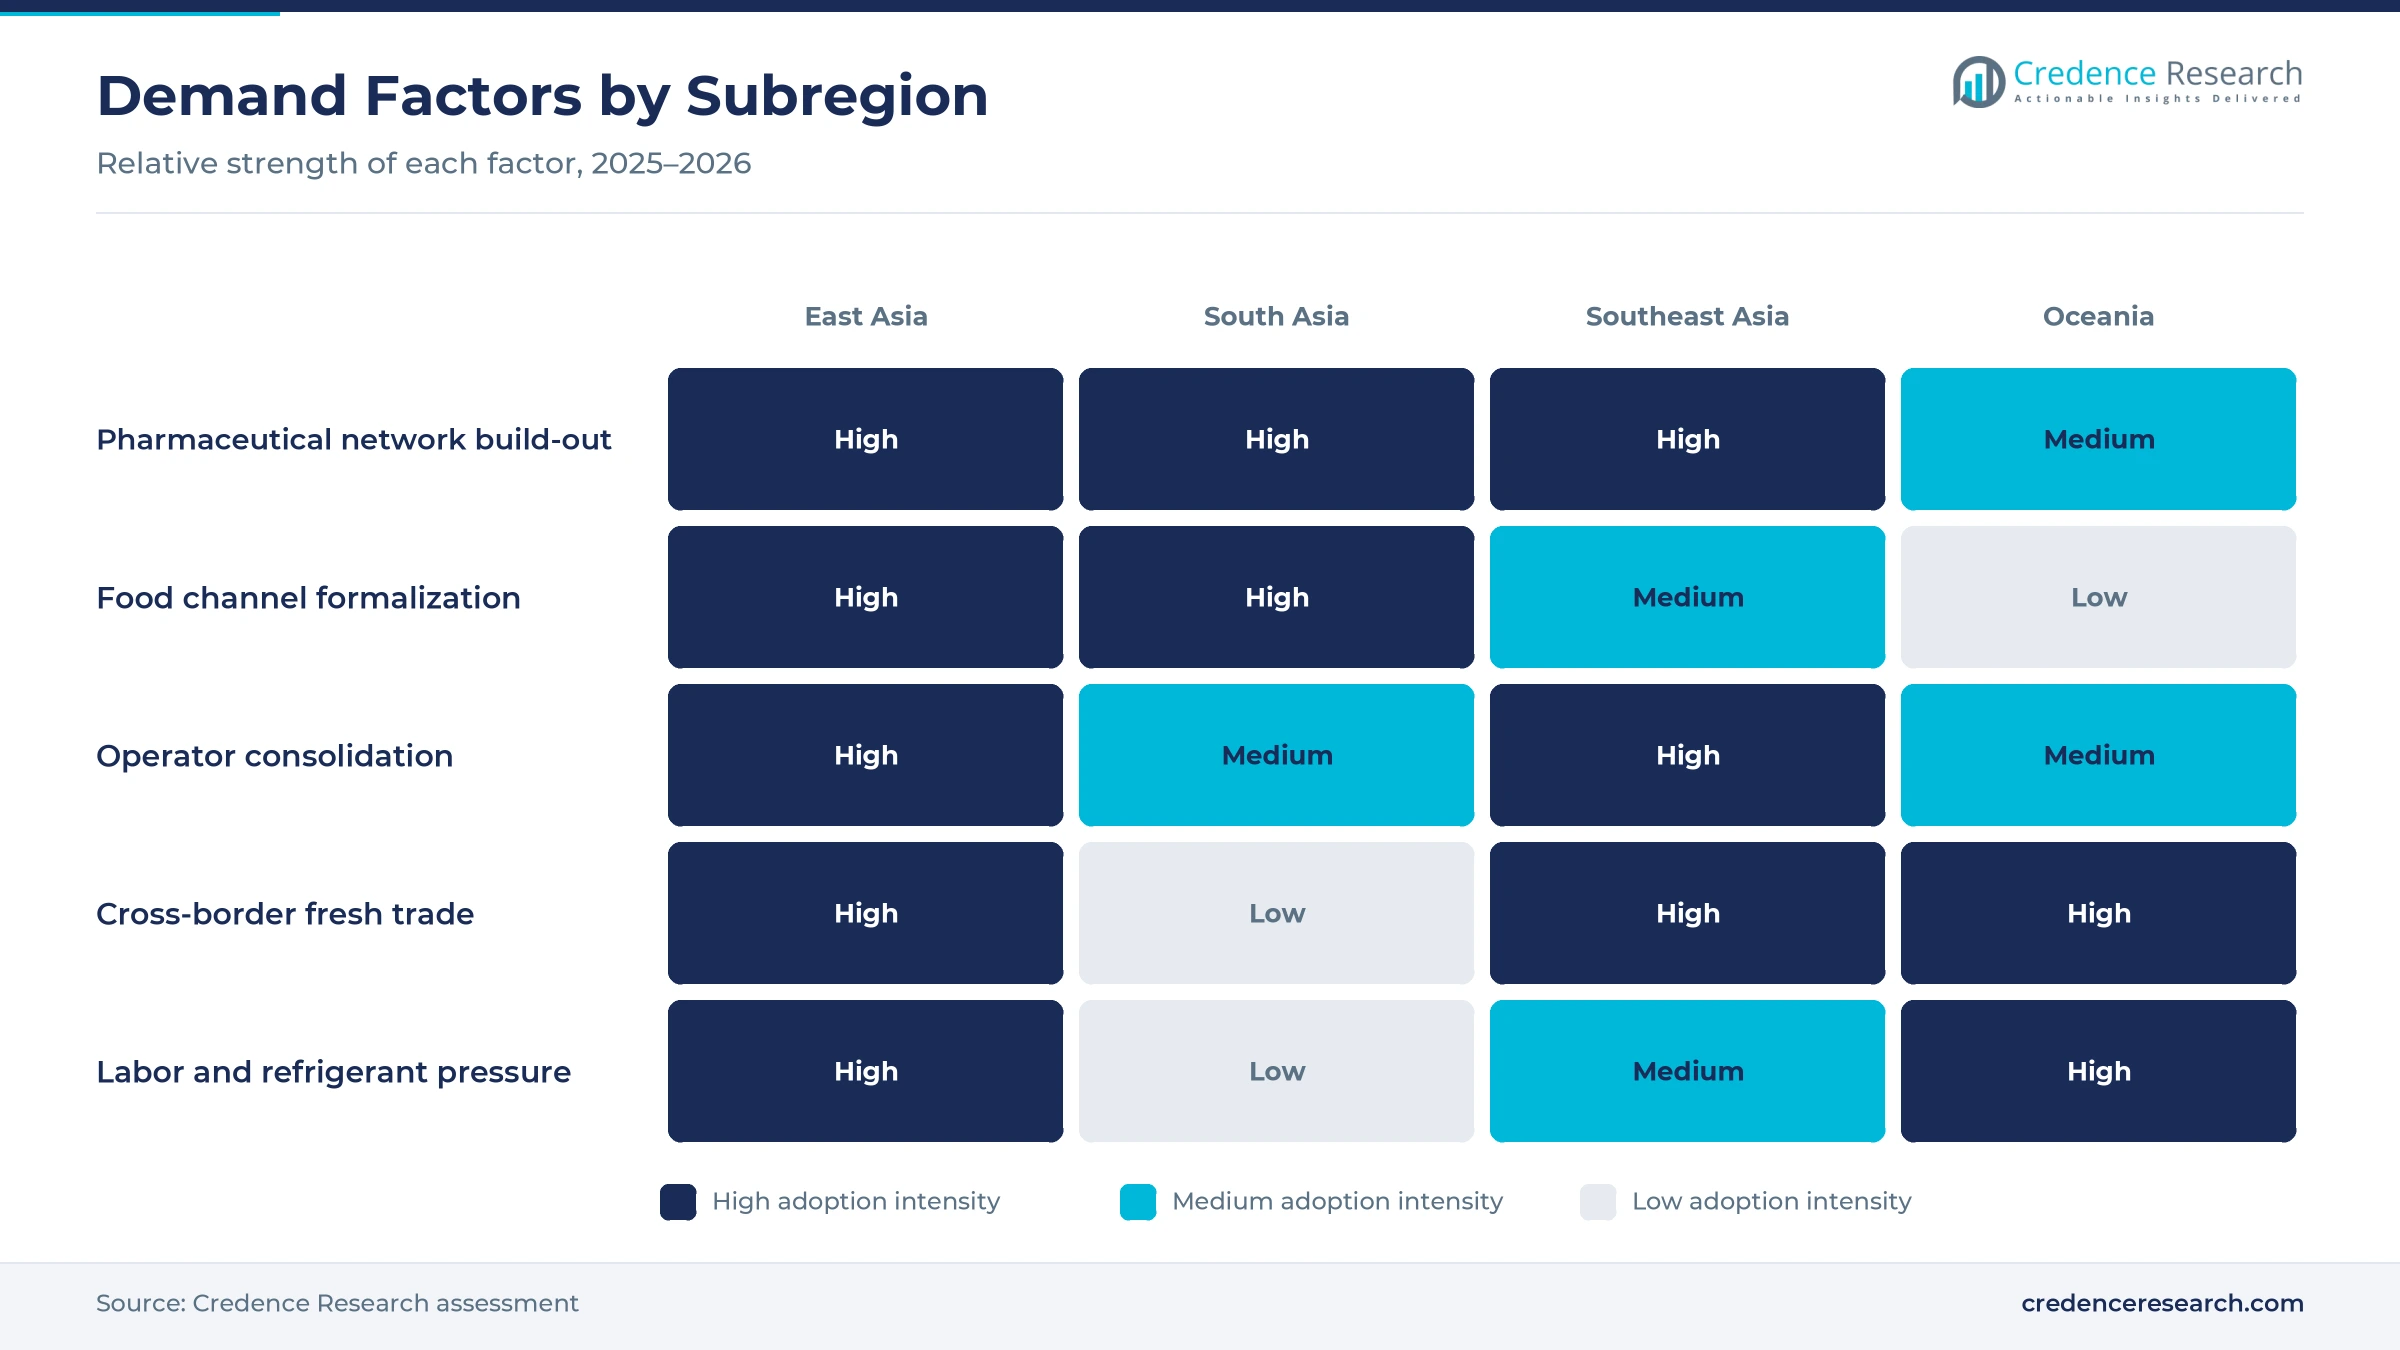
Drug makers increasingly award temperature-sensitive lanes only to operators that can document compliance across several countries. On April 7, 2025, DHL Group earmarked EUR 500 million for Asia-Pacific healthcare logistics by 2030, naming new facilities in Singapore, Malaysia and South Korea. One week later, the group detailed an 8,200-square-meter Pharma Hub at Jurong Pier in Singapore with cold rooms held at 2°C to 8°C. Kuehne+Nagel added a 248-square-meter airfreight cross-dock in Hyderabad in May 2026, as reported by STAT Times, placing the same temperature band near Indian drug distribution customers. As a result, Pharmaceuticals and Healthcare grow at 10.49% a year, well ahead of food lanes, and qualified capacity commands stronger contract terms.
What is pushing food distribution into formal contracts?
Food retail and restaurant buyers now expect documented temperature control, and that expectation moves volume from informal hauling toward contracted operators. China's National Bureau of Statistics reported that online sales of physical goods reached 26.1% of consumer retail sales in 2025. The China Federation of Logistics and Purchasing put cold chain volume at 381.4 million tons that year, up 4.5%. Public money is supporting the same shift, because the Philippine Department of Agriculture announced a P3 billion program for about 99 facilities in January 2025. India's food processing ministry reported 291 operational cold chain projects with 2.552 million metric tons of annual preservation capacity as of June 2025. Together, these programs create volume that third parties can consolidate.
Why is network consolidation widening operator reach?
Multinational shippers prefer fewer providers, and fragmented ownership gives acquirers an obvious route to regional coverage. Rabobank, in analysis published by FreshPlaza in October 2026, found the two largest Chinese operators held about 15% of revenue, against about 60% of storage capacity for the top two in the United States. Lineage bought Fremantle City Coldstores in Western Australia in February 2025, adding more than 8,000 pallet positions and reaching 15 Australian facilities. SCGJWD Logistics said in September 2025 that it would spend more than 800 million baht on two Malaysian sites while working with Royal Cargo in the Philippines. Nichirei Logistics Group took a minority stake in Malaysia's Litt Tatt in April 2022, gaining six warehouses and about 190 vehicles as partners.
How do fresh trade corridors add refrigerated volume?
Fresh imports and exports generate high-value refrigerated cargo that few shippers want to handle alone. Shanghai customs expected more than 250,000 tons of Chilean cherries before the 2026 Lunar New Year, with about 31 dedicated vessels due at Yangshan Port, Xinhua reported in December 2025. The Global Cold Chain Alliance noted that Australian beef exports topped 127,000 tons in April 2025, up 21% from a year earlier. The same August 2025 review said Singapore imports 90% of its food and that inbound frozen food stock in Japan rose 63% between 2011 and 2023. Thailand also ships about 1,500 refrigerated durian containers to China daily, according to Xinhua. Consequently, port-side cold stores and customs handling have become purchased services rather than internal functions.
Reefer rail and Southeast Asian sites open new lanes
Is refrigerated rail emerging as a real alternative for fruit?
Refrigerated rail is shifting from a pilot service to a scheduled option on Southeast Asian fruit lanes into China. Xinhua reported on April 15, 2026, that peak durian service on the China-Laos Railway rose from two to six freight trains a day. Unloading and container transfer at Kunming are targeted to finish within 90 minutes of arrival, while most fruit reaches more than 30 Chinese cities within 48 hours. Total tropical fruit on the line is estimated to exceed 200,000 tons in 2026, the agency added. The Bangkok Post, cited by FreshPlaza in May 2026, said shipments to Chengdu now take about five days instead of a week. In turn, rail operators are selling time certainty that competes directly with long-haul refrigerated trucks.
How are e-commerce groups shifting cold logistics into integrated offers?
Large parcel and e-commerce groups are moving into temperature-controlled services, which raises the bar for standalone carriers. JD Logistics reported more than 60 temperature-controlled warehouses with over 400,000 square meters at the end of 2025. The same March 2026 announcement listed more than 50 sites for pharmaceuticals and medical devices, along with 12 all-cargo aircraft supporting fresh products. It also described a dedicated cargo route offering next-morning delivery of Qinghai beef and lamb to key cities. SF Holding named life sciences and retail food among seven supply chain verticals in its annual results of March 2026. Consequently, buyers can increasingly purchase cold handling alongside ambient parcels and warehousing under one account.
Where is the opening in Southeast Asian production areas?
Southeast Asia offers an opening for operators willing to build near farms rather than near cities. Vinafruit general secretary Dang Phuc Nguyen said in February 2026 that major Vietnamese production areas, especially the Central Highlands, still lack on-site cold storage, according to Viet Nam News. Investors have started to respond, because New Era Cold Storage runs an automated site for more than 110,000 pallets in Tay Ninh. Igarashi Reizo broke ground on Dec. 9, 2025, on a VND 621 billion project for about 21,000 pallets at Long Hau. SCGJWD Logistics plans a further 10,000 pallets in Johor Bahru by the fourth quarter of 2026. Operators that link these sites to export corridors can win produce volume that currently spoils or moves ambient.
What opening does Japan's aging cold store base create?
Japan offers a replacement opportunity because old buildings and full port locations limit what shippers can buy today. About 33% of Japanese cold storage floor space sits in facilities at least 40 years old, the Global Cold Chain Alliance reported in August 2025. Usage was near or above 100% in Tokyo, Yokohama and Kobe at the end of 2024, according to the same review. CBRE said in September 2026 that new leased completions should approach 150,000 tsubo in each of 2027 and 2028. However, the property adviser also found that Greater Tokyo and Greater Osaka hold 88% of those developments. That concentration leaves regional cities open for outsourcing specialists that can pair modern rooms with transport.
Driver caps, refrigerant rules and thin carriers bite
How much do Japan's driver limits constrain refrigerated road service?
Japan capped truck driver overtime at 960 hours a year from April 2024, and The Japan Times reported a government-cited study warning that up to 34% of domestic cargo could lack capacity by 2030. Refrigerated carriers have little slack because chilled and frozen loads cannot simply wait for a later truck. As a result, shippers face higher rates and fewer delivery windows, so operators are consolidating loads and moving long legs onto shared routes.
What will tighter refrigerant rules cost cold store operators?
South Korea will limit refrigerants to a global warming potential of 1,500 from 2028 and 750 from 2030, the Global Cold Chain Alliance reported. Vietnam's December 2025 cooling plan also targets an 80% cut in HFC consumption by 2045, according to the International Institute of Refrigeration. Older warehouses and trailers therefore need costly conversions, and smaller operators feel that burden most. Consequently, larger providers can use compliant fleets as a selling point, while smaller firms seek shared financing or leave the market.
Why are thin margins pushing smaller carriers out?
Australian operator Don Watson Transport closed in June 2025 after 77 years, and Scott's Refrigerated Logistics entered liquidation in early 2023, the Global Cold Chain Alliance noted. The alliance's review links those failures to rising costs, driver shortages and aging fleets, pressures that also weigh on Australian reefer trucking capacity. Customers now weigh counterparty risk alongside price when they tender, so many split lanes across several providers or require written contingency plans.
Why does uneven capacity undermine returns across subregions?
New Era Cold Storage chairman Nguyen Thanh Tung said in February 2026 that Vietnamese areas with developed infrastructure face localized excess capacity, while farm districts lack storage. South Korea shows a similar swing, because new supply in 2024 fell to 44% of the 2023 level while some cold sites in Bucheon Naedong and Bundang Yatap converted to dry storage. Investors therefore face weak utilization in some corridors and shortages in others, so operators increasingly secure anchor tenants before committing to construction.
East Asia holds the volume while South Asia grows fastest
| Subregion | Value, 2025 (USD billion) | Share, 2025 | CAGR, 2026–2035 |
|---|---|---|---|
| East Asia | 73.80 | 70.9% | 8.80% |
| South Asia | 13.22 | 12.7% | 11.00% |
| Southeast Asia | 11.24 | 10.8% | 10.30% |
| Oceania | 5.83 | 5.6% | 8.20% |
East Asia holds the scale through China, Japan and South Korea
East Asia held 70.9% of 2025 value and grows at 8.80% a year, slightly below the regional pace. China anchors the subregion, because Rabobank put national cold chain revenue at CNY 556.7 billion in 2025 after growth averaging 8.6% since 2019. China's storage capacity rose 5.53% that year, according to the logistics federation. Japan adds mature frozen food demand and South Korea will receive a new DHL healthcare facility. Consolidation among fragmented Chinese operators is the main source of share change here.
South Asia grows fastest as india adds subsidized capacity
South Asia held 12.7% of 2025 value and grows fastest at 11.00% a year. India's food processing ministry offers subsidies of 35% in general areas and 50% in difficult areas under its Integrated Cold Chain scheme, capped at INR 100 million per project. Listed operators are adding pallet capacity in several Indian cities alongside this federal support. Snowman Logistics announced a 10,000-pallet Hyderabad expansion on July 15, 2026, serving pharmaceutical, restaurant and seafood customers at temperatures from minus 25°C to plus 20°C. Its Pune built-to-suit project, disclosed on Oct. 7, 2025, adds 5,900 pallets.
Southeast Asia builds regional hubs around Thailand and Singapore
Southeast Asia held 10.8% of 2025 value and grows at 10.30% a year. SCGJWD Logistics reports ten Thai warehouses able to hold over 240,000 pallets, and it is extending that network into Malaysia. Singapore serves as the healthcare gateway, since DHL Group expects more than 36,000 square meters of life sciences space there after its Jurong Pier hub. The Philippines is also building publicly funded capacity, which should feed Philippine refrigerated warehouses and regional distributors with more formal volume.
Oceania grows from a smaller, export-led base
Oceania held 5.6% of 2025 value and grows at 8.20% a year, the slowest pace in the region. Australian refrigerated warehouse capacity rose from about 8.4 million cubic meters in 2020 to 10.2 million in 2023, the Global Cold Chain Alliance reported. DHL Group also listed EUR 28 million of upgrades in New South Wales and a EUR 26 million automated site in Auckland in April 2025. A smaller population and a mature provider base limit expansion, although protein and dairy exports keep demand steady.
Dated network moves across the region, 2025 to 2026
| Development | Status and market relevance |
|---|---|
| In February 2025, Lineage acquired Fremantle City Coldstores in Western Australia. | Adds more than 8,000 pallet positions and takes Lineage to 15 Australian facilities |
| In April 2025, DHL Group committed EUR 500 million to Asia-Pacific healthcare logistics by 2030. | Includes planned facilities in Singapore, Malaysia and South Korea |
| In September 2025, SCGJWD Logistics set out its cold storage plan for Malaysia, Indonesia, the Philippines and Singapore. | Malaysian projects total about 20,000 pallets |
| In May 2026, Kuehne+Nagel opened a temperature-controlled airfreight cross-dock in Hyderabad, as reported by STAT Times. | Operates to the company's HealthChain quality standard |
| In July 2026, Snowman Logistics announced a 10,000-pallet expansion in Hyderabad. | Raises that city to 16,800 pallets, with operations expected the following year |
Deep-frozen rooms and reefer rail change what is sold
- Ultra-low temperature rooms let operators accept cell, gene and clinical cargo, and UPS Healthcare's Singapore site covers temperatures from minus 80°C to 25°C.
- Automated high-bay stores reduce labor at large sites, as the automated New Era Cold Storage facility in Tay Ninh shows with its pallet capacity in southern Vietnam.
- Refrigerated rail containers let carriers replace long truck legs, and China Railway Kunming Group now assigns a specialized fleet to seasonal durian movements from Thailand.
- Multi-temperature warehouse zones allow one building to serve several buyers, as Snowman Logistics does for dairy, seafood and drug clients.
Need a Custom Version of This Report?
Tailor the scope, geography, or segments to your exact requirements.
- Custom geography or segment scope
- Direct access to our analyst team
Integrators and warehouse specialists meet head on
Competition splits into global healthcare integrators, Chinese network groups, warehouse specialists and national operators. DHL Group, Kuehne+Nagel, UPS Healthcare and Nippon Express compete on qualified sites and cross-border forwarding for regulated products, where audit history often matters more than price. JD Logistics and SF Holding compete through domestic delivery density in China and combined parcel, warehouse and air capacity. Lineage and Nichirei Logistics Group build from refrigerated warehousing, using acquisitions and minority stakes to enter new countries. Snowman Logistics shows how a national operator defends its position with built-to-suit projects for anchor customers. Regional challengers such as SCGJWD Logistics are assembling multi-country networks across ASEAN by partnering with local warehouse owners. Contract terms increasingly reflect compliance evidence, pallet availability near ports and the ability to serve several borders from one account. Scale alone is not decisive because customers still award lanes country by country, which leaves room for specialists with strong local service records.
Companies profiled and their roles in this market
| Company | Type | Role in the market |
|---|---|---|
| DHL Group | Global integrator | Investing EUR 500 million in regional healthcare logistics, with a Pharma Hub at Jurong Pier in Singapore |
| S.F. Holding | Integrated logistics group | Names life sciences and retail food among seven supply chain verticals |
| JD Logistics | Network logistics group | Runs more than 60 temperature-controlled warehouses in its network |
| Nichirei Logistics Group | Refrigerated warehouse operator | Holds a minority investment in Litt Tatt of Malaysia and joint ventures in Thailand and China |
| Lineage | Refrigerated warehouse operator | Operates 15 facilities in Australia and opened a new site in Hawke's Bay, New Zealand |
| Kuehne+Nagel | Freight forwarder | Opened a healthcare cross-dock in Hyderabad, India |
| UPS Healthcare | Healthcare logistics provider | Operates over 19,000 square meters of healthcare warehousing in Singapore |
| Nippon Express | Freight forwarder | NX China gained Good Distribution Practice certification for Shanghai and Lianyungang |
| Snowman Logistics | National operator, India | Runs multi-temperature pallets across 21 Indian cities with built-to-suit projects |
Compliance and reach will decide who wins contracts
Credence Research's view of cold chain outsourcing is that compliance evidence and multi-country reach will separate winners from the many operators that only rent pallet space. Food will remain the volume base through 2035, yet healthcare lanes should earn the better returns because qualification is slow and switching is costly. China's fragmented ownership is the largest consolidation prize, although local relationships will slow any rapid roll-up. South Asia should reward early movers with subsidized or built-to-suit capacity. Buyers should test providers on audit records, contingency capacity and refrigerant plans before signing long contracts, since those factors will increasingly determine service continuity.
Public indicators behind the subregional spending estimate
The report uses 2025 as the base year and forecasts values to 2035 with 2026 as the first forecast year. Market values come from the Credence Research model and were checked against public indicators, including Chinese cold chain revenue, national capacity and government program data. Segment and subregional splits are Credence Research estimates informed by company filings, official statistics, trade association reviews and press releases named in the text. The cold chain outsourcing analysis relied on published sources, and no interviews or surveys were conducted for this edition.
South Asia, rail and drug lanes shape the path to 2035
Spending should reach USD 252.30 billion by 2035, with growth tilting toward regulated cargo, South Asia and cross-border rail. East Asia will still hold the largest share, although consolidation rather than new volume is likely to change who earns it. Southeast Asia should gain as operators such as SCGJWD Logistics complete their Malaysian sites and producers seek storage near farms. Refrigerant limits arriving from 2028 and tight driver supply will raise costs and favor well-capitalized providers. Operators with compliant, flexible capacity near ports and plants should therefore capture a rising portion of contracted work.
Frequently Asked Questions
How big is the Asia-Pacific cold chain outsourcing market?
Which subregion leads the market?
Which subregion is growing fastest?
Which service type holds the largest share?
Which end-use industry grows fastest?
Why is rail gaining attention on refrigerated lanes?
What are the main challenges for providers?
Who are the leading companies?
Table of Content
Chapter 1 Market Segmentation
- 1.1 Segmentation Framework
- 1.1.1 Product and Service Classification
- 1.1.2 Application and End-Use Classification
- 1.1.3 Technology and Solution Classification
- 1.1.4 Customer and Distribution Channel Classification
- 1.1.5 Geographic Segmentation
- 1.1.6 Market Segment Definitions and Boundaries
- 1.2 By Service Type
- 1.2.1 Refrigerated Transport
- 1.2.2 Refrigerated Storage
- 1.2.3 Value-Added Cold Chain Services
- 1.3 By Mode of Transport
- 1.3.1 Road
- 1.3.2 Sea
- 1.3.3 Air
- 1.3.4 Rail
- 1.4 By End-Use Industry
- 1.4.1 Food and Beverages
- 1.4.2 Pharmaceuticals and Healthcare
- 1.4.3 Consumer and Electronic Products
- 1.4.4 Specialty Chemicals
- 1.5 By Business Model
- 1.5.1 Shared-User Logistics
- 1.5.2 Dedicated Contract Logistics
- 1.5.3 Transactional Logistics
- 1.6 By Subregion
- 1.6.1 East Asia
- 1.6.2 South Asia
- 1.6.3 Southeast Asia
- 1.6.4 Oceania
Chapter 2 Introduction
- 2.1 Report Objectives and Scope
- 2.2 Product Definition and Industry Terminology
- 2.3 Market Inclusions and Exclusions
- 2.4 Research Process
- 2.4.1 Primary Research and Expert Interviews
- 2.4.2 Secondary Research and Source Review
- 2.4.3 Top-Down and Bottom-Up Estimation
- 2.4.4 Data Triangulation and Verification
- 2.5 Market Size Measurement Basis
- 2.5.1 2025: USD 104.09 billion → 2035: USD 252.30 billion
- 2.6 Historical and Forecast Reference Periods
- 2.6.1 Historical Period: 2018-2025
- 2.6.2 Base Year: 2025
- 2.6.3 Forecast Period: 2025-2035
- 2.7 Research Assumptions and Limitations
Chapter 3 Executive Summary
- 3.1 Market Snapshot and Key Findings
- 3.2 Base-Year Market Size, 2025
- 3.3 Forecast Market Size, 2035
- 3.4 Revenue and Volume Growth Outlook
- 3.5 Key Demand and Supply Indicators
- 3.6 Leading Market Segments
- 3.7 Fastest-Growing Market Opportunities
- 3.8 Regional Performance Highlights
- 3.9 Technology and Industry Transformation
- 3.10 Competitive Landscape Summary
- 3.11 Analyst View and Strategic Implications
Chapter 4 Asia-Pacific Cold Chain Outsourcing Market Trends and Developments
- 4.1 Historical Industry Development, 2018-2025
- 4.2 Recent Market Trends and Developments
- 4.3 Demand and Customer Behavior Trends
- 4.4 Technology and Product Innovation
- 4.5 Artificial Intelligence, Automation and Digitalization
- 4.6 Local Manufacturing and Supply Chain Realignment
- 4.7 Industry Partnerships, Mergers and Acquisitions
- 4.8 Sustainability and Circular Economy Developments
- 4.9 Government and Private Sector Investment Trends
- 4.10 Emerging Business Models and Commercialization
- 4.11 Industry Developments and Announcements
Chapter 5 Asia-Pacific Cold Chain Outsourcing Market Supply and Demand Analysis
- 5.1 Demand Trend and Consumption Analysis, 2018-2025
- 5.2 Demand Forecast, 2025-2035
- 5.3 Supply Chain Structure and Procurement Trends
- 5.4 Supply-Demand Gap and Bottlenecks
- 5.5 Import Dependence and Sourcing Structure
- 5.6 Regional Supply and Demand Concentration
Chapter 6 Asia-Pacific Cold Chain Outsourcing Market Pricing Analysis
- 6.1 Pricing Structure and Measurement
- 6.2 Historical Pricing Trends, 2018-2025
- 6.3 Pricing Outlook, 2025-2035
- 6.4 Pricing by Product and Market Segment
- 6.5 Geographic Pricing Differences
- 6.6 Key Input, Energy, Labor and Logistics Costs
- 6.7 Contract Pricing and Purchasing Models
- 6.8 Pricing Sensitivity and Competitive Positioning
- 6.9 Price, Margin and Profitability Implications
Chapter 7 Asia-Pacific Cold Chain Outsourcing Market Dynamics
- 7.1 Market Growth Drivers
- 7.1.1 Demand-Side Drivers
- 7.1.2 Technology and Innovation Drivers
- 7.1.3 Infrastructure and Investment Drivers
- 7.1.4 Regulatory and Policy Drivers
- 7.2 Market Restraints
- 7.2.1 Cost and Affordability Constraints
- 7.2.2 Technology and Adoption Barriers
- 7.2.3 Supply Chain and Operational Constraints
- 7.3 Market Challenges
- 7.3.1 Competitive Pressure and Margin Erosion
- 7.3.2 Skills, Infrastructure and Implementation Gaps
- 7.4 Emerging Market Opportunities
- 7.5 Market Dynamics Impact and Time-Horizon Assessment
Chapter 8 Asia-Pacific Cold Chain Outsourcing Value Chain Analysis
- 8.1 Industry Value Chain Overview
- 8.2 Upstream Suppliers and Critical Inputs
- 8.3 Technology and Component Providers
- 8.4 Manufacturing or Service Delivery
- 8.5 Distribution, Channel Partners and Integrators
- 8.6 Downstream Applications and End Users
- 8.7 Value Addition and Profit Pools
- 8.8 Vertical Integration and Outsourcing
- 8.9 Supplier Concentration and Risk
- 8.10 Supply Chain Localization and Resilience
Chapter 9 Asia-Pacific Cold Chain Outsourcing Market Regulations and Policies
- 9.1 Relevant Laws, Standards and Compliance Frameworks
- 9.2 Product, Service, Safety and Quality Requirements
- 9.3 Government Policies, Incentives and Subsidies
- 9.4 Imports, Exports and Trade Barriers
- 9.5 Public Procurement and Local Content Requirements
- 9.6 Data Protection, AI and Cybersecurity Compliance
- 9.7 Upcoming Policy Changes and Market Implications
Chapter 10 Asia-Pacific Cold Chain Outsourcing Market Hotspots and Opportunities
- 10.1 Market Opportunity Mapping and Growth Hotspots
- 10.2 High-Growth Applications and Customer Groups
- 10.3 Underserved Markets and White-Space Opportunities
- 10.4 Emerging Technology and Product Opportunities
- 10.5 New Capacity and Investment Hotspots
- 10.6 Market Entry and Expansion Opportunities
- 10.7 Distribution and Partnership Opportunities
- 10.8 Near-Term and Long-Term Commercial Potential
- 10.9 Opportunity Attractiveness and Execution Risks
Chapter 11 Asia-Pacific Cold Chain Outsourcing Market Outlook, 2025-2035
- 11.1 Market Size and Analysis
- 11.1.1 Revenue (Market Measurement: 2025: USD 104.09 billion → 2035: USD 252.30 billion)
- 11.1.2 Historical Market Size, 2018-2025
- 11.1.3 Base-Year Market Size, 2025
- 11.2 Market Forecast, 2025-2035
- 11.2.1 Revenue Forecast to 2035
- 11.2.2 CAGR and Year-on-Year Growth
- 11.2.3 Incremental Revenue Opportunity
- 11.3 Forecast Assumptions and Scenario Analysis
- 11.3.1 Base-Case Forecast
- 11.3.2 Optimistic and Conservative Scenarios
- 11.3.3 Technology, Pricing and Policy Sensitivities
- 11.4 Market Attractiveness and Growth Outlook
Chapter 12 Asia-Pacific Cold Chain Outsourcing Market Segmentation and Outlook
- 12.1 Segmentation Summary and Market Shares, 2025
- 12.2 Largest and Fastest-Growing Segments
- 12.3 By Service Type - Market Size and Forecast, 2025-2035
- 12.3.1 Segment Definition and Scope
- 12.3.2 Historical Market Size, 2018-2025
- 12.3.3 Revenue Forecast, 2025-2035
- 12.3.4 Base-Year Market Share, 2025
- 12.3.5 Segment CAGR and Growth Drivers
- 12.3.6 Subsegment Market Size and Forecast
- 12.3.6.1 Refrigerated Transport
- 12.3.6.2 Refrigerated Storage
- 12.3.6.3 Value-Added Cold Chain Services
- 12.3.7 Subsegment Pricing and Adoption Trends
- 12.3.8 Leading Suppliers and Competition
- 12.3.9 Regional Demand and Opportunities
- 12.4 By Mode of Transport - Market Size and Forecast, 2025-2035
- 12.4.1 Segment Definition and Scope
- 12.4.2 Historical Market Size, 2018-2025
- 12.4.3 Revenue Forecast, 2025-2035
- 12.4.4 Base-Year Market Share, 2025
- 12.4.5 Segment CAGR and Growth Drivers
- 12.4.6 Subsegment Market Size and Forecast
- 12.4.6.1 Road
- 12.4.6.2 Sea
- 12.4.6.3 Air
- 12.4.6.4 Rail
- 12.4.7 Subsegment Pricing and Adoption Trends
- 12.4.8 Leading Suppliers and Competition
- 12.4.9 Regional Demand and Opportunities
- 12.5 By End-Use Industry - Market Size and Forecast, 2025-2035
- 12.5.1 Segment Definition and Scope
- 12.5.2 Historical Market Size, 2018-2025
- 12.5.3 Revenue Forecast, 2025-2035
- 12.5.4 Base-Year Market Share, 2025
- 12.5.5 Segment CAGR and Growth Drivers
- 12.5.6 Subsegment Market Size and Forecast
- 12.5.6.1 Food and Beverages
- 12.5.6.2 Pharmaceuticals and Healthcare
- 12.5.6.3 Consumer and Electronic Products
- 12.5.6.4 Specialty Chemicals
- 12.5.7 Subsegment Pricing and Adoption Trends
- 12.5.8 Leading Suppliers and Competition
- 12.5.9 Regional Demand and Opportunities
- 12.6 By Business Model - Market Size and Forecast, 2025-2035
- 12.6.1 Segment Definition and Scope
- 12.6.2 Historical Market Size, 2018-2025
- 12.6.3 Revenue Forecast, 2025-2035
- 12.6.4 Base-Year Market Share, 2025
- 12.6.5 Segment CAGR and Growth Drivers
- 12.6.6 Subsegment Market Size and Forecast
- 12.6.6.1 Shared-User Logistics
- 12.6.6.2 Dedicated Contract Logistics
- 12.6.6.3 Transactional Logistics
- 12.6.7 Subsegment Pricing and Adoption Trends
- 12.6.8 Leading Suppliers and Competition
- 12.6.9 Regional Demand and Opportunities
- 12.7 By Subregion - Market Size and Forecast, 2025-2035
- 12.7.1 Segment Definition and Scope
- 12.7.2 Historical Market Size, 2018-2025
- 12.7.3 Revenue Forecast, 2025-2035
- 12.7.4 Base-Year Market Share, 2025
- 12.7.5 Segment CAGR and Growth Drivers
- 12.7.6 Subsegment Market Size and Forecast
- 12.7.6.1 East Asia
- 12.7.6.2 South Asia
- 12.7.6.3 Southeast Asia
- 12.7.6.4 Oceania
- 12.7.7 Subsegment Pricing and Adoption Trends
- 12.7.8 Leading Suppliers and Competition
- 12.7.9 Regional Demand and Opportunities
- 12.8 Segment Growth Comparison
- 12.9 Segment Attractiveness and Priority Matrix
Chapter 13 Asia-Pacific Cold Chain Outsourcing End-Use and Application Market Outlook
- 13.1 End-Use Industry and Customer Demand Structure
- 13.2 Leading Applications and Customer Groups
- 13.3 End-Use Market Size, Share and Forecast
- 13.4 Major End-Use Industry Deep Dives
- 13.4.1 Customer Requirements and Use Cases
- 13.4.2 Demand and Replacement Cycles
- 13.4.3 Technical and Regulatory Considerations
- 13.4.4 Purchasing and Procurement Models
- 13.4.5 Leading Vendors and Distribution Channels
- 13.4.6 Forecast and Commercial Opportunities
- 13.5 Emerging Applications and Cross-Segment Demand
- 13.6 End-Use Industry Investment Priorities
Chapter 14 Asia-Pacific Cold Chain Outsourcing Geographic Market Outlook, 2025-2035
- 14.1 Regional Market Size and Country-Level Shares, 2025
- 14.2 Country Market Size Comparison, 2025
- 14.3 Country Market Forecasts, 2025-2035
- 14.4 Subregional Industrial and Demand Clusters
- 14.5 Intra-Regional Pricing and Cost Differences
- 14.6 Cross-Border Trade and Supply Networks
- 14.7 Regional Supply and Demand Balances
- 14.8 Country Opportunity Comparison and Prioritization
Note: Every listed country is covered on the structure shown under the first country.
Chapter 15 Asia-Pacific Cold Chain Outsourcing Technology, Innovation and Sustainability Outlook
- 15.1 Technology Landscape and Maturity
- 15.2 Product, Process and Service Innovation
- 15.3 AI, Automation and Digital Tools in the Industry
- 15.4 Technology Adoption and Performance Benchmarking
- 15.5 Innovation Pipeline and R&D Investment
- 15.6 Energy Efficiency and Resource Management
- 15.7 Sustainability, Recycling and Circularity
- 15.8 Technology Roadmap, 2025-2035
- 15.9 Risks of Obsolescence and Technology Substitution
Chapter 16 Asia-Pacific Cold Chain Outsourcing Market Key Strategic Imperatives
- 16.1 Growth and Market Entry Priorities
- 16.2 High-Return Products and Segments
- 16.3 Pricing, Profitability and Cost Optimization
- 16.4 Technology Investment and Product Differentiation
- 16.5 Supply Chain Localization and Resilience
- 16.6 Distribution and Customer Acquisition
- 16.7 Partnership, Acquisition and Capacity Strategy
- 16.8 Regional Expansion Priorities
- 16.9 Short-, Medium- and Long-Term Actions
Chapter 17 Competition Outlook
- 17.1 Industry Competition Characteristics
- 17.2 Market Structure and Concentration
- 17.3 Market Share and Competitive Positioning, 2025
- 17.4 Company-Wise Revenue and Product Benchmarking
- 17.5 Production and Service Capacity Benchmarking
- 17.6 Technology, Pricing and Differentiation
- 17.7 Regional Footprint and Distribution Strength
- 17.8 Mergers, Acquisitions and Strategic Alliances
- 17.9 New Entrants and Competitive Threats
- 17.10 Porter's Five Forces and Industry Attractiveness
- 17.11 Competitive Outlook, 2025-2035
Chapter 18 Company Profiles
- 18.1 Company Coverage and Selection Criteria
- 18.2 DHL Group
- 18.2.1 Business Description
- 18.2.2 Company Ownership and Geographic Presence
- 18.2.3 Product and Service Portfolio
- 18.2.4 Manufacturing and Operating Footprint
- 18.2.5 Financial Performance and Investment
- 18.2.6 Market Share and Competitive Position
- 18.2.7 Technology and Innovation Capabilities
- 18.2.8 Strategic Alliances or Partnerships
- 18.2.9 Recent Developments
- 18.2.10 Growth Strategy and Outlook
- 18.3 S.F. Holding
- 18.4 JD Logistics
- 18.5 Nichirei Logistics Group
- 18.6 Lineage
- 18.7 Americold
- 18.8 Kuehne+Nagel
- 18.9 UPS Healthcare
- 18.10 Nippon Express
- 18.11 Snowman Logistics
- 18.12 Other Relevant Market Participants
Note: Every listed company is profiled on the structure shown under the first company. The company list is preliminary and may change based on research findings, market developments, data availability and client requirements.
Chapter 19 Disclaimer
- 19.1 Research and Forecast Disclaimer
- 19.2 Data Source and Estimation Limitations
Note: The depth of individual sections depends on data availability for this market. Volume, capacity, trade and other unit-based metrics are included where applicable.

