
Pre-arrival filing rules raise demand for licensed brokers
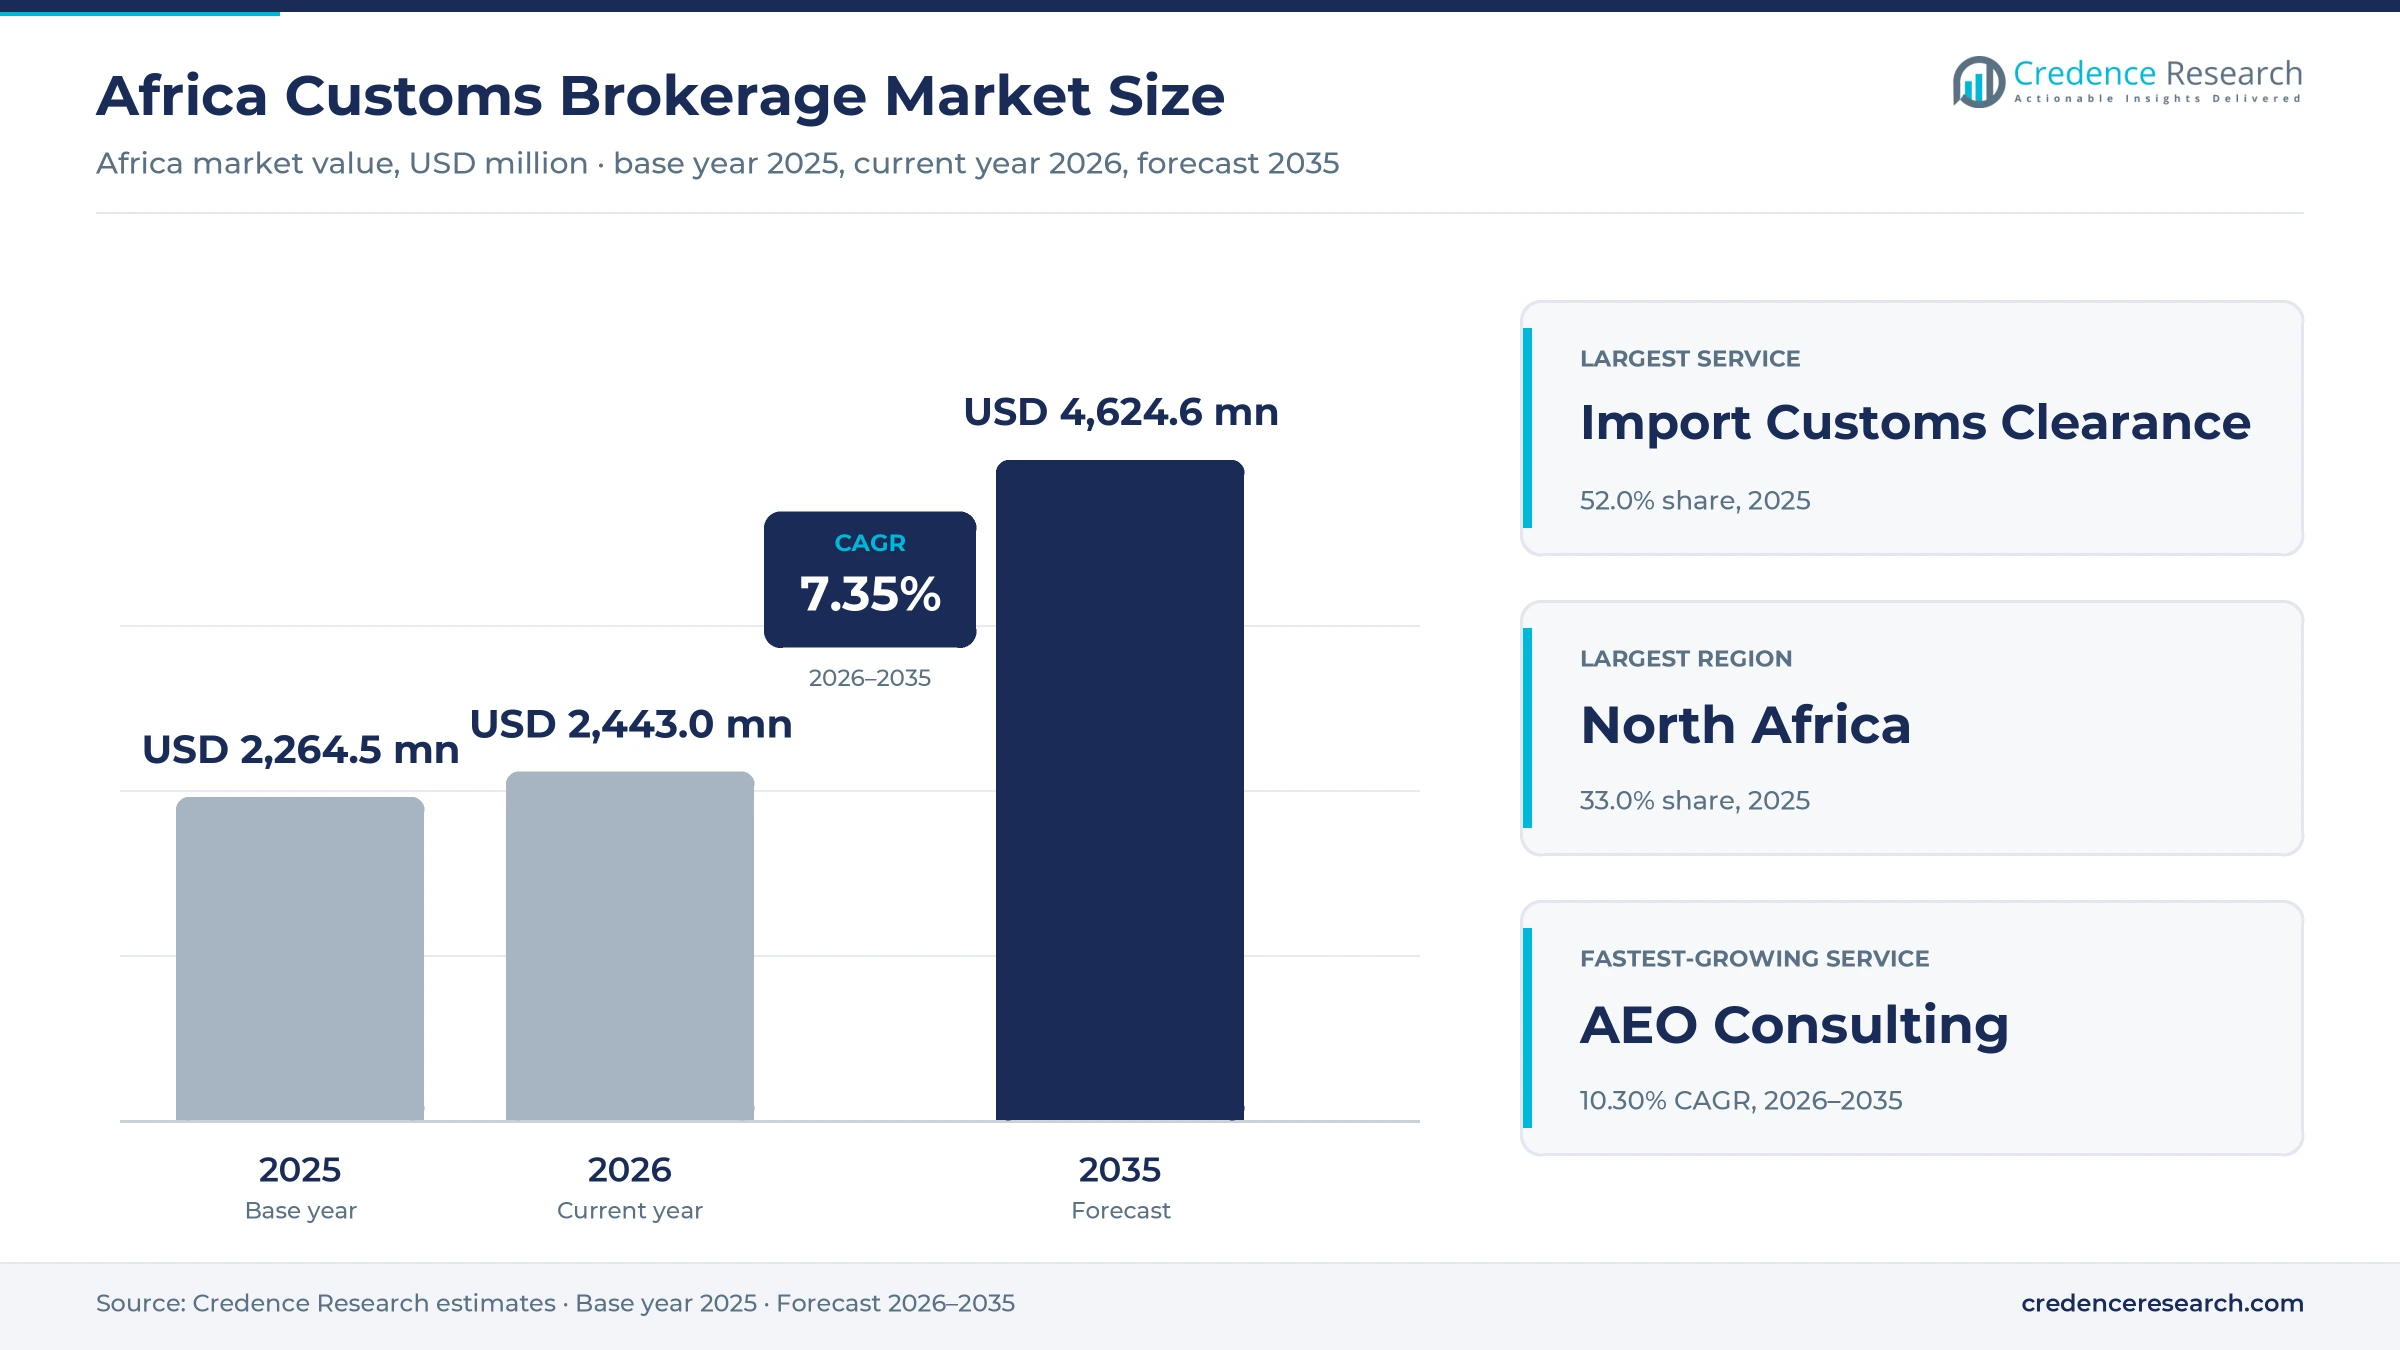
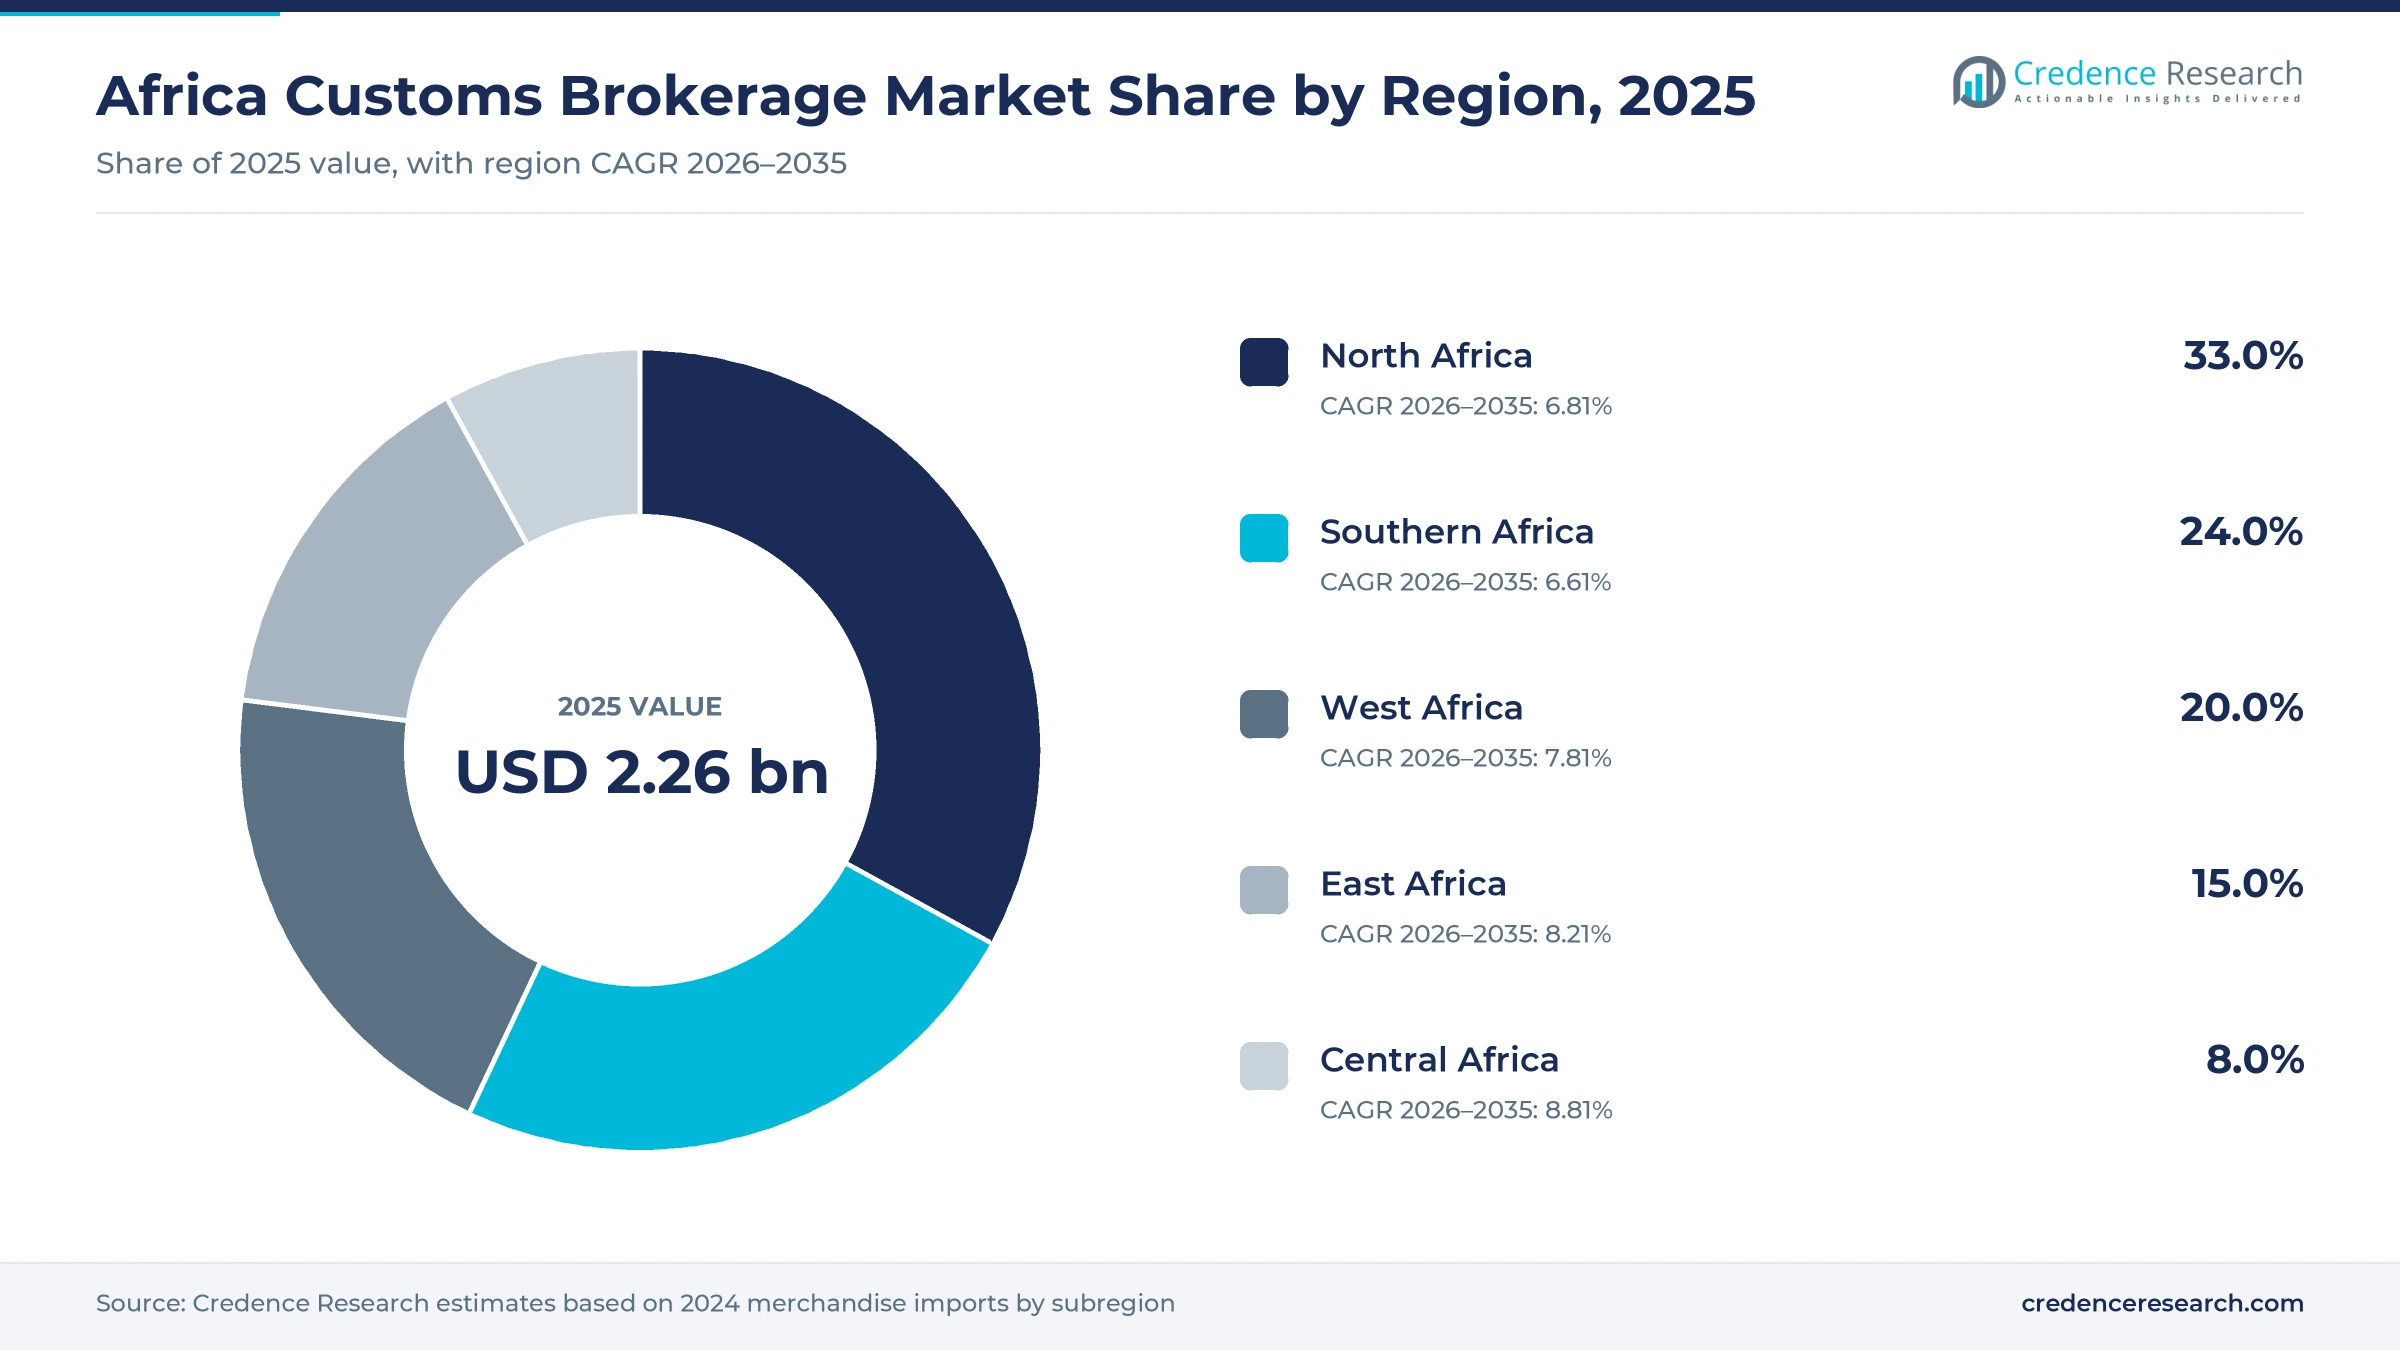
The Africa customs brokerage market was valued at USD 2.26 billion in 2025 and is projected to increase from USD 2.44 billion in 2026 to USD 4.62 billion by 2035, registering a CAGR of 7.35% during 2026–2035. Demand comes from importers and exporters that must file declarations, pay duties and obtain permits, from freight forwarders that outsource clearance, and from express operators adding second-city lanes. North Africa held the largest regional share, 33.0% in 2025, because Egypt and Morocco rank among the largest goods buyers on the continent. Central Africa is the fastest-growing region at 8.81% a year, as Congolese cargo moves through new corridors. In turn, filing is moving ahead of the ship, because Kenya began requiring an advance cargo code for containers on Aug. 3, 2026, after Egypt extended advance cargo information to air freight in January 2026.
What does customs brokerage cover across African trade lanes?
The market counts fees paid to licensed brokers and forwarders for preparing declarations, classifying goods, calculating duties, assembling permits and managing transit bonds. Buyers usually pay per declaration, although larger shippers sign recurring compliance retainers. Advisory work on origin rules and operator accreditation is sold as project-based fees.
The duties and taxes themselves are excluded, as are freight charges, port handling and warehousing billed separately. The value chain runs from the shipper or forwarder through the licensed broker to the customs administration, with port community systems and single windows carrying the data between them.
Africa Customs Brokerage Market Insights
- The market grows from USD 2.26 billion in 2025 to USD 4.62 billion by 2035, a 7.35% CAGR, as advance filing and accreditation rules add paid work per shipment.
- North Africa held 33.0% of 2025 value, supported by large goods imports through Egypt and Morocco and by advance cargo filing at seaports and airports.
- Import Customs Clearance held 52.0% of 2025 value, because every commercial consignment entering an African market needs a licensed declaration and duty assessment.
- Kenya required advance cargo codes from Aug. 3, 2026, and Nigeria retired its Fast Track scheme on Dec. 31, 2025, moving trusted traders into accreditation.
- DHL Group announced more than 300 million euros for Sub-Saharan Africa in October 2025, while Africa Global Logistics planned over 60 million euros for Ivorian inland hubs.
Import clearance leads as AEO advice grows fastest
Why import clearance leads and AEO consulting grows fastest
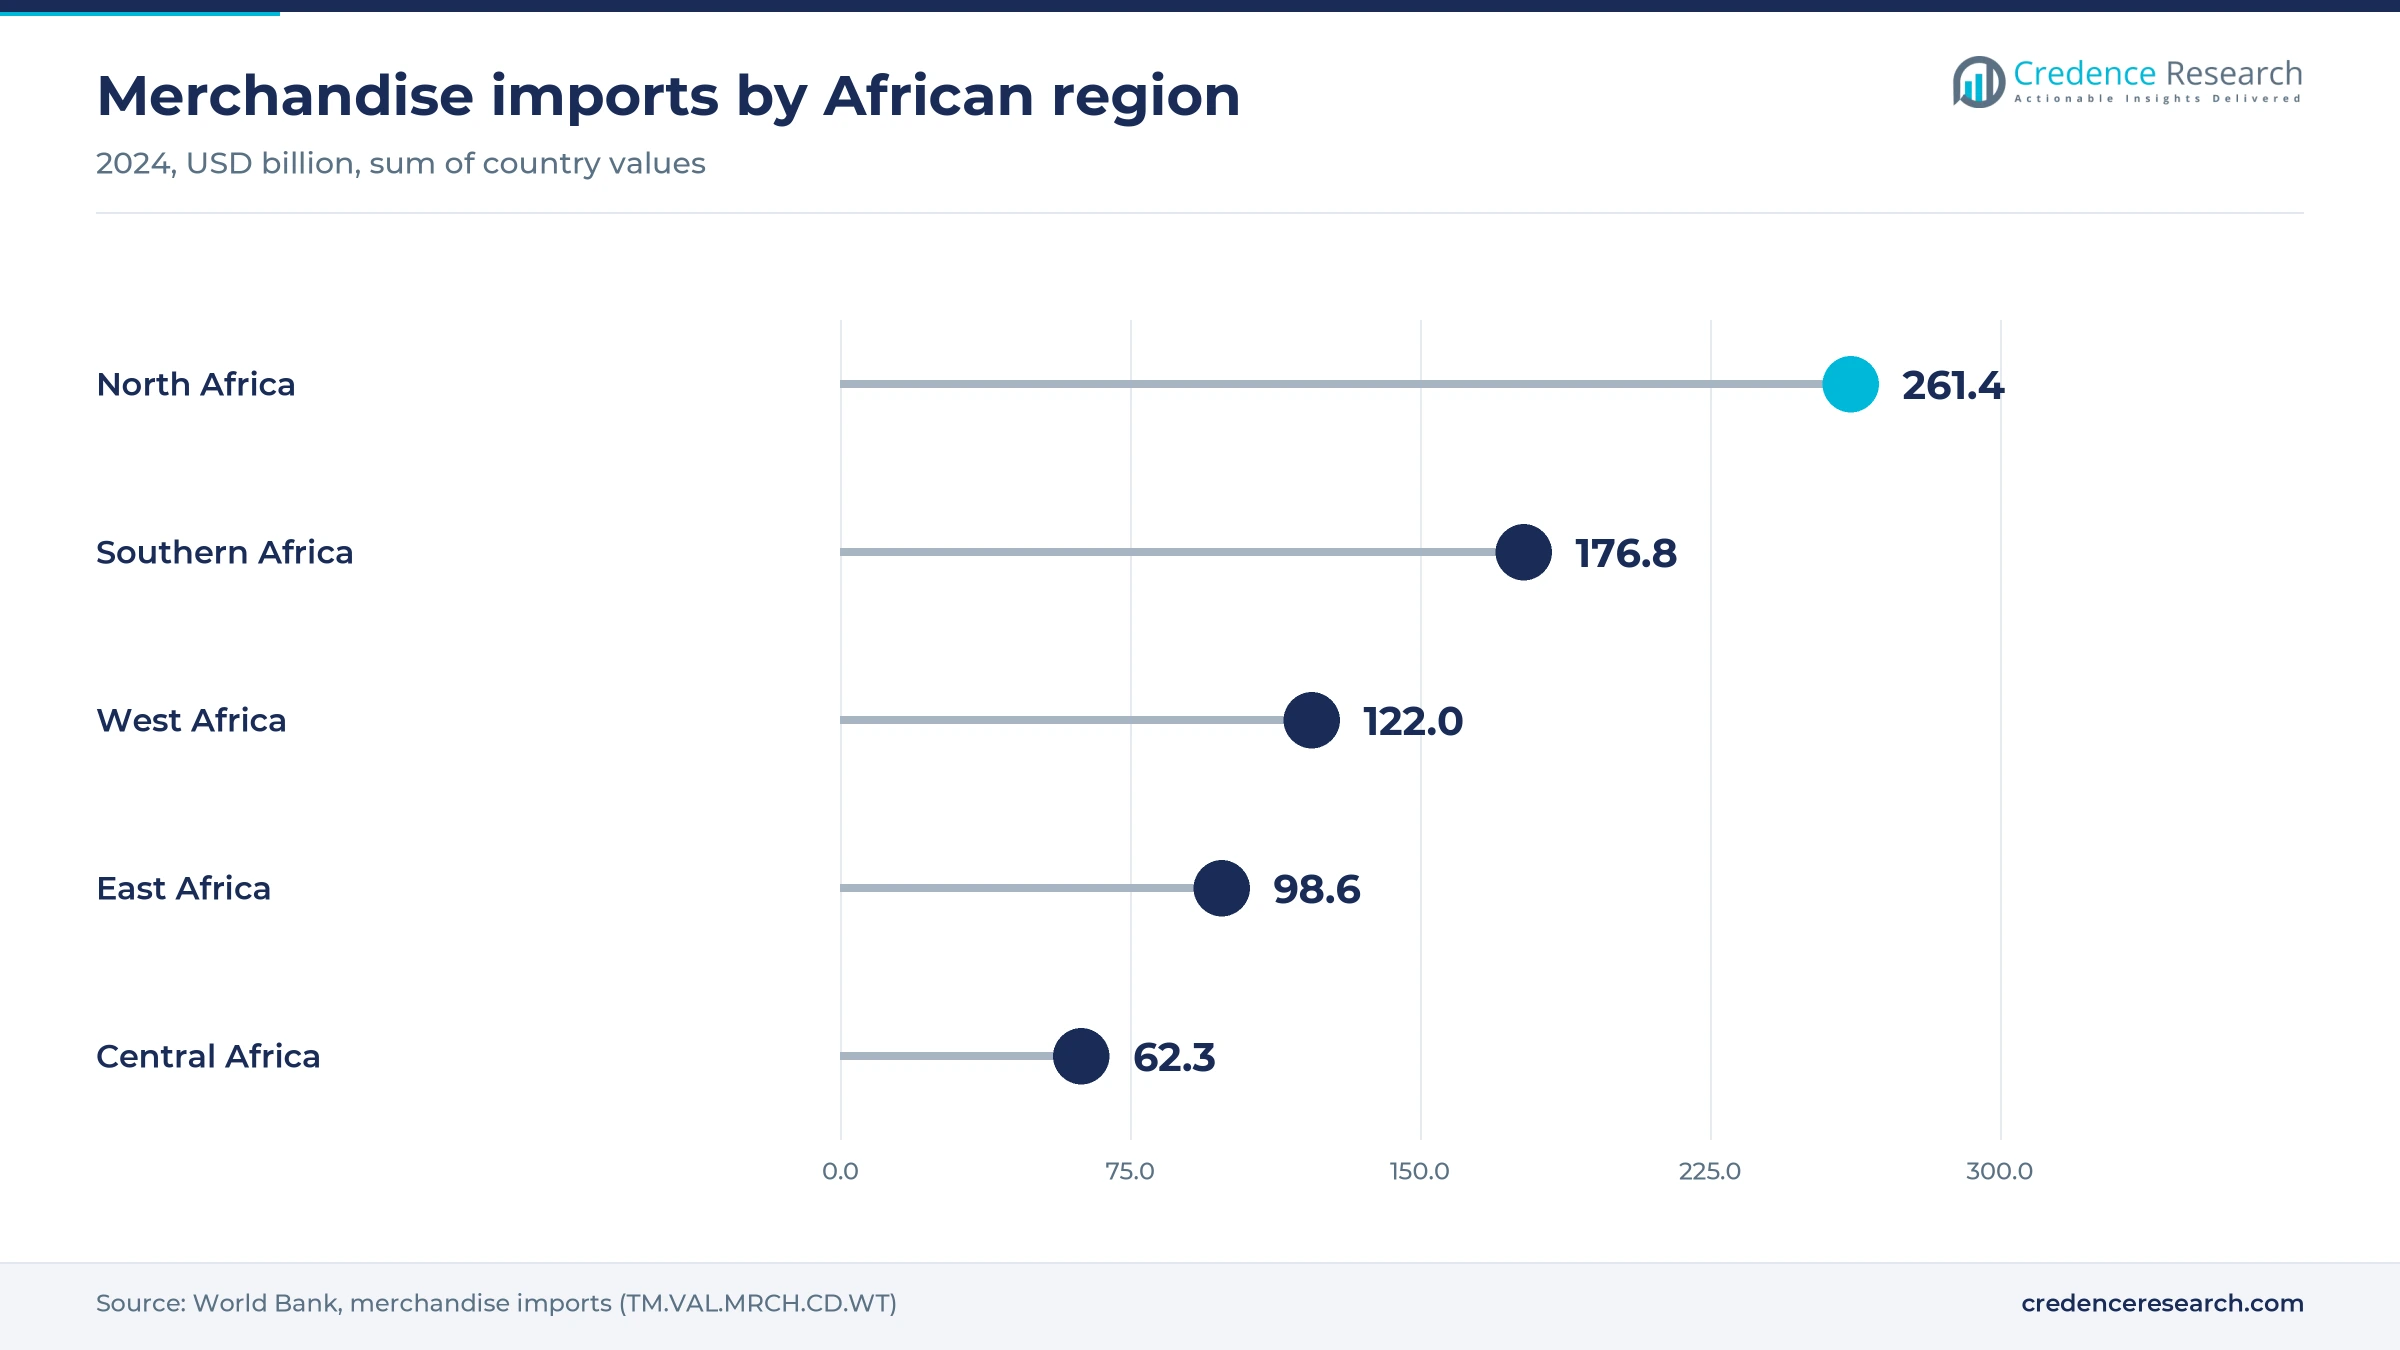
Based on service type, the market is categorized into import customs clearance, export customs clearance, trade compliance advisory, transit procedures and AEO consulting. Import Customs Clearance led with 52.0% of 2025 value because African countries bought about USD 721 billion of merchandise in 2024, on a Credence Research sum of World Bank import data for 54 countries, and commercial consignments need declarations. AEO Consulting grows fastest at 10.30% a year as accreditation spreads, with South Africa counting 831 accredited operators by May 31, 2025, and the Nigeria Customs Service retiring its Fast Track scheme on Dec. 31, 2025.
Why sea filing leads while rail starts from a small base
Based on mode of transport, the market is categorized into sea, air, road and rail. Sea led with 56.0% of 2025 value because ports concentrate formal declarations, and Dar es Salaam alone handled 33.71 million metric tons in the 2025/26 financial year, up 21.5%, according to Citizen Digital. Rail grows fastest at 9.73% a year as Lobito Atlantic Railway moved a record 27,000 metric tons of international cargo in July 2026, and it targets about 400,000 metric tons of cargo for the year, according to Ver Angola.
Why imports dominate fees and transit work grows fastest
Based on shipment flow, the market is categorized into domestic-market imports, domestic-origin exports and transit and re-exports. Domestic-Market Imports led with 64.0% of 2025 value because importers carry the duty, permit and levy exposure, as Nigeria showed in July 2025 when it reintroduced a 4% free-on-board charge, according to Guardian Nigeria. Transit and Re-Exports grows fastest at 8.77% a year as transit tonnage through Dar es Salaam rose 17% to 14.61 million metric tons in 2025/26, from 12.52 million metric tons a year earlier, according to Citizen Digital.
Why direct shippers lead and parcel operators grow fastest
Based on customer type, the market is categorized into direct importers and exporters, freight forwarders, express and parcel operators, and public-sector procurers. Direct Importers and Exporters led with 47.0% of 2025 value because accredited shippers capture the savings themselves, and the Nigerian customs chief said pioneer firms cut clearance from five days to 43 hours, according to Guardian Nigeria. Express and Parcel Operators grows fastest at 8.92% a year as DHL Group said on Oct. 15, 2025 that it would extend time-definite coverage into second cities, which adds many low-value small parcel entries.
| Segment Group | Leading Sub-segment | Share, 2025 | Fastest-growing Sub-segment | CAGR, 2026–2035 |
|---|---|---|---|---|
| By Service Type | Import Customs Clearance | 52.0% | AEO Consulting | 10.30% |
| By Mode of Transport | Sea | 56.0% | Rail | 9.73% |
| By Shipment Flow | Domestic-Market Imports | 64.0% | Transit and Re-Exports | 8.77% |
| By Customer Type | Direct Importers and Exporters | 47.0% | Express and Parcel Operators | 8.92% |
Request a Free Sample
Fill in your details and we'll send you a free sample report.
- Sample data tables & charts
- Research methodology
Trade recovery and digital filing lift broker demand
Formal trade recovery expands the declaration base
Formal trade recovery is the broadest driver of demand, because every additional consignment crossing a border creates another declaration, duty assessment and release order. The Afreximbank 2026 African Trade Report put continental merchandise trade at roughly USD 1.5 trillion in 2025, a rise of 6.1%, according to Leadership Newspapers. Intra-African trade grew 5.5% to USD 213.8 billion from USD 202.7 billion, which adds shorter, more frequent consignments across land borders. Regional demand also rests on South Africa, which shipped USD 31.1 billion of goods to African markets in 2025, according to Afreximbank data reported by Arise News. As a result, shippers buy freight forwarding and clearance together on these lanes, which supports Import Customs Clearance at 52.0% of value.
Pre-arrival digital compliance adds work before loading
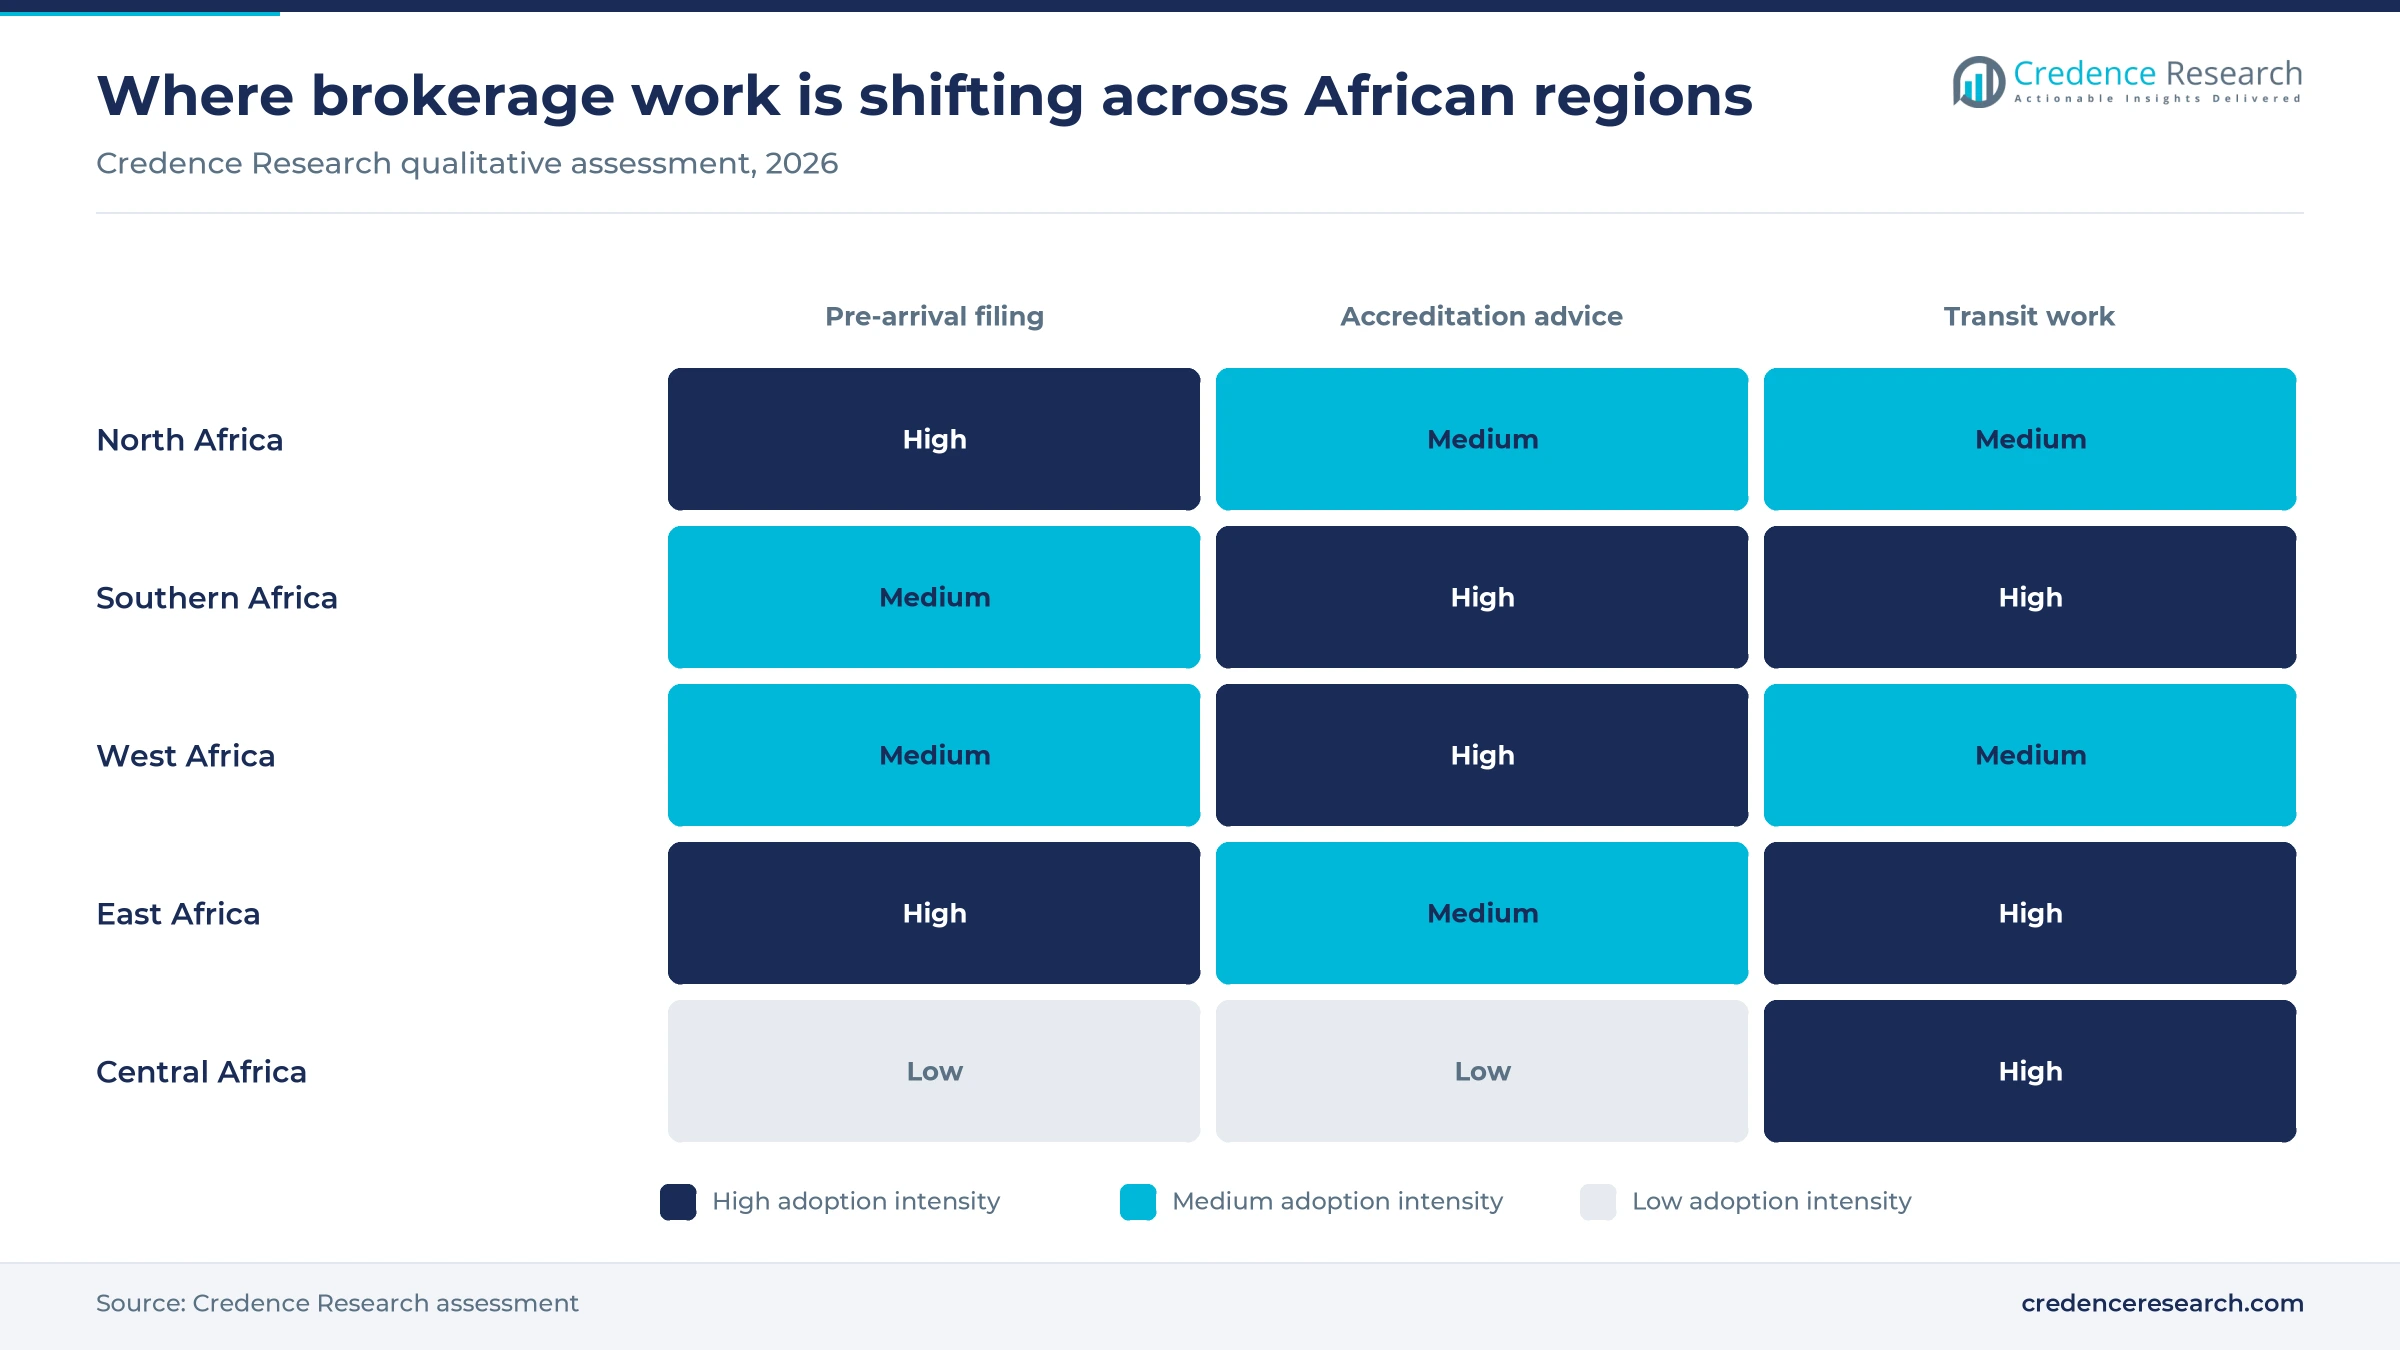
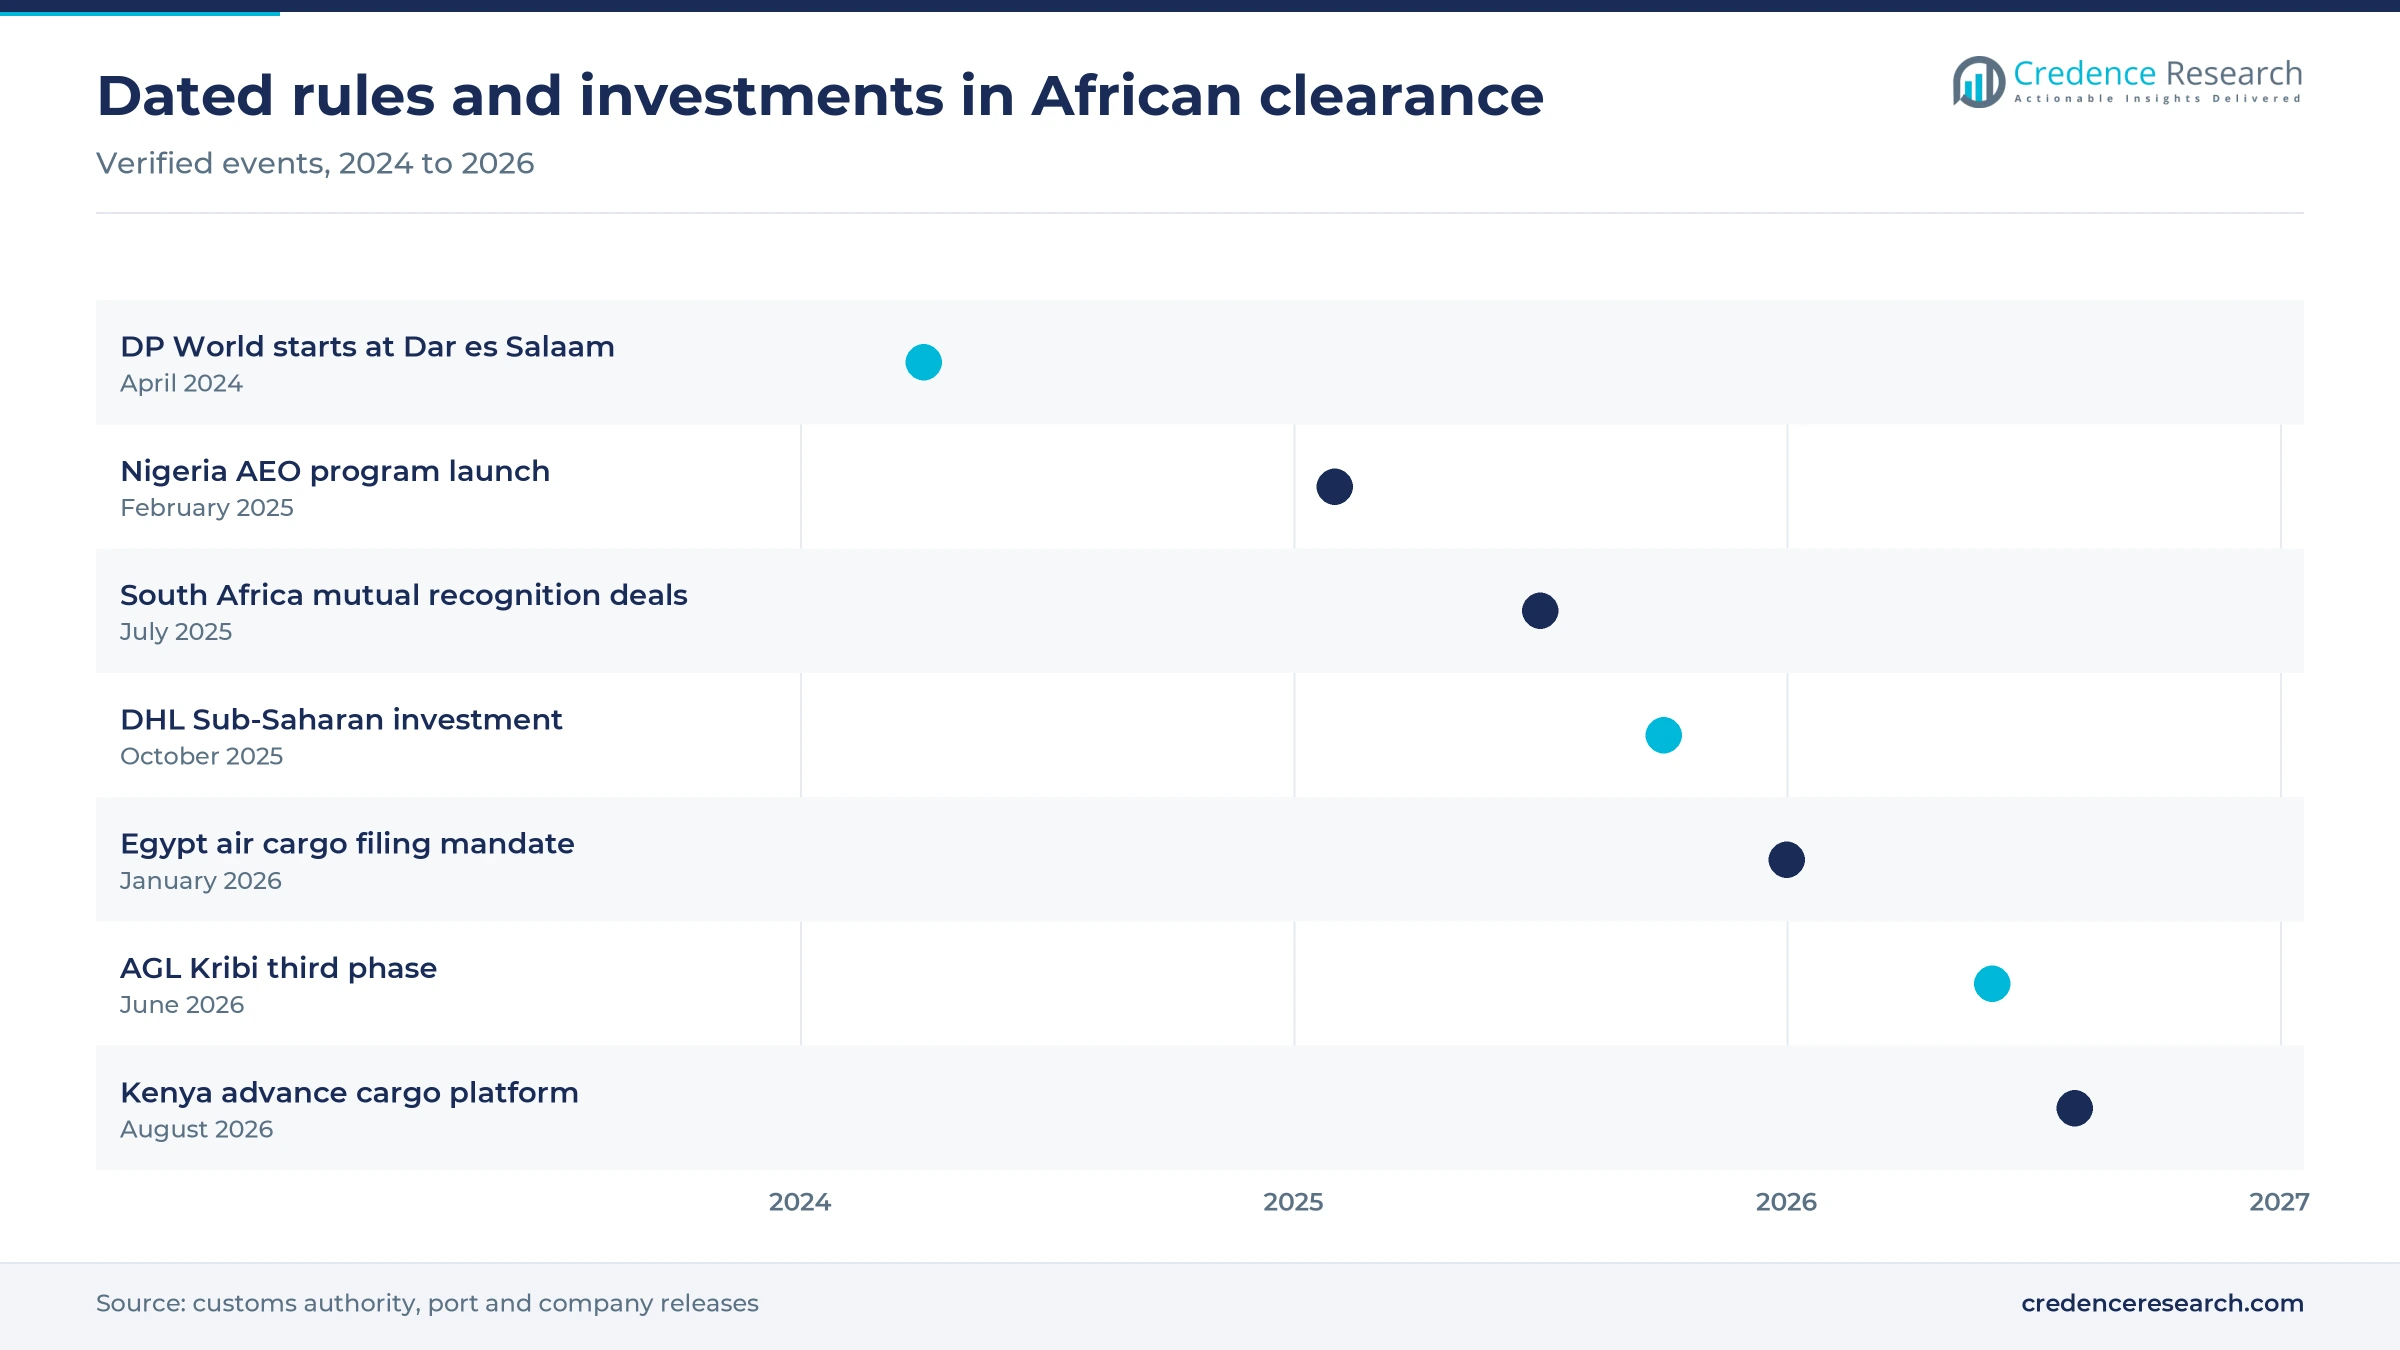
Pre-arrival digital compliance moves broker work upstream, because documents must now be validated before cargo sails or flies. The Kenya Revenue Authority launched its Advance Cargo Declaration platform on Aug. 3, 2026, requiring four uploaded documents for every container bound for Kenyan ports. Maersk then told customers that carriers would load only containers holding a valid code from Sept. 1, 2026. Egypt made advance cargo information mandatory for all air freight on Jan. 1, 2026, according to the German-Arab Chamber of Industry and Commerce. Senegal scheduled electronic release orders at Dakar for Jan. 2, 2026, according to WeAreTech Africa. Because errors now stop loading at origin, shippers pay brokers to check files earlier.
Industrial gateway expansion draws cargo to new hubs
Industrial gateway expansion lifts demand because new ports and inland hubs create fresh clearance points close to factories and farms. Tanger Med Port Authority reported 535,203 trucks and 161 million tons of cargo in 2025, showing how much road freight now meets its sea traffic in Morocco. Africa Global Logistics planned over 60 million euros across five years for hubs in Ferkessedougou, Bouake and San Pedro, according to a May 2025 report in TimesLIVE. The same group broke ground on June 25, 2026, on a CFA2.6 billion third phase at Kribi, according to Business in Cameroon. In turn, brokers open desks beside these sites, which supports 7.81% annual growth in West Africa.
Operator accreditation creates a paid compliance layer
Operator accreditation creates recurring advisory income, because firms must document security, record keeping and customs controls before they gain faster release. The South African Revenue Service said on July 2, 2025, that it had signed mutual recognition agreements with the United States, Britain and India, taking its network to nearly 46% of export destinations by value. Nigeria launched its own program on Feb. 14, 2025, and certified six pioneer companies, according to Guardian Nigeria. Nairametrics reported that Nigeria then gave Fast Track firms until the end of 2025 to migrate, so that only approved companies would keep those privileges. As a result, accreditation advice moves from an occasional project toward a recurring retainer for large importers, exporters and their appointed agents.
Data exchange and corridor shifts reshape clearance
Emerging customs-to-customs data links shift transit filing
A shift toward customs-to-customs data exchange is changing transit filing, because cargo information can reach the next administration before the truck arrives. Malawi, Mozambique, South Africa, Zambia and Zimbabwe agreed a joint roadmap in Pretoria on Aug. 24-26, 2026, at a meeting convened by TradeMark Africa, according to Logistics Africa. Existing data links between Zambia and Malawi, and between Zambia and Zimbabwe, will form the base for phased corridor rollouts. Baker McKenzie reported in April 2026 that Nigeria targets a 50% cut in physical cargo checks through AI profiling. Consequently, buyers of supply chain consulting now ask how regional data rules change broker contracts and transit bonds.
Rising transit volumes shift work toward alternative corridors
Rising transit volumes are shifting broker work toward alternative corridors, as landlocked buyers spread risk across several ports. Congolese cargo through Dar es Salaam reached 7.77 million metric tons in 2025/26, up 30%, while Rwandan cargo rose 24% to 2.18 million metric tons, according to Citizen Digital. Zambia took a further 3.41 million metric tons through the same port in that year. Roughly half of Lobito Atlantic Railway cargo is copper and cobalt moving from Congo to Angola, according to Ver Angola, with a similar volume moving back inland. Egypt also let transit shipments skip advance registration for three months from March 15, 2026, according to Ahram Online. Therefore, brokers with bonds in several countries can win routing decisions that single-country firms cannot.
Opportunity in origin advice under the continental trade area
Origin advice is a clear opening for brokers, because preferential entry under the African Continental Free Trade Area depends on proving where goods were made. The World Customs Organization said in December 2025 that consensus on product-specific rules had reached full coverage of the Harmonized System under its joint program, according to Freight News. The same program ran 63 activities in 2025 and trained 108 trainers from 20 countries. It also validated a data model for an electronic certificate of origin, with formal adoption expected at later policy meetings. More than 30 private-sector staff now act as origin focal points, which shows how thin company expertise remains. Consequently, brokers offering classification and origin audits can sell retainers that per-declaration work cannot support.
Opportunity in healthcare and perishable clearance services
Healthcare and perishable cargo offers an opening for specialist brokers, because regulators attach permits and temperature duties to each shipment. Nigeria began a two-year duty and value-added tax waiver on pharmaceutical raw materials in March 2025, and customs compiles quarterly importer reports, according to Nairametrics, which raises paperwork for drug makers. Bidvest International Logistics opened a pharmaceutical warehouse at OR Tambo International Airport in November 2025 that can receive cargo before clearance, according to Creamer Media. Egyptian customs aims to cut clearance of food and medicine to two days from an average of five in 2025, according to Ahram Online. Brokers that pair permits with cold-chain packaging checks can charge above standard rates.
Outages, levies and license risk test African brokers
Platform outages strand cargo and expose brokers
Platform outages are the most visible risk, because brokers cannot pay duties or release goods when a customs system fails. Guardian Nigeria reported about 5,000 import containers stuck at Lagos ports in August 2025 after glitches on the B'Odogwu platform, and the Comptroller General said hacking attempts caused part of the downtime. Importers then faced demurrage charges while agents absorbed the complaints. Brokers increasingly mitigate this risk with contingency filing procedures, although those procedures depend on the administration accepting them.
Levy changes make landed-cost quotes unreliable
Sudden levy changes create pressure on brokers, because clients expect quotes that hold from order to release. Nigeria's 4% charge replaced a 7% collection fee and a 1% inspection fee in July 2025, according to Guardian Nigeria. A national officer of the Association of Registered Freight Forwarders of Nigeria argued that the total still felt like eight percent. Importers of vehicles and high-volume goods reported net cost increases. Brokers reduce disputes by repricing quotes at filing and by publishing charges separately from their own fees.
New filing rules can trigger port logjams
New filing rules carry a transition risk, because cargo already at sea may not meet requirements introduced after loading. The EastAfrican reported that Kenyan clearing agents contested the export declaration requirement for cargo shipped before Aug. 3, 2026, and that clearance slowed at Mombasa and inland depots. This backlog exposed importers and transporters to storage, demurrage and detention charges, including landlocked markets using the port. Associations can limit the damage by agreeing written transition dates with revenue authorities before enforcement begins.
License enforcement concentrates risk on small agents
Stricter license enforcement is a growing constraint, because one client's unpaid item can threaten an agent's whole book of business. Freight News reported on April 22, 2025, that South African customs was issuing notices to suspend clearing licenses over unfinalized provisional payments, and it cited a case of only R10,000. The same report said declarations were increasingly rejected rather than queried. Small agents carry the most exposure, so many now screen clients more closely and invest in automated checks before filing.
North Africa leads as Central Africa grows fastest
| Region | Value, 2025 (USD billion) | Share, 2025 | CAGR, 2026–2035 |
|---|---|---|---|
| North Africa | 0.75 | 33.0% | 6.81% |
| Southern Africa | 0.54 | 24.0% | 6.61% |
| West Africa | 0.45 | 20.0% | 7.81% |
| East Africa | 0.34 | 15.0% | 8.21% |
| Central Africa | 0.18 | 8.0% | 8.81% |
North Africa leads on large import flows and early e-filing
North Africa held a regional share of 33.0% in 2025 and grows at 6.81% a year. This position rests on the seven countries in the zone, which bought about USD 261 billion of goods in 2024, according to World Bank data. Egypt alone imported USD 86.1 billion and Morocco USD 75.7 billion in that year. Egypt's Nafeza platform requires importers to obtain an advance cargo number before shipment, so brokers work earlier in each order. Growth runs below the regional average because these systems are already mature.
Southern Africa relies on South African trade and accreditation
Southern Africa held a regional share of 24.0% in 2025 and grows at 6.61% a year. This position rests on South Africa, which imported USD 123.5 billion of goods in 2024, according to World Bank data. South Africa also accounted for 19.2% of intra-African trade in 2025, according to Afreximbank data reported by Arise News. DSV merged Schenker's South African business into its own from Nov. 1, 2025, which consolidates forwarding accounts. A mature broker base and established accreditation keep growth below the continental rate.
West Africa grows with Nigerian reform and Ivorian hubs
West Africa held a regional share of 20.0% in 2025 and grows at 7.81% a year. Growth rests partly on Nigeria, which imported USD 41.3 billion of goods in 2024, according to World Bank data. Abidjan container traffic was expected to reach about 1.8 million TEUs in 2025, from 1.2 million a year earlier, according to TimesLIVE. The Port of Dakar generates nearly 95% of Senegalese customs revenue, according to WeAreTech Africa. Reform at these gateways adds compliance work while also exposing brokers to system failures.
East Africa gains from transit lanes and new filing rules
East Africa held a regional share of 15.0% in 2025 and grows at 8.21% a year. Growth rests on lanes serving Kenya and Ethiopia, which imported USD 20.1 billion and USD 18.6 billion of goods in 2024, according to World Bank data. Terminal discharge times at Dar es Salaam fell from more than 300 hours to under 28 hours after DP World began operating in April 2024, according to Citizen Digital. Faster ships push the bottleneck toward documentation, so brokers on the Mombasa and Dar corridors gain work as filing moves ahead of loading.
Central Africa grows fastest on Congolese corridor demand
Central Africa held a regional share of 8.0% in 2025 and grows at 8.81% a year, the fastest rate on the continent. The Democratic Republic of Congo imported USD 26.6 billion of goods in 2024, according to World Bank data, and depends on foreign ports for much of this trade. Africa Global Logistics has now spent CFA10.7 billion on its Kribi hub, according to Business in Cameroon, including a 9,000-square-meter warehouse. Transit bonds and mining cargo paperwork therefore add broker work from a small base.
Rules, hubs and investments from 2024 to 2026
| Development | Status and market relevance |
|---|---|
| In February 2025, the Nigeria Customs Service launched its Authorized Economic Operator program and certified six pioneer companies in Lagos. | Nigerian accreditation replaced Fast Track privileges from the end of 2025. |
| In July 2025, the South African Revenue Service announced mutual recognition agreements with customs authorities in the United States, Britain and India. | South Africa had 831 accredited operators by May 31, 2025. |
| In October 2025, DHL Group announced more than 300 million euros of multi-year investment across Sub-Saharan Africa. | DHL Global Forwarding will add energy, cold-chain and healthcare capabilities. |
| In November 2025, Bidvest International Logistics opened a pharmaceutical warehouse at OR Tambo International Airport with accreditation from the South African health regulator. | The site can receive client cargo before customs clearance. |
| In August 2026, the Kenya Revenue Authority launched its Advance Cargo Declaration platform for all containerized cargo bound for Kenyan ports. | Carrier validation before loading followed on Sept. 1, 2026. |
Single windows and risk engines change declarations
- National single windows such as Nafeza in Egypt and the port window at Dakar now carry permits, cargo data and release orders, which lets brokers file before goods move.
- Advance cargo platforms such as the Kenyan system tie a reference code to the bill of lading, so that document errors surface at the origin port.
- Risk engines use trade data to select shipments for inspection, and Nigeria aims to cut physical checks through AI-driven profiling.
- Electronic origin certificates are moving ahead through a validated continental data model, which should reduce paper handling for preferential claims.
Need a Custom Version of This Report?
Tailor the scope, geography, or segments to your exact requirements.
- Custom geography or segment scope
- Direct access to our analyst team
Global forwarders and port groups compete with brokers
Competition in customs brokerage splits between global forwarders, port-linked groups and many licensed national agents. Africa Global Logistics, owned by Mediterranean Shipping Company, ties its inland hub program to its port positions in Abidjan and Kribi, so it can offer shippers storage near the point of clearance. DHL Global Forwarding sells customs expertise on lanes linking Africa with Europe, Asia and the Middle East, and it runs a GoTrade initiative that trains small firms. Bidvest International Logistics competes on regulated cargo from its South African base. DSV gained scale in South Africa and Mozambique through its Schenker integration, while Kuehne+Nagel agreed in June 2023 to acquire perishables specialist Morgan Cargo, with operations in South Africa and Kenya. National agents keep an edge on local licensing and customs relationships, whereas the global groups win multinational accounts that want one contract across several countries.
Companies profiled and their roles in this market
| Company | Type | Role in the market |
|---|---|---|
| Africa Global Logistics | Port and logistics group | Holds port positions in Abidjan and runs the Kribi Logistics Hub, with planned Ivorian inland hubs |
| DHL Global Forwarding | Global forwarder | Offers freight forwarding and customs expertise on African trade lanes, with added cold-chain capability |
| Bidvest International Logistics | South African forwarder | Runs an accredited pharmaceutical warehouse at OR Tambo that receives cargo before clearance |
| DSV | Global forwarder | Offers customs clearance and, from November 2025, runs Schenker's South African business across air, sea, road and contract logistics |
| Kuehne+Nagel | Global forwarder | Agreed in June 2023 to acquire perishables forwarder Morgan Cargo, active in South Africa and Kenya |
Credence Research view on African clearance services
Credence Research's view is that African customs brokerage is moving from a per-entry clerical service toward a compliance service, and that pricing will follow. Kenya, Egypt and Senegal have each moved checks earlier in the shipment during the past year, which raises the value of accurate files. Accredited traders in Nigeria and South Africa need fewer routine inspections, yet they buy more advice to keep their status. Brokers holding bonds across borders and clean records with revenue authorities are the best placed. Agents relying on simple document handling face the most pressure as platforms automate those tasks.
How the African clearance estimate was built
The report uses 2025 as the base year and 2035 as the forecast year, and market values come from the Credence Research model, which was checked against public trade statistics. Regional shares are Credence Research estimates built from World Bank merchandise import data and adjusted for filing intensity. Segment shares and growth tilts are also Credence Research estimates. Source types used include customs and revenue authority notices, port authority reports, company releases and named trade press. No interviews or surveys were conducted for this edition, and every dated event was checked against its source page.
Compliance work and transit carry growth to 2035
The outlook to 2035 favors brokers that combine filing with compliance advice, as the market rises to USD 4.62 billion at a 7.35% annual rate. Import clearance should keep the largest share, although transit and accreditation work will take a growing part of new revenue. Corridors serving Congo, Zambia and Rwanda should add the most new filing points. The largest uncertainty is whether customs platforms stay reliable as they absorb more data, because Lagos showed how outages can stop trade. Automated classification will also reduce fees for simple entries, which should push smaller agents toward specialist cargo.
Frequently Asked Questions
How big is the Africa customs brokerage market?
Which African region leads customs brokerage demand?
Which region grows fastest in this market?
Which service type holds the largest share?
What is driving demand for customs brokers in Africa?
How do advance cargo rules affect African brokers?
What challenges do African customs brokers face?
Which companies are active in the market?
Table of Content
Chapter 1 Market Segmentation
- 1.1 Segmentation Framework
- 1.1.1 Product and Service Classification
- 1.1.2 Application and End-Use Classification
- 1.1.3 Technology and Solution Classification
- 1.1.4 Customer and Distribution Channel Classification
- 1.1.5 Geographic Segmentation
- 1.1.6 Market Segment Definitions and Boundaries
- 1.2 By Service Type
- 1.2.1 Import Customs Clearance
- 1.2.2 Export Customs Clearance
- 1.2.3 Trade Compliance Advisory
- 1.2.4 Transit Procedures
- 1.2.5 AEO Consulting
- 1.3 By Mode of Transport
- 1.3.1 Sea
- 1.3.2 Air
- 1.3.3 Road
- 1.3.4 Rail
- 1.4 By Shipment Flow
- 1.4.1 Domestic-Market Imports
- 1.4.2 Domestic-Origin Exports
- 1.4.3 Transit and Re-Exports
- 1.5 By Customer Type
- 1.5.1 Direct Importers and Exporters
- 1.5.2 Freight Forwarders
- 1.5.3 Express and Parcel Operators
- 1.5.4 Public-Sector Procurers
Chapter 2 Introduction
- 2.1 Report Objectives and Scope
- 2.2 Product Definition and Industry Terminology
- 2.3 Market Inclusions and Exclusions
- 2.4 Research Process
- 2.4.1 Primary Research and Expert Interviews
- 2.4.2 Secondary Research and Source Review
- 2.4.3 Top-Down and Bottom-Up Estimation
- 2.4.4 Data Triangulation and Verification
- 2.5 Market Size Measurement Basis
- 2.5.1 2025: USD 2.26 billion → 2035: USD 4.62 billion
- 2.6 Historical and Forecast Reference Periods
- 2.6.1 Historical Period: 2018-2025
- 2.6.2 Base Year: 2025
- 2.6.3 Forecast Period: 2025-2035
- 2.7 Research Assumptions and Limitations
Chapter 3 Executive Summary
- 3.1 Market Snapshot and Key Findings
- 3.2 Base-Year Market Size, 2025
- 3.3 Forecast Market Size, 2035
- 3.4 Revenue and Volume Growth Outlook
- 3.5 Key Demand and Supply Indicators
- 3.6 Leading Market Segments
- 3.7 Fastest-Growing Market Opportunities
- 3.8 Regional Performance Highlights
- 3.9 Technology and Industry Transformation
- 3.10 Competitive Landscape Summary
- 3.11 Analyst View and Strategic Implications
Chapter 4 Africa Customs Brokerage Market Trends and Developments
- 4.1 Historical Industry Development, 2018-2025
- 4.2 Recent Market Trends and Developments
- 4.3 Demand and Customer Behavior Trends
- 4.4 Technology and Product Innovation
- 4.5 Artificial Intelligence, Automation and Digitalization
- 4.6 Local Manufacturing and Supply Chain Realignment
- 4.7 Industry Partnerships, Mergers and Acquisitions
- 4.8 Sustainability and Circular Economy Developments
- 4.9 Government and Private Sector Investment Trends
- 4.10 Emerging Business Models and Commercialization
- 4.11 Industry Developments and Announcements
Chapter 5 Africa Customs Brokerage Market Production, Supply and Demand Analysis
- 5.1 Demand Trend and Consumption Analysis, 2018-2025
- 5.2 Demand Forecast, 2025-2035
- 5.3 Production and Output Trend, 2018-2025
- 5.4 Production and Output Forecast, 2025-2035
- 5.5 Installed Capacity and Capacity Utilization
- 5.6 Company-Wise Production Plants and Statistics
- 5.6.1 Installed Production Capacity
- 5.6.2 Actual Production
- 5.6.3 Planned Capacity and Expansion Targets
- 5.7 Supply Chain Structure and Procurement Trends
- 5.8 Supply-Demand Gap and Bottlenecks
- 5.9 Import Dependence and Sourcing Structure
- 5.10 Contract Manufacturing and Outsourcing
- 5.11 Regional Supply and Demand Concentration
Chapter 6 Africa Customs Brokerage Market Pricing Analysis
- 6.1 Pricing Structure and Measurement
- 6.2 Historical Pricing Trends, 2018-2025
- 6.3 Pricing Outlook, 2025-2035
- 6.4 Average Selling Price and Unit Economics
- 6.5 Pricing by Product and Market Segment
- 6.6 Geographic Pricing Differences
- 6.7 Key Input, Energy, Labor and Logistics Costs
- 6.8 Contract Pricing and Purchasing Models
- 6.9 Pricing Sensitivity and Competitive Positioning
- 6.10 Price, Margin and Profitability Implications
Chapter 7 Africa Customs Brokerage Market Dynamics
- 7.1 Market Growth Drivers
- 7.1.1 Demand-Side Drivers
- 7.1.2 Technology and Innovation Drivers
- 7.1.3 Infrastructure and Investment Drivers
- 7.1.4 Regulatory and Policy Drivers
- 7.2 Market Restraints
- 7.2.1 Cost and Affordability Constraints
- 7.2.2 Technology and Adoption Barriers
- 7.2.3 Supply Chain and Operational Constraints
- 7.3 Market Challenges
- 7.3.1 Competitive Pressure and Margin Erosion
- 7.3.2 Skills, Infrastructure and Implementation Gaps
- 7.4 Emerging Market Opportunities
- 7.5 Market Dynamics Impact and Time-Horizon Assessment
Chapter 8 Africa Customs Brokerage Value Chain Analysis
- 8.1 Industry Value Chain Overview
- 8.2 Upstream Suppliers and Critical Inputs
- 8.3 Technology and Component Providers
- 8.4 Manufacturing or Service Delivery
- 8.5 Distribution, Channel Partners and Integrators
- 8.6 Downstream Applications and End Users
- 8.7 Value Addition and Profit Pools
- 8.8 Vertical Integration and Outsourcing
- 8.9 Supplier Concentration and Risk
- 8.10 Supply Chain Localization and Resilience
Chapter 9 Africa Customs Brokerage Market Regulations and Policies
- 9.1 Relevant Laws, Standards and Compliance Frameworks
- 9.2 Product, Service, Safety and Quality Requirements
- 9.3 Government Policies, Incentives and Subsidies
- 9.4 Imports, Exports and Trade Barriers
- 9.5 Public Procurement and Local Content Requirements
- 9.6 Environmental and Sustainability Compliance
- 9.7 Upcoming Policy Changes and Market Implications
Chapter 10 Africa Customs Brokerage Market Hotspots and Opportunities
- 10.1 Market Opportunity Mapping and Growth Hotspots
- 10.2 High-Growth Applications and Customer Groups
- 10.3 Underserved Markets and White-Space Opportunities
- 10.4 Emerging Technology and Product Opportunities
- 10.5 New Capacity and Investment Hotspots
- 10.6 Market Entry and Expansion Opportunities
- 10.7 Distribution and Partnership Opportunities
- 10.8 Near-Term and Long-Term Commercial Potential
- 10.9 Opportunity Attractiveness and Execution Risks
Chapter 11 Africa Customs Brokerage Market Outlook, 2025-2035
- 11.1 Market Size and Analysis
- 11.1.1 Revenue (Market Measurement: 2025: USD 2.26 billion → 2035: USD 4.62 billion)
- 11.1.2 Market Volume and Quantity Sold
- 11.1.3 Historical Market Size, 2018-2025
- 11.1.4 Base-Year Market Size, 2025
- 11.2 Market Forecast, 2025-2035
- 11.2.1 Revenue Forecast to 2035
- 11.2.2 Volume Forecast to 2035
- 11.2.3 CAGR and Year-on-Year Growth
- 11.2.4 Incremental Revenue Opportunity
- 11.3 Forecast Assumptions and Scenario Analysis
- 11.3.1 Base-Case Forecast
- 11.3.2 Optimistic and Conservative Scenarios
- 11.3.3 Technology, Pricing and Policy Sensitivities
- 11.4 Market Attractiveness and Growth Outlook
Chapter 12 Africa Customs Brokerage Market Segmentation and Outlook
- 12.1 Segmentation Summary and Market Shares, 2025
- 12.2 Largest and Fastest-Growing Segments
- 12.3 By Service Type - Market Size and Forecast, 2025-2035
- 12.3.1 Segment Definition and Scope
- 12.3.2 Historical Market Size, 2018-2025
- 12.3.3 Revenue Forecast, 2025-2035
- 12.3.4 Volume Forecast, 2025-2035
- 12.3.5 Base-Year Market Share, 2025
- 12.3.6 Segment CAGR and Growth Drivers
- 12.3.7 Subsegment Market Size and Forecast
- 12.3.7.1 Import Customs Clearance
- 12.3.7.2 Export Customs Clearance
- 12.3.7.3 Trade Compliance Advisory
- 12.3.7.4 Transit Procedures
- 12.3.7.5 AEO Consulting
- 12.3.8 Subsegment Pricing and Adoption Trends
- 12.3.9 Leading Suppliers and Competition
- 12.3.10 Regional Demand and Opportunities
- 12.4 By Mode of Transport - Market Size and Forecast, 2025-2035
- 12.4.1 Segment Definition and Scope
- 12.4.2 Historical Market Size, 2018-2025
- 12.4.3 Revenue Forecast, 2025-2035
- 12.4.4 Volume Forecast, 2025-2035
- 12.4.5 Base-Year Market Share, 2025
- 12.4.6 Segment CAGR and Growth Drivers
- 12.4.7 Subsegment Market Size and Forecast
- 12.4.7.1 Sea
- 12.4.7.2 Air
- 12.4.7.3 Road
- 12.4.7.4 Rail
- 12.4.8 Subsegment Pricing and Adoption Trends
- 12.4.9 Leading Suppliers and Competition
- 12.4.10 Regional Demand and Opportunities
- 12.5 By Shipment Flow - Market Size and Forecast, 2025-2035
- 12.5.1 Segment Definition and Scope
- 12.5.2 Historical Market Size, 2018-2025
- 12.5.3 Revenue Forecast, 2025-2035
- 12.5.4 Volume Forecast, 2025-2035
- 12.5.5 Base-Year Market Share, 2025
- 12.5.6 Segment CAGR and Growth Drivers
- 12.5.7 Subsegment Market Size and Forecast
- 12.5.7.1 Domestic-Market Imports
- 12.5.7.2 Domestic-Origin Exports
- 12.5.7.3 Transit and Re-Exports
- 12.5.8 Subsegment Pricing and Adoption Trends
- 12.5.9 Leading Suppliers and Competition
- 12.5.10 Regional Demand and Opportunities
- 12.6 By Customer Type - Market Size and Forecast, 2025-2035
- 12.6.1 Segment Definition and Scope
- 12.6.2 Historical Market Size, 2018-2025
- 12.6.3 Revenue Forecast, 2025-2035
- 12.6.4 Volume Forecast, 2025-2035
- 12.6.5 Base-Year Market Share, 2025
- 12.6.6 Segment CAGR and Growth Drivers
- 12.6.7 Subsegment Market Size and Forecast
- 12.6.7.1 Direct Importers and Exporters
- 12.6.7.2 Freight Forwarders
- 12.6.7.3 Express and Parcel Operators
- 12.6.7.4 Public-Sector Procurers
- 12.6.8 Subsegment Pricing and Adoption Trends
- 12.6.9 Leading Suppliers and Competition
- 12.6.10 Regional Demand and Opportunities
- 12.7 Segment Growth Comparison
- 12.8 Segment Attractiveness and Priority Matrix
Chapter 13 Africa Customs Brokerage End-Use and Application Market Outlook
- 13.1 End-Use Industry and Customer Demand Structure
- 13.2 Leading Applications and Customer Groups
- 13.3 End-Use Market Size, Share and Forecast
- 13.4 Major End-Use Industry Deep Dives
- 13.4.1 Customer Requirements and Use Cases
- 13.4.2 Demand and Replacement Cycles
- 13.4.3 Technical and Regulatory Considerations
- 13.4.4 Purchasing and Procurement Models
- 13.4.5 Leading Vendors and Distribution Channels
- 13.4.6 Forecast and Commercial Opportunities
- 13.5 Emerging Applications and Cross-Segment Demand
- 13.6 End-Use Industry Investment Priorities
Chapter 14 Africa Customs Brokerage Geographic Market Outlook, 2025-2035
- 14.1 Regional Market Size and Country-Level Shares, 2025
- 14.2 Country Market Size Comparison, 2025
- 14.3 Country Market Forecasts, 2025-2035
- 14.4 Subregional Industrial and Demand Clusters
- 14.5 Intra-Regional Pricing and Cost Differences
- 14.6 Cross-Border Trade and Supply Networks
- 14.7 Regional Supply and Demand Balances
- 14.8 Country Opportunity Comparison and Prioritization
Note: Every listed country is covered on the structure shown under the first country.
Chapter 15 Africa Customs Brokerage Technology, Innovation and Sustainability Outlook
- 15.1 Technology Landscape and Maturity
- 15.2 Product, Process and Service Innovation
- 15.3 AI, Automation and Digital Tools in the Industry
- 15.4 Technology Adoption and Performance Benchmarking
- 15.5 Innovation Pipeline and R&D Investment
- 15.6 Patent and Intellectual Property Trends
- 15.7 Energy Efficiency and Resource Management
- 15.8 Sustainability, Recycling and Circularity
- 15.9 Technology Roadmap, 2025-2035
- 15.10 Risks of Obsolescence and Technology Substitution
Chapter 16 Africa Customs Brokerage Market Key Strategic Imperatives
- 16.1 Growth and Market Entry Priorities
- 16.2 High-Return Products and Segments
- 16.3 Pricing, Profitability and Cost Optimization
- 16.4 Technology Investment and Product Differentiation
- 16.5 Supply Chain Localization and Resilience
- 16.6 Distribution and Customer Acquisition
- 16.7 Partnership, Acquisition and Capacity Strategy
- 16.8 Regional Expansion Priorities
- 16.9 Short-, Medium- and Long-Term Actions
Chapter 17 Competition Outlook
- 17.1 Industry Competition Characteristics
- 17.2 Market Structure and Concentration
- 17.3 Market Share and Competitive Positioning, 2025
- 17.4 Company-Wise Revenue and Product Benchmarking
- 17.5 Production and Service Capacity Benchmarking
- 17.6 Technology, Pricing and Differentiation
- 17.7 Regional Footprint and Distribution Strength
- 17.8 Mergers, Acquisitions and Strategic Alliances
- 17.9 New Entrants and Competitive Threats
- 17.10 Porter's Five Forces and Industry Attractiveness
- 17.11 Competitive Outlook, 2025-2035
Chapter 18 Company Profiles
- 18.1 Company Coverage and Selection Criteria
- 18.2 Africa Global Logistics
- 18.2.1 Business Description
- 18.2.2 Company Ownership and Geographic Presence
- 18.2.3 Product and Service Portfolio
- 18.2.4 Manufacturing and Operating Footprint
- 18.2.5 Production Capacity and Expansion Plans
- 18.2.6 Financial Performance and Investment
- 18.2.7 Market Share and Competitive Position
- 18.2.8 Technology and Innovation Capabilities
- 18.2.9 Strategic Alliances or Partnerships
- 18.2.10 Recent Developments
- 18.2.11 Growth Strategy and Outlook
- 18.3 DHL Global Forwarding
- 18.4 Bidvest International Logistics
- 18.5 DSV
- 18.6 Kuehne+Nagel
- 18.7 Other Relevant Market Participants
Note: Every listed company is profiled on the structure shown under the first company. The company list is preliminary and may change based on research findings, market developments, data availability and client requirements.
Chapter 19 Disclaimer
- 19.1 Research and Forecast Disclaimer
- 19.2 Data Source and Estimation Limitations
Note: The depth of individual sections depends on data availability for this market. Volume, capacity, trade and other unit-based metrics are included where applicable.

