
Fleet owners hand tracking and upkeep to specialists
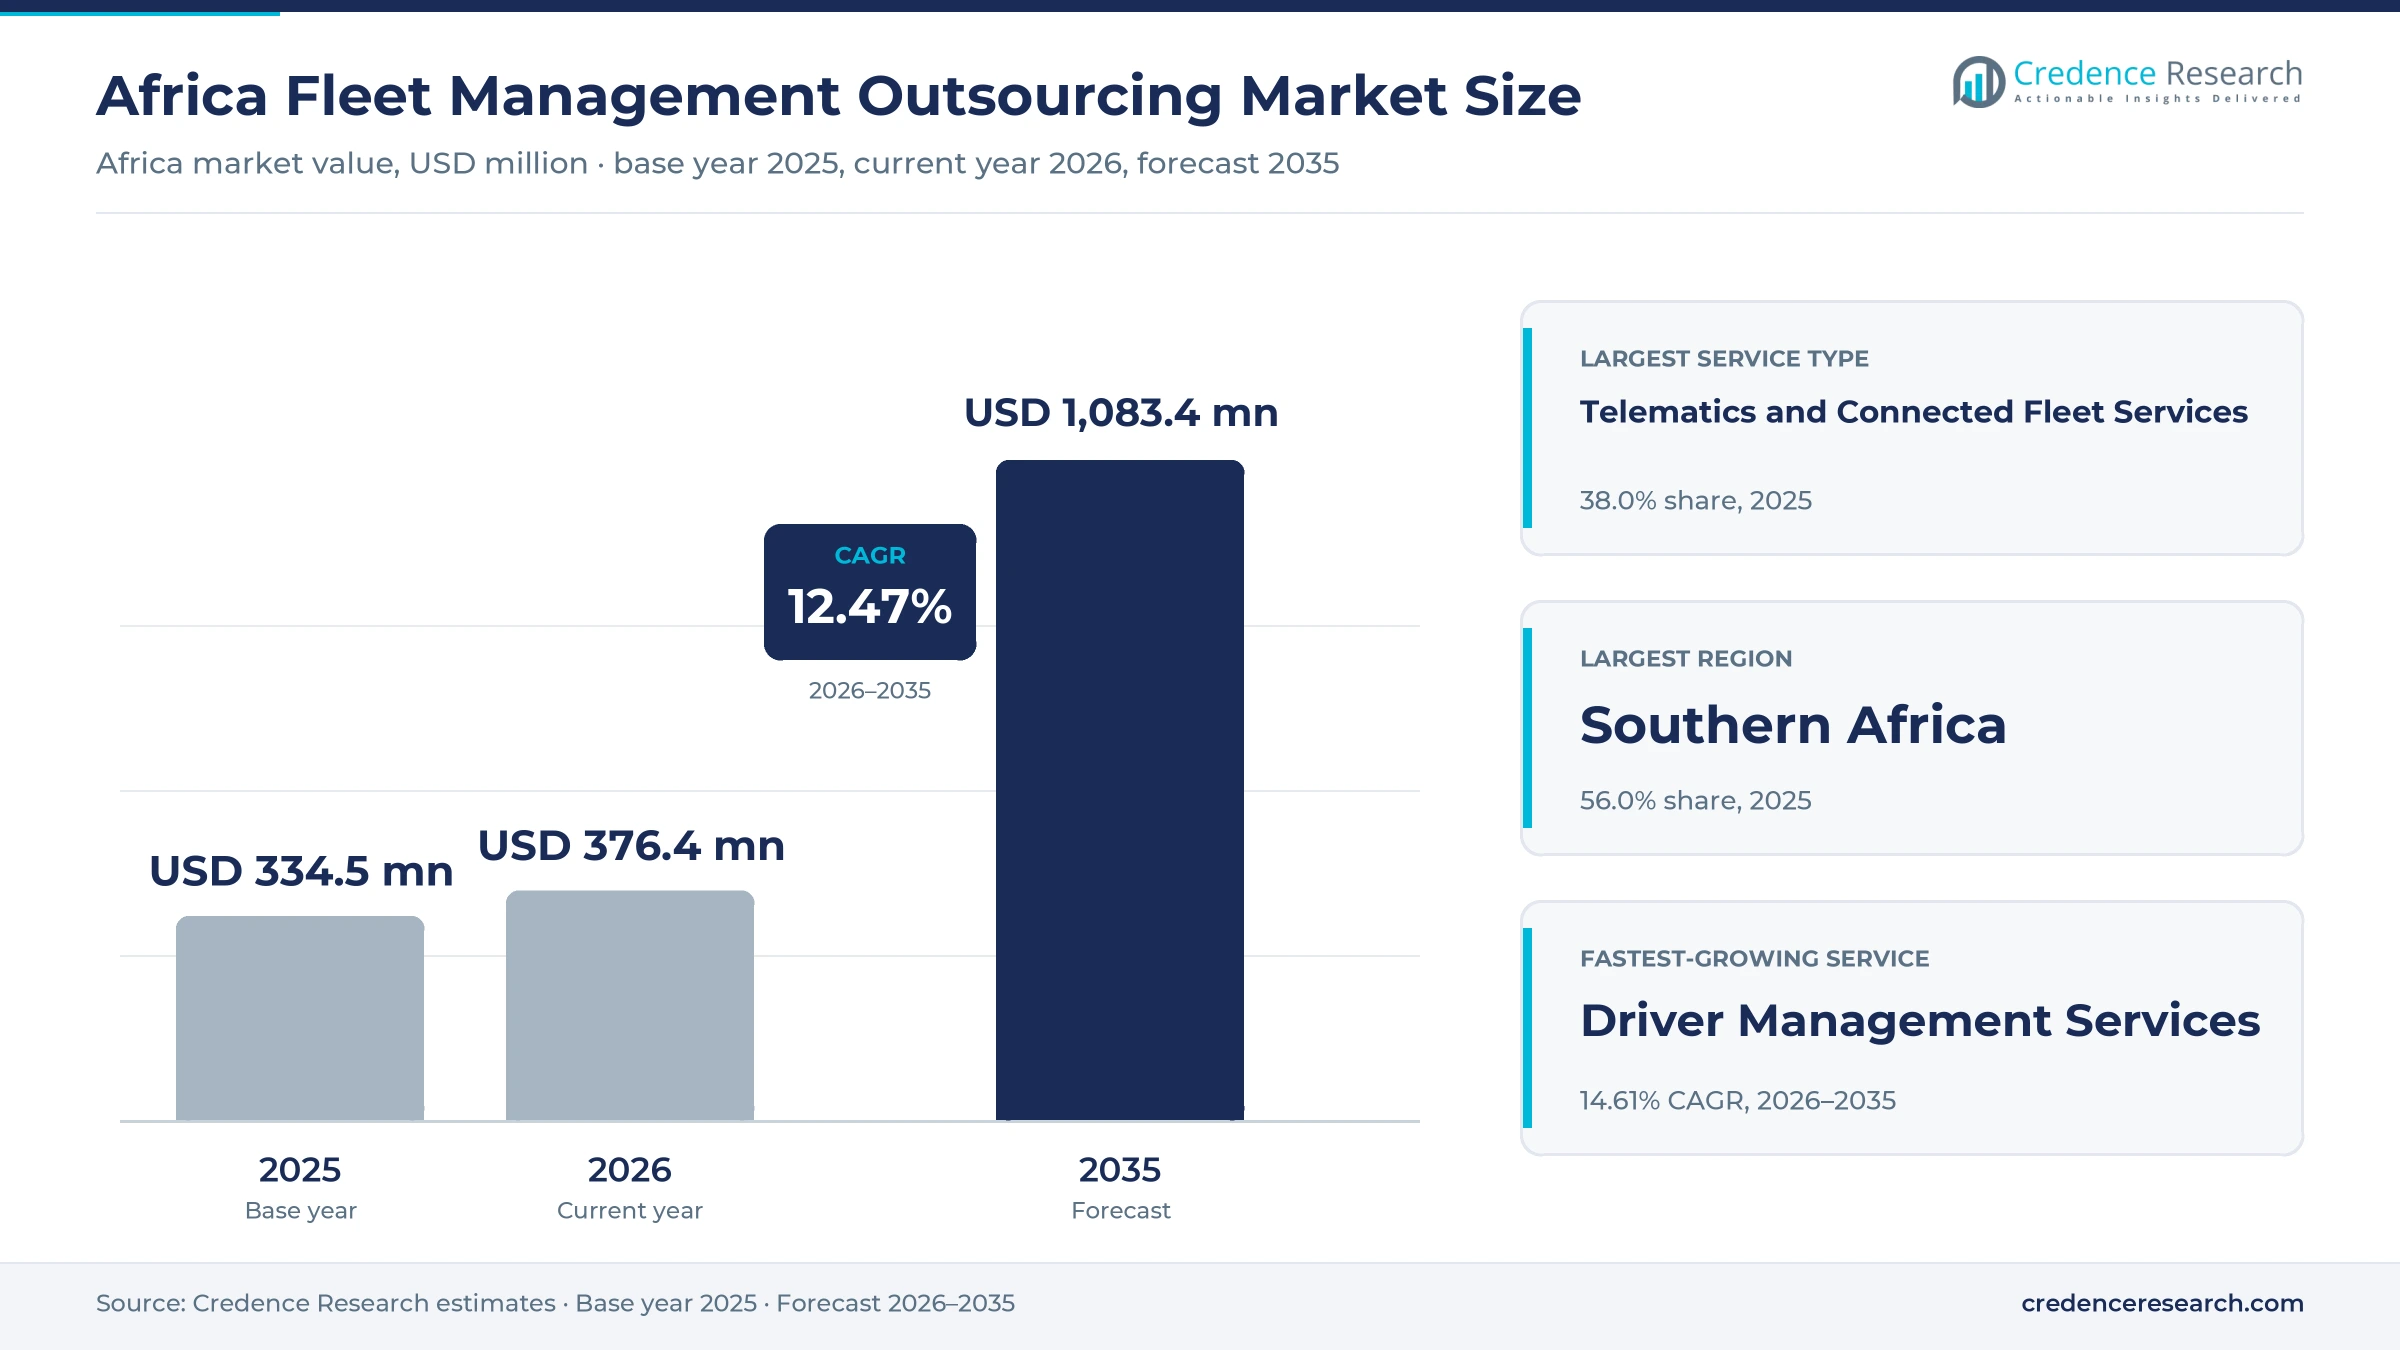
The Africa fleet management outsourcing market was valued at USD 334.5 million in 2025 and is projected to increase from USD 376.4 million in 2026 to USD 1.08 billion by 2035, registering a CAGR of 12.47% during 2026–2035. Demand comes from corporate, public and mining fleet owners that pay specialist providers to run tracking, maintenance, compliance and driver programs instead of staffing those functions in-house. Southern Africa held the largest regional share, 56.0% in 2025, because South Africa has the deepest bank-led leasing and telematics supply on the continent. Eastern Africa is the fastest-growing region at 14.13% a year, helped by Kenya's National Treasury leasing program and by mileage-based electric bus contracts in Nairobi. A major commercial change came on Feb. 9, 2026, when Powerfleet announced a South African government contract of at least five years. That award shows how public buyers are moving from scattered fleet administration toward single managed platforms with video and real-time visibility.
What do African fleet owners actually outsource to providers?
The market counts contracted fees paid to third parties for telematics, managed maintenance, lease management, fleet administration, compliance and driver programs on commercial and public vehicles. Buyers usually sign multi-year agreements priced per vehicle, by retainer, by transaction or against agreed service levels, and many contracts bundle several of these services under one account manager.
The count excludes vehicle purchase prices, capital finance repayments, fuel itself and consumer stolen-vehicle tracking, because those payments do not pay for managing a fleet. Value passes from device makers and network operators to platform owners, bureaus, banks and lessors, which then deliver reporting, workshop control and compliance work to the fleet owner.
Africa Fleet Management Outsourcing Market Insights
- The market rises from USD 334.5 million in 2025 to USD 1.08 billion by 2035, a 12.47% CAGR built on recurring contracts rather than one-off hardware sales.
- Southern Africa held 56.0% of 2025 value because South African banks, lessors and telematics firms offer the deepest supply of contracted services.
- Telematics and Connected Fleet Services led with 38.0% of 2025 value, as monitoring is usually the first task that a fleet owner hands over.
- Kenya's National Treasury issued a Phase VIII leasing tender on March 31, 2026 covering 550 electric vehicles, which brought electric fleets into structured public contracts.
- MTN Business South Africa began rebranding Powerfleet's platform in August 2025, adding a network operator as a sales route alongside banks, lessors and specialist bureaus.
Telematics and corporate fleets anchor contract value
Why telematics leads and driver programs grow fastest
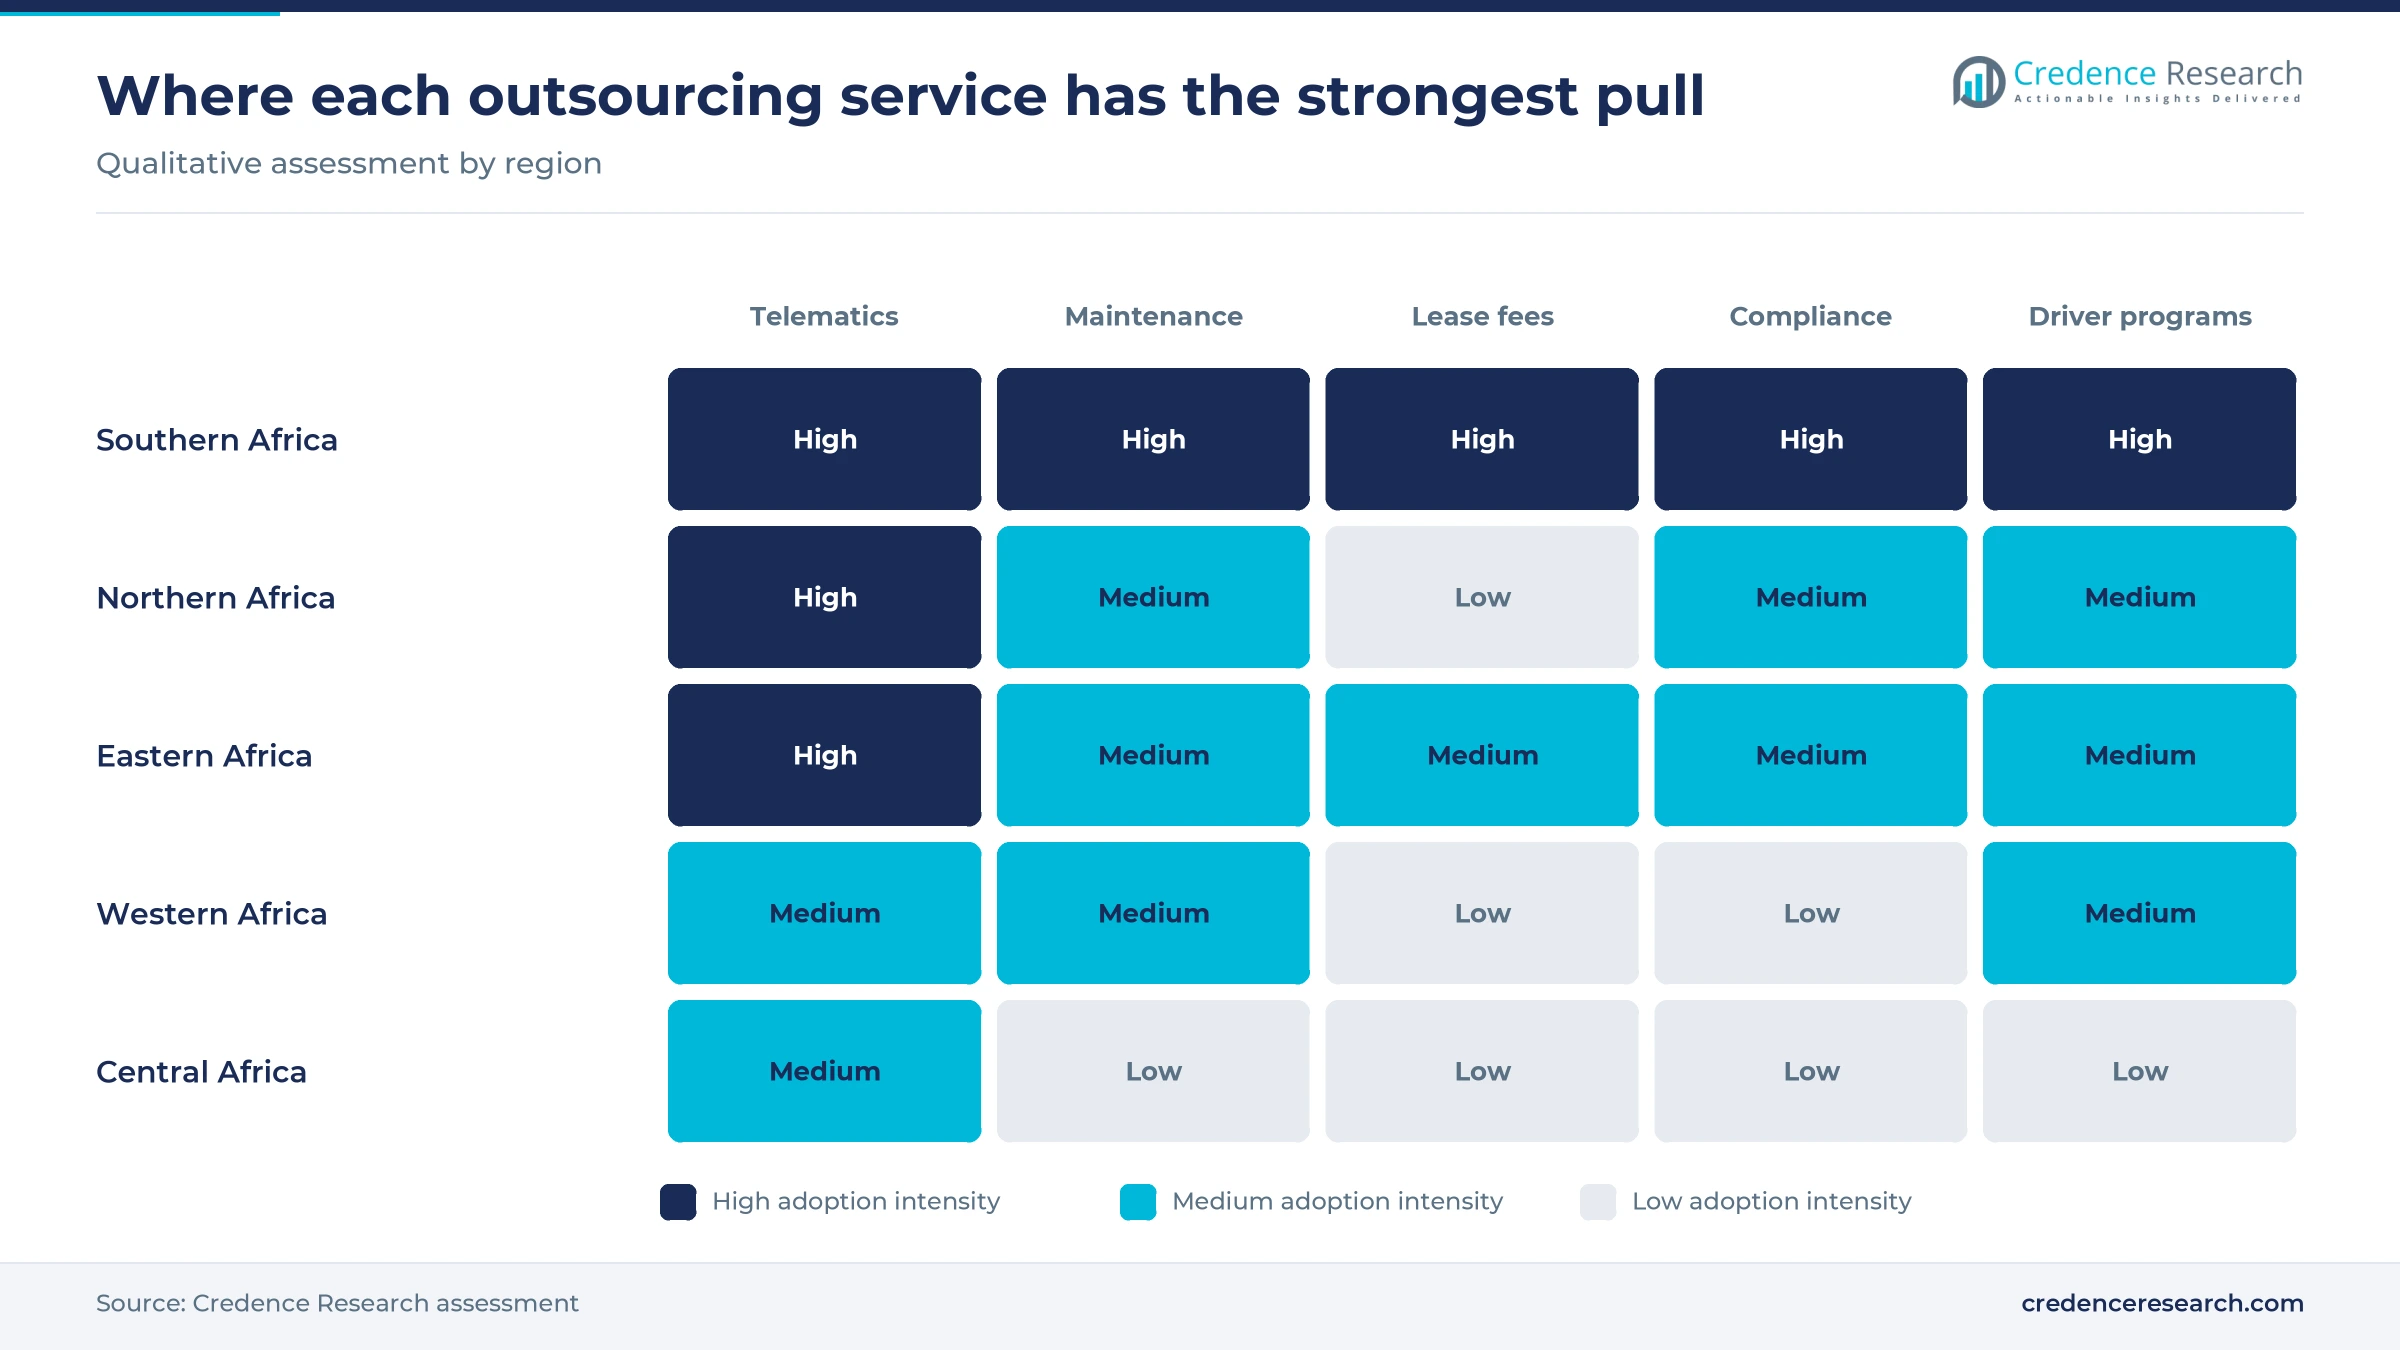
Based on service type, the market is categorized into telematics and connected fleet services, managed maintenance services, full maintenance lease management fees, fleet administration and compliance services, and driver management services. Telematics and Connected Fleet Services led with 38.0% of 2025 value because monitoring is the first task most owners hand over, and Netstar alone reported more than two million connected devices in April 2024. Driver Management Services grow fastest at 14.61% a year as Kenya's National Treasury, in a March 31, 2026 tracking tender, required driver grading and performance reports on speeding and idling.
Corporate accounts dominate while public fleets scale up
Based on customer type, the market is categorized into private corporate fleet owners, government fleet authorities, fleet leasing intermediaries and nonprofit fleet operators. Private Corporate Fleet Owners led with 64.0% of 2025 value because commercial accounts form the base of provider books, and Karooooo reported more than 125,000 commercial customers across over 20 countries in March 2026. Government Fleet Authorities grow fastest at 13.84% a year as Powerfleet's government award moves a very large public estate onto one platform. Nonprofit demand stays smaller, although the World Food Programme keeps almost 900 deployable vehicles at hubs including Accra and Kampala.
Road freight leads as mine sites buy safety services
Based on end-use industry, the market is categorized into transport and logistics, government and public services, mining and construction, retail and consumer goods, and corporate and nonprofit services. Transport and Logistics led with 36.0% of 2025 value because the Ctrack Transport and Freight Index put road's share of South African freight at 85.4% for the first 10 months of 2025. Mining and Construction grows fastest at 13.63% a year as the August 2025 Powerfleet and MTN partnership names mining among its targets. Site operators also buy off-highway vehicle telematics, and Cartrack sells AI driver monitoring for mine shift transport.
Direct bids lead as network and integrator routes widen
Based on sales channel, the market is categorized into direct enterprise sales, public procurement tenders, bank and leasing partnerships, and dealer and integrator partnerships. Direct Enterprise Sales led with 46.0% of 2025 value because large owners run their own bids, as dairy group Clover did before Standard Bank won its 738-vehicle contract in 2023. Dealer and Integrator Partnerships grow fastest at 14.08% a year as MTN began rebranding Powerfleet's Unity platform for business customers in August 2025. Wialon similarly reported more than 400 local African partners in June 2025, which extends supply beyond the large cities.
| Segment Group | Leading Sub-segment | Share, 2025 | Fastest-growing Sub-segment | CAGR, 2026–2035 |
|---|---|---|---|---|
| By Service Type | Telematics and Connected Fleet Services | 38.0% | Driver Management Services | 14.61% |
| By Customer Type | Private Corporate Fleet Owners | 64.0% | Government Fleet Authorities | 13.84% |
| By End-Use Industry | Transport and Logistics | 36.0% | Mining and Construction | 13.63% |
| By Sales Channel | Direct Enterprise Sales | 46.0% | Dealer and Integrator Partnerships | 14.08% |
Request a Free Sample
Fill in your details and we'll send you a free sample report.
- Sample data tables & charts
- Research methodology
Public contracts and monthly data fees lift demand
Recurring fleet digitization widens the subscriber base
Recurring fleet digitization lifts demand because owners now pay monthly for data they once collected by hand, which turns a single installation into a multi-year service. Cartrack surpassed two million active subscribers in South Africa in March 2026, and its parent Karooooo reported more than 2.65 million subscribers worldwide. Wialon, which sells through local integrators, reported 250,000 connected vehicles and assets in Africa in June 2025, with more than 20,000 fleet owners served. Wialon also said its platform handled over 300 million data points a day, which shows how much data these telematics systems now carry. As a result, Telematics and Connected Fleet Services held 38.0% of 2025 value, and monthly billing gives providers a steady base for adding services.
Structured public fleet procurement creates large contracts
Structured public fleet procurement matters because a single award can move tens of thousands of vehicles to a managed provider. Powerfleet said on Feb. 9, 2026 that its South African government contract covers more than 100,000 vehicles for a minimum of five years, with MTN supplying national connectivity. Kenya's National Treasury tendered 550 electric and 50 hybrid leased vehicles on March 31, 2026 under Phase VIII of its leasing program, including maintenance. A companion tracking tender runs for four years and requires bidders to have managed at least 2,000 vehicles. South Africa's RT46 contract, as described by The Mercury in September 2025, bundles fuel cards, tracking, maintenance and fine management. These specifications lift Government Fleet Authorities toward 13.84% annual growth.
Maintenance workflow outsourcing shifts workshop control
Maintenance workflow outsourcing grows because owners want workshop decisions and warranty claims handled by specialists who buy repairs in volume. Standard Bank describes its Clover contract as covering 738 vehicles, made up of 73 truck tractors, 81 trailers and 584 rigid trucks, with servicing through accredited vendors and an online platform showing expenses by vehicle. Clover had already outsourced its fleet for about 20 years before that 2023 tender, which shows how durable the model is. Standard Bank's managed maintenance product negotiates parts and labor prices and declines unnecessary work. Avis Fleet offers a fixed monthly lease in which it carries maintenance and resale risk. These offers show that workshop control is now sold as a defined service.
Cargo crime and diesel costs raise the value of control
Cargo crime and fuel inflation push carriers to buy monitoring because both losses can be reduced only with constant visibility. The Road Freight Association told its 2026 convention that South Africa sees an estimated 30 to 35 truck hijackings a week, with 420 recorded in the second quarter of 2025. It also said diesel rose more than 60% from the first to the second quarter of 2026 and makes up more than 40% of most operators' costs. Netstar opened a monitoring bureau in Midrand in April 2024 that watches geofenced hotspots around the clock. Because these costs land directly on margins, Transport and Logistics buyers hold 36.0% of 2025 value.
Video monitoring and electric leases reshape contracts
Video intelligence is rising into standard fleet contracts
Video is shifting from an optional add-on to a core contract item, because buyers want evidence about driver behavior as well as vehicle position. Powerfleet's February 2026 government award specifically names integrated video intelligence with real-time fleet visibility across more than 100,000 vehicles. Netstar describes live monitoring through in-vehicle AI cameras at its 52-seat Midrand bureau, which it launched in April 2024. Cartrack now markets AI fatigue and distraction detection, with road-facing and in-cab footage, for mine shift transport and contractor fleets. MTN's August 2025 agreement also lists AI video analytics for safety and risk detection among the Powerfleet services it will sell. This shift supports Driver Management Services, the fastest group at 14.61% a year, since footage gives managers material for coaching.
Traffic compliance is emerging as a billable fleet service
Compliance is emerging as a paid service because South Africa's traffic adjudication law places more responsibility on the people who run vehicles. The Department of Transport said in November 2025 that national AARTO rollout would move from Dec. 1, 2025 to July 1, 2026, and BusinessTech reported in May 2026 that the second phase would cover 62 municipalities. A third phase of 151 municipalities was expected late in 2026, with demerit notices not planned before April 2027. Under the department's description, operators and juristic persons answer for a vehicle's use. The Road Freight Association opposed that structure at its 2026 convention, which shows the commercial stakes. Fine handling and driver records therefore give integrators and bureaus an administration package to sell.
Opportunity in managed electric fleet contracts
Electric vehicles offer an opening because owners lack workshop skills and charging experience, so they want one provider to carry that risk. Kenya's March 2026 tender seeks 335 electric double-cab pickups among its 550 electric units, with related maintenance services. BasiGo's Pay-As-You-Drive model, described by CleanTechnica in 2025, charges bus operators a mileage fee that covers charging and maintenance from the provider. Electrive reported on June 26, 2026 that BasiGo's Rwandan fleet reached 52 buses and that CATL named it an authorized service partner for Sub-Saharan Africa. Ethiopia also extended its combustion vehicle import ban to knocked-down kits in June 2025, according to CleanTechnica. Providers that price per kilometer can therefore offer a contract form that diesel fleets rarely use.
Opportunity in humanitarian and donor-funded fleets
Humanitarian fleets are an opening because large agencies already accept central leasing and now seek better software across African hubs. The World Food Programme issued an expression of interest for a fleet management system on July 18, 2025, and it keeps almost 900 deployable vehicles at hubs in Accra, Dubai and Kampala. WFP and UNHCR began UN Fleet in October 2022 as a leasing service, and the UN System collectively runs more than 30,000 light vehicles. That service replaces vehicles after a 60-month cycle, which creates predictable workshop and disposal tasks. Private Corporate Fleet Owners remain the larger account group, yet the Kampala and Accra hubs give local bureaus a possible route into donor-funded fleet work across the continent.
Contract failures and diesel costs test provider value
Public contract failures damage trust in outsourcing
Service failures on public contracts make buyers wary, because downtime is visible to the public. The Mercury reported on Sept. 8, 2025 that only 240 of 480 KwaZulu-Natal ambulances were operational, and provincial legislators blamed the RT46 contract process for delays. The same report said 1,473 South African police vehicles needed repairs at that time. Provinces, patients and providers all carry the resulting reputational cost. As a result, new tenders are likely to demand turnaround targets, published fleet availability and penalties that bidders must price into their offers.
Platform exits leave drivers and fleets exposed
Provider and platform exits can strand contracts, since many newer services depend on one anchor client. Moove announced on Oct. 8, 2026 that it would end its Nigerian operations and transfer about N35 billion of vehicles to customers, about a month after Uber left the country, according to Arise News. Customers kept their cars, yet they lost a financing partner. Buyers in West Africa should therefore ask for exit clauses, data portability and evidence that a provider can survive losing its largest customer.
Freight weakness squeezes what carriers can pay
Weak freight volumes limit spending, because carriers cut service budgets first when loads fall. The Ctrack Transport and Freight Index showed road freight down 4.5% in 2025, and it linked margin pressure to an oversupply of heavy trucks after rapid growth in 2021 and 2022. Smaller hauliers are most exposed, particularly as they also absorb diesel inflation. Consequently, providers are likely to face requests for shorter terms and lower monthly fees, and performance-linked pricing and modular packages offer one possible answer.
Low price points and fragmented supply cap margins
Thin pricing outside South Africa limits service depth, because low subscriptions cannot fund field teams. Vodafone Egypt's ETIT lists plans of EGP 135 to EGP 200 a month per vehicle, excluding tax, while Procompare shows South African fleet packages from about R250 to R1,500. Wialon's more than 400 local partners also show how dispersed supply is. Entrants struggle to fund workshops at those prices, so multinational buyers can receive uneven service across countries. Common service standards across regional partners offer the most practical answer to that gap.
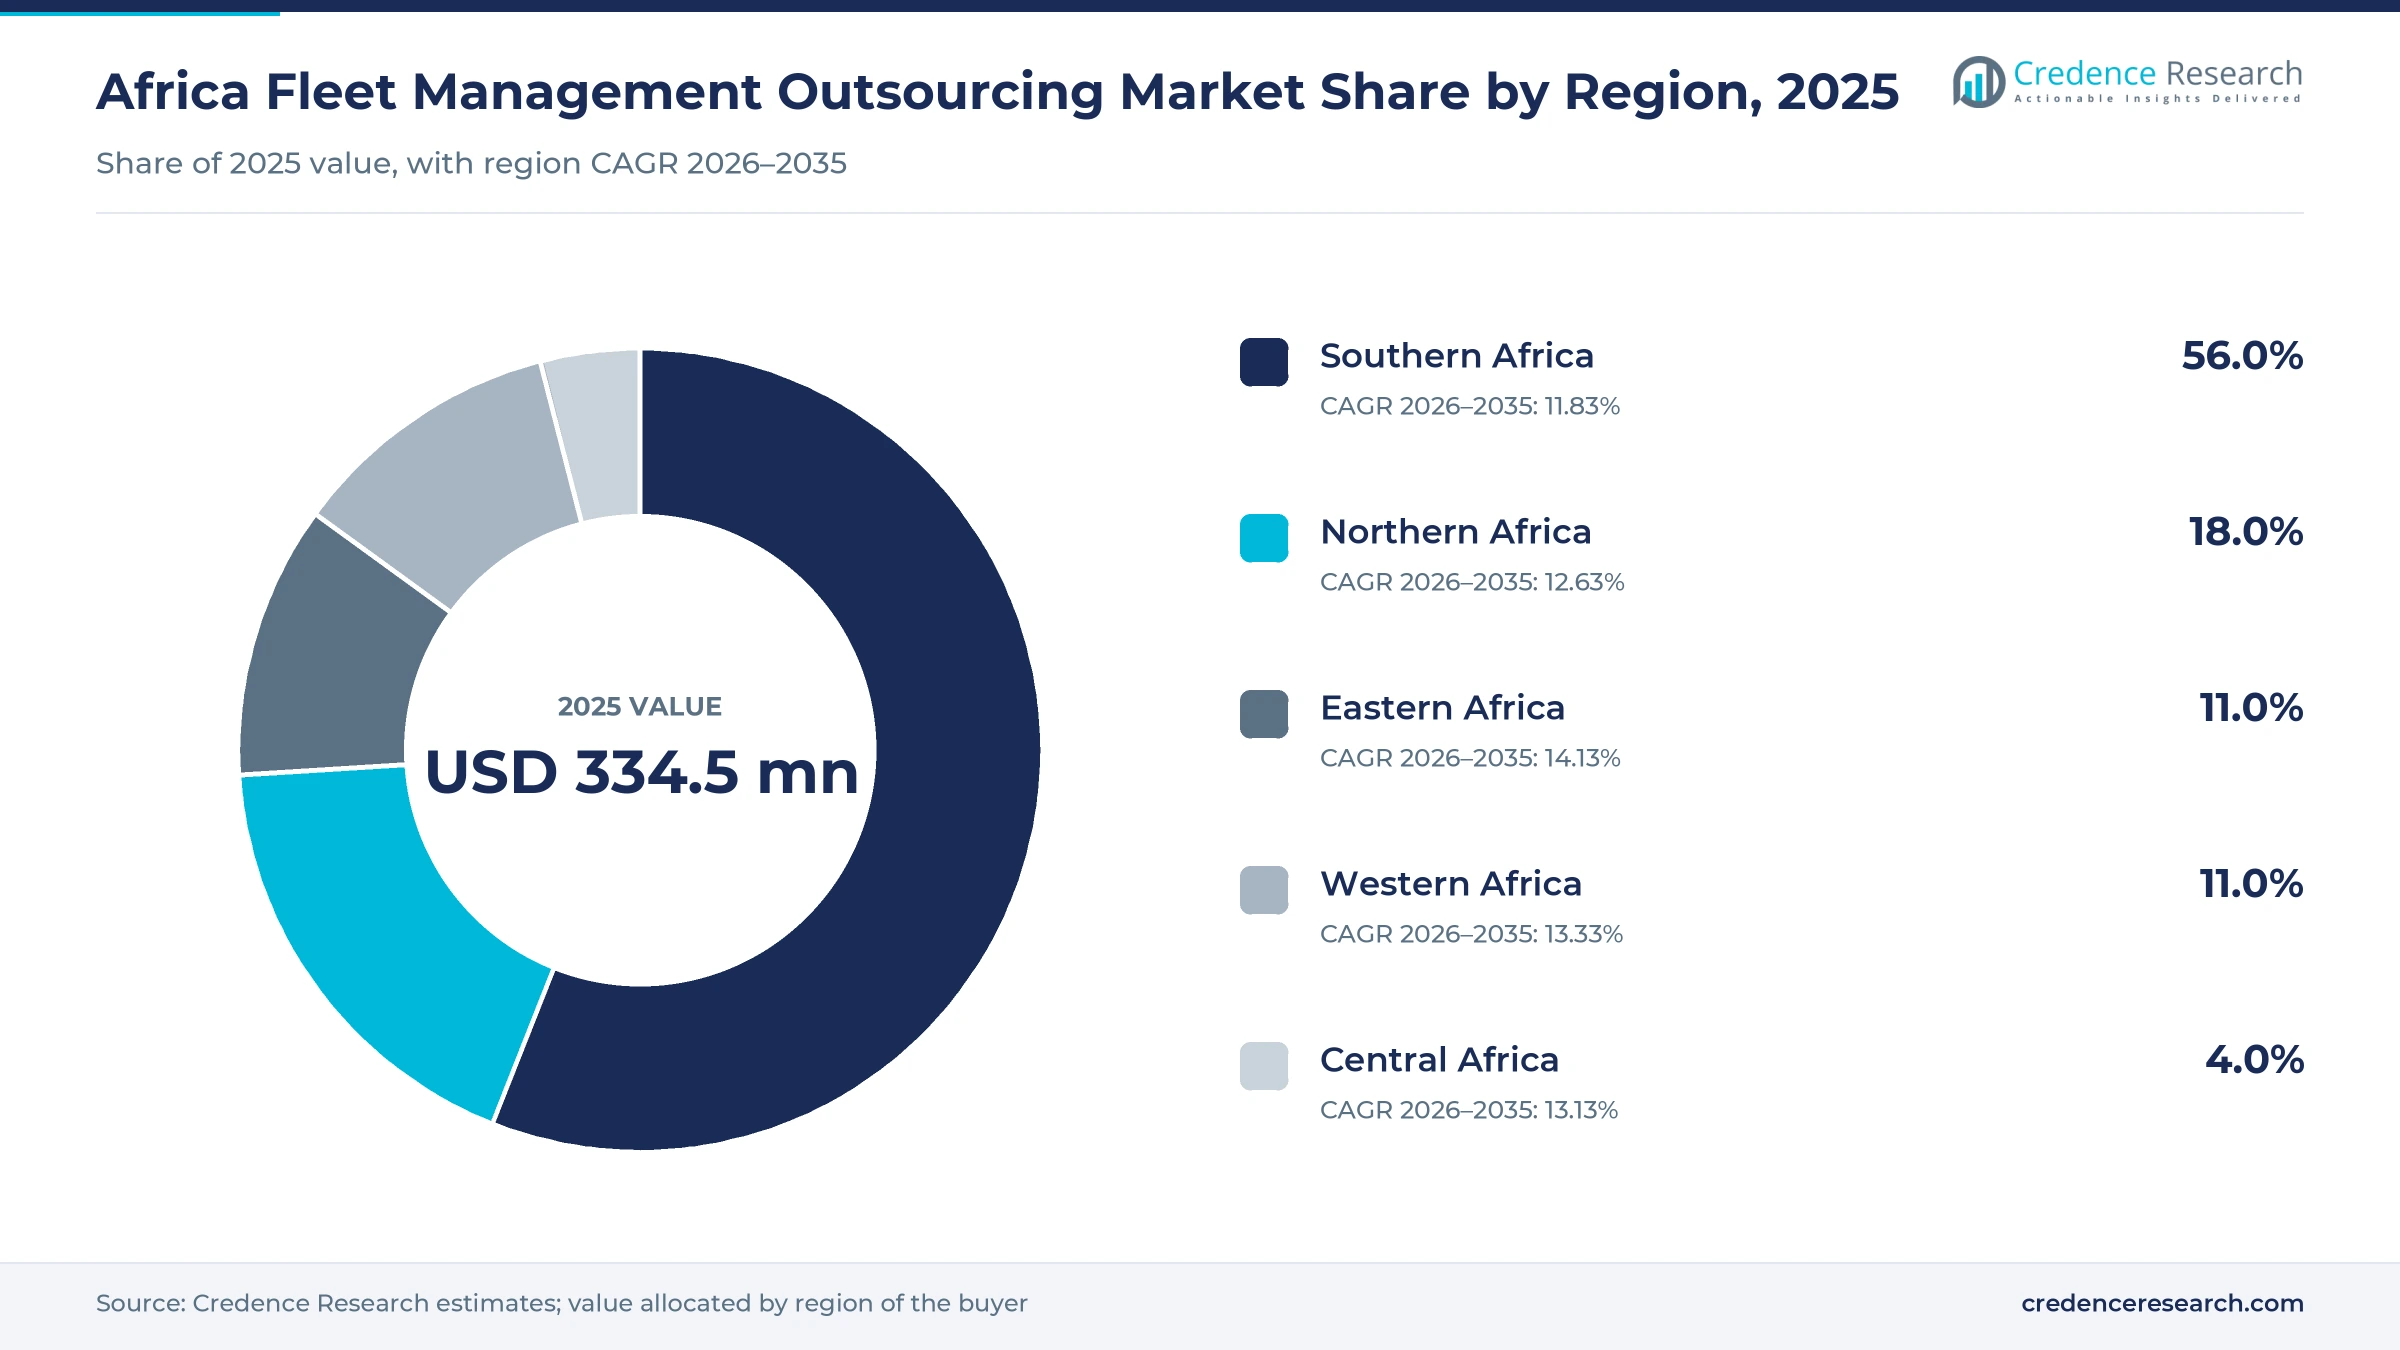
Southern Africa leads while Eastern Africa grows fastest
| Region | Value, 2025 (USD million) | Share, 2025 | CAGR, 2026–2035 |
|---|---|---|---|
| Southern Africa | 187.3 | 56.0% | 11.83% |
| Northern Africa | 60.2 | 18.0% | 12.63% |
| Eastern Africa | 36.8 | 11.0% | 14.13% |
| Western Africa | 36.8 | 11.0% | 13.33% |
| Central Africa | 13.4 | 4.0% | 13.13% |
Southern Africa leads on bank and telematics depth
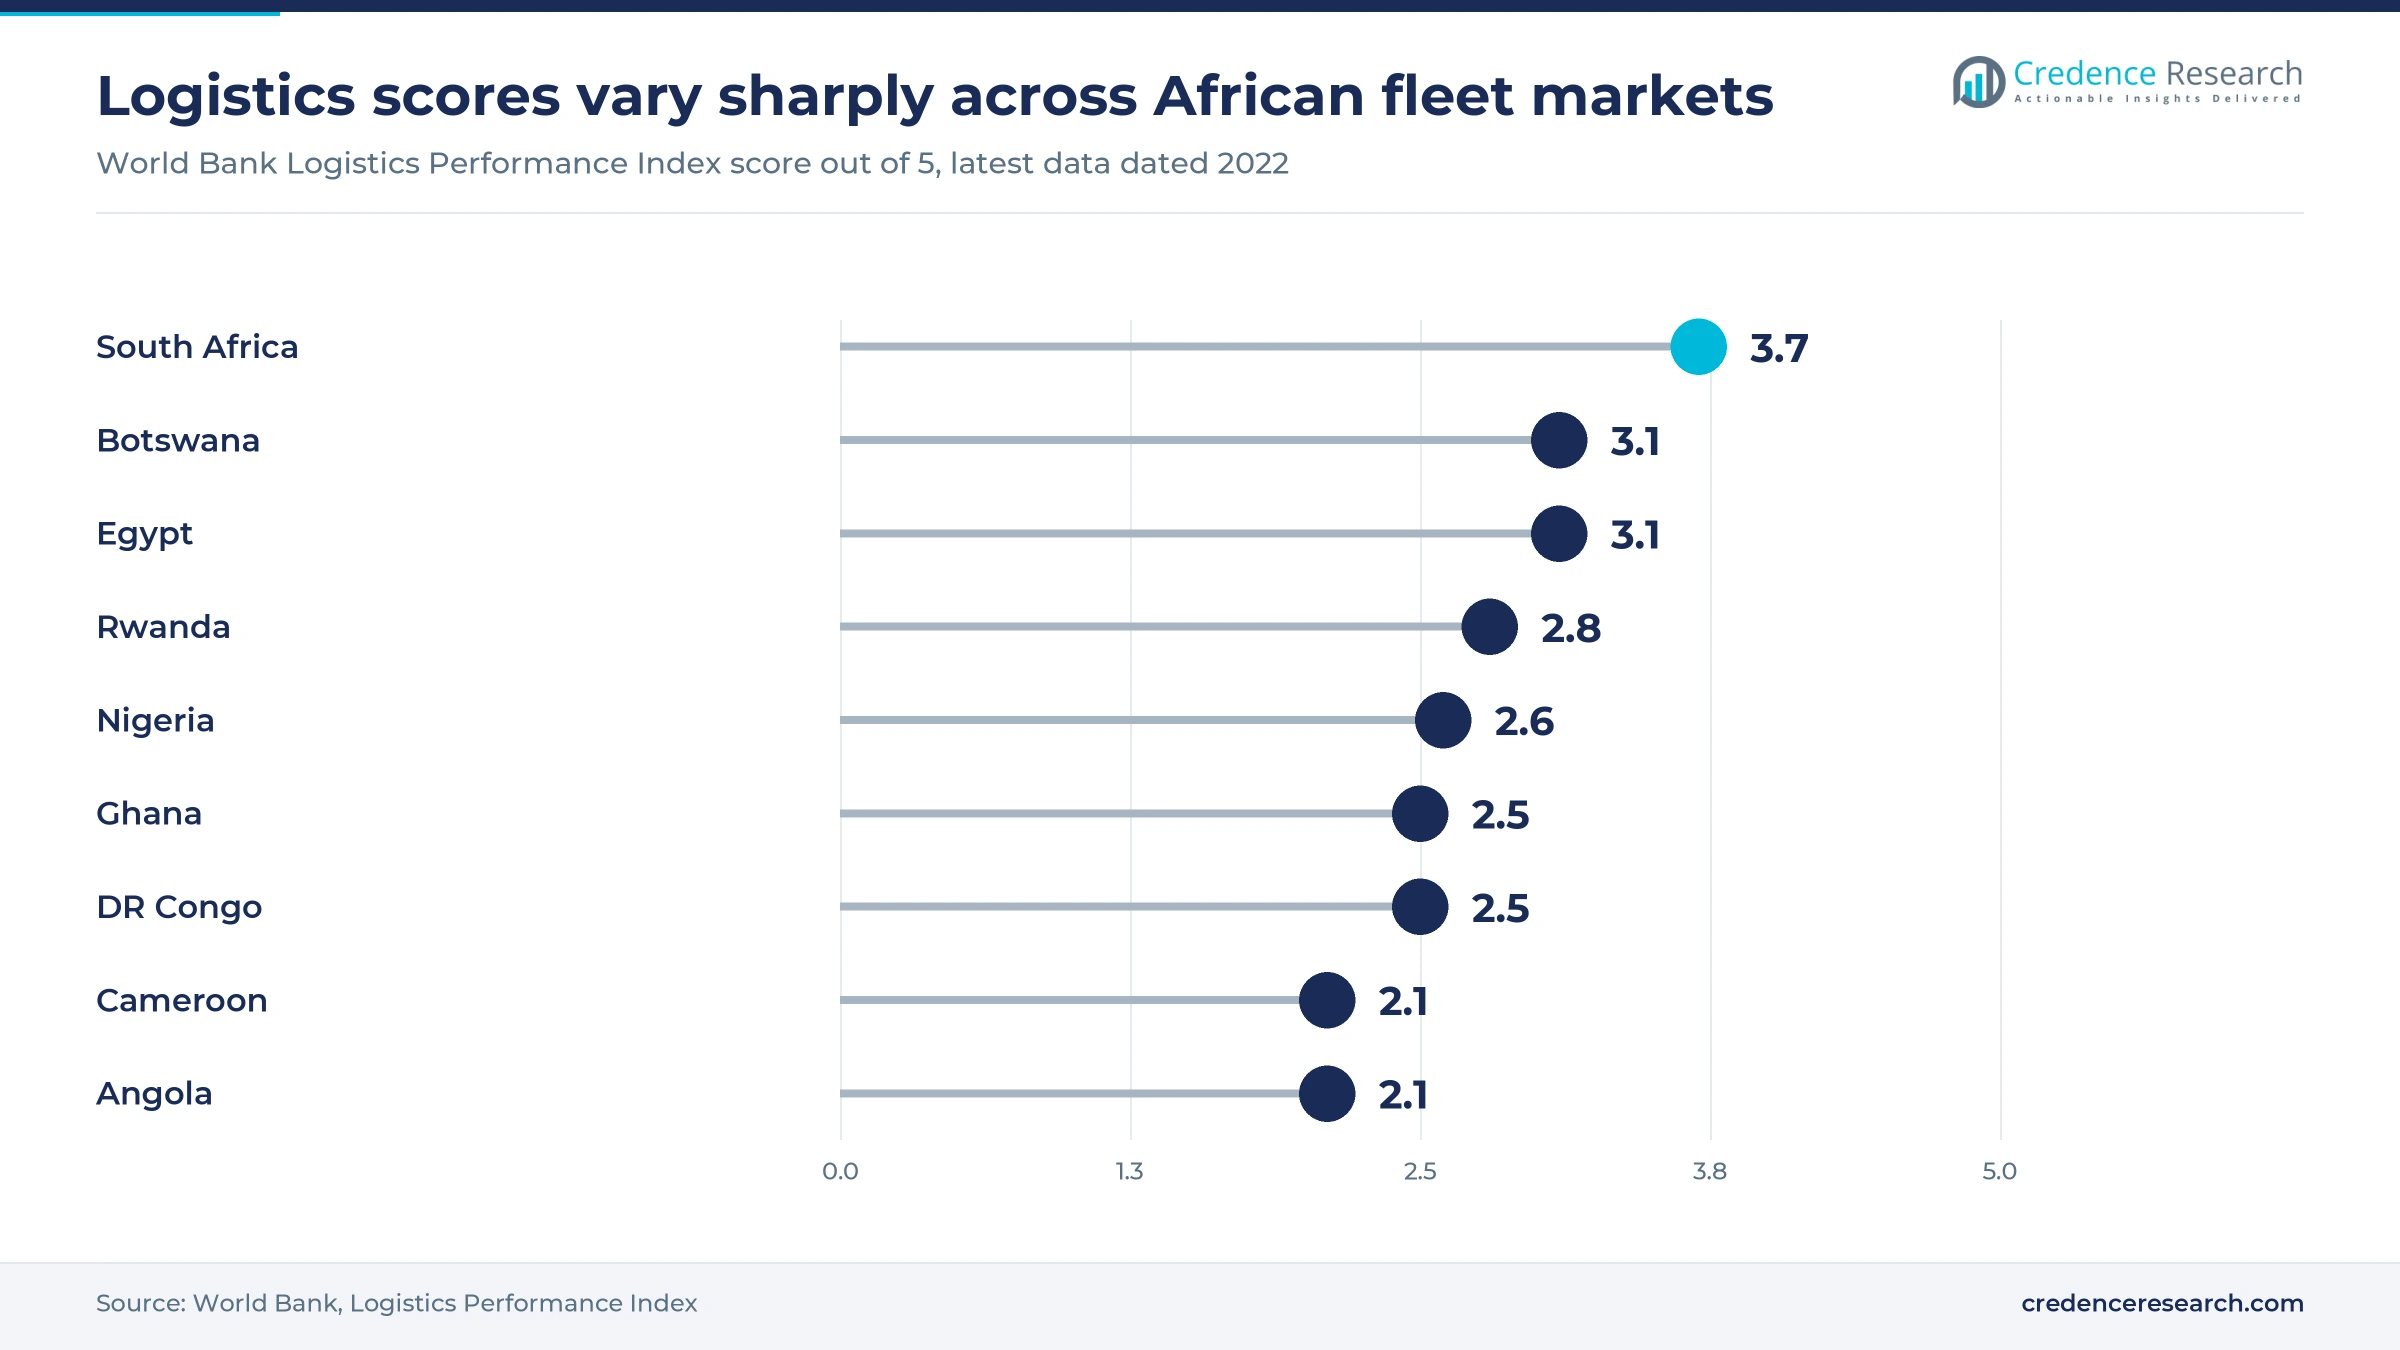
Southern Africa held 56.0% of 2025 value and grows at 11.83% a year because South Africa hosts Cartrack, Netstar, Ctrack, Eqstra and bank lessors within one market. South Africa also posts the continent's strongest logistics score, 3.7 of 5, in World Bank Logistics Performance Index data, and Botswana reaches 3.1. Avis Fleet extends the model north, having operated in Zambia since 2015 with lease, maintenance and telematics products. Growth is slower than elsewhere because penetration is already higher among large South African fleets.
Northern Africa buys low-priced connected services
Northern Africa held 18.0% of 2025 value and grows at 12.63% a year, with demand centered on Egypt, Morocco and Algeria. Egypt scores 3.1 on the World Bank logistics index, and Vodafone Egypt's ETIT sells truck plans from EGP 170 a month with driver ID and fridge temperature sensors. Egypt's e-commerce logistics carriers can therefore buy tracking at low entry prices. Wialon's September 2025 ranking placed Algeria's VIVACOM first in Africa and Morocco's Détroit Hi-Tech sixth, which shows integrator-led supply.
Eastern Africa grows on leasing and electric contracts
Eastern Africa held 11.0% of 2025 value and is the fastest region at 14.13% a year because Kenya's government has run a vehicle leasing program since 2010. Kenya's tender for 1,652 leased vehicles in February 2023, reported by Kenyans.co.ke, preceded the Phase VIII round. BasiGo counted 76 electric buses in Kenya in late 2025 under mileage-based contracts, while Rwanda scored 2.8 on the World Bank logistics index. The World Food Programme's Kampala hub and Tanzanian integrators such as Kago Africa add further demand for managed services.
Western Africa balances fuel reform and operator risk
Western Africa held 11.0% of 2025 value and grows at 13.33% a year, led by Nigeria, Ghana and Cote d'Ivoire. Nigerian cold chain and agro logistics carriers face higher fuel costs after petrol subsidies ended on May 29, 2023. The Presidential CNG Initiative targets about 250,000 conversions a year from 2025, according to TheCable, which creates conversion and maintenance work for managed fleets. Nigeria scored 2.6 and Ghana 2.5 on the World Bank logistics index in 2022.
Central Africa depends on mining corridor investment
Central Africa held 4.0% of 2025 value and grows at 13.13% a year from the smallest base, as weak logistics limit contract scale. The Democratic Republic of the Congo scores 2.5 and Cameroon 2.1 on the World Bank logistics index. Creamer Media reported in June 2025 that Africa Finance Corporation expected USD 320 million from Italy for the Lobito corridor linking the copper belt with Angola. Wialon's 2025 ranking included Cameroon's CAMTRACK and the Congo's USCT, which shows that local integrators are already connecting fleets in both countries.
Government awards and channel deals define 2025 and 2026
| Development | Status and market relevance |
|---|---|
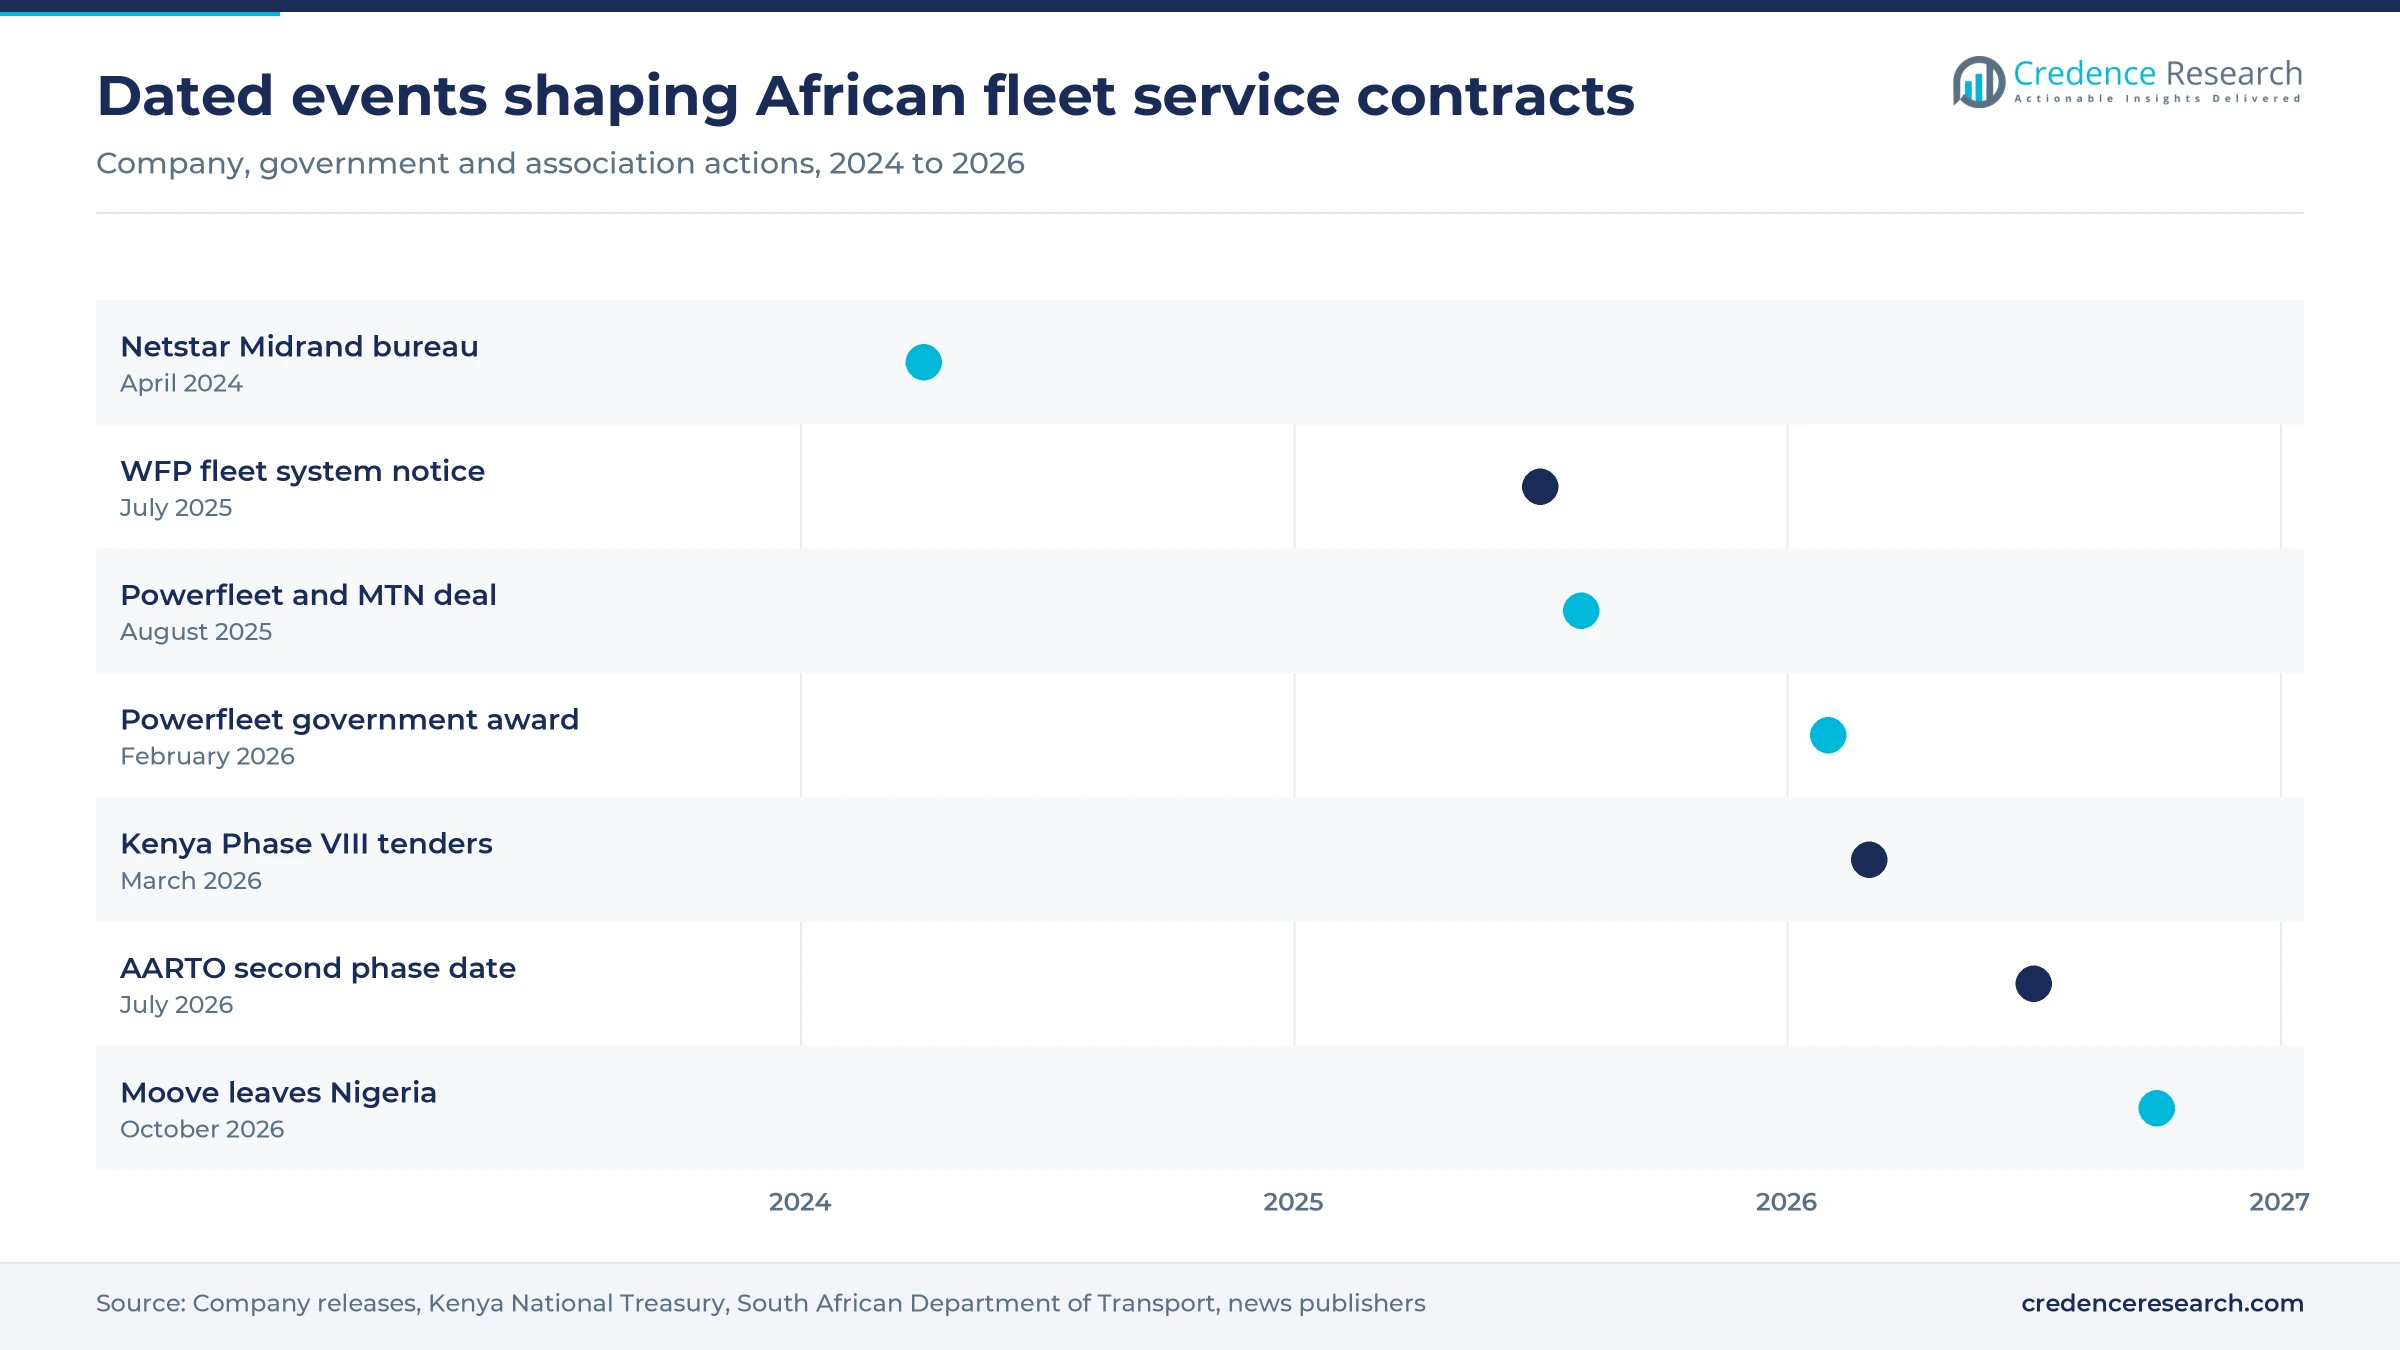
| In April 2024, Netstar opened a 52-seat real-time vehicle telematics bureau in Midrand that runs around the clock. | Operating, and it shows that bureau services are becoming a distinct contract line. |
| In August 2025, Powerfleet and MTN Business South Africa agreed that MTN would rebrand and sell the Unity platform to business customers. | In market, adding a network operator to the sales routes for fleet services. |
| In February 2026, Powerfleet announced a South African government fleet contract covering more than 100,000 vehicles for at least five years. | Phased deployment was expected to begin in mid-2026, making it a large public reference for other buyers. |
| In March 2026, Kenya's National Treasury issued Phase VIII tenders for leased electric and hybrid vehicles and a fleet tracking system. | Tender closed in April 2026, and it sets a specification model for other public buyers. |
| In October 2026, Moove announced the end of its Nigerian operations and the transfer of about N35 billion of vehicles to customers. | Transfers took effect Oct. 1, 2026, and the exit raises provider continuity questions in West Africa. |
Video, bureaus and connected upkeep change the service
- AI video telematics uses road-facing and in-cab cameras to flag fatigue, distraction and phone use, as Cartrack's mining product and Netstar's managed fleets show.
- Managed bureaus watch vehicles for clients in real time, and Ctrack and Netstar both sell this outsourced monitoring to fleets that have no control room.
- Connected maintenance scheduling triggers work orders by odometer, date or engine hours, a function that Kenya's March 2026 tracking tender lists in its requirements.
- Dual GSM and satellite tracking keeps vehicles visible outside mobile coverage, which is why Kenya's tender specifies both links for its national fleet system.
Need a Custom Version of This Report?
Tailor the scope, geography, or segments to your exact requirements.
- Custom geography or segment scope
- Direct access to our analyst team
Telematics firms and bank lessors share the customer
Competition in fleet management outsourcing splits into telematics specialists and financial lessors, and each group is moving onto the other's ground. Cartrack, MiX by Powerfleet, Netstar, Tracker Connect and Ctrack sell data, video and bureau services, usually under per-vehicle subscriptions, while BidTrack serves smaller owners from Durban. Standard Bank Fleet Management, WesBank Fleet Solutions, Avis Fleet and Eqstra Fleet Management compete on leases, workshop control and buying power. Eqstra had about 120,000 fleet products under management when Engineering News reported Bidvest's purchase in July 2019. WesBank ran an electric fleet event with FNB in July 2025, showing how lessors are preparing owners for new powertrains. Powerfleet's tie-up with MTN and Standard Bank's analytics at Clover show the two groups converging. Buyers therefore compare service records, geographic reach and contract flexibility, and large tenders increasingly reward bidders that combine connectivity, software and field support.
Companies profiled and their roles in this market
| Company | Type | Role in the market |
|---|---|---|
| Cartrack | Telematics provider | Subscription fleet platform with more than two million South African subscribers in March 2026 |
| MiX by Powerfleet | Telematics provider | Video and fleet visibility provider for a large South African government contract |
| Netstar | Telematics and bureau provider | Runs a 52-seat monitoring bureau in Midrand for managed fleets |
| Ctrack | Telematics and bureau provider | Offers driver management, video and outsourced bureau services in South Africa and other African countries |
| Tracker Connect | Telematics provider | Provides tracking, driver behavior and fuel reporting to corporate fleets in South Africa |
| Avis Fleet | Lessor and fleet manager | Sells full maintenance leases and managed maintenance, including in Zambia since 2015 |
| Eqstra Fleet Management | Lessor and fleet manager | Bidvest-owned provider of leasing, servicing, tracking and insurance |
| WesBank Fleet Solutions | Bank lessor | Vehicle financier with fleet management and leasing arm, active in electric fleet preparation |
| Standard Bank Fleet Management | Bank lessor | Provides full maintenance rental for Clover and managed maintenance to fleet owners |
| BidTrack | Telematics provider | Durban-based tracking and fleet management supplier for business and personal vehicles |
Service proof matters more than vehicle count
Credence Research's view is that public contract performance will decide how fast fleet management outsourcing widens beyond its South African base. Powerfleet's large government award and Kenya's Phase VIII tenders create reference accounts, yet KwaZulu-Natal's ambulance shortage shows how blame for a shortage can fall on a contract. Providers that publish availability and repair turnaround data should win the next tender round. The most assumption-heavy estimate is the regional split, because few African states publish commercial fleet counts. Buyers should therefore test any provider on service records in their own country, not on total connected devices.
How Credence Research built this regional estimate
The report uses 2025 as the base year and 2026 to 2035 as the forecast period. Market values come from the Credence Research model, and regional, segment and channel splits are Credence Research estimates informed by public data. Sources include World Bank statistics, national treasury tender documents, company releases, trade association statements and regional news publishers. No interviews or surveys were used to prepare this edition of the report. Contract scope follows third-party service fees, and vehicle capital is excluded, as described in the market definition above.
Public programs broaden the contract base to 2035
Credence Research expects the market to reach USD 1.08 billion by 2035 as public programs, electric leases and compliance work add to the subscription base. Eastern Africa should keep the fastest pace, while Southern Africa remains the largest source of contract value through the period. The fleet management outsourcing service mix will move from basic tracking toward video, driver records and managed upkeep, and that shift favors providers with field staff. Demand should keep drawing on fuel costs and security risk, after South African diesel rose more than 60% between the first two quarters of 2026. Provider exits and public contract disputes remain the main risks to this outlook.
Frequently Asked Questions
How big is the Africa fleet management outsourcing market?
Which region leads African fleet outsourcing?
Which region is growing fastest?
Which service type holds the largest share?
Why are public fleet contracts important here?
What is holding the market back?
How do companies charge for these services?
Who are the main companies in this market?
Table of Content
Chapter 1 Market Segmentation
- 1.1 Segmentation Framework
- 1.1.1 Product and Service Classification
- 1.1.2 Application and End-Use Classification
- 1.1.3 Technology and Solution Classification
- 1.1.4 Customer and Distribution Channel Classification
- 1.1.5 Geographic Segmentation
- 1.1.6 Market Segment Definitions and Boundaries
- 1.2 By Service Type
- 1.2.1 Telematics and Connected Fleet Services
- 1.2.2 Managed Maintenance Services
- 1.2.3 Full Maintenance Lease Management Fees
- 1.2.4 Fleet Administration and Compliance Services
- 1.2.5 Driver Management Services
- 1.3 By Customer Type
- 1.3.1 Private Corporate Fleet Owners
- 1.3.2 Government Fleet Authorities
- 1.3.3 Fleet Leasing Intermediaries
- 1.3.4 Nonprofit Fleet Operators
- 1.4 By End-Use Industry
- 1.4.1 Transport and Logistics
- 1.4.2 Government and Public Services
- 1.4.3 Mining and Construction
- 1.4.4 Retail and Consumer Goods
- 1.4.5 Corporate and Nonprofit Services
- 1.5 By Sales Channel
- 1.5.1 Direct Enterprise Sales
- 1.5.2 Public Procurement Tenders
- 1.5.3 Bank and Leasing Partnerships
- 1.5.4 Dealer and Integrator Partnerships
Chapter 2 Introduction
- 2.1 Report Objectives and Scope
- 2.2 Product Definition and Industry Terminology
- 2.3 Market Inclusions and Exclusions
- 2.4 Research Process
- 2.4.1 Primary Research and Expert Interviews
- 2.4.2 Secondary Research and Source Review
- 2.4.3 Top-Down and Bottom-Up Estimation
- 2.4.4 Data Triangulation and Verification
- 2.5 Market Size Measurement Basis
- 2.5.1 2025: USD 334.5 million → 2035: USD 1.08 billion
- 2.6 Historical and Forecast Reference Periods
- 2.6.1 Historical Period: 2018-2025
- 2.6.2 Base Year: 2025
- 2.6.3 Forecast Period: 2025-2035
- 2.7 Research Assumptions and Limitations
Chapter 3 Executive Summary
- 3.1 Market Snapshot and Key Findings
- 3.2 Base-Year Market Size, 2025
- 3.3 Forecast Market Size, 2035
- 3.4 Revenue and Volume Growth Outlook
- 3.5 Key Demand and Supply Indicators
- 3.6 Leading Market Segments
- 3.7 Fastest-Growing Market Opportunities
- 3.8 Regional Performance Highlights
- 3.9 Technology and Industry Transformation
- 3.10 Competitive Landscape Summary
- 3.11 Analyst View and Strategic Implications
Chapter 4 Africa Fleet Management Outsourcing Market Trends and Developments
- 4.1 Historical Industry Development, 2018-2025
- 4.2 Recent Market Trends and Developments
- 4.3 Demand and Customer Behavior Trends
- 4.4 Technology and Product Innovation
- 4.5 Artificial Intelligence, Automation and Digitalization
- 4.6 Local Manufacturing and Supply Chain Realignment
- 4.7 Industry Partnerships, Mergers and Acquisitions
- 4.8 Sustainability and Circular Economy Developments
- 4.9 Government and Private Sector Investment Trends
- 4.10 Emerging Business Models and Commercialization
- 4.11 Industry Developments and Announcements
Chapter 5 Africa Fleet Management Outsourcing Market Supply and Demand Analysis
- 5.1 Demand Trend and Consumption Analysis, 2018-2025
- 5.2 Demand Forecast, 2025-2035
- 5.3 Supply Chain Structure and Procurement Trends
- 5.4 Supply-Demand Gap and Bottlenecks
- 5.5 Import Dependence and Sourcing Structure
- 5.6 Regional Supply and Demand Concentration
Chapter 6 Africa Fleet Management Outsourcing Market Pricing Analysis
- 6.1 Pricing Structure and Measurement
- 6.2 Historical Pricing Trends, 2018-2025
- 6.3 Pricing Outlook, 2025-2035
- 6.4 Pricing by Product and Market Segment
- 6.5 Geographic Pricing Differences
- 6.6 Key Input, Energy, Labor and Logistics Costs
- 6.7 Contract Pricing and Purchasing Models
- 6.8 Pricing Sensitivity and Competitive Positioning
- 6.9 Price, Margin and Profitability Implications
Chapter 7 Africa Fleet Management Outsourcing Market Dynamics
- 7.1 Market Growth Drivers
- 7.1.1 Demand-Side Drivers
- 7.1.2 Technology and Innovation Drivers
- 7.1.3 Infrastructure and Investment Drivers
- 7.1.4 Regulatory and Policy Drivers
- 7.2 Market Restraints
- 7.2.1 Cost and Affordability Constraints
- 7.2.2 Technology and Adoption Barriers
- 7.2.3 Supply Chain and Operational Constraints
- 7.3 Market Challenges
- 7.3.1 Competitive Pressure and Margin Erosion
- 7.3.2 Skills, Infrastructure and Implementation Gaps
- 7.4 Emerging Market Opportunities
- 7.5 Market Dynamics Impact and Time-Horizon Assessment
Chapter 8 Africa Fleet Management Outsourcing Value Chain Analysis
- 8.1 Industry Value Chain Overview
- 8.2 Upstream Suppliers and Critical Inputs
- 8.3 Technology and Component Providers
- 8.4 Manufacturing or Service Delivery
- 8.5 Distribution, Channel Partners and Integrators
- 8.6 Downstream Applications and End Users
- 8.7 Value Addition and Profit Pools
- 8.8 Vertical Integration and Outsourcing
- 8.9 Supplier Concentration and Risk
- 8.10 Supply Chain Localization and Resilience
Chapter 9 Africa Fleet Management Outsourcing Market Regulations and Policies
- 9.1 Relevant Laws, Standards and Compliance Frameworks
- 9.2 Product, Service, Safety and Quality Requirements
- 9.3 Government Policies, Incentives and Subsidies
- 9.4 Imports, Exports and Trade Barriers
- 9.5 Public Procurement and Local Content Requirements
- 9.6 Data Protection, AI and Cybersecurity Compliance
- 9.7 Upcoming Policy Changes and Market Implications
Chapter 10 Africa Fleet Management Outsourcing Market Hotspots and Opportunities
- 10.1 Market Opportunity Mapping and Growth Hotspots
- 10.2 High-Growth Applications and Customer Groups
- 10.3 Underserved Markets and White-Space Opportunities
- 10.4 Emerging Technology and Product Opportunities
- 10.5 New Capacity and Investment Hotspots
- 10.6 Market Entry and Expansion Opportunities
- 10.7 Distribution and Partnership Opportunities
- 10.8 Near-Term and Long-Term Commercial Potential
- 10.9 Opportunity Attractiveness and Execution Risks
Chapter 11 Africa Fleet Management Outsourcing Market Outlook, 2025-2035
- 11.1 Market Size and Analysis
- 11.1.1 Revenue (Market Measurement: 2025: USD 334.5 million → 2035: USD 1.08 billion)
- 11.1.2 Historical Market Size, 2018-2025
- 11.1.3 Base-Year Market Size, 2025
- 11.2 Market Forecast, 2025-2035
- 11.2.1 Revenue Forecast to 2035
- 11.2.2 CAGR and Year-on-Year Growth
- 11.2.3 Incremental Revenue Opportunity
- 11.3 Forecast Assumptions and Scenario Analysis
- 11.3.1 Base-Case Forecast
- 11.3.2 Optimistic and Conservative Scenarios
- 11.3.3 Technology, Pricing and Policy Sensitivities
- 11.4 Market Attractiveness and Growth Outlook
Chapter 12 Africa Fleet Management Outsourcing Market Segmentation and Outlook
- 12.1 Segmentation Summary and Market Shares, 2025
- 12.2 Largest and Fastest-Growing Segments
- 12.3 By Service Type - Market Size and Forecast, 2025-2035
- 12.3.1 Segment Definition and Scope
- 12.3.2 Historical Market Size, 2018-2025
- 12.3.3 Revenue Forecast, 2025-2035
- 12.3.4 Base-Year Market Share, 2025
- 12.3.5 Segment CAGR and Growth Drivers
- 12.3.6 Subsegment Market Size and Forecast
- 12.3.6.1 Telematics and Connected Fleet Services
- 12.3.6.2 Managed Maintenance Services
- 12.3.6.3 Full Maintenance Lease Management Fees
- 12.3.6.4 Fleet Administration and Compliance Services
- 12.3.6.5 Driver Management Services
- 12.3.7 Subsegment Pricing and Adoption Trends
- 12.3.8 Leading Suppliers and Competition
- 12.3.9 Regional Demand and Opportunities
- 12.4 By Customer Type - Market Size and Forecast, 2025-2035
- 12.4.1 Segment Definition and Scope
- 12.4.2 Historical Market Size, 2018-2025
- 12.4.3 Revenue Forecast, 2025-2035
- 12.4.4 Base-Year Market Share, 2025
- 12.4.5 Segment CAGR and Growth Drivers
- 12.4.6 Subsegment Market Size and Forecast
- 12.4.6.1 Private Corporate Fleet Owners
- 12.4.6.2 Government Fleet Authorities
- 12.4.6.3 Fleet Leasing Intermediaries
- 12.4.6.4 Nonprofit Fleet Operators
- 12.4.7 Subsegment Pricing and Adoption Trends
- 12.4.8 Leading Suppliers and Competition
- 12.4.9 Regional Demand and Opportunities
- 12.5 By End-Use Industry - Market Size and Forecast, 2025-2035
- 12.5.1 Segment Definition and Scope
- 12.5.2 Historical Market Size, 2018-2025
- 12.5.3 Revenue Forecast, 2025-2035
- 12.5.4 Base-Year Market Share, 2025
- 12.5.5 Segment CAGR and Growth Drivers
- 12.5.6 Subsegment Market Size and Forecast
- 12.5.6.1 Transport and Logistics
- 12.5.6.2 Government and Public Services
- 12.5.6.3 Mining and Construction
- 12.5.6.4 Retail and Consumer Goods
- 12.5.6.5 Corporate and Nonprofit Services
- 12.5.7 Subsegment Pricing and Adoption Trends
- 12.5.8 Leading Suppliers and Competition
- 12.5.9 Regional Demand and Opportunities
- 12.6 By Sales Channel - Market Size and Forecast, 2025-2035
- 12.6.1 Segment Definition and Scope
- 12.6.2 Historical Market Size, 2018-2025
- 12.6.3 Revenue Forecast, 2025-2035
- 12.6.4 Base-Year Market Share, 2025
- 12.6.5 Segment CAGR and Growth Drivers
- 12.6.6 Subsegment Market Size and Forecast
- 12.6.6.1 Direct Enterprise Sales
- 12.6.6.2 Public Procurement Tenders
- 12.6.6.3 Bank and Leasing Partnerships
- 12.6.6.4 Dealer and Integrator Partnerships
- 12.6.7 Subsegment Pricing and Adoption Trends
- 12.6.8 Leading Suppliers and Competition
- 12.6.9 Regional Demand and Opportunities
- 12.7 Segment Growth Comparison
- 12.8 Segment Attractiveness and Priority Matrix
Chapter 13 Africa Fleet Management Outsourcing End-Use and Application Market Outlook
- 13.1 End-Use Industry and Customer Demand Structure
- 13.2 Leading Applications and Customer Groups
- 13.3 End-Use Market Size, Share and Forecast
- 13.4 Major End-Use Industry Deep Dives
- 13.4.1 Customer Requirements and Use Cases
- 13.4.2 Demand and Replacement Cycles
- 13.4.3 Technical and Regulatory Considerations
- 13.4.4 Purchasing and Procurement Models
- 13.4.5 Leading Vendors and Distribution Channels
- 13.4.6 Forecast and Commercial Opportunities
- 13.5 Emerging Applications and Cross-Segment Demand
- 13.6 End-Use Industry Investment Priorities
Chapter 14 Africa Fleet Management Outsourcing Geographic Market Outlook, 2025-2035
- 14.1 Regional Market Size and Country-Level Shares, 2025
- 14.2 Country Market Size Comparison, 2025
- 14.3 Country Market Forecasts, 2025-2035
- 14.4 Subregional Industrial and Demand Clusters
- 14.5 Intra-Regional Pricing and Cost Differences
- 14.6 Cross-Border Trade and Supply Networks
- 14.7 Regional Supply and Demand Balances
- 14.8 Country Opportunity Comparison and Prioritization
Note: Every listed country is covered on the structure shown under the first country.
Chapter 15 Africa Fleet Management Outsourcing Technology, Innovation and Sustainability Outlook
- 15.1 Technology Landscape and Maturity
- 15.2 Product, Process and Service Innovation
- 15.3 AI, Automation and Digital Tools in the Industry
- 15.4 Technology Adoption and Performance Benchmarking
- 15.5 Innovation Pipeline and R&D Investment
- 15.6 Energy Efficiency and Resource Management
- 15.7 Sustainability, Recycling and Circularity
- 15.8 Technology Roadmap, 2025-2035
- 15.9 Risks of Obsolescence and Technology Substitution
Chapter 16 Africa Fleet Management Outsourcing Market Key Strategic Imperatives
- 16.1 Growth and Market Entry Priorities
- 16.2 High-Return Products and Segments
- 16.3 Pricing, Profitability and Cost Optimization
- 16.4 Technology Investment and Product Differentiation
- 16.5 Supply Chain Localization and Resilience
- 16.6 Distribution and Customer Acquisition
- 16.7 Partnership, Acquisition and Capacity Strategy
- 16.8 Regional Expansion Priorities
- 16.9 Short-, Medium- and Long-Term Actions
Chapter 17 Competition Outlook
- 17.1 Industry Competition Characteristics
- 17.2 Market Structure and Concentration
- 17.3 Market Share and Competitive Positioning, 2025
- 17.4 Company-Wise Revenue and Product Benchmarking
- 17.5 Production and Service Capacity Benchmarking
- 17.6 Technology, Pricing and Differentiation
- 17.7 Regional Footprint and Distribution Strength
- 17.8 Mergers, Acquisitions and Strategic Alliances
- 17.9 New Entrants and Competitive Threats
- 17.10 Porter's Five Forces and Industry Attractiveness
- 17.11 Competitive Outlook, 2025-2035
Chapter 18 Company Profiles
- 18.1 Company Coverage and Selection Criteria
- 18.2 Cartrack
- 18.2.1 Business Description
- 18.2.2 Company Ownership and Geographic Presence
- 18.2.3 Product and Service Portfolio
- 18.2.4 Manufacturing and Operating Footprint
- 18.2.5 Financial Performance and Investment
- 18.2.6 Market Share and Competitive Position
- 18.2.7 Technology and Innovation Capabilities
- 18.2.8 Strategic Alliances or Partnerships
- 18.2.9 Recent Developments
- 18.2.10 Growth Strategy and Outlook
- 18.3 Avis Fleet
- 18.4 MiX by Powerfleet
- 18.5 Netstar
- 18.6 Tracker Connect
- 18.7 Ctrack
- 18.8 Eqstra Fleet Management
- 18.9 WesBank Fleet Solutions
- 18.10 Standard Bank Fleet Management
- 18.11 BidTrack
- 18.12 Other Relevant Market Participants
Note: Every listed company is profiled on the structure shown under the first company. The company list is preliminary and may change based on research findings, market developments, data availability and client requirements.
Chapter 19 Disclaimer
- 19.1 Research and Forecast Disclaimer
- 19.2 Data Source and Estimation Limitations
Note: The depth of individual sections depends on data availability for this market. Volume, capacity, trade and other unit-based metrics are included where applicable.

