
Brewery yeast moves from disposal cost to paid ingredient
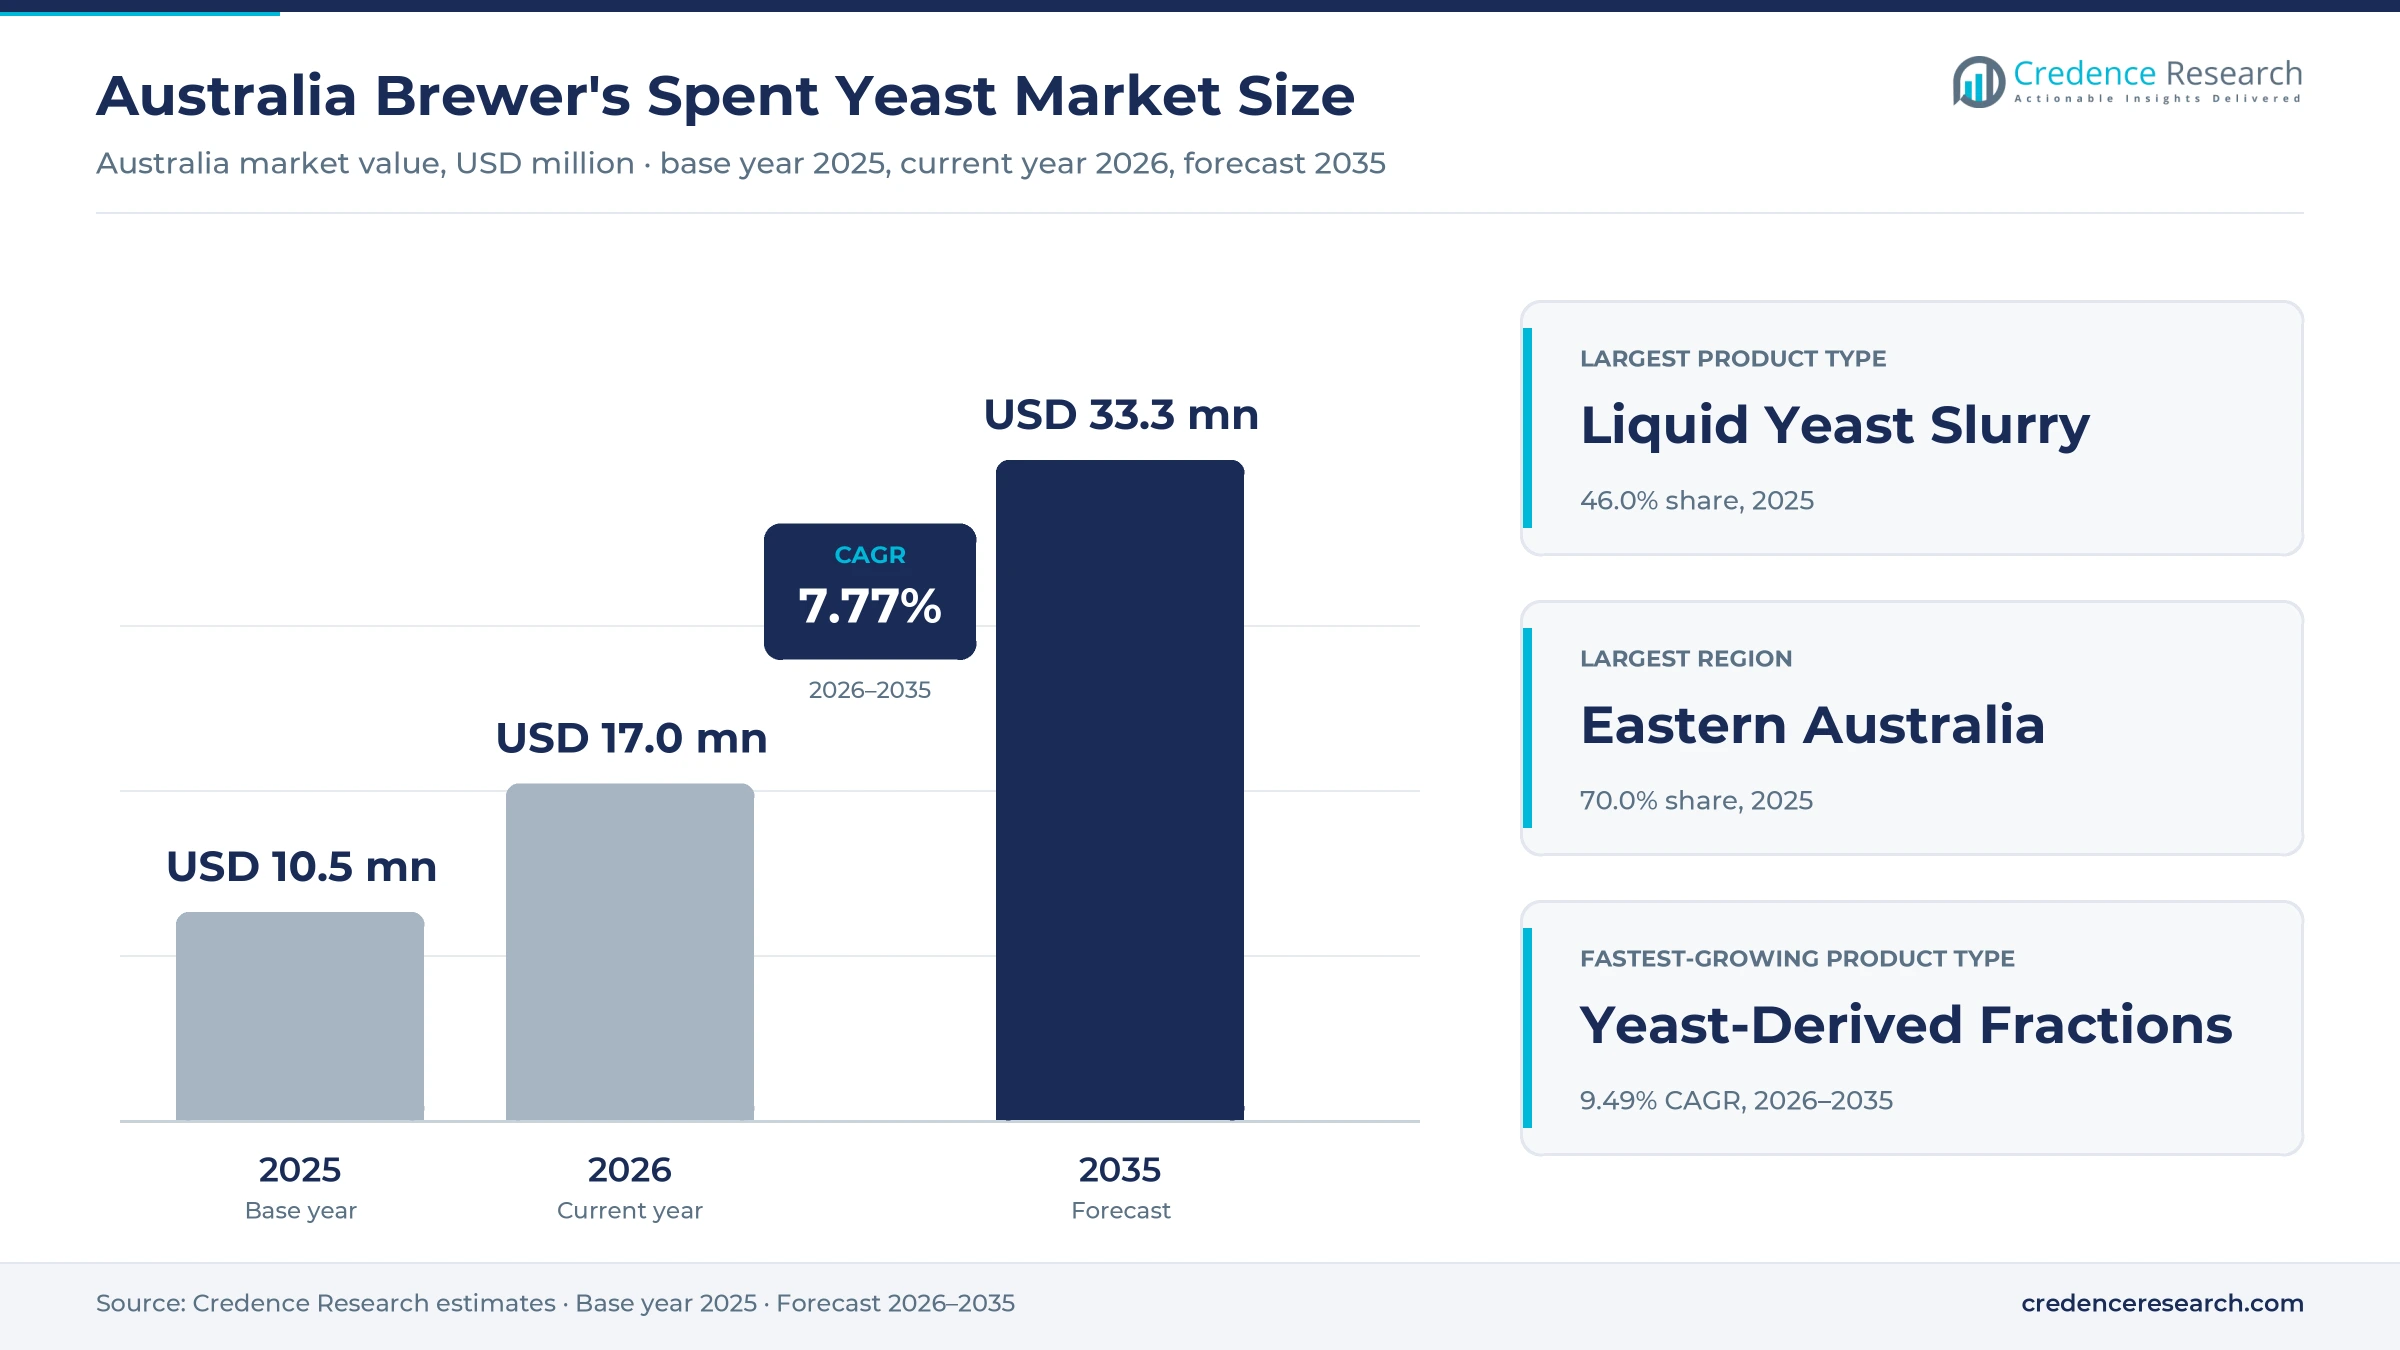
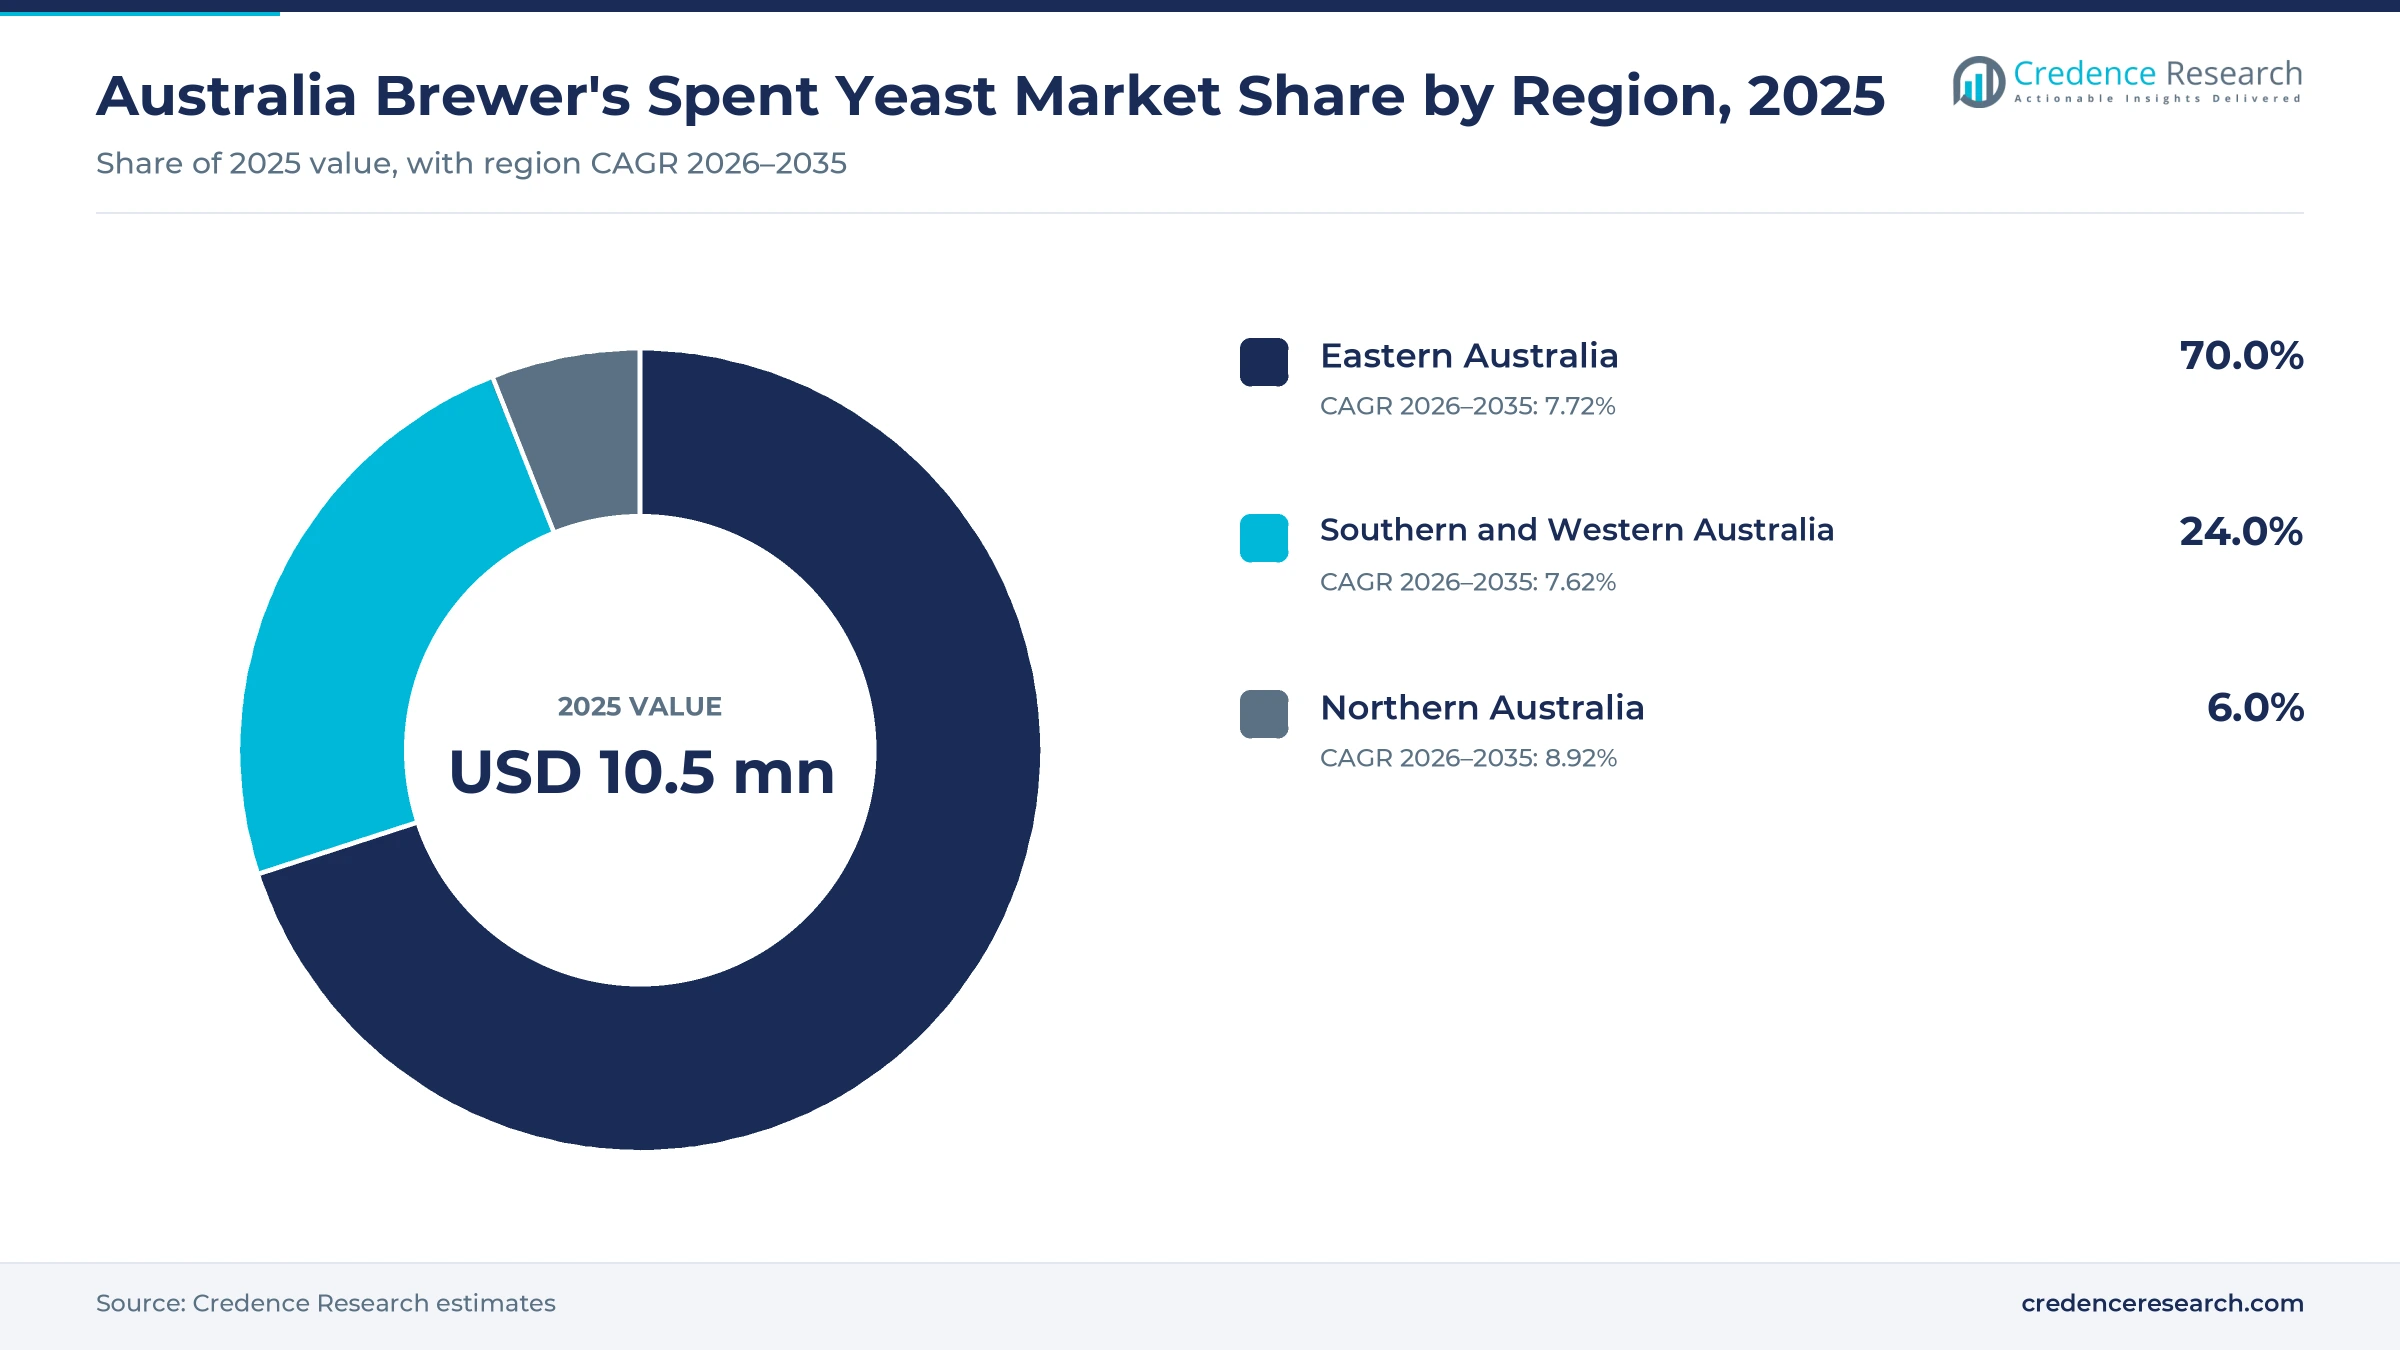
The Australia brewer's spent yeast market was valued at USD 10.5 million in 2025 and is projected to increase from USD 17.0 million in 2026 to USD 33.3 million by 2035, registering a CAGR of 7.77% during 2026–2035. Demand comes from feed formulators, dairy and aquaculture farms, food ingredient makers and specialty nutrition firms that buy surplus yeast from breweries as slurry, pressed cake, dried powder or extracted fractions. Eastern Australia held the largest regional share, 70.0% in 2025, because New South Wales, Victoria and southeast Queensland host the largest breweries and food plants. Northern Australia is the fastest-growing region at 8.92% a year, as prawn farms and cattle producers in the tropical north seek local protein inputs. In turn, brewery consolidation is concentrating supply, and Lion plans to end brewing at its Launceston site in November 2026.
What does the brewery yeast estimate cover in Australia?
The estimate measures sales in Australia of surplus Saccharomyces yeast recovered from beer fermentation, sold as liquid slurry, dewatered cake, dried whole yeast or yeast-derived fractions such as extracts, proteins and cell walls. It covers sales to feed formulators, food ingredient makers, specialty product makers and farms that buy direct, through contracts, distributors, spot bulk loads and packaged retail formats.
The estimate excludes primary grown baker's, wine and distiller's yeast, along with spent grain, hops residues and imported inactive yeast that did not originate in an Australian brewery. The value chain runs from large and craft breweries through chilling, pressing and drying operators and yeast processors to feed mills, food plants and end buyers.
Australia Brewer's Spent Yeast Market Insights
- The Australia brewer's spent yeast market was valued at USD 10.5 million in 2025 and is projected to reach USD 33.3 million by 2035, at a 7.77% CAGR during 2026–2035.
- Eastern Australia held 70.0% of 2025 value, because Melbourne, Sydney and Brisbane host the largest breweries and the main food plants that buy yeast.
- Liquid yeast slurry led product types with 46.0% of 2025 value, as most breweries sell surplus yeast wet to nearby farms and feed users.
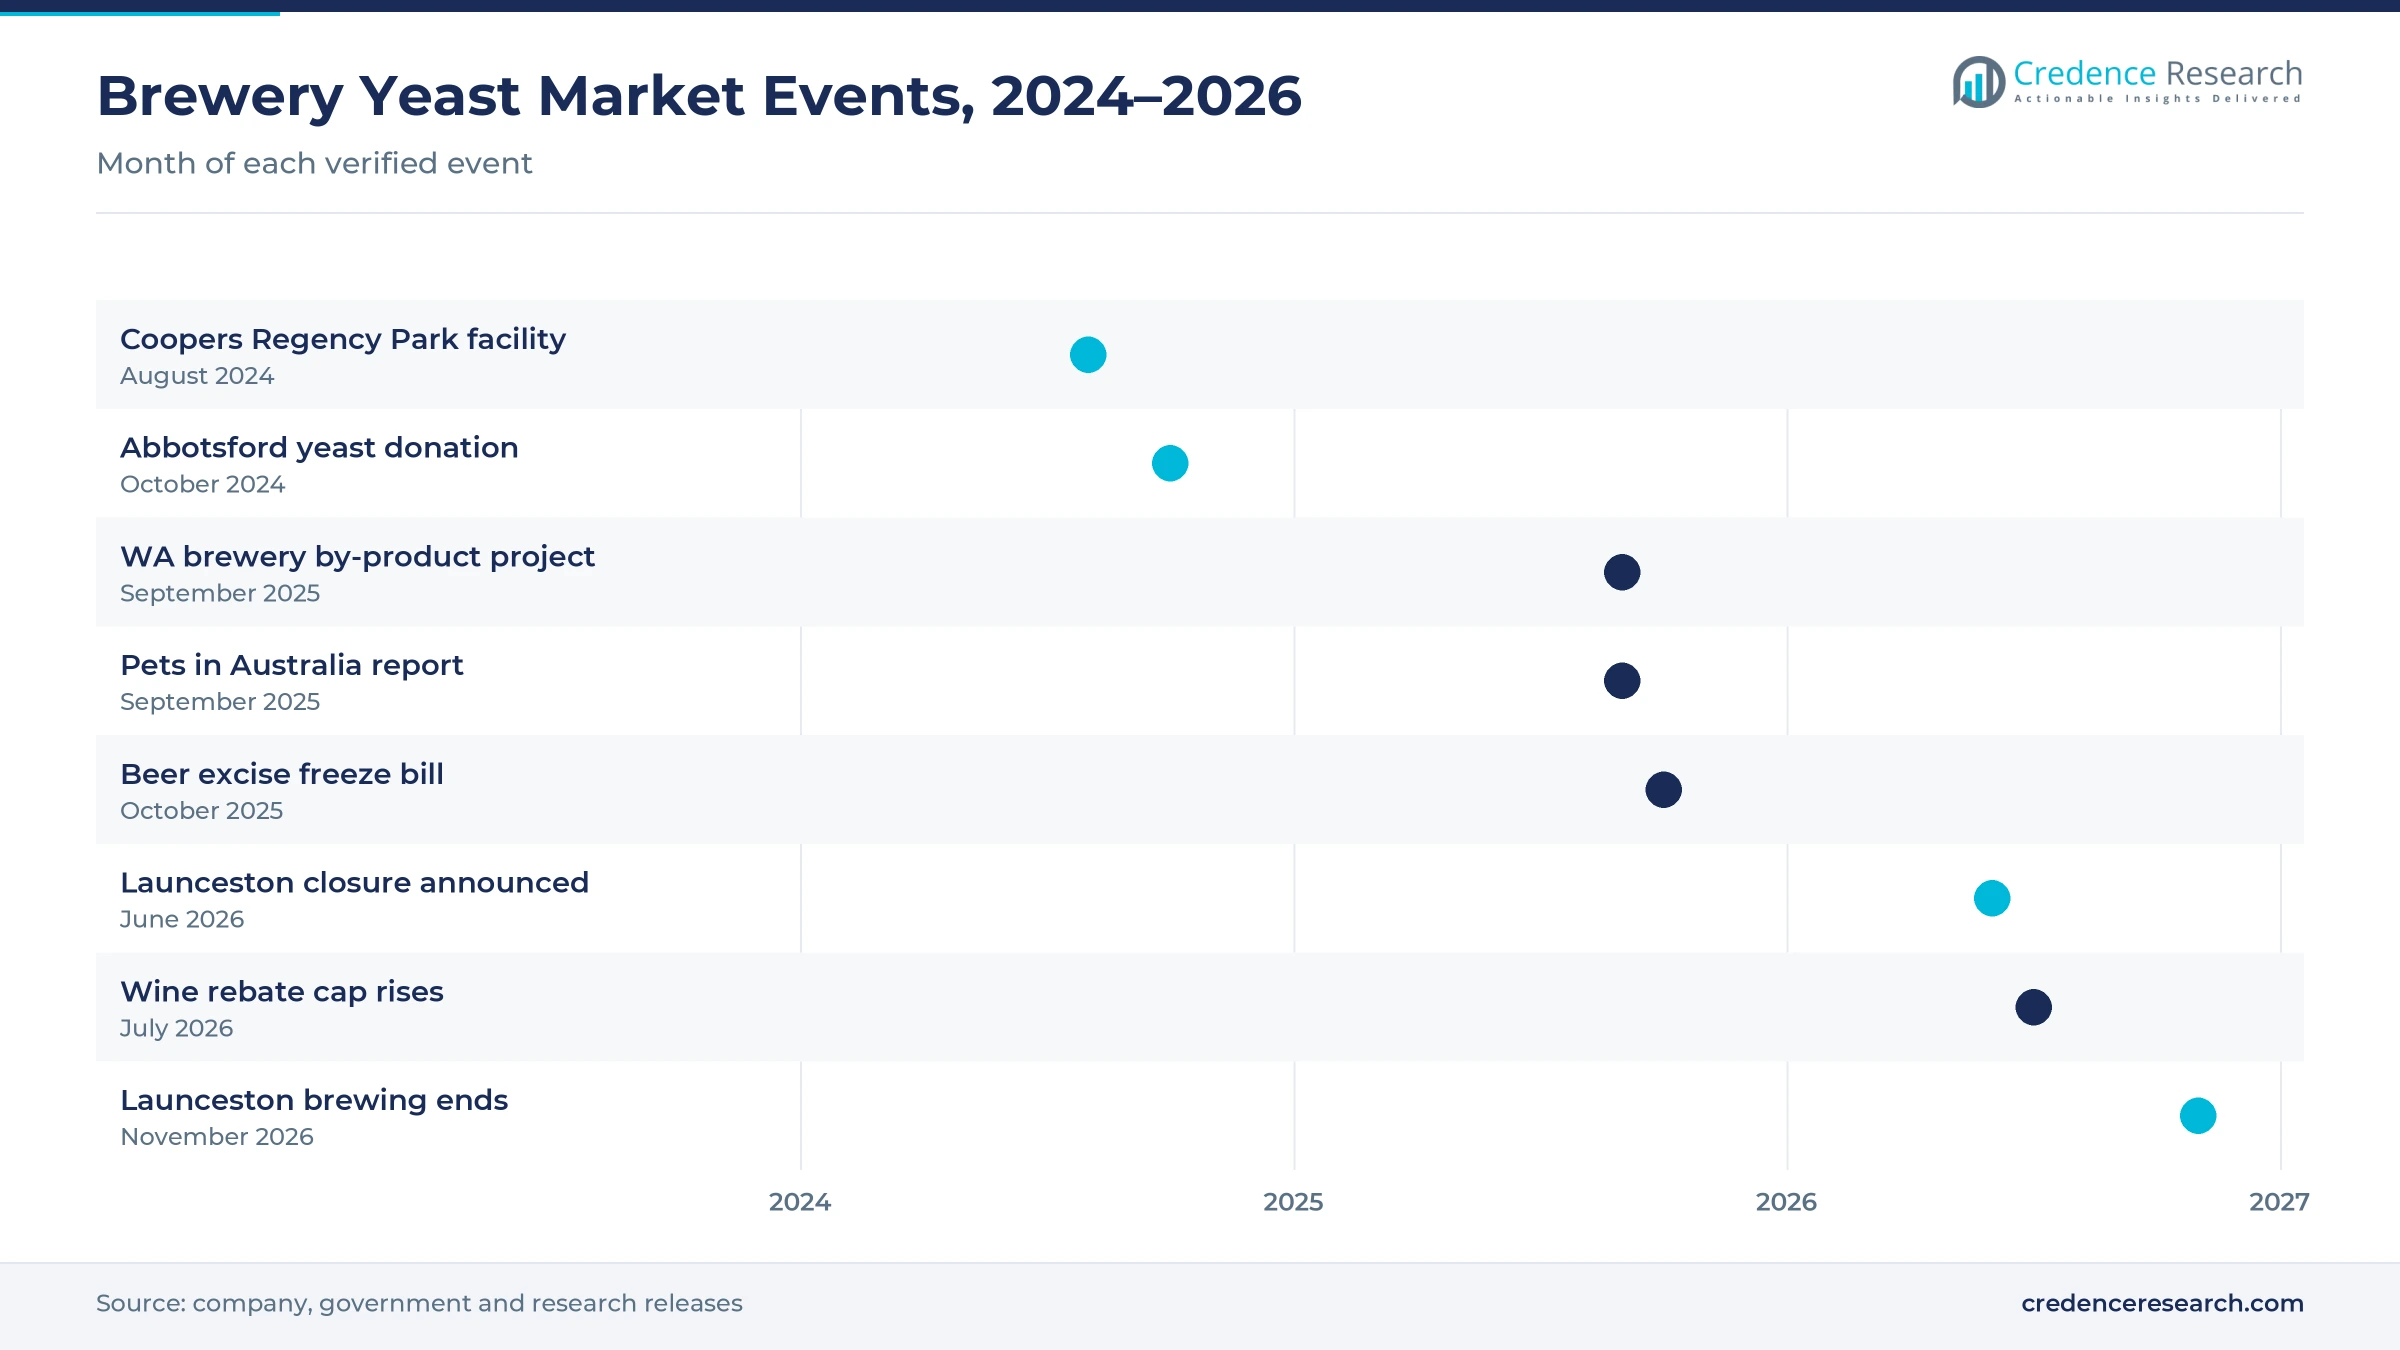
- In October 2024, Asahi Beverages donated 8,000 kilograms of solid yeast from its Abbotsford Brewery to make spread jars for a food relief program.
- Yeast-derived fractions grow fastest at 9.49% a year during 2026–2035, as extracts, proteins and cell walls earn far more per ton than wet yeast.
Wet slurry leads while yeast fractions grow fastest
Why does wet slurry still dominate sales?
Based on product type, the market is categorized into liquid yeast slurry, dewatered yeast cake, dried whole yeast and yeast-derived fractions. Liquid Yeast Slurry led with 46.0% of 2025 value, because most breweries sell surplus yeast wet to nearby dairy farms and feed mills without further processing. Yeast-Derived Fractions grow fastest at 9.49% a year, as processors extract proteins, nucleotides and cell walls that sell at specialty prices.
Which end uses absorb the most brewery yeast?
Based on application, the market is categorized into animal feed and aquaculture, food ingredients and human nutrition and specialty uses. Animal Feed and Aquaculture led with 58.0% of 2025 value, because feed users take large volumes of wet and dried yeast as a low-cost protein source. Human Nutrition and Specialty Uses grow fastest at 8.93% a year, as supplements and functional ingredients gain buyers.
Who buys recovered brewery yeast?
Based on customer type, the market is categorized into feed formulators, food ingredient manufacturers, specialty product manufacturers and direct end buyers. Feed Formulators led with 40.0% of 2025 value, because they blend yeast into dairy, pig, poultry and aquaculture rations. Specialty Product Manufacturers grow fastest at 8.95% a year, as supplement and pet food makers seek traceable yeast inputs.
How do contracts shape yeast offtake?
Based on sales channel, the market is categorized into direct contract sales, ingredient distributor sales, spot bulk sales and direct packaged sales. Direct Contract Sales led with 52.0% of 2025 value, because large breweries lock in regular collection with processors and feed users. Direct Packaged Sales grow fastest at 8.72% a year, as dried and flaked yeast reaches retail and online shoppers.
| Segment Group | Leading Sub-segment | Share, 2025 | Fastest-growing Sub-segment | CAGR, 2026–2035 |
|---|---|---|---|---|
| By Product Type | Liquid Yeast Slurry | 46.0% | Yeast-Derived Fractions | 9.49% |
| By Application | Animal Feed and Aquaculture | 58.0% | Human Nutrition and Specialty Uses | 8.93% |
| By Customer Type | Feed Formulators | 40.0% | Specialty Product Manufacturers | 8.95% |
| By Sales Channel | Direct Contract Sales | 52.0% | Direct Packaged Sales | 8.72% |
Request a Free Sample
Fill in your details and we'll send you a free sample report.
- Sample data tables & charts
- Research methodology
Recovery, food-grade handling and nutrition lift value
How does better commercial recovery lift yeast sales?
Breweries that capture, chill and press surplus yeast instead of sending it to waste contractors turn a disposal cost into a saleable input. A 2020 review in the journal Fermentation estimates that brewing leaves 15 to 18 tons of surplus yeast for every 10,000 hectoliters of finished beer. On that ratio, the 78.7 million liters Coopers sold in fiscal 2024 imply roughly 1,200 to 1,400 tons of surplus yeast a year at one Adelaide site. A Queensland University of Technology project with Grainstone, run from October 2020 to March 2023, also ranked brewing by-product upcycling options by cost and yield. As a result, liquid yeast slurry still leads product types with 46.0% of 2025 value, while better recovery lifts the volume reaching paid outlets.
Why does food ingredient qualification widen buyers?
Food-grade handling widens the buyer pool, because yeast that meets food safety standards can move into spreads, savory bases and seasonings at higher prices than feed. Vegemite has been made from spent yeast supplied by the Abbotsford Brewery in Melbourne since 1923, according to Asahi Beverages. The brewer also donated 8,000 kilograms of solid yeast in October 2024 to make 436,000 jars for a food relief program. The Port Melbourne plant that makes the spread produces about 22 million jars a year, which keeps contract demand for food-grade cake steady. Consequently, food ingredient manufacturers form a core customer group, and makers of savory extract ingredients depend on qualified brewery supply.
How do specialty nutrition uses raise value per ton?
Proteins, nucleotides and cell-wall fractions sell for far more than whole wet yeast, which gives processors a reason to refine supply. The 2020 Fermentation review reports that spent brewer's yeast contains about 45% to 60% protein, along with minerals and B vitamins. The same review notes that extracts supply free amino acids and nucleotides for savory flavor, while cell-wall beta-glucan can thicken, emulsify and replace fat in foods. Murdoch University and Spinifex Brewing Co also signed an agreement on May 29, 2023, to turn spent grain and yeast into nutritious ingredients at a food precinct south of Perth. As a result, yeast-derived fractions grow fastest at 9.49% a year, and human nutrition and specialty uses expand at 8.93%.
Why do aquaculture and dairy feed users absorb supply?
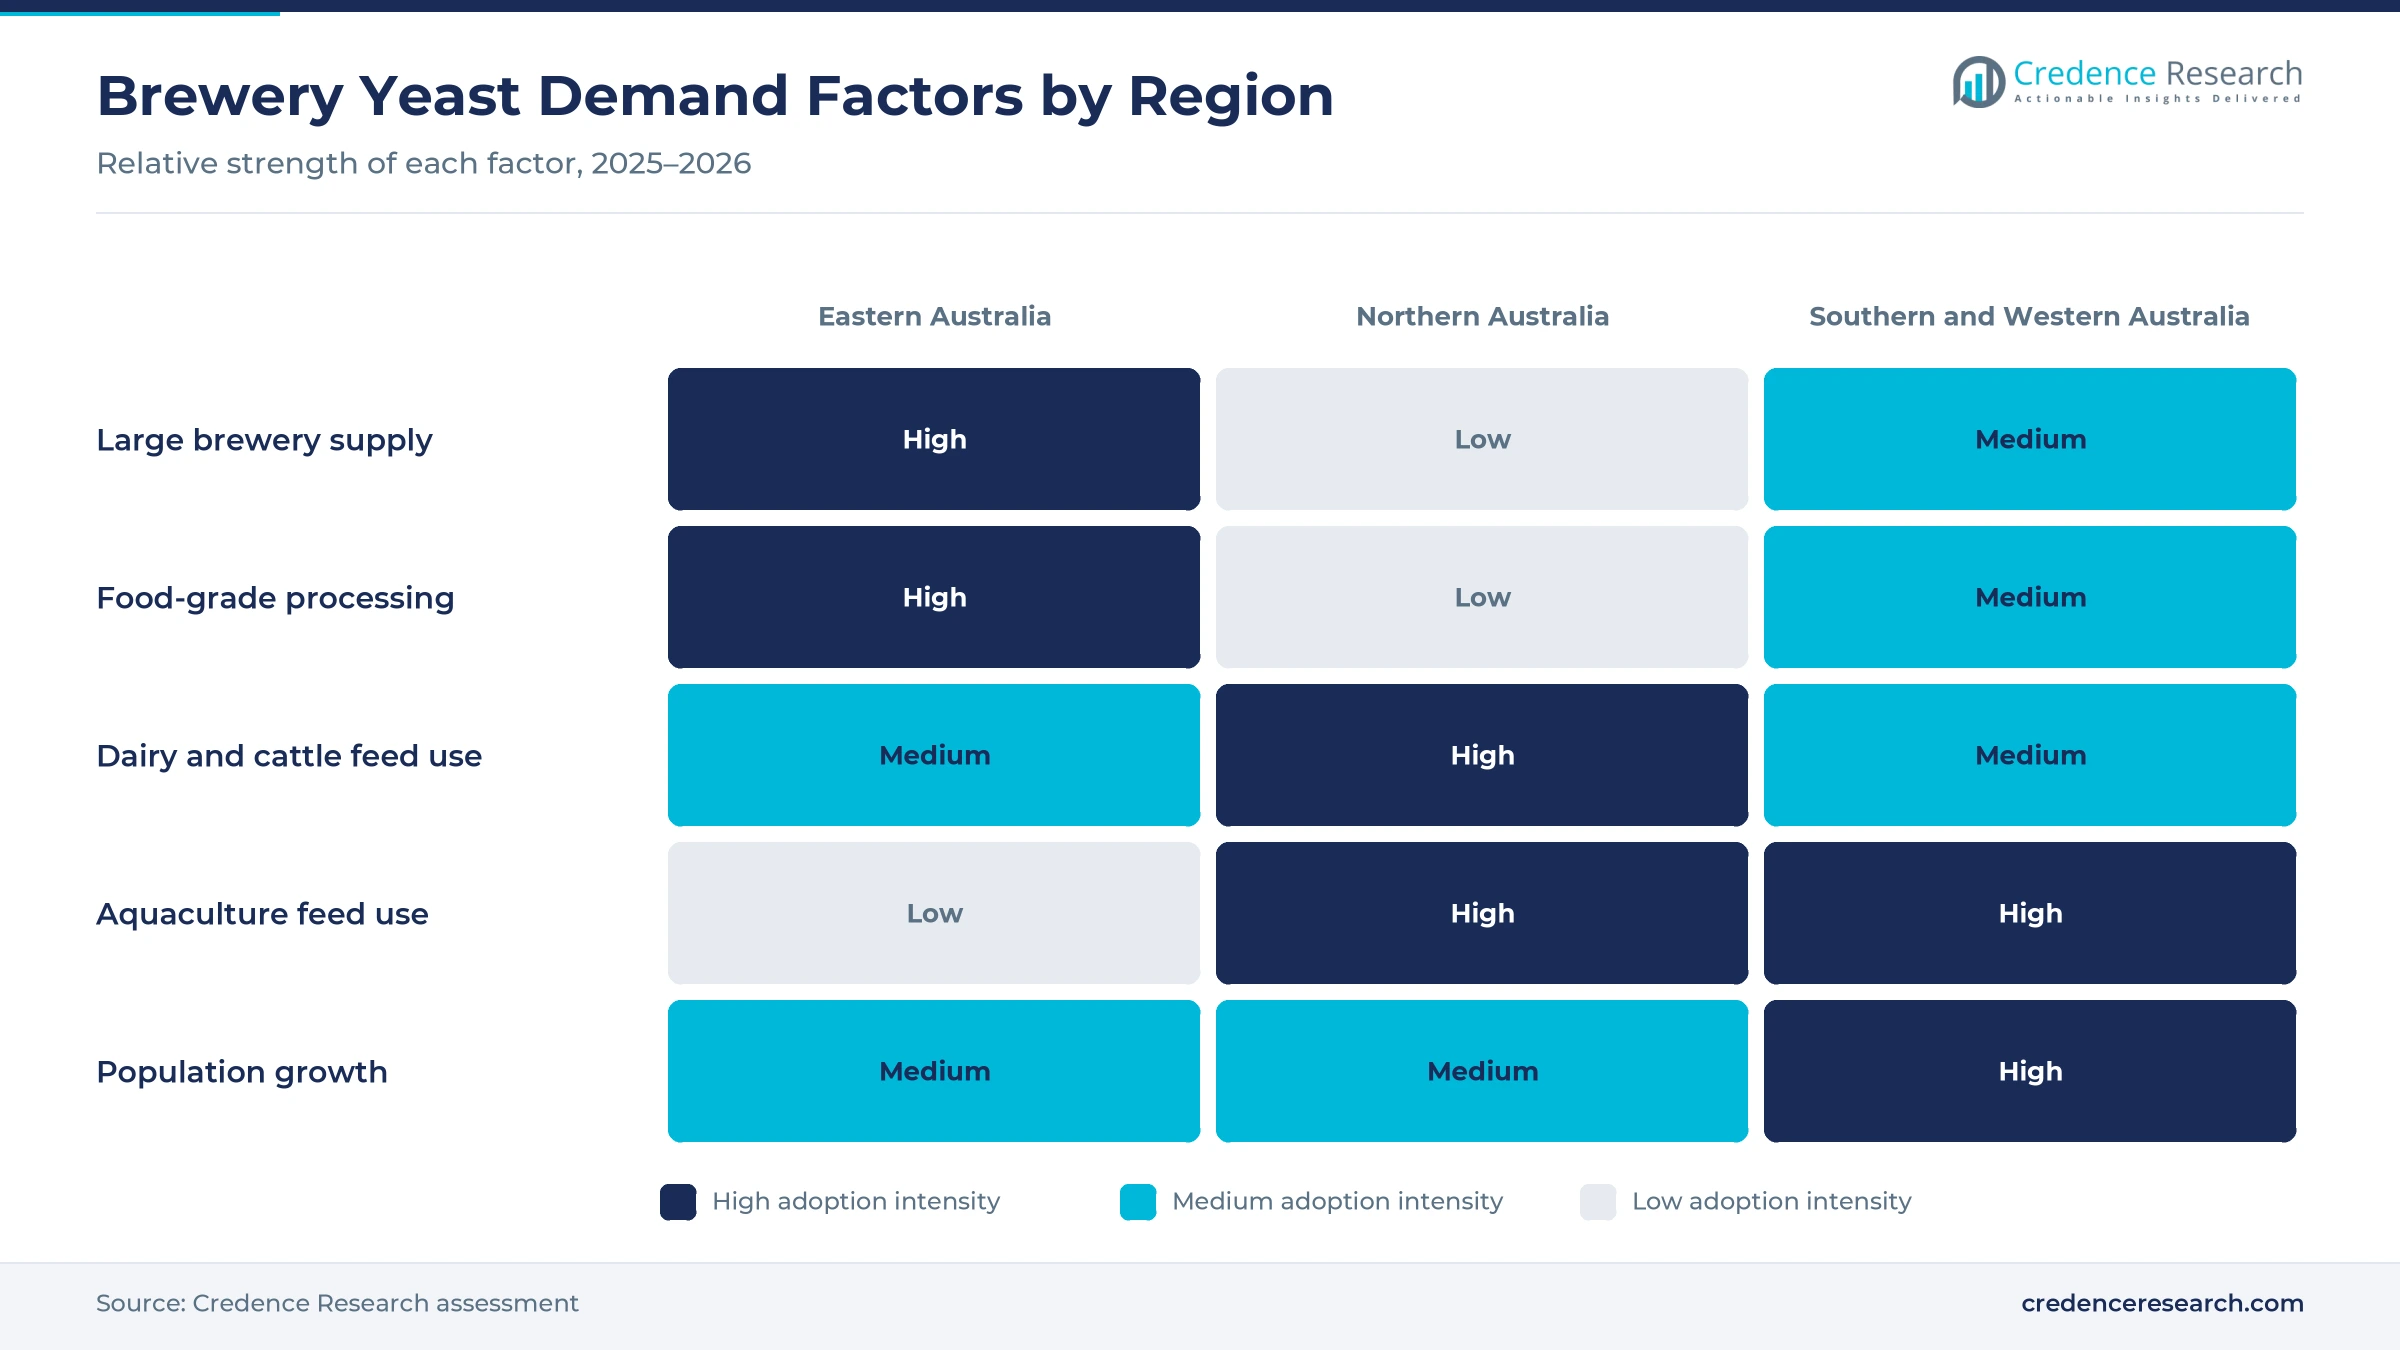
Animal feed remains the largest outlet, because farmers and feed mills value surplus yeast as a cheap source of protein and minerals. Australian aquaculture was valued at about AUD 2.31 billion in 2024-25, led by salmonids, tuna, oysters, prawns and barramundi, according to the federal agriculture department. Queensland prawn farming reached AUD 212.9 million in 2022-23, and the Mackay district alone rose to AUD 160.7 million, according to the Queensland government. Lion also supplied brewing residues such as spent grain to about 35 dairy farms under its Dairy Pride program in 2017. Consequently, animal feed and aquaculture lead applications with 58.0% of 2025 value, and buyers of aquafeed additives test yeast proteins as fishmeal alternatives.
Imports, consolidation and pet food reshape demand
Why is demand for dried and stabilized forms rising?
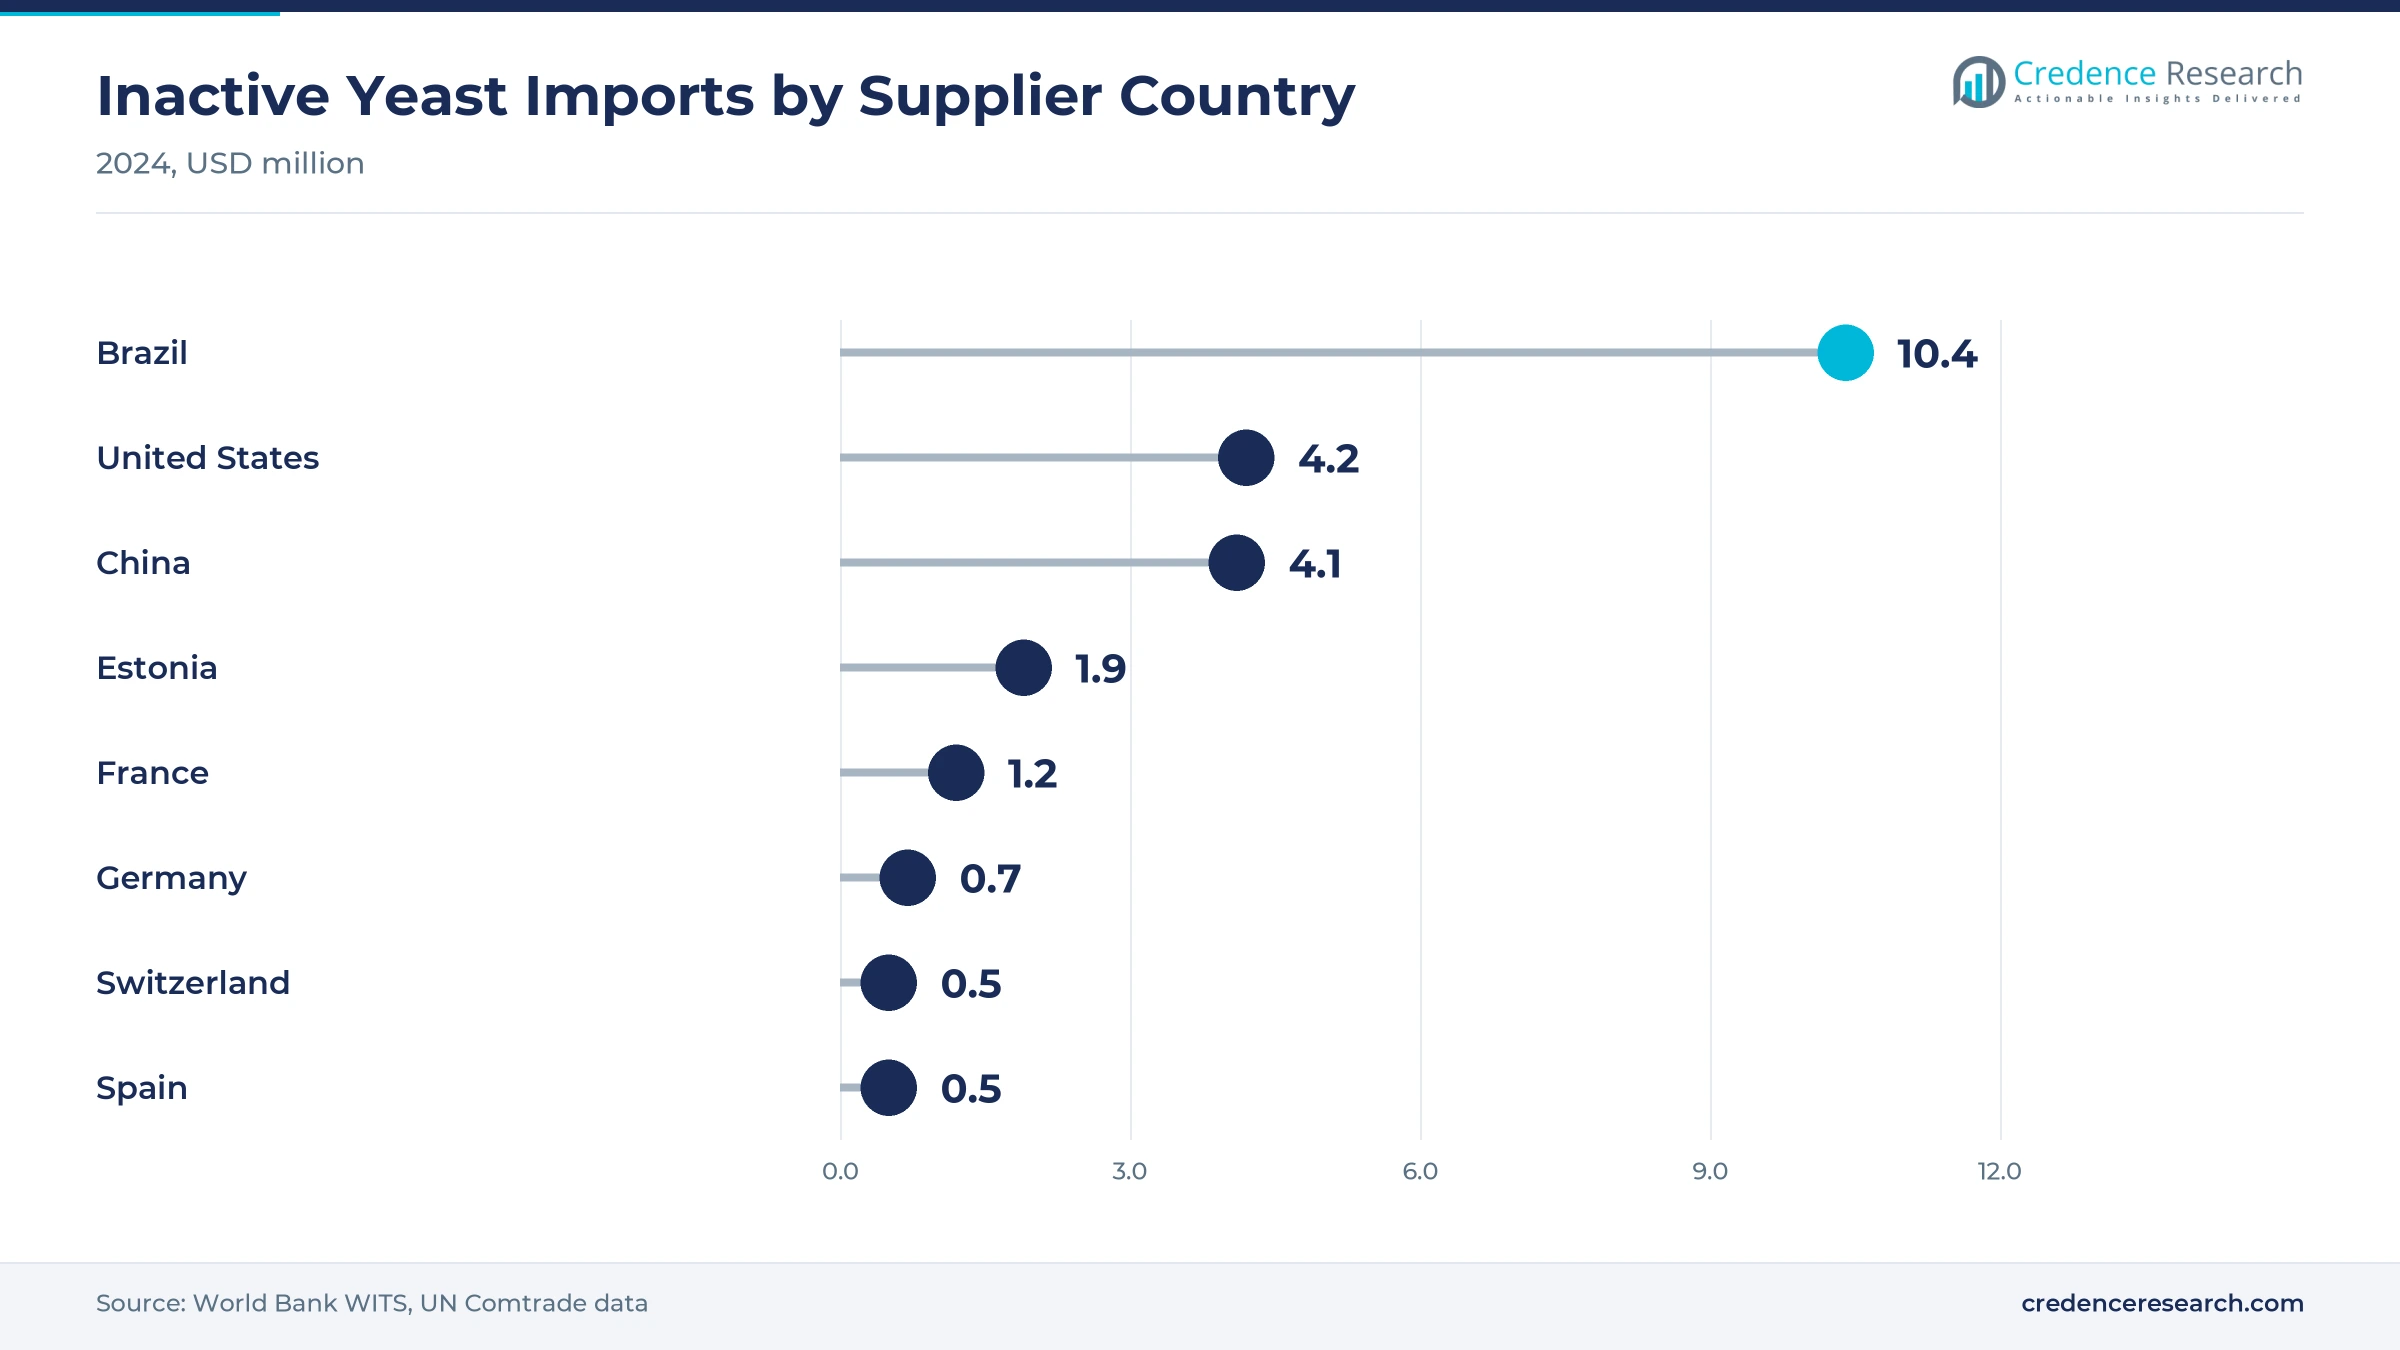
Feed and food buyers increasingly want shelf-stable yeast that ships without refrigeration, and import data show that need clearly. Australia imported USD 25.32 million of inactive yeasts in 2024, or 4,342 metric tons, according to World Bank trade data. Brazil supplied USD 10.42 million of that 2024 total, followed by the United States and China at about USD 4.1 million to 4.2 million each. In contrast, Australian exports of inactive yeasts were only about USD 0.50 million in 2023. As a result, local breweries and processors see room to dry more domestic yeast as buyers shift away from wet product.
How is the rise of brewery consolidation changing supply?
Fewer and larger brewing sites produce steadier yeast volumes, which justify pressing and drying equipment at each remaining plant. Lion announced in June 2026 that brewing at its James Boag facility in Launceston will end in November 2026, with 42 technical jobs lost, after the plant ran at about 20% of capacity for several years. Lion had already moved mainland Boag's volumes to larger sites in 2024. Asahi also announced in April 2023 that it would close the Green Beacon production brewery in Brisbane and move its beer to Adelaide and Sydney. In turn, direct contract sales lead channels with 52.0% of 2025 value, as processors sign offtake deals with the remaining large breweries.
Can pet food and aquafeed premixes open new demand?
Makers of pet food and aquafeed premixes need palatable, traceable protein and gut-health ingredients, which gives brewery yeast a clear opening. Australian households owned an estimated 31.6 million pets in 2025, with 73% of homes keeping at least one, according to Animal Medicines Australia. The same September 2025 report put annual spending on pet food at about AUD 9.8 billion. The national science agency CSIRO also reports that about half of the prawns eaten in Australia are imported, while local farms can now use diets without wild fish products. Consequently, specialty product manufacturers grow fastest among customers at 8.95% a year as they formulate yeast into premium feeds.
Is there room for local drying to replace imports?
Imported inactive yeast carries freight costs and long shipping times, so local drying has room to win back volume. Brazilian inactive yeast landed in Australia at about USD 4.29 a kilogram in 2024, based on World Bank trade values and volumes, while the average for all suppliers was about USD 5.83. Lesaffre Australia Pacific built a molasses extracts plant near Melbourne in 18 months, opened in November 2022, to upgrade yeast production by-products, with potential uses that include ruminant nutrition. MAURI also lists eight manufacturing facilities in Australia and three yeast fermentation plants across Australia and New Zealand. As a result, direct packaged sales grow fastest among channels at 8.72% a year as local dried products reach buyers.
Perishability, falling beer volume and import prices
How does perishability limit wet yeast sales?
Live yeast keeps fermenting and attracts bacteria, so wet slurry spoils within days unless it is chilled. Breweries far from dairy farms or feed mills therefore struggle to sell surplus yeast at a fair price. As a result, some regional and craft brewers still pay for disposal or give yeast away to nearby farmers. Processors address this with on-site pressing, cold storage and regular collection routes that lower spoilage risk.
Why do falling beer volumes cap yeast supply?
Surplus yeast output rises and falls with the beer brewed, so shrinking beer sales directly limit feedstock. The national beer market fell 2.6% in fiscal 2024 and a further 0.9% in fiscal 2025, according to Coopers results reported by Drinks Trade and InDaily. Consequently, processors cannot count on rising feedstock from the large brewers. They respond by collecting from craft breweries, distillers and other fermentation sites to fill dryers.
How do import prices pressure local processors?
Large yeast makers in Brazil, China and the United States sell dried inactive yeast at scale into Australian feed and food channels. Brazilian product averaged about USD 4.29 a kilogram in 2024, which sets a ceiling for local dried prices. In turn, Australian drying plants must offset high energy and labor costs with freshness, traceability and shorter lead times. Firms that cannot do this keep selling wet slurry into lower value feed.
Why does food qualification add cost and delay?
Brewery yeast carries hop bitterness, residual alcohol and variable solids, which food buyers will not accept without treatment. Food buyers require debittering, washing, pathogen testing and documented handling before they accept a supply. Consequently, smaller breweries rarely qualify for food contracts and remain locked into feed outlets. Processors that pool supply from many sites and run a single food-grade plant can spread these costs across larger volumes.
Eastern states lead as northern feed demand grows fastest
| Region | Value, 2025 (USD million) | Share, 2025 | CAGR, 2026–2035 |
|---|---|---|---|
| Eastern Australia | 7.3 | 70.0% | 7.72% |
| Southern and Western Australia | 2.5 | 24.0% | 7.62% |
| Northern Australia | 0.6 | 6.0% | 8.92% |
Why does Eastern Australia lead yeast recovery?
Eastern Australia held a 70.0% share of 2025 value and grows at 7.72% a year. The zone hosts the Abbotsford Brewery, the Port Melbourne spread plant and the large Sydney and Brisbane breweries that supply food and feed buyers. New South Wales had 8.67 million residents and Victoria 7.15 million at March 31, 2026, according to the Australian Bureau of Statistics. As a result, most food-grade yeast contracts and drying capacity sit in this zone.
How does Northern Australia become the fastest zone?
Northern Australia held a 6.0% share of 2025 value and grows fastest at 8.92% a year. The zone has few large breweries, and Lion closed its Tiny Mountain microbrewery in Townsville in April 2023. However, prawn farms around Mackay, Townsville and Cairns, along with barramundi farms and northern cattle producers, need protein feed inputs. Consequently, dried and pressed yeast trucked from the south finds growing demand in the tropical north.
What shapes demand in Southern and Western Australia?
Southern and Western Australia held a 24.0% share of 2025 value and grow at 7.62% a year. Coopers brews at Regency Park in Adelaide, and South Australia took 25.6% of its fiscal 2024 beer volume. Western Australia posted 2.1% population growth in the year to March 2026, the fastest of any state. However, the end of brewing at Launceston in November 2026 trims Tasmanian supply, which slows growth in this zone.
Brewery, policy and research moves from 2024 to 2026
| Development | Status and market relevance |
|---|---|
| In August 2024, Coopers Brewery opened a new AUD 70 million facility at Regency Park in Adelaide, adding a microbrewery and whisky distillery. | Adds fermentation volume at a major yeast source |
| In October 2024, Asahi Beverages donated 8,000 kilograms of solid yeast from its Abbotsford Brewery for a food relief spread program. | Shows food-grade use of brewery yeast |
| In September 2025, the Western Australian government backed a three-year ChemCentre project to add value to brewery by-products. | Supports local by-product research |
| In October 2025, the federal government introduced legislation to freeze draught beer excise indexation for two years. | Supports brewery volume and reinvestment |
| In June 2026, Lion announced it will end brewing at its James Boag facility in Launceston in November 2026. | Concentrates yeast supply at mainland sites |
Dewatering, drying and fractionation add value per ton
- Physical stabilization uses chilling, pressing and filtration to cut water and slow spoilage, which lets breweries store yeast for regular collection.
- Thermal drying turns pressed cake into shelf-stable powder or flakes through drum or spray dryers, which opens feed, pet food and retail outlets.
- Autolysis and hydrolysis break down yeast cells with heat, enzymes or salt to release amino acids and nucleotides for savory extracts and spreads.
- Fractionation separates extracts, proteins and cell walls such as beta-glucans and mannans, which sell into supplements, functional foods and feed additives.
Need a Custom Version of This Report?
Tailor the scope, geography, or segments to your exact requirements.
- Custom geography or segment scope
- Direct access to our analyst team
Brewers and yeast makers compete on quality and logistics
Competition combines the large brewers that generate surplus yeast with yeast makers and processors that buy, dry and refine it. Carlton & United Breweries, owned by Asahi, supplies spent yeast from its Abbotsford Brewery to the Vegemite plant, a link that dates back to 1923. Lion brews at sites including Tooheys in Sydney and XXXX in Brisbane and has routed brewing residues to dairy suppliers through its Dairy Pride program. Coopers brews at Regency Park in Adelaide and sold 78.7 million liters of beer in fiscal 2024. AB Mauri runs yeast fermentation plants in Australia and New Zealand through MAURI, while Lesaffre Australia Pacific operates a production site near Melbourne. Companies compete on food-grade handling, collection reliability, drying capacity, protein content and freight cost to feed and food buyers.
Companies profiled and their roles in this market
| Company | Type | Role in the market |
|---|---|---|
| Carlton & United Breweries | Brewer (Asahi) | Abbotsford Brewery yeast supplies the Vegemite plant |
| Lion Pty Ltd | Brewer (Kirin) | Tooheys and XXXX breweries; Launceston brewing ends November 2026 |
| Coopers Brewery Ltd | Brewer | Regency Park brewery in Adelaide, 78.7 million liters in fiscal 2024 |
| AB Mauri | Yeast maker | MAURI lists eight Australian manufacturing facilities and yeast plants |
| Lesaffre Group | Yeast maker | Melbourne production site and molasses extracts plant since 2022 |
Credence Research view on brewery yeast recovery
Credence Research's view is that Australian brewery yeast will keep moving from a disposal problem to a paid ingredient through 2035. Wet slurry for feed should keep the largest share, while dried yeast and extracted fractions capture most new value. Food-grade supply tied to Melbourne spread production gives the market a stable base. However, flat beer volumes and cheap imports mean growth depends on better recovery, local drying and contracts that pool yeast from many breweries.
How the brewery yeast estimate was built
The report uses 2025 as the base year and forecasts market value across 2026–2035. Market values come from the Credence Research model, which links beer output, surplus yeast ratios, recovery rates and price tiers by product form. The three regional shares are Credence Research estimates based on state population and the location of breweries, food plants and feed users, and segment splits are Credence Research estimates. Sources used are official statistics, trade data, government releases, company statements, scientific literature and news reports, and no interviews or surveys were used.
Food-grade supply and fractions shape demand to 2035
The market is expected to reach USD 33.3 million by 2035, a 7.77% CAGR during 2026–2035, as more brewery yeast is recovered, dried and sold into food and specialty uses. Growth should be strongest in yeast-derived fractions, human nutrition and specialty uses, and Northern Australia, while Eastern Australia keeps the largest share. Excise relief and food waste goals support recovery investment after 2026. In contrast, further brewery closures or lower import prices could slow local drying projects.
Frequently Asked Questions
How big is the Australia brewer's spent yeast market?
Which region leads brewery yeast sales?
Which region grows fastest?
Which product type holds the largest share?
Why is brewery yeast used in food?
Which application grows fastest?
Who are the leading companies in this market?
What are the main risks to growth?
Table of Content
Chapter 1 Market Segmentation
- 1.1 Segmentation Framework
- 1.1.1 Product and Service Classification
- 1.1.2 Application and End-Use Classification
- 1.1.3 Technology and Solution Classification
- 1.1.4 Customer and Distribution Channel Classification
- 1.1.5 Geographic Segmentation
- 1.1.6 Market Segment Definitions and Boundaries
- 1.2 By Product Type
- 1.2.1 Liquid Yeast Slurry
- 1.2.2 Dewatered Yeast Cake
- 1.2.3 Dried Whole Yeast
- 1.2.4 Yeast-Derived Fractions
- 1.3 By Application
- 1.3.1 Animal Feed and Aquaculture
- 1.3.2 Food Ingredients
- 1.3.3 Human Nutrition and Specialty Uses
- 1.4 By Customer Type
- 1.4.1 Feed Formulators
- 1.4.2 Food Ingredient Manufacturers
- 1.4.3 Specialty Product Manufacturers
- 1.4.4 Direct End Buyers
- 1.5 By Sales Channel
- 1.5.1 Direct Contract Sales
- 1.5.2 Ingredient Distributor Sales
- 1.5.3 Spot Bulk Sales
- 1.5.4 Direct Packaged Sales
Chapter 2 Introduction
- 2.1 Report Objectives and Scope
- 2.2 Product Definition and Industry Terminology
- 2.3 Market Inclusions and Exclusions
- 2.4 Research Process
- 2.4.1 Primary Research and Expert Interviews
- 2.4.2 Secondary Research and Source Review
- 2.4.3 Top-Down and Bottom-Up Estimation
- 2.4.4 Data Triangulation and Verification
- 2.5 Market Size Measurement Basis
- 2.5.1 2025: USD 10.5 million → 2035: USD 33.3 million
- 2.6 Historical and Forecast Reference Periods
- 2.6.1 Historical Period: 2018-2025
- 2.6.2 Base Year: 2025
- 2.6.3 Forecast Period: 2025-2035
- 2.7 Research Assumptions and Limitations
Chapter 3 Executive Summary
- 3.1 Market Snapshot and Key Findings
- 3.2 Base-Year Market Size, 2025
- 3.3 Forecast Market Size, 2035
- 3.4 Revenue and Volume Growth Outlook
- 3.5 Key Demand and Supply Indicators
- 3.6 Leading Market Segments
- 3.7 Fastest-Growing Market Opportunities
- 3.8 Regional Performance Highlights
- 3.9 Technology and Industry Transformation
- 3.10 Competitive Landscape Summary
- 3.11 Analyst View and Strategic Implications
Chapter 4 Australia Brewer's Spent Yeast Market Trends and Developments
- 4.1 Historical Industry Development, 2018-2025
- 4.2 Recent Market Trends and Developments
- 4.3 Demand and Customer Behavior Trends
- 4.4 Technology and Product Innovation
- 4.5 Artificial Intelligence, Automation and Digitalization
- 4.6 Local Manufacturing and Supply Chain Realignment
- 4.7 Industry Partnerships, Mergers and Acquisitions
- 4.8 Sustainability and Circular Economy Developments
- 4.9 Government and Private Sector Investment Trends
- 4.10 Emerging Business Models and Commercialization
- 4.11 Industry Developments and Announcements
Chapter 5 Australia Brewer's Spent Yeast Market Production, Supply and Demand Analysis
- 5.1 Demand Trend and Consumption Analysis, 2018-2025
- 5.2 Demand Forecast, 2025-2035
- 5.3 Production and Output Trend, 2018-2025
- 5.4 Production and Output Forecast, 2025-2035
- 5.5 Installed Capacity and Capacity Utilization
- 5.6 Company-Wise Production Plants and Statistics
- 5.6.1 Installed Production Capacity
- 5.6.2 Actual Production
- 5.6.3 Planned Capacity and Expansion Targets
- 5.7 Supply Chain Structure and Procurement Trends
- 5.8 Supply-Demand Gap and Bottlenecks
- 5.9 Import Dependence and Sourcing Structure
- 5.10 Contract Manufacturing and Outsourcing
- 5.11 Regional Supply and Demand Concentration
Chapter 6 Australia Brewer's Spent Yeast Market Pricing Analysis
- 6.1 Pricing Structure and Measurement
- 6.2 Historical Pricing Trends, 2018-2025
- 6.3 Pricing Outlook, 2025-2035
- 6.4 Average Selling Price and Unit Economics
- 6.5 Pricing by Product and Market Segment
- 6.6 Geographic Pricing Differences
- 6.7 Key Input, Energy, Labor and Logistics Costs
- 6.8 Contract Pricing and Purchasing Models
- 6.9 Pricing Sensitivity and Competitive Positioning
- 6.10 Price, Margin and Profitability Implications
Chapter 7 Australia Brewer's Spent Yeast Market Dynamics
- 7.1 Market Growth Drivers
- 7.1.1 Demand-Side Drivers
- 7.1.2 Technology and Innovation Drivers
- 7.1.3 Infrastructure and Investment Drivers
- 7.1.4 Regulatory and Policy Drivers
- 7.2 Market Restraints
- 7.2.1 Cost and Affordability Constraints
- 7.2.2 Technology and Adoption Barriers
- 7.2.3 Supply Chain and Operational Constraints
- 7.3 Market Challenges
- 7.3.1 Competitive Pressure and Margin Erosion
- 7.3.2 Skills, Infrastructure and Implementation Gaps
- 7.4 Emerging Market Opportunities
- 7.5 Market Dynamics Impact and Time-Horizon Assessment
Chapter 8 Australia Brewer's Spent Yeast Value Chain Analysis
- 8.1 Industry Value Chain Overview
- 8.2 Upstream Suppliers and Critical Inputs
- 8.3 Technology and Component Providers
- 8.4 Manufacturing or Service Delivery
- 8.5 Distribution, Channel Partners and Integrators
- 8.6 Downstream Applications and End Users
- 8.7 Value Addition and Profit Pools
- 8.8 Vertical Integration and Outsourcing
- 8.9 Supplier Concentration and Risk
- 8.10 Supply Chain Localization and Resilience
Chapter 9 Australia Brewer's Spent Yeast Market Regulations and Policies
- 9.1 Relevant Laws, Standards and Compliance Frameworks
- 9.2 Product, Service, Safety and Quality Requirements
- 9.3 Government Policies, Incentives and Subsidies
- 9.4 Imports, Exports and Trade Barriers
- 9.5 Public Procurement and Local Content Requirements
- 9.6 Environmental and Sustainability Compliance
- 9.7 Upcoming Policy Changes and Market Implications
Chapter 10 Australia Brewer's Spent Yeast Market Hotspots and Opportunities
- 10.1 Market Opportunity Mapping and Growth Hotspots
- 10.2 High-Growth Applications and Customer Groups
- 10.3 Underserved Markets and White-Space Opportunities
- 10.4 Emerging Technology and Product Opportunities
- 10.5 New Capacity and Investment Hotspots
- 10.6 Market Entry and Expansion Opportunities
- 10.7 Distribution and Partnership Opportunities
- 10.8 Near-Term and Long-Term Commercial Potential
- 10.9 Opportunity Attractiveness and Execution Risks
Chapter 11 Australia Brewer's Spent Yeast Market Outlook, 2025-2035
- 11.1 Market Size and Analysis
- 11.1.1 Revenue (Market Measurement: 2025: USD 10.5 million → 2035: USD 33.3 million)
- 11.1.2 Market Volume and Quantity Sold
- 11.1.3 Historical Market Size, 2018-2025
- 11.1.4 Base-Year Market Size, 2025
- 11.2 Market Forecast, 2025-2035
- 11.2.1 Revenue Forecast to 2035
- 11.2.2 Volume Forecast to 2035
- 11.2.3 CAGR and Year-on-Year Growth
- 11.2.4 Incremental Revenue Opportunity
- 11.3 Forecast Assumptions and Scenario Analysis
- 11.3.1 Base-Case Forecast
- 11.3.2 Optimistic and Conservative Scenarios
- 11.3.3 Technology, Pricing and Policy Sensitivities
- 11.4 Market Attractiveness and Growth Outlook
Chapter 12 Australia Brewer's Spent Yeast Market Segmentation and Outlook
- 12.1 Segmentation Summary and Market Shares, 2025
- 12.2 Largest and Fastest-Growing Segments
- 12.3 By Product Type - Market Size and Forecast, 2025-2035
- 12.3.1 Segment Definition and Scope
- 12.3.2 Historical Market Size, 2018-2025
- 12.3.3 Revenue Forecast, 2025-2035
- 12.3.4 Volume Forecast, 2025-2035
- 12.3.5 Base-Year Market Share, 2025
- 12.3.6 Segment CAGR and Growth Drivers
- 12.3.7 Subsegment Market Size and Forecast
- 12.3.7.1 Liquid Yeast Slurry
- 12.3.7.2 Dewatered Yeast Cake
- 12.3.7.3 Dried Whole Yeast
- 12.3.7.4 Yeast-Derived Fractions
- 12.3.8 Subsegment Pricing and Adoption Trends
- 12.3.9 Leading Suppliers and Competition
- 12.3.10 Regional Demand and Opportunities
- 12.4 By Application - Market Size and Forecast, 2025-2035
- 12.4.1 Segment Definition and Scope
- 12.4.2 Historical Market Size, 2018-2025
- 12.4.3 Revenue Forecast, 2025-2035
- 12.4.4 Volume Forecast, 2025-2035
- 12.4.5 Base-Year Market Share, 2025
- 12.4.6 Segment CAGR and Growth Drivers
- 12.4.7 Subsegment Market Size and Forecast
- 12.4.7.1 Animal Feed and Aquaculture
- 12.4.7.2 Food Ingredients
- 12.4.7.3 Human Nutrition and Specialty Uses
- 12.4.8 Subsegment Pricing and Adoption Trends
- 12.4.9 Leading Suppliers and Competition
- 12.4.10 Regional Demand and Opportunities
- 12.5 By Customer Type - Market Size and Forecast, 2025-2035
- 12.5.1 Segment Definition and Scope
- 12.5.2 Historical Market Size, 2018-2025
- 12.5.3 Revenue Forecast, 2025-2035
- 12.5.4 Volume Forecast, 2025-2035
- 12.5.5 Base-Year Market Share, 2025
- 12.5.6 Segment CAGR and Growth Drivers
- 12.5.7 Subsegment Market Size and Forecast
- 12.5.7.1 Feed Formulators
- 12.5.7.2 Food Ingredient Manufacturers
- 12.5.7.3 Specialty Product Manufacturers
- 12.5.7.4 Direct End Buyers
- 12.5.8 Subsegment Pricing and Adoption Trends
- 12.5.9 Leading Suppliers and Competition
- 12.5.10 Regional Demand and Opportunities
- 12.6 By Sales Channel - Market Size and Forecast, 2025-2035
- 12.6.1 Segment Definition and Scope
- 12.6.2 Historical Market Size, 2018-2025
- 12.6.3 Revenue Forecast, 2025-2035
- 12.6.4 Volume Forecast, 2025-2035
- 12.6.5 Base-Year Market Share, 2025
- 12.6.6 Segment CAGR and Growth Drivers
- 12.6.7 Subsegment Market Size and Forecast
- 12.6.7.1 Direct Contract Sales
- 12.6.7.2 Ingredient Distributor Sales
- 12.6.7.3 Spot Bulk Sales
- 12.6.7.4 Direct Packaged Sales
- 12.6.8 Subsegment Pricing and Adoption Trends
- 12.6.9 Leading Suppliers and Competition
- 12.6.10 Regional Demand and Opportunities
- 12.7 Segment Growth Comparison
- 12.8 Segment Attractiveness and Priority Matrix
Chapter 13 Australia Brewer's Spent Yeast End-Use and Application Market Outlook
- 13.1 End-Use Industry and Customer Demand Structure
- 13.2 Leading Applications and Customer Groups
- 13.3 End-Use Market Size, Share and Forecast
- 13.4 Major End-Use Industry Deep Dives
- 13.4.1 Customer Requirements and Use Cases
- 13.4.2 Demand and Replacement Cycles
- 13.4.3 Technical and Regulatory Considerations
- 13.4.4 Purchasing and Procurement Models
- 13.4.5 Leading Vendors and Distribution Channels
- 13.4.6 Forecast and Commercial Opportunities
- 13.5 Emerging Applications and Cross-Segment Demand
- 13.6 End-Use Industry Investment Priorities
Chapter 14 Australia Brewer's Spent Yeast Geographic Market Outlook, 2025-2035
- 14.1 Domestic Market Distribution and Demand Clusters
- 14.2 State- or Province-Wise Market Size and Forecast, 2025-2035
- 14.3 City and Metropolitan Market Outlook
- 14.4 Industrial, Manufacturing and Commercial Clusters
- 14.5 Geographic Concentration of Key End Users
- 14.6 Local Pricing and Purchasing Differences
- 14.7 Domestic Production Facilities and Capacity Map
- 14.8 Local Infrastructure and Project Pipeline
- 14.9 State-Level Policy and Incentive Differences
- 14.10 Subnational Investment Hotspots and Opportunities
- 14.11 Distribution and Logistics Networks
- 14.12 Domestic Competitive Footprint
Chapter 15 Australia Brewer's Spent Yeast Technology, Innovation and Sustainability Outlook
- 15.1 Technology Landscape and Maturity
- 15.2 Product, Process and Service Innovation
- 15.3 AI, Automation and Digital Tools in the Industry
- 15.4 Technology Adoption and Performance Benchmarking
- 15.5 Innovation Pipeline and R&D Investment
- 15.6 Patent and Intellectual Property Trends
- 15.7 Energy Efficiency and Resource Management
- 15.8 Sustainability, Recycling and Circularity
- 15.9 Technology Roadmap, 2025-2035
- 15.10 Risks of Obsolescence and Technology Substitution
Chapter 16 Australia Brewer's Spent Yeast Market Key Strategic Imperatives
- 16.1 Growth and Market Entry Priorities
- 16.2 High-Return Products and Segments
- 16.3 Pricing, Profitability and Cost Optimization
- 16.4 Technology Investment and Product Differentiation
- 16.5 Supply Chain Localization and Resilience
- 16.6 Distribution and Customer Acquisition
- 16.7 Partnership, Acquisition and Capacity Strategy
- 16.8 Regional Expansion Priorities
- 16.9 Short-, Medium- and Long-Term Actions
Chapter 17 Competition Outlook
- 17.1 Industry Competition Characteristics
- 17.2 Market Structure and Concentration
- 17.3 Market Share and Competitive Positioning, 2025
- 17.4 Company-Wise Revenue and Product Benchmarking
- 17.5 Production and Service Capacity Benchmarking
- 17.6 Technology, Pricing and Differentiation
- 17.7 Regional Footprint and Distribution Strength
- 17.8 Mergers, Acquisitions and Strategic Alliances
- 17.9 New Entrants and Competitive Threats
- 17.10 Porter's Five Forces and Industry Attractiveness
- 17.11 Competitive Outlook, 2025-2035
Chapter 18 Company Profiles
- 18.1 Company Coverage and Selection Criteria
- 18.2 Carlton & United Breweries
- 18.2.1 Business Description
- 18.2.2 Company Ownership and Geographic Presence
- 18.2.3 Product and Service Portfolio
- 18.2.4 Manufacturing and Operating Footprint
- 18.2.5 Production Capacity and Expansion Plans
- 18.2.6 Financial Performance and Investment
- 18.2.7 Market Share and Competitive Position
- 18.2.8 Technology and Innovation Capabilities
- 18.2.9 Strategic Alliances or Partnerships
- 18.2.10 Recent Developments
- 18.2.11 Growth Strategy and Outlook
- 18.3 Lion Pty Ltd
- 18.4 Coopers Brewery Ltd
- 18.5 AB Mauri
- 18.6 Lesaffre Group
- 18.7 Other Relevant Market Participants
Note: Every listed company is profiled on the structure shown under the first company. The company list is preliminary and may change based on research findings, market developments, data availability and client requirements.
Chapter 19 Disclaimer
- 19.1 Research and Forecast Disclaimer
- 19.2 Data Source and Estimation Limitations
Note: The depth of individual sections depends on data availability for this market. Volume, capacity, trade and other unit-based metrics are included where applicable.

