
Local mills and household staples anchor steady demand
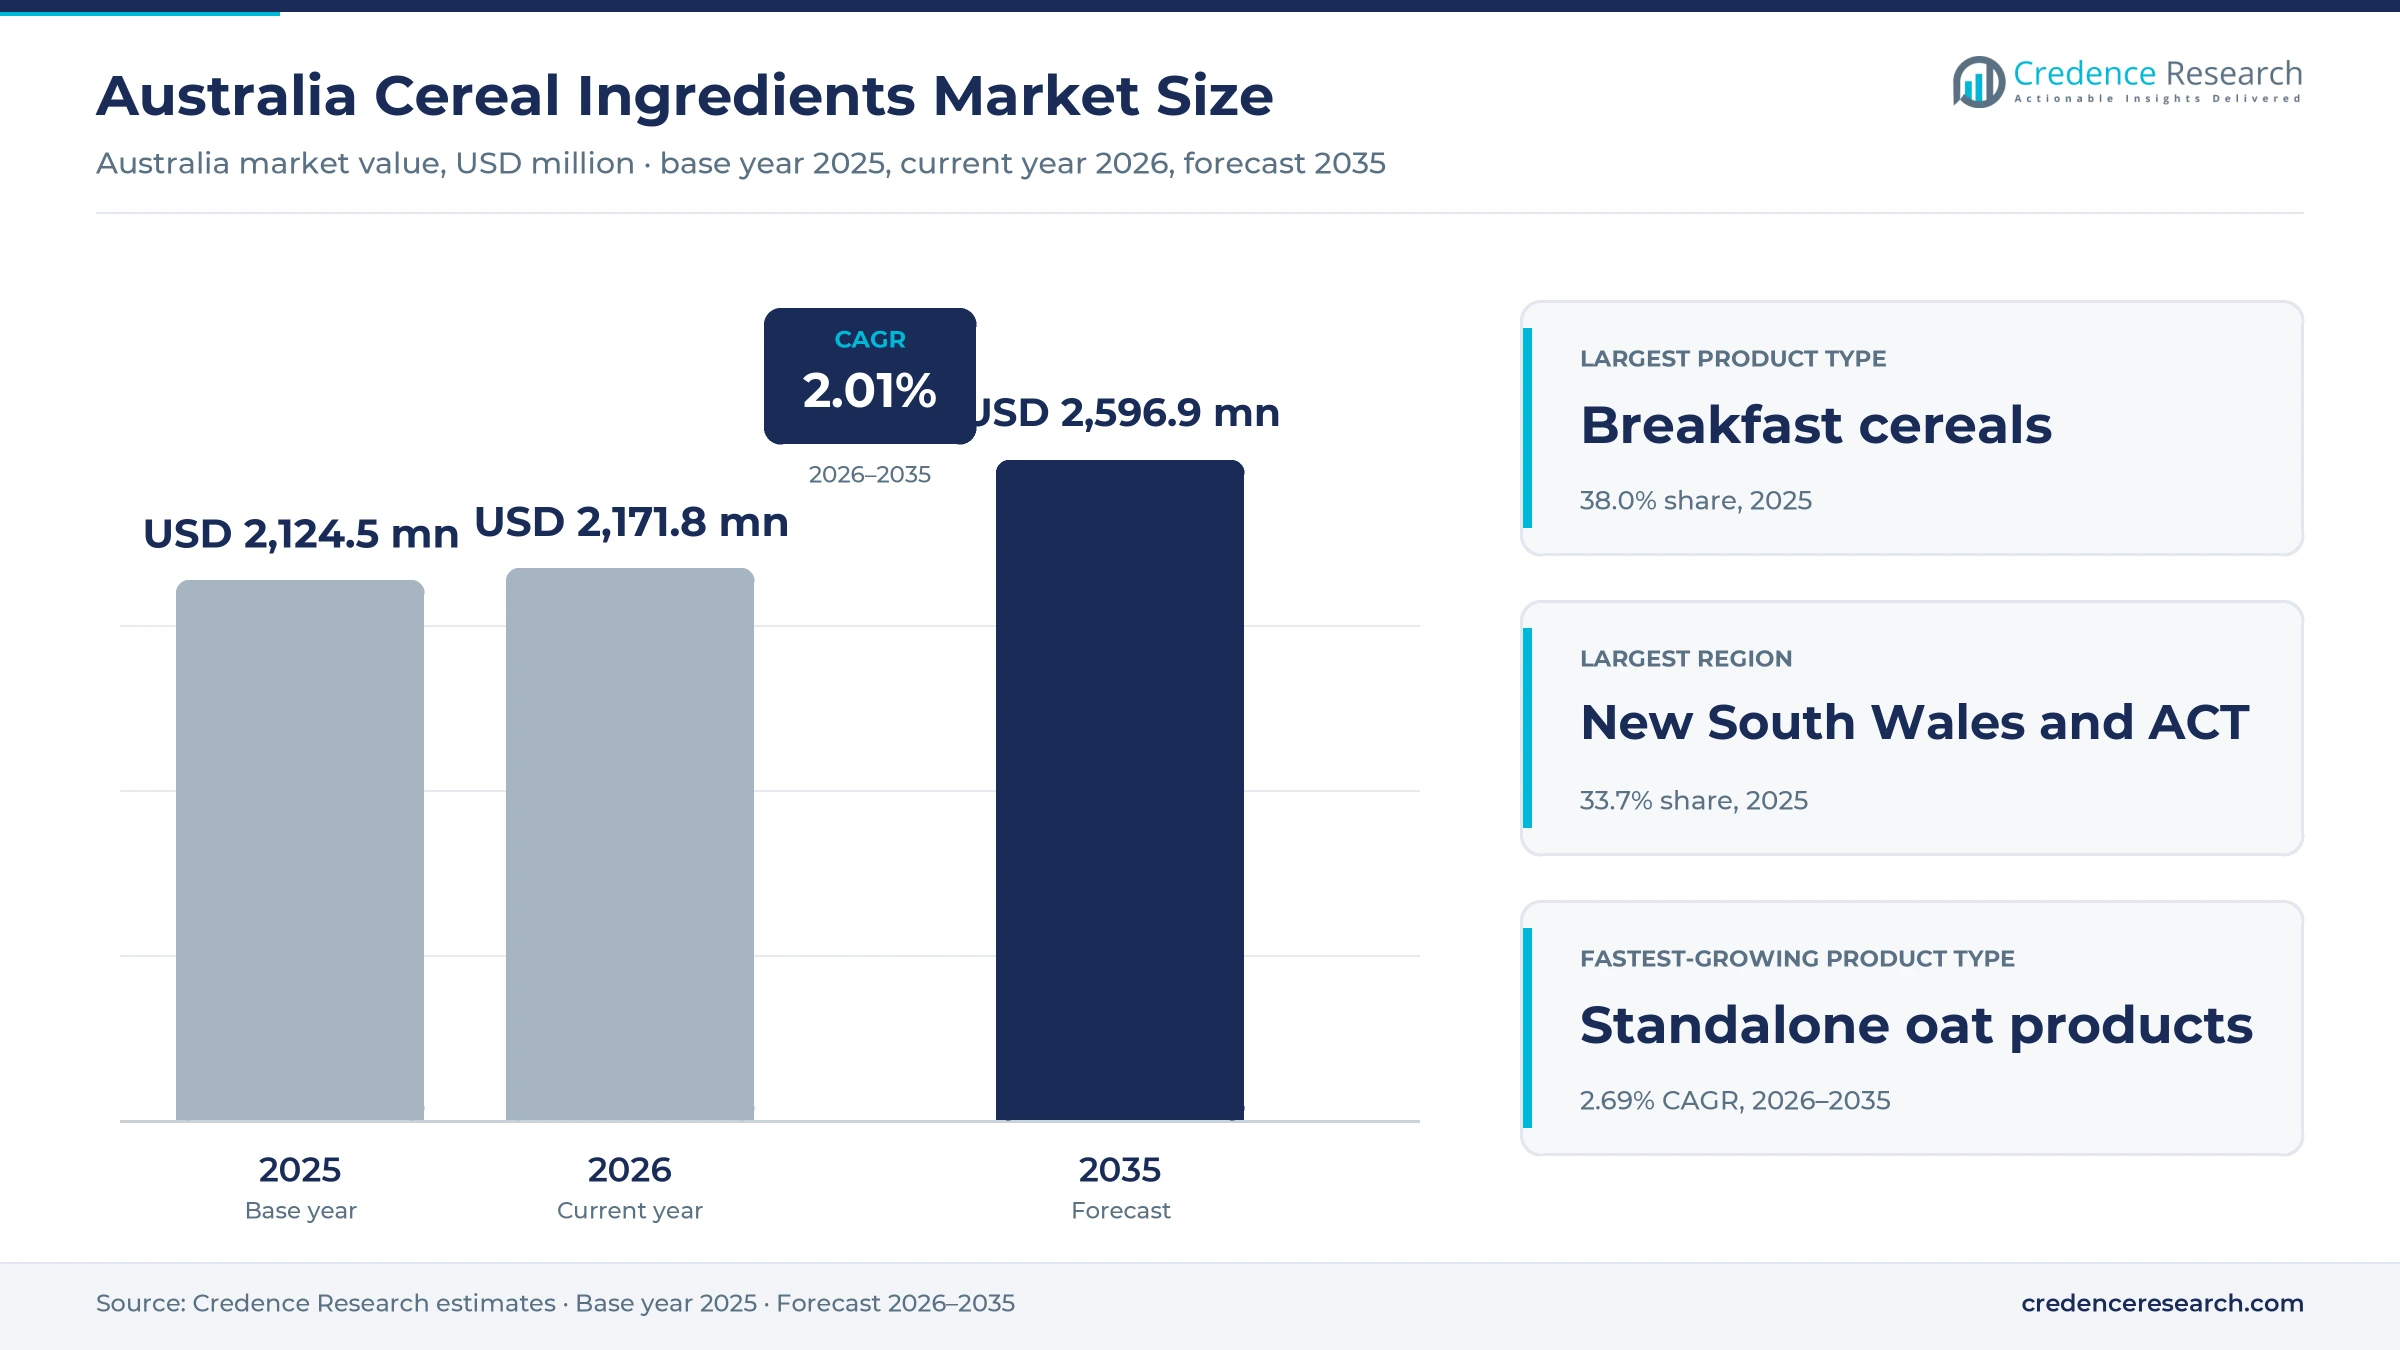
The Australia cereal ingredients market was valued at USD 2.12 billion in 2025 and is projected to increase from USD 2.17 billion in 2026 to USD 2.60 billion by 2035, registering a CAGR of 2.01% during 2026–2035. Demand comes from households that buy breakfast cereals, pasta, oats and snack bars every week, and from bakeries and food makers that buy premixes and specialty grain inputs. New South Wales and the Australian Capital Territory held the largest regional share, 33.7% in 2025, because the region hosts the largest population and long-running cereal plants in Botany and Berkeley Vale. Western Australia is the fastest-growing region at 2.36% a year, as its population grows quickly and the state holds most national oat milling capacity. The most important regulatory change came in February 2026, when food ministers asked the food standards agency to prepare a proposal to make the Health Star Rating mandatory on packaged foods.
Which grain-based foods and inputs does the estimate cover?
Credence Research measures the value of grain-based foods and processed grain inputs made or sold in Australia, including breakfast cereals, pasta and noodles, baking mixes and specialty inputs, standalone oat products and cereal bars and snacks. It covers wheat, oats, rice and maize and multigrain recipes supplied to supermarkets, food manufacturers and distributors.
The estimate excludes raw grain exports, animal feed, malting barley, bread sold through bakeries and fresh pasta made in restaurants. The value chain runs from growers and bulk handlers through flour and oat mills, cereal plants, pasta lines and co-packers to retailers, food manufacturers and foodservice buyers in each region.
Australia Cereal Ingredients Market Insights
- The Australia cereal ingredients market was valued at USD 2.12 billion in 2025 and is projected to reach USD 2.60 billion by 2035, registering a CAGR of 2.01% during 2026–2035.
- New South Wales and the Australian Capital Territory held a 33.7% share of 2025 value, supported by about 9.2 million residents in March 2026.
- Breakfast cereals led with a 38.0% share of 2025 value, because Kellogg's Botany plant alone makes about 42 million kilograms of cereal a year.
- Food ministers asked the food standards agency on Feb. 13, 2026, to prepare a proposal to mandate the Health Star Rating on packaged foods.
- Contract ingredient processing grows fastest at 2.76% a year during 2026–2035, as brand owners use co-packers to launch products without new plants.
Breakfast cereals lead while oat products grow fastest
Why do breakfast cereals hold the largest value?
Based on product type, the market is categorized into breakfast cereals, pasta and noodles, baking mixes and specialty cereal ingredients, standalone oat products and cereal bars and snacks. Breakfast cereals led with a 38.0% share of 2025 value, because flakes, biscuits and muesli remain weekly staples in most homes. Standalone oat products grow fastest at 2.69% a year, as porridge, rolled oats and oat sachets gain shelf space.
How does grain source shape cost and growth?
Based on grain source, the market is categorized into wheat, oats, rice and maize and multigrain and minor cereals. Wheat led with a 52.0% share of 2025 value, because wheat flakes, durum pasta and bakery premixes use it as the base grain. Multigrain and minor cereals grow fastest at 2.88% a year, as brands add barley, sorghum and seeds to meet whole grain claim levels.
Which sales channels move the most value?
Based on sales channel, the market is categorized into direct retail supply, direct manufacturing supply and distributor supply. Direct retail supply led with a 48.0% share of 2025 value, because cereal and pasta makers ship most packed goods straight to supermarket distribution centers. Direct manufacturing supply grows fastest at 2.33% a year, as bakeries, snack makers and dairy brands buy more flakes, oats and premixes as inputs.
How do operating models divide production?
Based on operating model, the market is categorized into manufacturer-owned brands, private-label manufacturing and contract ingredient processing. Manufacturer-owned brands led with a 62.0% share of 2025 value, because heritage brands such as Weet-Bix, Uncle Tobys and San Remo own their plants. Contract ingredient processing grows fastest at 2.76% a year, as start-up and retailer brands rent capacity at co-packers.
| Segment Group | Leading Sub-segment | Share, 2025 | Fastest-growing Sub-segment | CAGR, 2026–2035 |
|---|---|---|---|---|
| By Product Type | Breakfast cereals | 38.0% | Standalone oat products | 2.69% |
| By Grain Source | Wheat | 52.0% | Multigrain and minor cereals | 2.88% |
| By Sales Channel | Direct retail supply | 48.0% | Direct manufacturing supply | 2.33% |
| By Operating Model | Manufacturer-owned brands | 62.0% | Contract ingredient processing | 2.76% |
Request a Free Sample
Fill in your details and we'll send you a free sample report.
- Sample data tables & charts
- Research methodology
Reformulation, population growth and co-packing
How does whole grain reformulation lift product value?
Brands rework recipes to cut sodium and sugar while keeping taste and adding fiber, which lets them charge more for each pack. Breakfast cereal makers report progress under the voluntary Partnership Reformulation Program in June 2023 and June 2026, and the 13 named participants include Kellanova, Nestlé, Sanitarium and PepsiCo, according to the Department of Health. The Grains & Legumes Nutrition Council code lets a product claim high whole grain content only at 16 grams or more per serve, against a 48-gram daily target. Kellogg Australia reported in 2021 that it had removed more than 700 metric tons of sugar and 300 metric tons of salt from its range over 15 years. As a result, multigrain and minor cereals grow at 2.88% a year.
Why does population growth keep replenishment demand steady?
Each new household adds weekly purchases of cereal, pasta and oats, which gives staple brands a base of volume that rises every year. Australia had 27,921,150 residents on March 31, 2026, after growth of 1.4% or 392,700 people in a year, according to the Australian Bureau of Statistics. Net overseas migration added 292,100 people in that year, while natural increase added 100,600. Population growth was 1.5% in 2025 and 2.0% in 2024, according to the World Bank, which is fast for a high-income country. In turn, breakfast cereals keep 38.0% of 2025 value, because staple brands gain volume as more families stock their pantries each week.
How does flexible co-manufacturing widen supply?
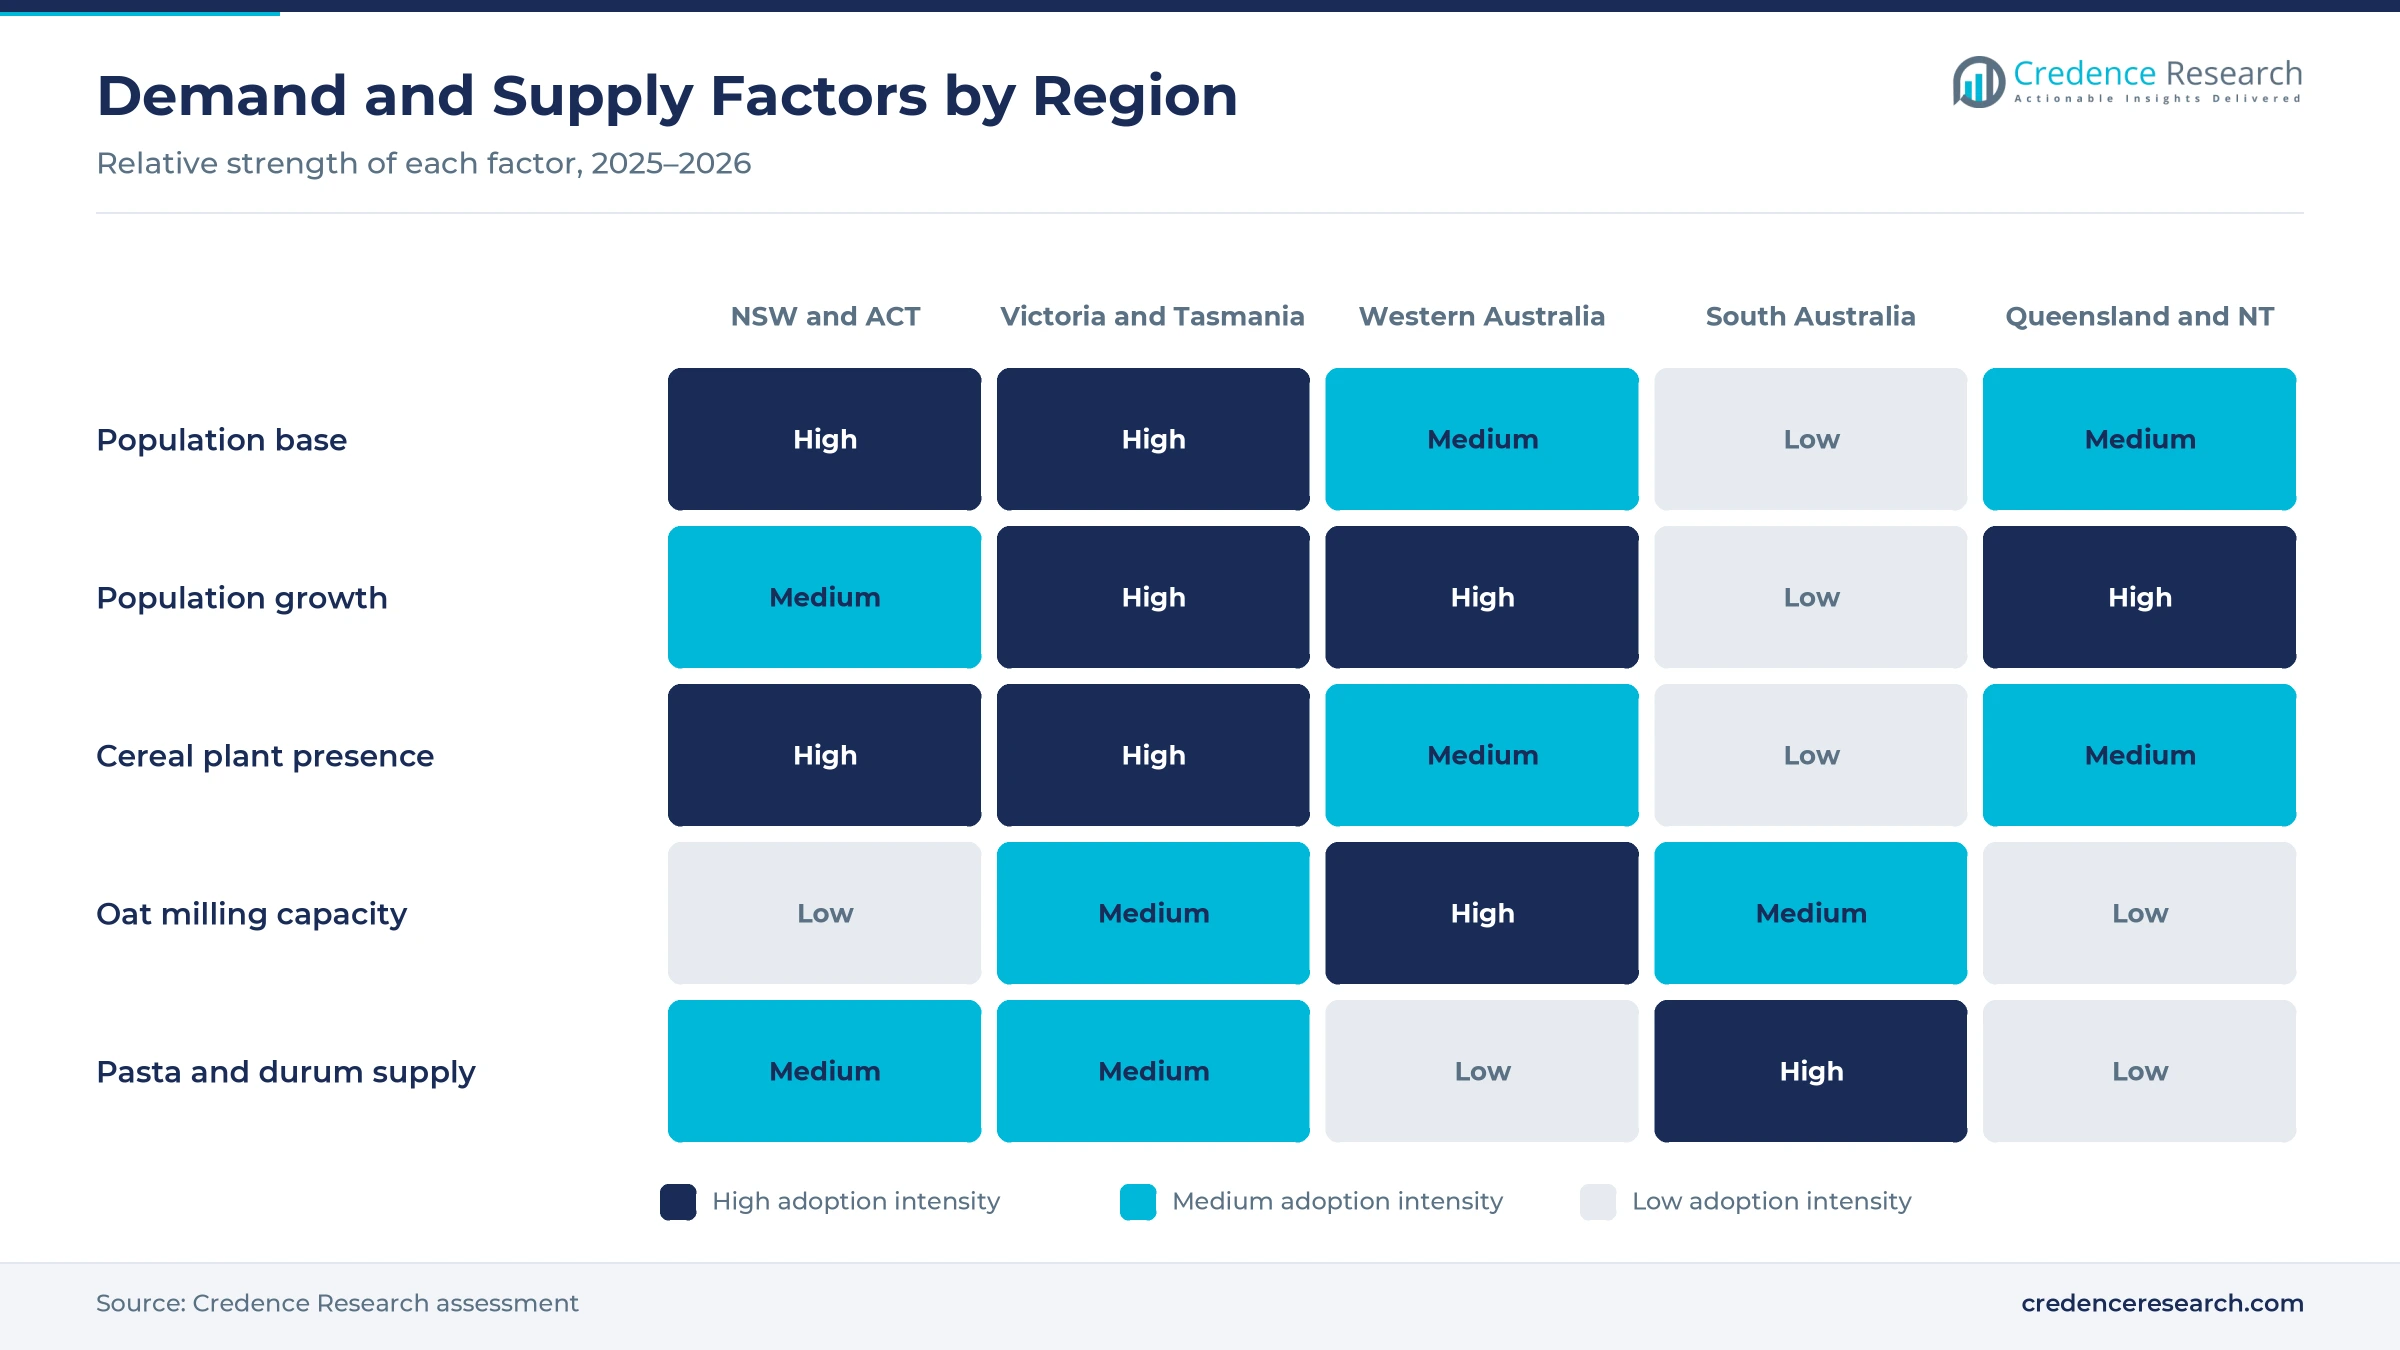
Brand owners can now launch muesli, granola and bars without building their own plants, because contract sites in Melbourne keep spare capacity for other brands. Grain & Bake runs a 10,000 square meter site in Melbourne that can make about 6,000 metric tons of toasted cereal and up to 100 million snack bars a year, according to Food Magazine. The family company also holds an AA grade food safety certification and keeps about 40% of its floor space free for expansion. The Arnott's Group opened a 45,000 square meter plant in Rowville on Feb. 21, 2025, with yearly capacity for 300 million bowls of cereal and muesli, according to Process Online. As a result, contract ingredient processing grows at 2.76% a year, the fastest operating model.
Why does local milling capacity support domestic supply?
Cereal and pasta makers can buy oats, flour and semolina close to their plants, which cuts freight costs and shields them from import delays. National oat food milling capacity is about 495,000 metric tons, and Western Australia holds about 60% of it, according to the Australian Export Grains Innovation Centre. Unigrain, Blue Lake Milling, PepsiCo and Nestlé are the largest oat millers by capacity. Kellogg's Botany plant sources more than 87% of its ingredients in Australia, including corn, wheat, rice and oats, according to Food & Drink Business. San Remo makes most of its pasta in Windsor Gardens from Australian-grown durum wheat. In turn, wheat keeps 52.0% of 2025 value, the largest share of any grain source.
Oat expansion, label rules and contract capacity
How is the rise of oats changing grain supply?
Growers are planting more milling oats as food demand and prices improve, which gives mills a larger and cheaper local supply. Western Australian growers were forecast to plant 365,000 hectares of oats in 2025, up from just over 320,000 hectares in 2024, according to Farm Weekly. Milling oats traded at about A$380 to A$400 a metric ton, which made them competitive with wheat at about A$370 a metric ton. The Grain Industry Association of Western Australia estimated the 2025 state oat harvest at 1,017,500 metric tons in February 2026. Buyers also want more oats for porridge, muesli, oat milk and oat-based noodles. As a result, standalone oat products grow at 2.69% a year, the fastest product type.
Why is the shift toward mandatory front-of-pack labels notable?
A compulsory star rating would expose weaker recipes on every cereal box, so brands with high sugar or sodium face pressure to reformulate. Health Star Rating uptake reached only 39% of intended products in Australia against a 70% target, so ministers asked for a proposal to mandate the system, according to the Food Ministers' Meeting communiqué. The standards agency has opened proposal P1067 and plans two rounds of public consultation. Kellogg had already created more than 100 cereals for special diets, including Special K High Protein and gluten-free lines, by 2021. In turn, brands that reformulate early can protect shelf space in dried pasta and noodle aisles and breakfast bays.
Can private-label and contract capacity open new revenue?
Retailers and new brands want products made locally without owning a plant, which gives co-packers a steady pipeline of new contracts. Grain & Bake describes its mission as supporting brands to market, and it runs a 24-hour, five-day operation with more than 80 full-time staff. The Rowville plant also makes 180 million muesli and protein bars and 40 million oat sachets a year for brands such as Freedom Cereals. Mars said in May 2026 that about 90% of the products it sells in Australia are made locally. As a result, private-label manufacturing grows at a faster pace than owned brands, while makers of granola bars gain more co-packing options.
Is there room to grow from a larger 2026 harvest?
Cheaper and more plentiful grain eases input costs for mills and food makers, which frees margin for new products and promotions. The national wheat crop forecast rose to 29.9 million metric tons in September 2026, up from 26.7 million metric tons in June, according to Grain Central. New South Wales was forecast to grow 7.7 million metric tons and Victoria 4.9 million metric tons of wheat. South Australia's winter crop forecast rose to 11.3 million metric tons, 28% above the five-year average, according to the state primary industries department. In turn, pasta, flour and premix makers can secure local grain for frozen bakery goods and dry staples.
Price pressure, label costs and seasonal grain risk
How does supermarket price pressure squeeze margins?
A few national chains buy most packed cereal and pasta and push for promotions, which squeezes supplier margins. As a result, brand owners face higher costs for grain, energy and packaging while shelf prices rise slowly. Companies respond with leaner plants, smaller pack sizes and more premium lines that carry higher value per kilogram. This pressure hits mid-sized brands the hardest, because they lack the scale of the largest cereal and pasta makers.
Why do label rules raise compliance costs?
A mandatory star rating and reformulation targets require new testing, artwork and recipes, which raises compliance costs for makers. In turn, smaller makers must spend scarce funds on nutrition analysis and packaging changes for many product lines. Larger brands can spread these costs across high volumes, which widens the gap with smaller rivals. Co-packers and ingredient suppliers can help by offering tested base recipes that already meet target levels.
How does seasonal grain risk affect supply?
Drought or heavy rain can cut yields and lower milling quality in key regions, which leaves mills short of high-grade grain in poor seasons. The September 2026 forecast noted poor conditions in northern New South Wales and most of Queensland, even as southern crops improved. As a result, mills may pay more for high-grade oats and durum in dry years. Companies respond with forward contracts, wider sourcing regions and larger grain storage at their plants.
Why does import competition limit oat pricing?
Cheaper Russian oats compete with Australian grain in Asian markets, which limits the prices that local oat millers can charge. In turn, Australian millers must balance export sales with supply for local cereal and porridge brands. This pressure can reduce the premium that growers earn for milling grades in weak years. Millers respond by stressing quality, traceability and blends that suit specific customers in Asia and at home.
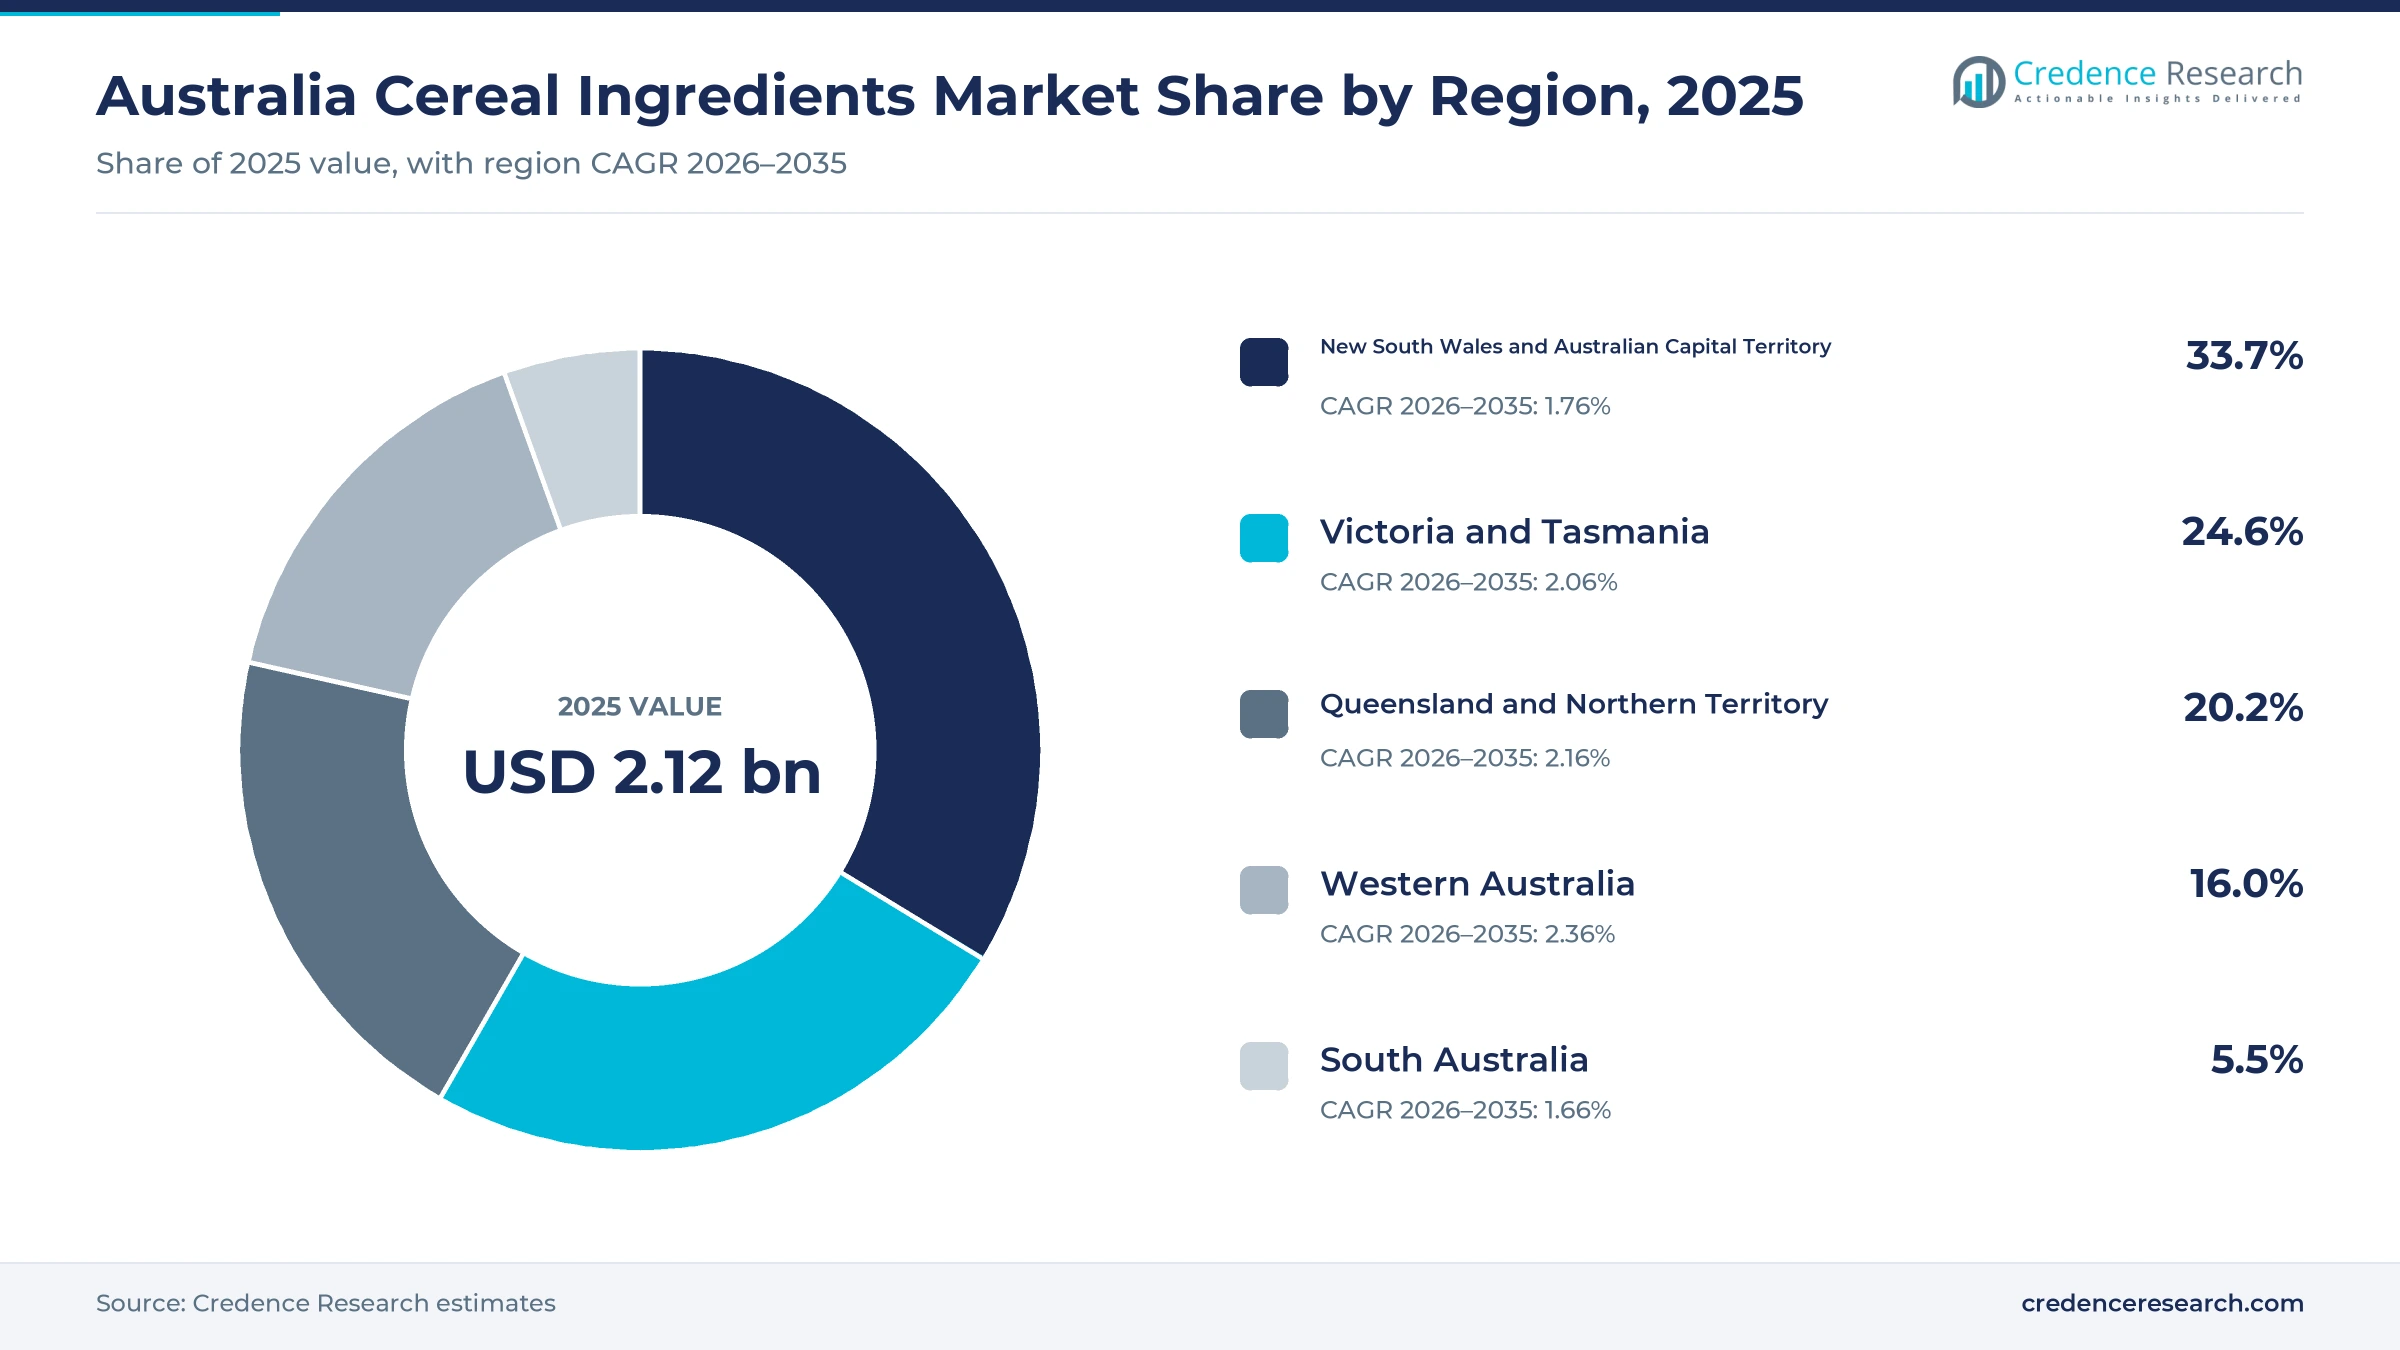
Eastern cereal plants lead as western oat mills gain pace
| Region | Value, 2025 (USD billion) | Share, 2025 | CAGR, 2026–2035 |
|---|---|---|---|
| New South Wales and Australian Capital Territory | 0.72 | 33.7% | 1.76% |
| Victoria and Tasmania | 0.52 | 24.6% | 2.06% |
| Queensland and Northern Territory | 0.43 | 20.2% | 2.16% |
| Western Australia | 0.34 | 16.0% | 2.36% |
| South Australia | 0.12 | 5.5% | 1.66% |
What makes Botany and Berkeley Vale the core of supply?
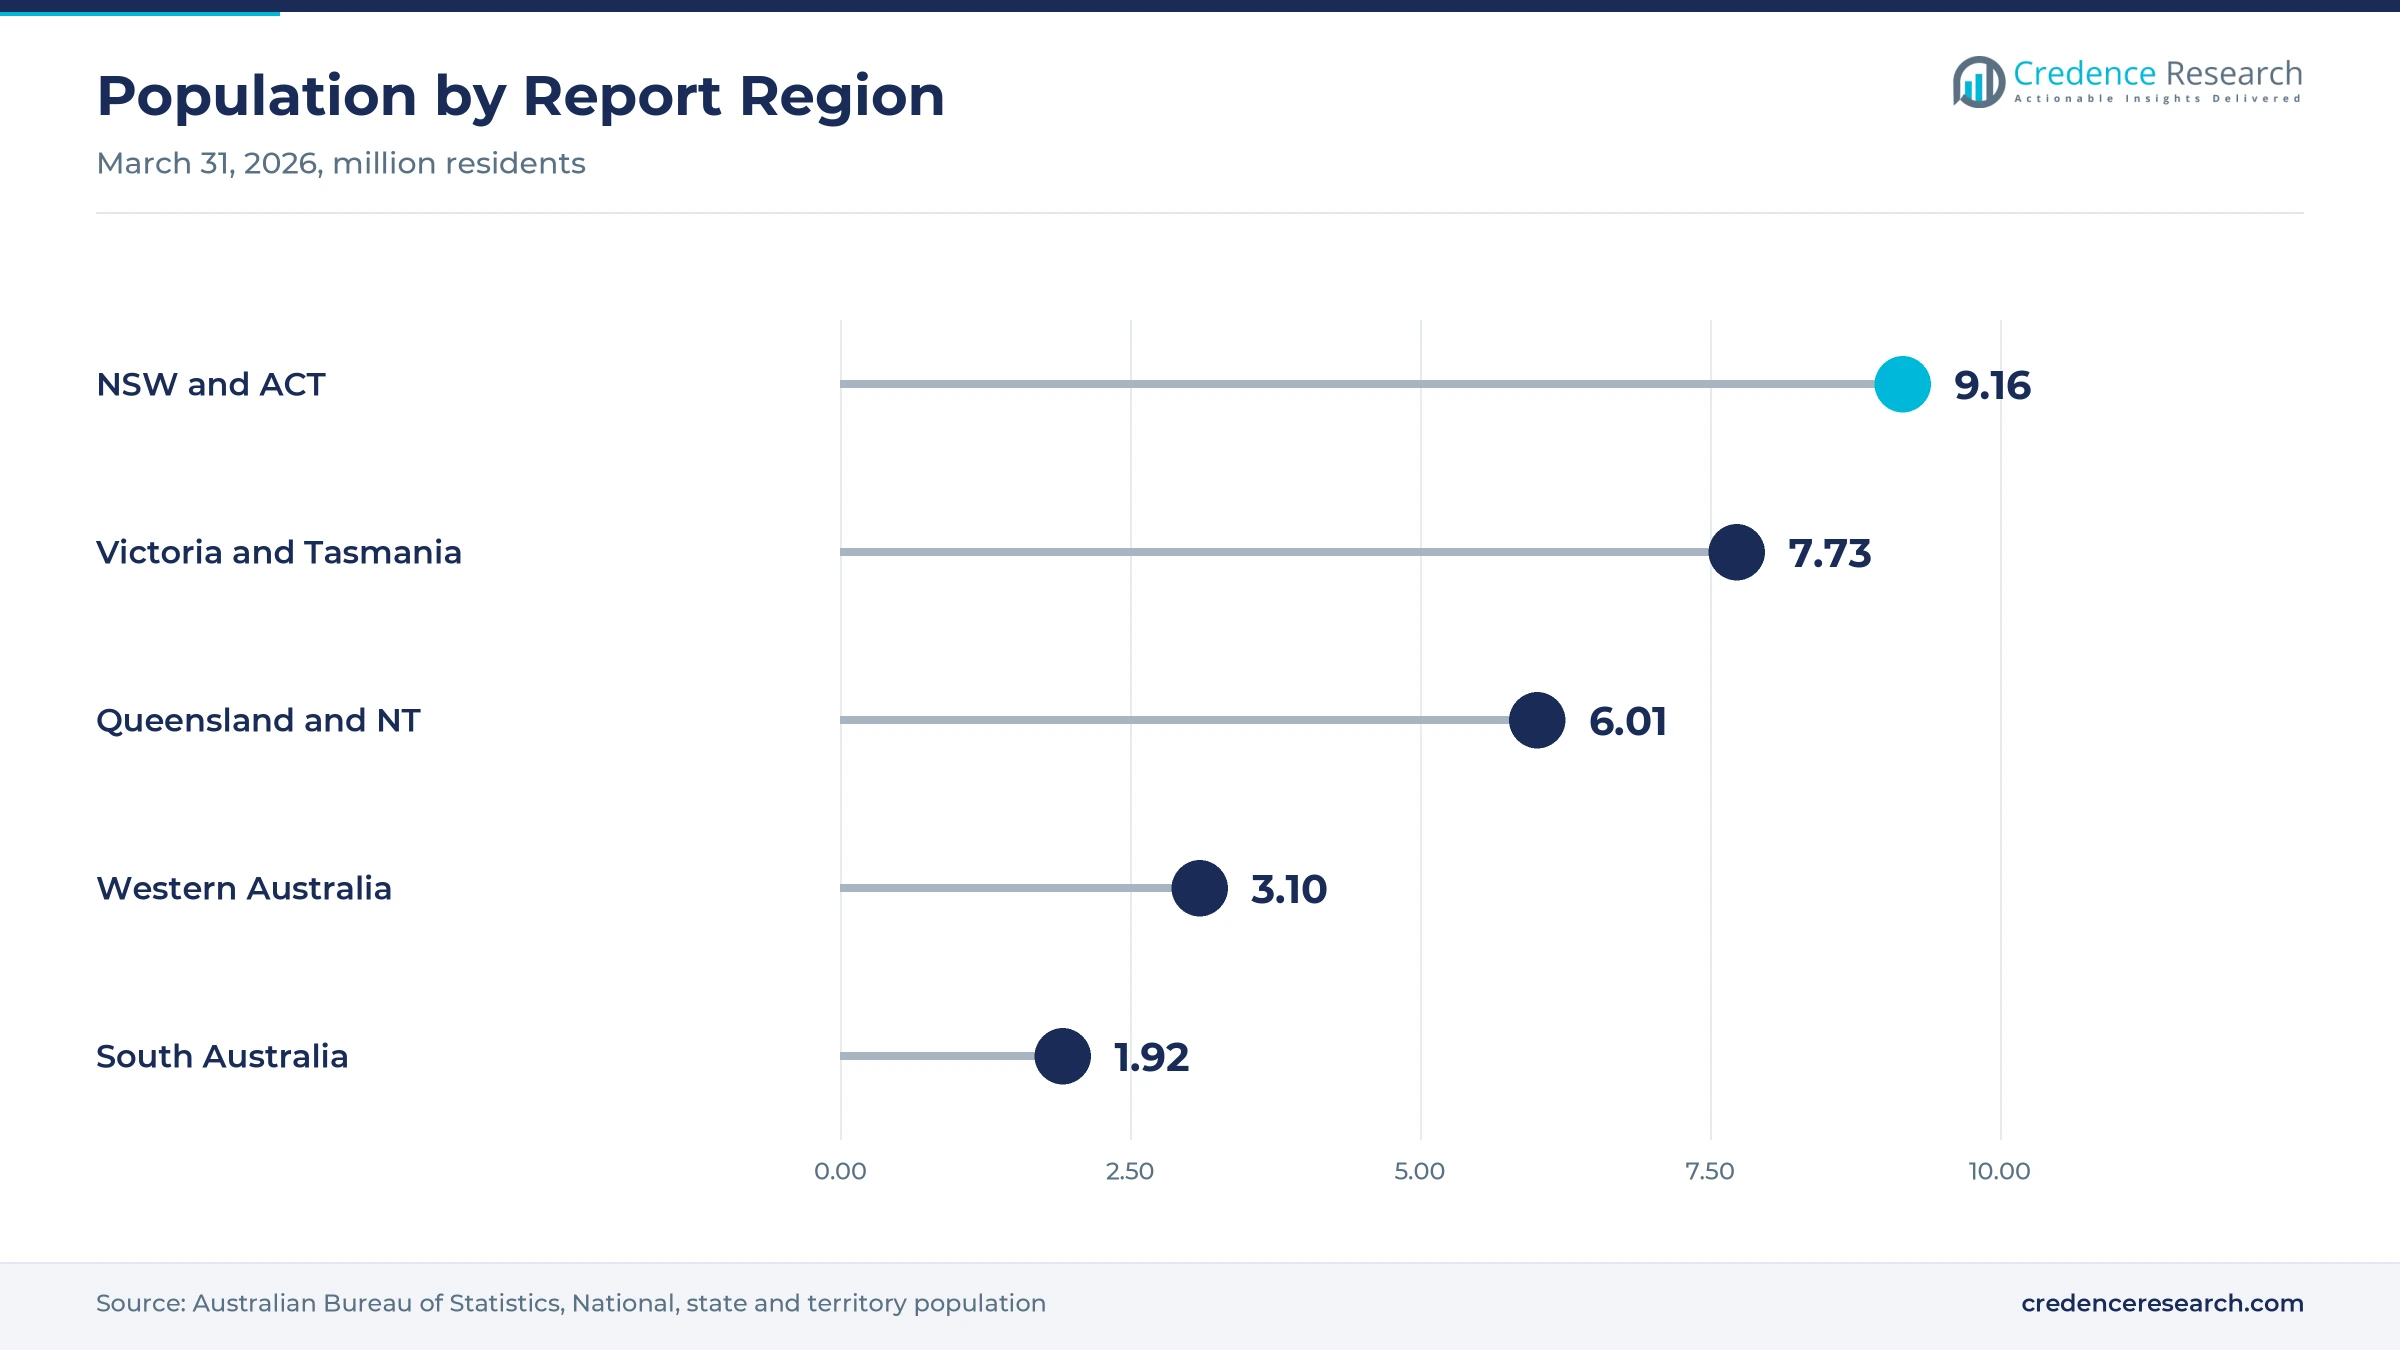
New South Wales and the Australian Capital Territory held a 33.7% share of 2025 value and grow at 1.76% a year, because the region had about 9.2 million residents in March 2026. Kellogg has made cereal at Botany since 1928, and the plant is the only Australian maker of Nutri-Grain. Sanitarium makes Weet-Bix and other cereals at its national headquarters in Berkeley Vale on the Central Coast. As a result, the region remains the largest center for packed cereal production and sales.
How do Victoria and Tasmania support oat and pasta output?
Victoria and Tasmania held a 24.6% share of 2025 value and grow at 2.06% a year, because the region combines 7.7 million residents with major oat and pasta plants. Uncle Tobys mills more than 26,000 metric tons of Australian oats a year at Wahgunyah, where about 450 people work. Rinoldi has made pasta since 1878 and runs a factory in Mulgrave, while Grain & Bake and the Rowville plant add cereal and bar capacity in Melbourne. In turn, the region supplies many national brands from its plants.
What keeps demand rising in the north?
Queensland and the Northern Territory held a 20.2% share of 2025 value and grow at 2.16% a year, because Queensland's population grew 1.6% to 5,739,500 in the year to March 2026. Sanitarium named a Queensland plant among its three Weet-Bix production sites in 2018, which shortens supply routes to northern stores. Queensland was forecast to grow 1.21 million metric tons of wheat in 2026, although dry conditions weighed on parts of the state. As a result, steady household growth supports sales of packed staples.
How do oat mills and migration lift western demand?
Western Australia held a 16.0% share of 2025 value and grows fastest at 2.36% a year, because its population grew 2.1% to 3,096,200 in the year to March 2026, the fastest rate of any state. The state also holds about 60% of national oat milling capacity, including the Quaker mill at Forrestfield that opened in 2015 at a cost of A$30 million. Sanitarium also makes Weet-Bix at Carmel, its plant in Western Australia. In turn, oat flakes and oat-based products drive local growth.
How does South Australia contribute pasta and oat supply?
South Australia held a 5.5% share of 2025 value and grows at 1.66% a year, because the state has a smaller population of 1,916,800 but hosts major pasta and oat mills. San Remo makes most of its pasta at Windsor Gardens and helped develop southern durum varieties with the University of Adelaide. Blue Lake Milling runs an oat mill at Bordertown, and the state winter crop forecast reached 11.3 million metric tons in September 2026. As a result, the state supplies more than it consumes.
Factory openings, ownership changes and label rules
| Development | Status and market relevance |
|---|---|
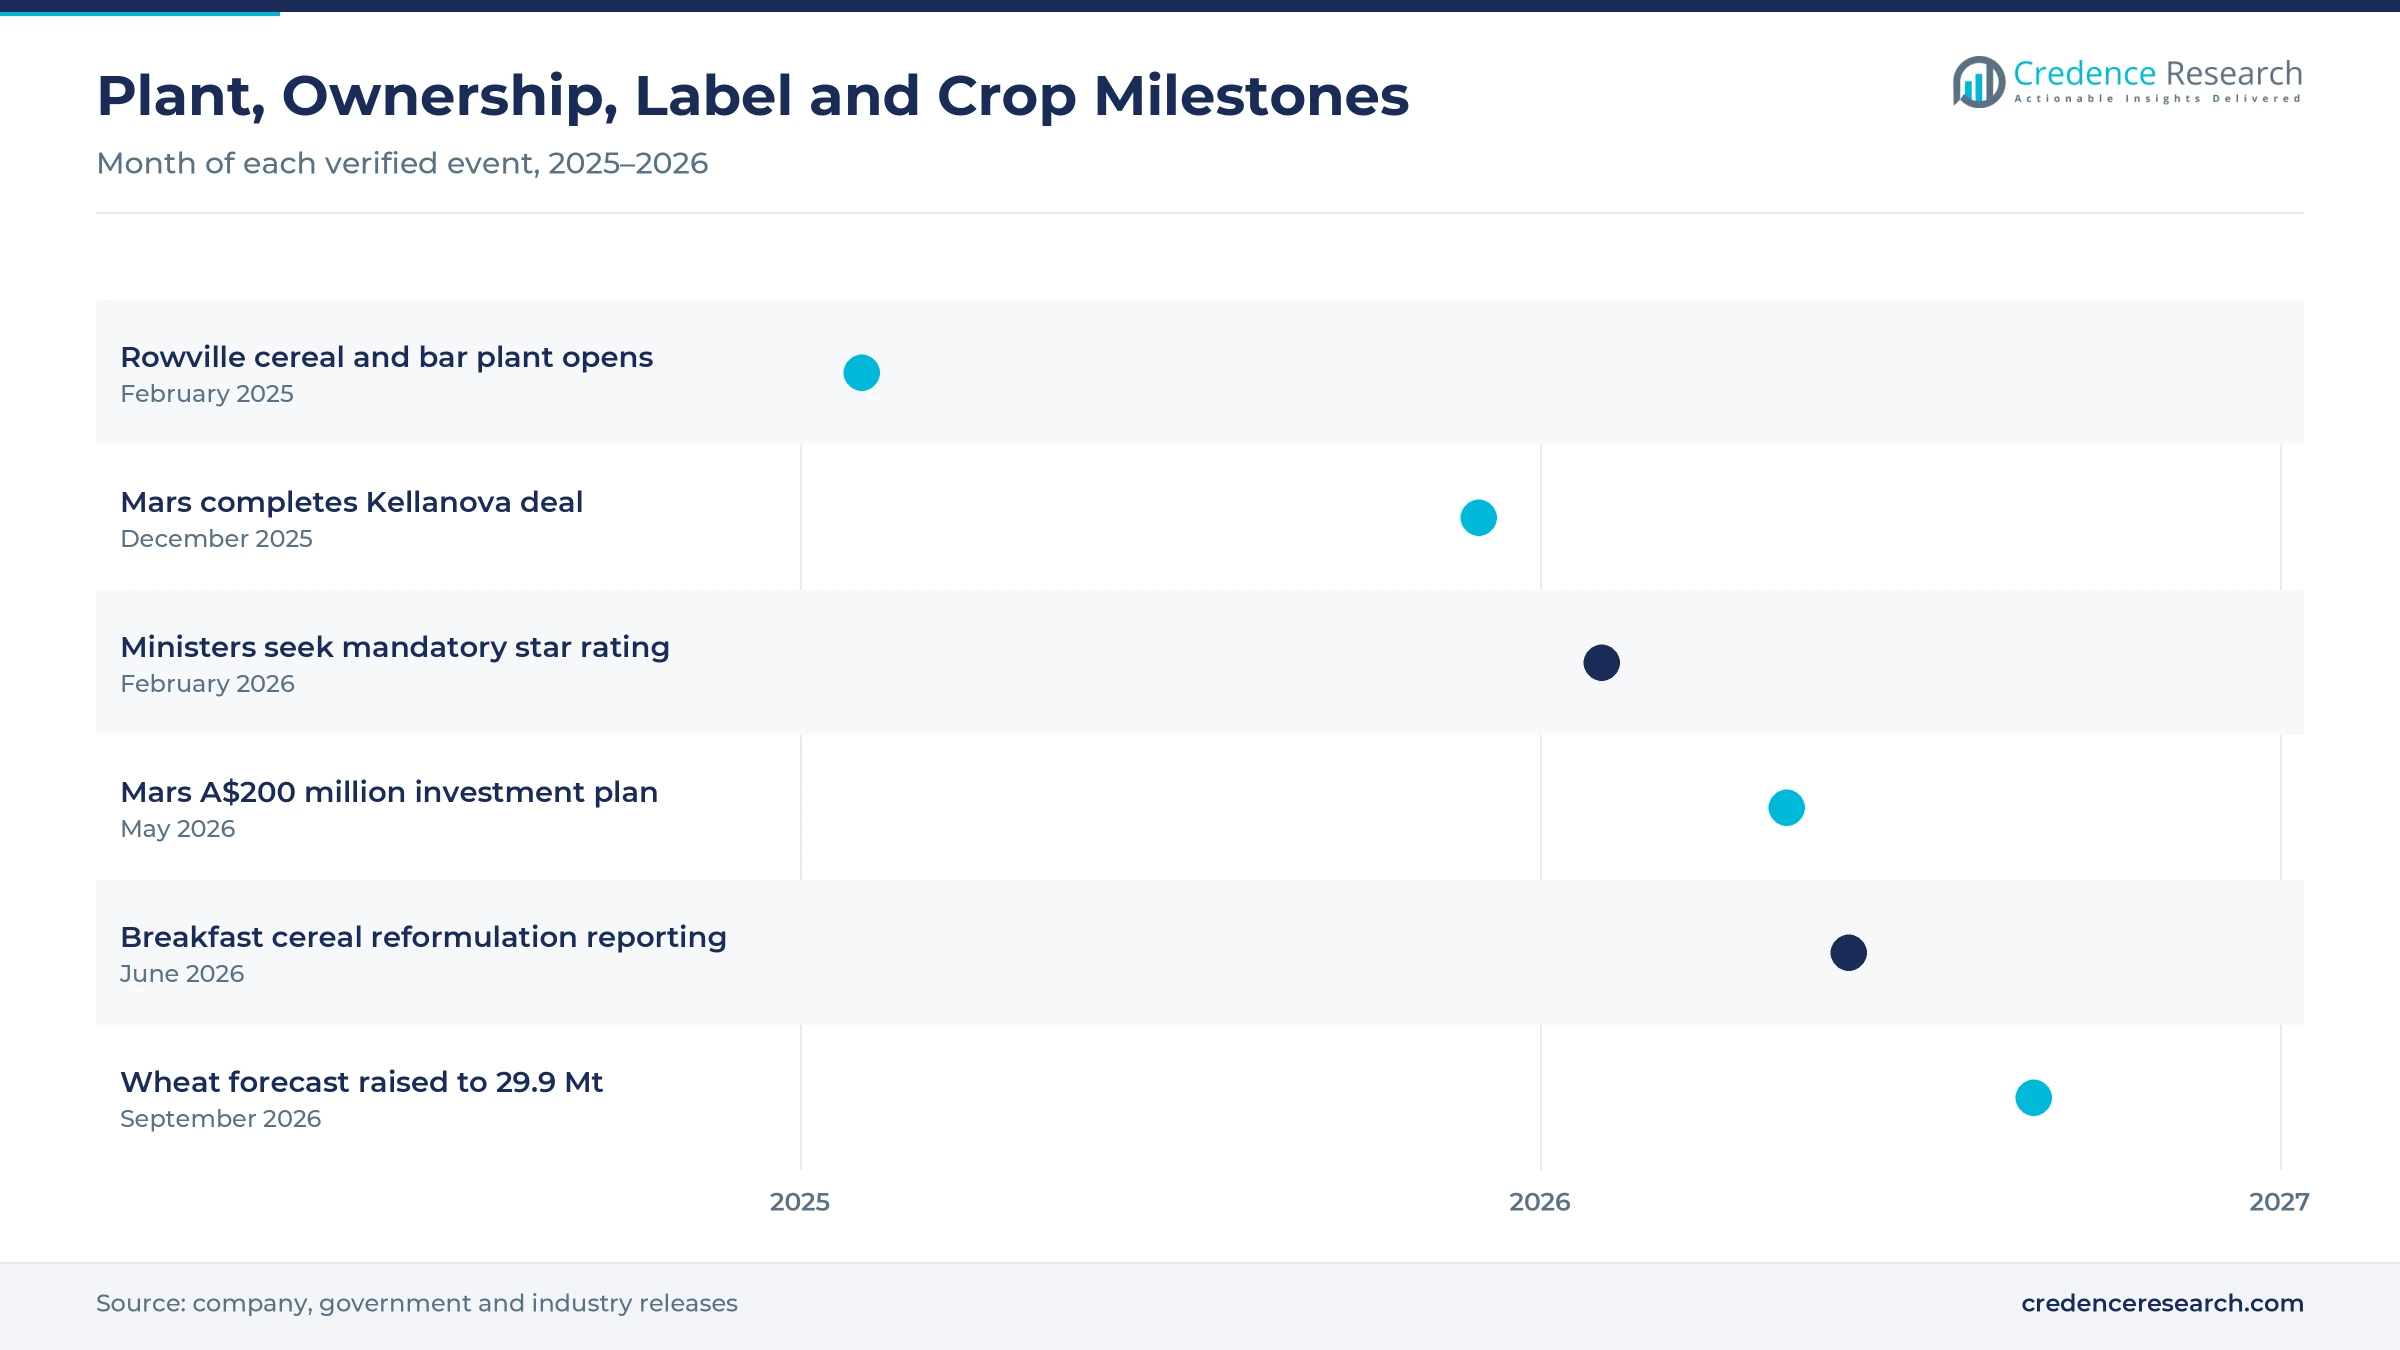
| In February 2025, The Arnott's Group opened a 45,000 square meter cereal, muesli and bar plant in Rowville, Victoria. | Adds large-scale capacity for cereals, oat sachets and bars |
| In December 2025, Mars completed its acquisition of Kellanova, bringing the Botany cereal plant into its Australian footprint. | Changes ownership of the largest Australian cereal brand portfolio |
| In February 2026, food ministers asked the food standards agency to prepare a proposal to mandate the Health Star Rating. | Could require star labels on every cereal and grain-based pack |
| In May 2026, Mars announced a A$200 million investment in its Australian manufacturing operations by the end of 2027. | Signals continued local manufacturing after the Kellanova deal |
| In September 2026, the national wheat crop forecast rose to 29.9 million metric tons from 26.7 million metric tons in June. | Improves grain availability for mills and pasta makers |
Milling, flaking and extrusion shape processing
- Milling and blending turns wheat, oats and durum into flour, semolina and premixes, and blending lines add whole grain, fiber and seeds to meet claim levels.
- Thermal flaking steams and rolls oats and wheat into flakes, which the Wahgunyah and Forrestfield mills use for rolled and quick oats.
- Baking and toasting uses impingement ovens to toast muesli and granola clusters, which co-packers run on long continuous lines.
- Extrusion and forming shapes pasta, puffed cereals and instant noodles, and lets makers adjust fiber, protein and sugar in each recipe.
Need a Custom Version of This Report?
Tailor the scope, geography, or segments to your exact requirements.
- Custom geography or segment scope
- Direct access to our analyst team
Heritage brands, oat millers and co-packers compete
Competition combines heritage cereal brands, specialist oat millers, pasta makers and contract manufacturers. Kellanova Australia, now owned by Mars, makes cereal at Botany and sources most of its grain locally. Sanitarium makes Weet-Bix in New South Wales, Queensland and Western Australia. Nestlé runs the Uncle Tobys oat mill at Wahgunyah, while Quaker Oats Australia operates the Forrestfield mill for local and export customers. Blue Lake Milling supplies oat flakes, bran and premixes from mills in South Australia, Victoria and Western Australia. San Remo and Rinoldi compete in dried pasta, while Australian Bakels supplies bakery mixes to craft and retail bakers. Grain & Bake makes muesli, granola and bars for other brands. Rivals compete on recipe quality, whole grain claims, price, retail placement and the ability to run short contract batches.
Which companies make grain-based foods in Australia?
| Company | Type | Role in the market |
|---|---|---|
| Kellanova Australia | Cereal brand owner | Makes about 42 million kilograms of cereal a year at Botany |
| Sanitarium | Cereal brand owner | Makes Weet-Bix in New South Wales, Queensland and Western Australia |
| Nestlé Australia cereal operations | Oat miller and brand owner | Mills more than 26,000 metric tons of oats a year at Wahgunyah |
| Quaker Oats Australia | Oat miller | Runs the Forrestfield oat mill opened in 2015 |
| Blue Lake Milling | Oat miller | Mills oats at Bordertown, Dimboola and Forrestfield |
| San Remo | Pasta maker | Makes most of its pasta at Windsor Gardens from Australian durum |
| Rinoldi | Pasta maker | Runs a pasta factory in Mulgrave, Victoria |
| Grain & Bake | Contract manufacturer | Makes toasted cereal and bars for other brands in Melbourne |
| Australian Bakels | Bakery ingredient supplier | Runs product development baking centers, with its largest site in New South Wales |
Credence Research view on Australian grain foods
Credence Research's view is that Australian grain-based food value will grow slowly but steadily, because population gains keep weekly staple demand rising while brands rework recipes for health labels. Breakfast cereals remain the largest pool, while oats, multigrain recipes and contract processing add the fastest growth. A mandatory star rating could reward early reformulators and penalize sugary lines. Western Australia gains the most from oat milling and fast population growth, while co-packers in Melbourne benefit as new brands avoid building plants.
How the national grain-based food estimate was built
The report uses 2025 as the base year on a calendar basis, and market values come from the Credence Research model. That model combines national population statistics, crop forecasts, oat milling capacity data, government program pages, company plant information and trade press reports on factory openings. Regional shares, segment splits and growth rates are Credence Research estimates based on population, milling capacity and plant locations. Sources used are international agency data, national statistics, government and regulator pages, industry body reports and company releases, and no interviews or surveys were used.
Oats, multigrain lines and contract work lead to 2035
The Australia cereal ingredients market is expected to reach USD 2.60 billion by 2035, a 2.01% CAGR during 2026–2035, as population growth supports weekly staple purchases and brands reformulate for health labels. Growth should be strongest in standalone oat products, multigrain recipes, contract processing and Western Australia, because these areas gain most from new capacity and changing diets. Supermarket price pressure, label costs and dry seasons could slow growth, while larger harvests may ease grain costs for mills and pasta makers.
Frequently Asked Questions
How big is the Australia cereal ingredients market?
Which product type leads Australian grain-based food sales?
Which region leads the market?
How do health labels affect cereal makers?
Why are oats growing quickly?
Why is contract manufacturing important?
Who are the leading companies in this market?
What are the main challenges for grain-based food makers?
Table of Content
Chapter 1 Market Segmentation
- 1.1 Segmentation Framework
- 1.1.1 Product and Service Classification
- 1.1.2 Application and End-Use Classification
- 1.1.3 Technology and Solution Classification
- 1.1.4 Customer and Distribution Channel Classification
- 1.1.5 Geographic Segmentation
- 1.1.6 Market Segment Definitions and Boundaries
- 1.2 By Product Type
- 1.2.1 Breakfast cereals
- 1.2.2 Pasta and noodles
- 1.2.3 Baking mixes and specialty cereal ingredients
- 1.2.4 Standalone oat products
- 1.2.5 Cereal bars and snacks
- 1.3 By Grain Source
- 1.3.1 Wheat
- 1.3.2 Oats
- 1.3.3 Rice and maize
- 1.3.4 Multigrain and minor cereals
- 1.4 By Sales Channel
- 1.4.1 Direct retail supply
- 1.4.2 Direct manufacturing supply
- 1.4.3 Distributor supply
- 1.5 By Operating Model
- 1.5.1 Manufacturer-owned brands
- 1.5.2 Private-label manufacturing
- 1.5.3 Contract ingredient processing
Chapter 2 Introduction
- 2.1 Report Objectives and Scope
- 2.2 Product Definition and Industry Terminology
- 2.3 Market Inclusions and Exclusions
- 2.4 Research Process
- 2.4.1 Primary Research and Expert Interviews
- 2.4.2 Secondary Research and Source Review
- 2.4.3 Top-Down and Bottom-Up Estimation
- 2.4.4 Data Triangulation and Verification
- 2.5 Market Size Measurement Basis
- 2.5.1 2025: USD 2.12 billion → 2035: USD 2.60 billion
- 2.6 Historical and Forecast Reference Periods
- 2.6.1 Historical Period: 2018-2025
- 2.6.2 Base Year: 2025
- 2.6.3 Forecast Period: 2025-2035
- 2.7 Research Assumptions and Limitations
Chapter 3 Executive Summary
- 3.1 Market Snapshot and Key Findings
- 3.2 Base-Year Market Size, 2025
- 3.3 Forecast Market Size, 2035
- 3.4 Revenue and Volume Growth Outlook
- 3.5 Key Demand and Supply Indicators
- 3.6 Leading Market Segments
- 3.7 Fastest-Growing Market Opportunities
- 3.8 Regional Performance Highlights
- 3.9 Technology and Industry Transformation
- 3.10 Competitive Landscape Summary
- 3.11 Analyst View and Strategic Implications
Chapter 4 Australia Cereal Ingredients Market Trends and Developments
- 4.1 Historical Industry Development, 2018-2025
- 4.2 Recent Market Trends and Developments
- 4.3 Demand and Customer Behavior Trends
- 4.4 Technology and Product Innovation
- 4.5 Artificial Intelligence, Automation and Digitalization
- 4.6 Local Manufacturing and Supply Chain Realignment
- 4.7 Industry Partnerships, Mergers and Acquisitions
- 4.8 Sustainability and Circular Economy Developments
- 4.9 Government and Private Sector Investment Trends
- 4.10 Emerging Business Models and Commercialization
- 4.11 Industry Developments and Announcements
Chapter 5 Australia Cereal Ingredients Market Production, Supply and Demand Analysis
- 5.1 Demand Trend and Consumption Analysis, 2018-2025
- 5.2 Demand Forecast, 2025-2035
- 5.3 Production and Output Trend, 2018-2025
- 5.4 Production and Output Forecast, 2025-2035
- 5.5 Installed Capacity and Capacity Utilization
- 5.6 Company-Wise Production Plants and Statistics
- 5.6.1 Installed Production Capacity
- 5.6.2 Actual Production
- 5.6.3 Planned Capacity and Expansion Targets
- 5.7 Supply Chain Structure and Procurement Trends
- 5.8 Supply-Demand Gap and Bottlenecks
- 5.9 Import Dependence and Sourcing Structure
- 5.10 Contract Manufacturing and Outsourcing
- 5.11 Regional Supply and Demand Concentration
Chapter 6 Australia Cereal Ingredients Market Pricing Analysis
- 6.1 Pricing Structure and Measurement
- 6.2 Historical Pricing Trends, 2018-2025
- 6.3 Pricing Outlook, 2025-2035
- 6.4 Average Selling Price and Unit Economics
- 6.5 Pricing by Product and Market Segment
- 6.6 Geographic Pricing Differences
- 6.7 Key Input, Energy, Labor and Logistics Costs
- 6.8 Contract Pricing and Purchasing Models
- 6.9 Pricing Sensitivity and Competitive Positioning
- 6.10 Price, Margin and Profitability Implications
Chapter 7 Australia Cereal Ingredients Market Dynamics
- 7.1 Market Growth Drivers
- 7.1.1 Demand-Side Drivers
- 7.1.2 Technology and Innovation Drivers
- 7.1.3 Infrastructure and Investment Drivers
- 7.1.4 Regulatory and Policy Drivers
- 7.2 Market Restraints
- 7.2.1 Cost and Affordability Constraints
- 7.2.2 Technology and Adoption Barriers
- 7.2.3 Supply Chain and Operational Constraints
- 7.3 Market Challenges
- 7.3.1 Competitive Pressure and Margin Erosion
- 7.3.2 Skills, Infrastructure and Implementation Gaps
- 7.4 Emerging Market Opportunities
- 7.5 Market Dynamics Impact and Time-Horizon Assessment
Chapter 8 Australia Cereal Ingredients Value Chain Analysis
- 8.1 Industry Value Chain Overview
- 8.2 Upstream Suppliers and Critical Inputs
- 8.3 Technology and Component Providers
- 8.4 Manufacturing or Service Delivery
- 8.5 Distribution, Channel Partners and Integrators
- 8.6 Downstream Applications and End Users
- 8.7 Value Addition and Profit Pools
- 8.8 Vertical Integration and Outsourcing
- 8.9 Supplier Concentration and Risk
- 8.10 Supply Chain Localization and Resilience
Chapter 9 Australia Cereal Ingredients Market Regulations and Policies
- 9.1 Relevant Laws, Standards and Compliance Frameworks
- 9.2 Product, Service, Safety and Quality Requirements
- 9.3 Government Policies, Incentives and Subsidies
- 9.4 Imports, Exports and Trade Barriers
- 9.5 Public Procurement and Local Content Requirements
- 9.6 Environmental and Sustainability Compliance
- 9.7 Upcoming Policy Changes and Market Implications
Chapter 10 Australia Cereal Ingredients Market Hotspots and Opportunities
- 10.1 Market Opportunity Mapping and Growth Hotspots
- 10.2 High-Growth Applications and Customer Groups
- 10.3 Underserved Markets and White-Space Opportunities
- 10.4 Emerging Technology and Product Opportunities
- 10.5 New Capacity and Investment Hotspots
- 10.6 Market Entry and Expansion Opportunities
- 10.7 Distribution and Partnership Opportunities
- 10.8 Near-Term and Long-Term Commercial Potential
- 10.9 Opportunity Attractiveness and Execution Risks
Chapter 11 Australia Cereal Ingredients Market Outlook, 2025-2035
- 11.1 Market Size and Analysis
- 11.1.1 Revenue (Market Measurement: 2025: USD 2.12 billion → 2035: USD 2.60 billion)
- 11.1.2 Market Volume and Quantity Sold
- 11.1.3 Historical Market Size, 2018-2025
- 11.1.4 Base-Year Market Size, 2025
- 11.2 Market Forecast, 2025-2035
- 11.2.1 Revenue Forecast to 2035
- 11.2.2 Volume Forecast to 2035
- 11.2.3 CAGR and Year-on-Year Growth
- 11.2.4 Incremental Revenue Opportunity
- 11.3 Forecast Assumptions and Scenario Analysis
- 11.3.1 Base-Case Forecast
- 11.3.2 Optimistic and Conservative Scenarios
- 11.3.3 Technology, Pricing and Policy Sensitivities
- 11.4 Market Attractiveness and Growth Outlook
Chapter 12 Australia Cereal Ingredients Market Segmentation and Outlook
- 12.1 Segmentation Summary and Market Shares, 2025
- 12.2 Largest and Fastest-Growing Segments
- 12.3 By Product Type - Market Size and Forecast, 2025-2035
- 12.3.1 Segment Definition and Scope
- 12.3.2 Historical Market Size, 2018-2025
- 12.3.3 Revenue Forecast, 2025-2035
- 12.3.4 Volume Forecast, 2025-2035
- 12.3.5 Base-Year Market Share, 2025
- 12.3.6 Segment CAGR and Growth Drivers
- 12.3.7 Subsegment Market Size and Forecast
- 12.3.7.1 Breakfast cereals
- 12.3.7.2 Pasta and noodles
- 12.3.7.3 Baking mixes and specialty cereal ingredients
- 12.3.7.4 Standalone oat products
- 12.3.7.5 Cereal bars and snacks
- 12.3.8 Subsegment Pricing and Adoption Trends
- 12.3.9 Leading Suppliers and Competition
- 12.3.10 Regional Demand and Opportunities
- 12.4 By Grain Source - Market Size and Forecast, 2025-2035
- 12.4.1 Segment Definition and Scope
- 12.4.2 Historical Market Size, 2018-2025
- 12.4.3 Revenue Forecast, 2025-2035
- 12.4.4 Volume Forecast, 2025-2035
- 12.4.5 Base-Year Market Share, 2025
- 12.4.6 Segment CAGR and Growth Drivers
- 12.4.7 Subsegment Market Size and Forecast
- 12.4.7.1 Wheat
- 12.4.7.2 Oats
- 12.4.7.3 Rice and maize
- 12.4.7.4 Multigrain and minor cereals
- 12.4.8 Subsegment Pricing and Adoption Trends
- 12.4.9 Leading Suppliers and Competition
- 12.4.10 Regional Demand and Opportunities
- 12.5 By Sales Channel - Market Size and Forecast, 2025-2035
- 12.5.1 Segment Definition and Scope
- 12.5.2 Historical Market Size, 2018-2025
- 12.5.3 Revenue Forecast, 2025-2035
- 12.5.4 Volume Forecast, 2025-2035
- 12.5.5 Base-Year Market Share, 2025
- 12.5.6 Segment CAGR and Growth Drivers
- 12.5.7 Subsegment Market Size and Forecast
- 12.5.7.1 Direct retail supply
- 12.5.7.2 Direct manufacturing supply
- 12.5.7.3 Distributor supply
- 12.5.8 Subsegment Pricing and Adoption Trends
- 12.5.9 Leading Suppliers and Competition
- 12.5.10 Regional Demand and Opportunities
- 12.6 By Operating Model - Market Size and Forecast, 2025-2035
- 12.6.1 Segment Definition and Scope
- 12.6.2 Historical Market Size, 2018-2025
- 12.6.3 Revenue Forecast, 2025-2035
- 12.6.4 Volume Forecast, 2025-2035
- 12.6.5 Base-Year Market Share, 2025
- 12.6.6 Segment CAGR and Growth Drivers
- 12.6.7 Subsegment Market Size and Forecast
- 12.6.7.1 Manufacturer-owned brands
- 12.6.7.2 Private-label manufacturing
- 12.6.7.3 Contract ingredient processing
- 12.6.8 Subsegment Pricing and Adoption Trends
- 12.6.9 Leading Suppliers and Competition
- 12.6.10 Regional Demand and Opportunities
- 12.7 Segment Growth Comparison
- 12.8 Segment Attractiveness and Priority Matrix
Chapter 13 Australia Cereal Ingredients Geographic Market Outlook, 2025-2035
- 13.1 Domestic Market Distribution and Demand Clusters
- 13.2 State- or Province-Wise Market Size and Forecast, 2025-2035
- 13.3 City and Metropolitan Market Outlook
- 13.4 Industrial, Manufacturing and Commercial Clusters
- 13.5 Geographic Concentration of Key End Users
- 13.6 Local Pricing and Purchasing Differences
- 13.7 Domestic Production Facilities and Capacity Map
- 13.8 Local Infrastructure and Project Pipeline
- 13.9 State-Level Policy and Incentive Differences
- 13.10 Subnational Investment Hotspots and Opportunities
- 13.11 Distribution and Logistics Networks
- 13.12 Domestic Competitive Footprint
Chapter 14 Australia Cereal Ingredients Technology, Innovation and Sustainability Outlook
- 14.1 Technology Landscape and Maturity
- 14.2 Product, Process and Service Innovation
- 14.3 AI, Automation and Digital Tools in the Industry
- 14.4 Technology Adoption and Performance Benchmarking
- 14.5 Innovation Pipeline and R&D Investment
- 14.6 Patent and Intellectual Property Trends
- 14.7 Energy Efficiency and Resource Management
- 14.8 Sustainability, Recycling and Circularity
- 14.9 Technology Roadmap, 2025-2035
- 14.10 Risks of Obsolescence and Technology Substitution
Chapter 15 Australia Cereal Ingredients Market Key Strategic Imperatives
- 15.1 Growth and Market Entry Priorities
- 15.2 High-Return Products and Segments
- 15.3 Pricing, Profitability and Cost Optimization
- 15.4 Technology Investment and Product Differentiation
- 15.5 Supply Chain Localization and Resilience
- 15.6 Distribution and Customer Acquisition
- 15.7 Partnership, Acquisition and Capacity Strategy
- 15.8 Regional Expansion Priorities
- 15.9 Short-, Medium- and Long-Term Actions
Chapter 16 Competition Outlook
- 16.1 Industry Competition Characteristics
- 16.2 Market Structure and Concentration
- 16.3 Market Share and Competitive Positioning, 2025
- 16.4 Company-Wise Revenue and Product Benchmarking
- 16.5 Production and Service Capacity Benchmarking
- 16.6 Technology, Pricing and Differentiation
- 16.7 Regional Footprint and Distribution Strength
- 16.8 Mergers, Acquisitions and Strategic Alliances
- 16.9 New Entrants and Competitive Threats
- 16.10 Porter's Five Forces and Industry Attractiveness
- 16.11 Competitive Outlook, 2025-2035
Chapter 17 Company Profiles
- 17.1 Company Coverage and Selection Criteria
- 17.2 Kellanova Australia
- 17.2.1 Business Description
- 17.2.2 Company Ownership and Geographic Presence
- 17.2.3 Product and Service Portfolio
- 17.2.4 Manufacturing and Operating Footprint
- 17.2.5 Production Capacity and Expansion Plans
- 17.2.6 Financial Performance and Investment
- 17.2.7 Market Share and Competitive Position
- 17.2.8 Technology and Innovation Capabilities
- 17.2.9 Strategic Alliances or Partnerships
- 17.2.10 Recent Developments
- 17.2.11 Growth Strategy and Outlook
- 17.3 San Remo
- 17.4 Sanitarium
- 17.5 Nestlé Australia cereal operations
- 17.6 Australian Bakels
- 17.7 Quaker Oats Australia
- 17.8 Blue Lake Milling
- 17.9 Rinoldi
- 17.10 Grain & Bake
- 17.11 The Muesli Company
- 17.12 Other Relevant Market Participants
Note: Every listed company is profiled on the structure shown under the first company. The company list is preliminary and may change based on research findings, market developments, data availability and client requirements.
Chapter 18 Disclaimer
- 18.1 Research and Forecast Disclaimer
- 18.2 Data Source and Estimation Limitations
Note: The depth of individual sections depends on data availability for this market. Volume, capacity, trade and other unit-based metrics are included where applicable.

