
Beer drives Vietnamese drinking as buyers trade up
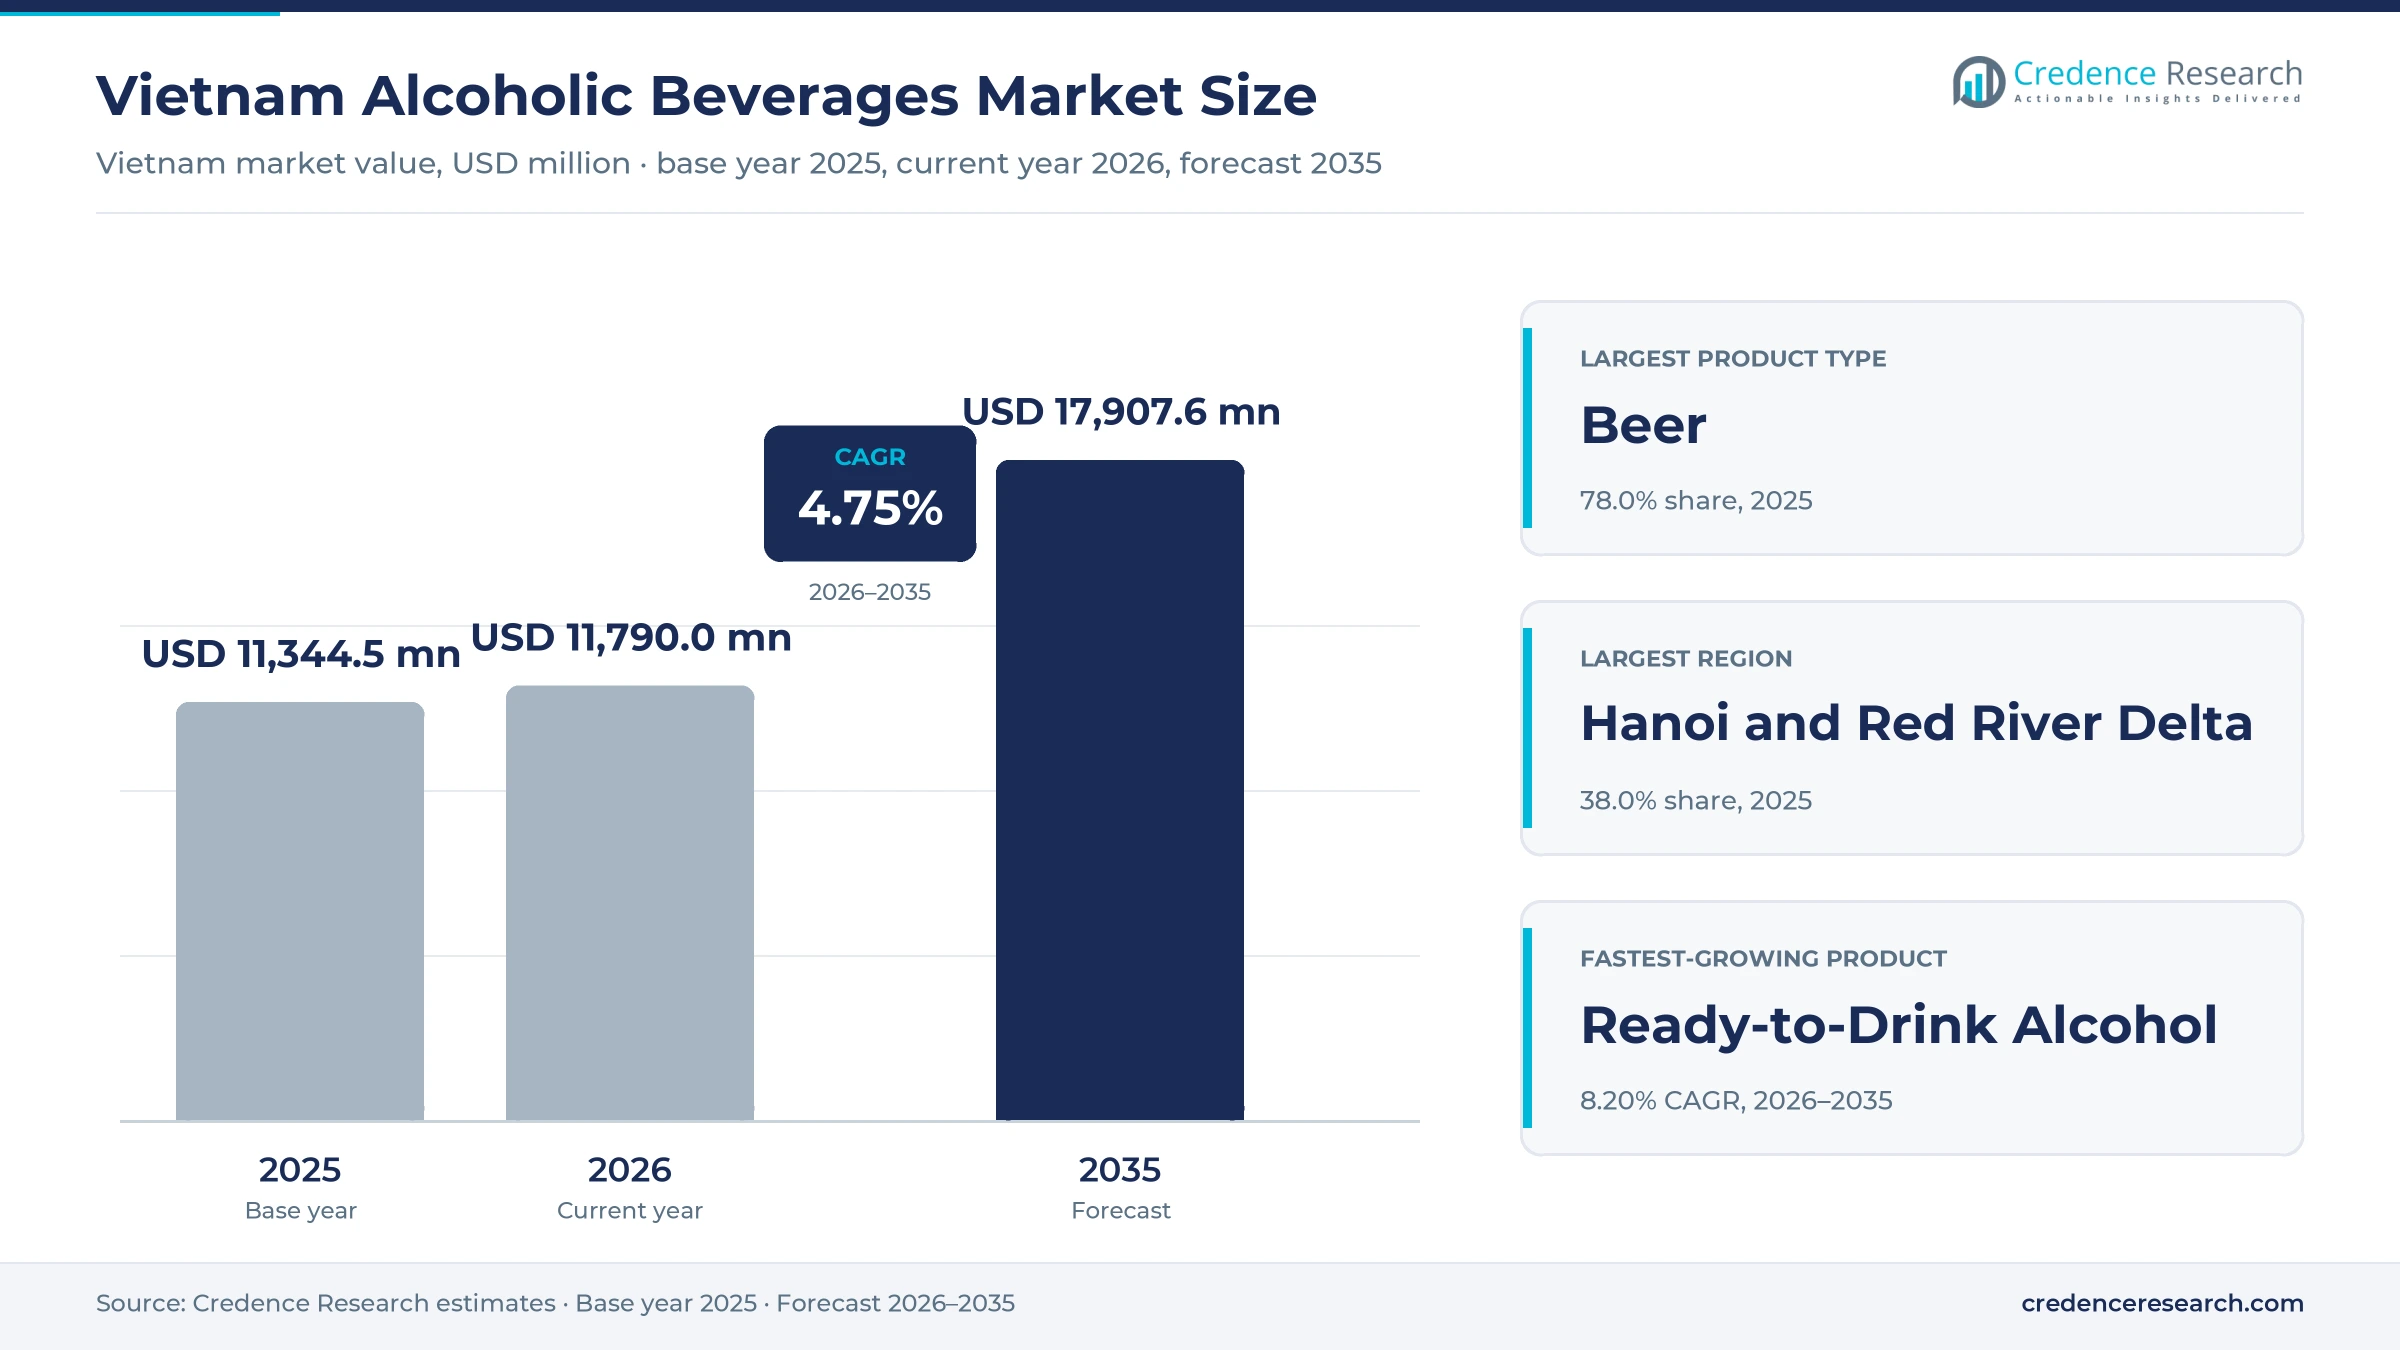
The Vietnam alcoholic beverages market was valued at USD 11.34 billion in 2025 and is projected to increase from USD 11.79 billion in 2026 to USD 17.91 billion by 2035, registering a CAGR of 4.75% during 2026–2035. Demand comes from legal-age drinkers who share beer at street-side eateries, restaurants and family celebrations, and from hotels and bars that serve a growing number of foreign visitors. Hanoi and Red River Delta held the largest regional share, 38.0% in 2025, because the capital region has dense beer halls, strong local brands and large Tet gifting demand. Central Coast and Da Nang is the fastest-growing region at 5.21% a year, as beach tourism and new brewery capacity in Hue lift sales. However, the National Assembly approved a higher special consumption tax in June 2025, which will raise the rate on beer and spirits from 65% to 70% in 2027 and to 90% in 2031.
Which drinks and sales routes does the estimate cover?
The estimate measures the retail value of beer, spirits, wine, ready-to-drink alcohol and cider sold to legal-age consumers in Vietnam through grocery shops, supermarkets, convenience stores, restaurants, bars, hotels and licensed online sellers. It covers economy, mainstream, premium and super-premium labels, whether they are brewed or distilled in Vietnam or imported in finished form.
The estimate excludes unrecorded home-made rice spirit, alcohol for industrial or medical use and exports shipped out of the country. The value chain runs from malt, rice, hops and packaging suppliers through brewers, distillers, wineries and importers to distributors, retailers and hospitality outlets that serve drinkers across the country.
Vietnam Alcoholic Beverages Market Insights
- The Vietnam alcoholic beverages market was valued at USD 11.34 billion in 2025 and is projected to reach USD 17.91 billion by 2035, registering a CAGR of 4.75% during 2026–2035.
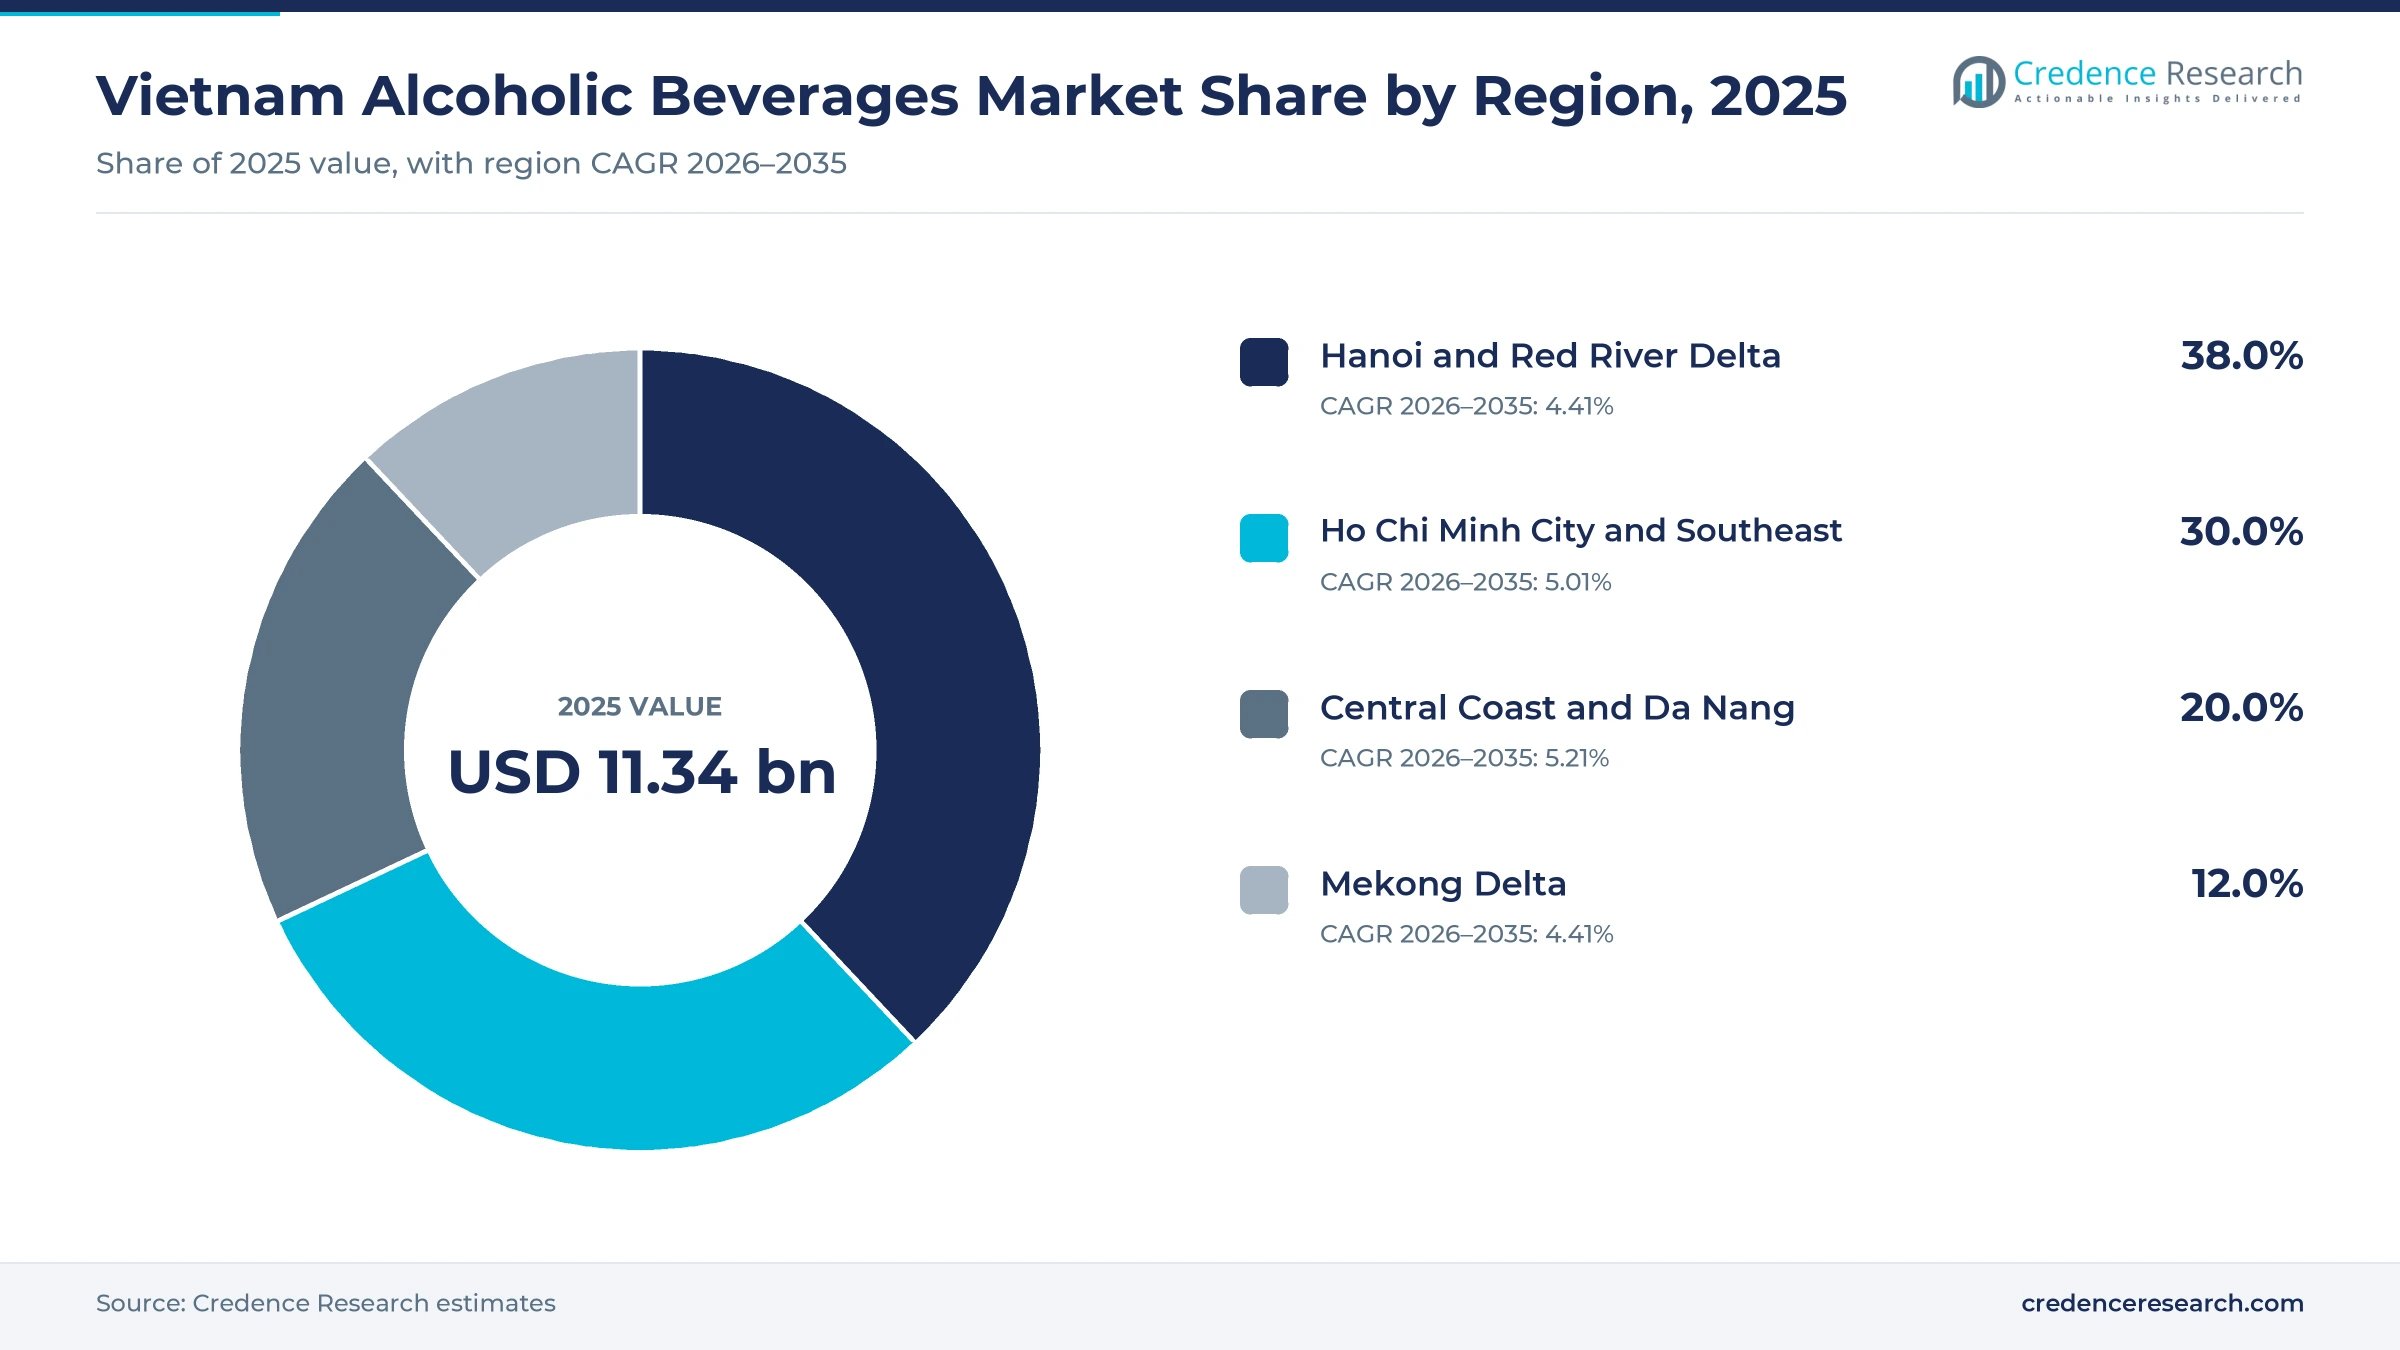
- Hanoi and Red River Delta held a 38.0% share of 2025 value, because the capital region has dense beer halls and strong local brands.
- Beer led with a 78.0% share of 2025 value, because draft and bottled lager dominates everyday meals, nightlife and celebrations across the country.
- The National Assembly approved a new special consumption tax law on June 14, 2025, raising the rate on beer and spirits from 65% to 90% by 2031.
- Carlsberg Vietnam inaugurated its expanded Phu Bai brewery in Hue on Aug. 26, 2025, after an investment of about USD 90 million.
Beer leads while ready-to-drink products grow fastest
Why does beer hold most of the drinks value?
Based on product type, the market is categorized into beer, spirits, wine, ready-to-drink alcohol and cider. Beer led with a 78.0% share of 2025 value, because lager is the default drink at street-side eateries, family meals and Tet gatherings. Ready-to-Drink Alcohol grows fastest at 8.20% a year, as younger urban drinkers try canned cocktails and lighter flavored drinks in bars and at home.
How fast are drinkers trading up across price tiers?
Based on price tier, the market is categorized into economy, mainstream, premium and super-premium labels. Mainstream labels led with a 45.0% share of 2025 value, because most beer sold in shops and eateries carries national brands at familiar prices. Super-Premium labels grow fastest at 7.55% a year, as imported whisky, wine and international beer win affluent buyers and corporate gift orders.
Why do restaurants and bars dominate drinks sales?
Based on distribution channel, the market is categorized into traditional off-trade, modern off-trade, on-trade and e-commerce and licensed delivery. On-Trade led with a 46.0% share of 2025 value, because Vietnamese drinkers buy most beer at eateries and beer halls. E-Commerce and Licensed Delivery grows fastest at 8.71% a year, as brewers widen online sales and home delivery in cities.
How is packaging shifting toward cans?
Based on packaging format, the market is categorized into returnable glass bottles, one-way glass bottles, aluminum cans and PET and pouches. Aluminum Cans led with a 47.0% share of 2025 value, because canned lager suits home drinking, gifting cases and supermarket shelves. Aluminum Cans grow fastest at 5.37% a year, as brewers add fast canning lines and smaller can sizes.
| Segment Group | Leading Sub-segment | Share, 2025 | Fastest-growing Sub-segment | CAGR, 2026–2035 |
|---|---|---|---|---|
| By Product Type | Beer | 78.0% | Ready-to-Drink Alcohol | 8.20% |
| By Price Tier | Mainstream | 45.0% | Super-Premium | 7.55% |
| By Distribution Channel | On-Trade | 46.0% | E-Commerce and Licensed Delivery | 8.71% |
| By Packaging Format | Aluminum Cans | 47.0% | Aluminum Cans | 5.37% |
Request a Free Sample
Fill in your details and we'll send you a free sample report.
- Sample data tables & charts
- Research methodology
Income, tourism and brewery capacity lift drinks demand
How do rising incomes and a large population lift demand?
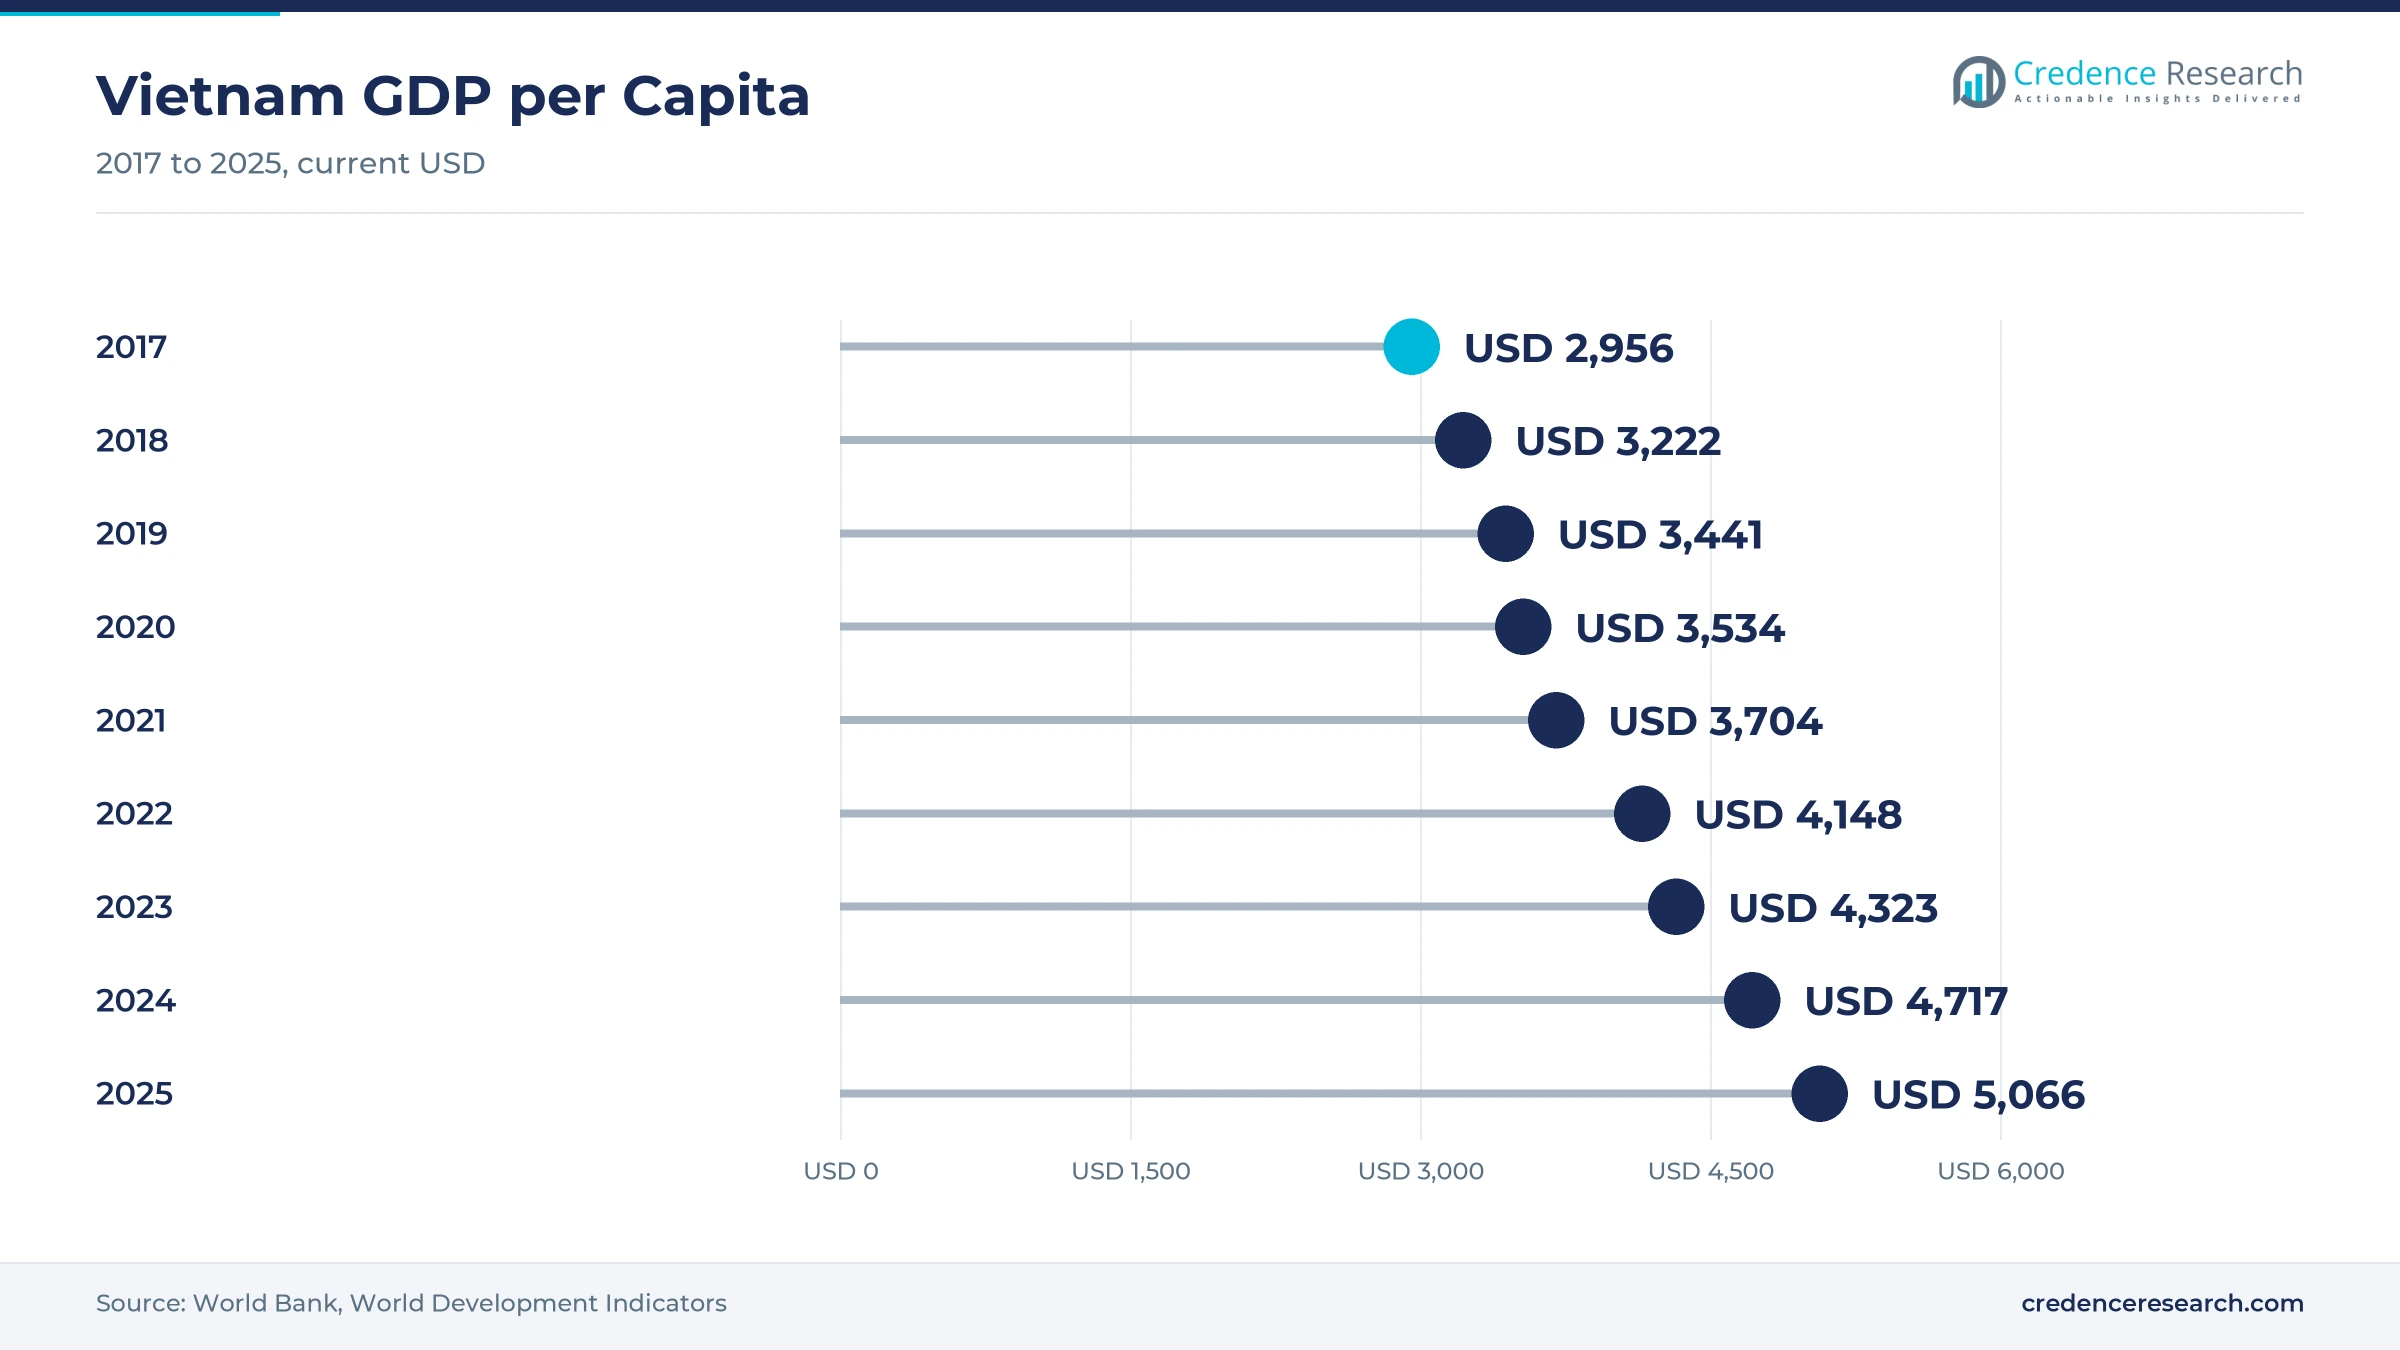
Income growth and a large consumer base lift demand, because more households can now afford branded beer and imported spirits for meals and celebrations. GDP per person in Vietnam rose from USD 2,956 in 2017 to about USD 5,066 in 2025, according to the World Bank. The same source counts about 101.6 million people in Vietnam in 2025, while the urban share of the population rose from 33.4% in 2017 to 38.8% in 2025. Total retail sales of goods and services grew 9.2% in 2025 to about VND 7 quadrillion, according to the National Statistics Office. As a result, Ho Chi Minh City and Southeast grows at 5.01% a year, as dense cities convert rising pay into spending on drinks.
Why does tourism recovery lift bar and restaurant sales?
Tourism and on-trade recovery lift sales, because foreign visitors and domestic travelers spend heavily in restaurants, bars and hotels. Vietnam received about 21.17 million international visitors in 2025, up 20.4% from 2024 and the first year above 21 million, according to National Statistics Office data. Revenue from accommodation and food services rose 14.6% in 2025 to more than VND 843.1 trillion, or about 12% of total retail sales. Tourism and travel services revenue rose 20.2% to VND 93.9 trillion over the same year. In turn, on-trade channels hold 46.0% of 2025 value, and catering and food service operators add more drinks to their menus.
How do premium portfolios and formal retail raise spending?
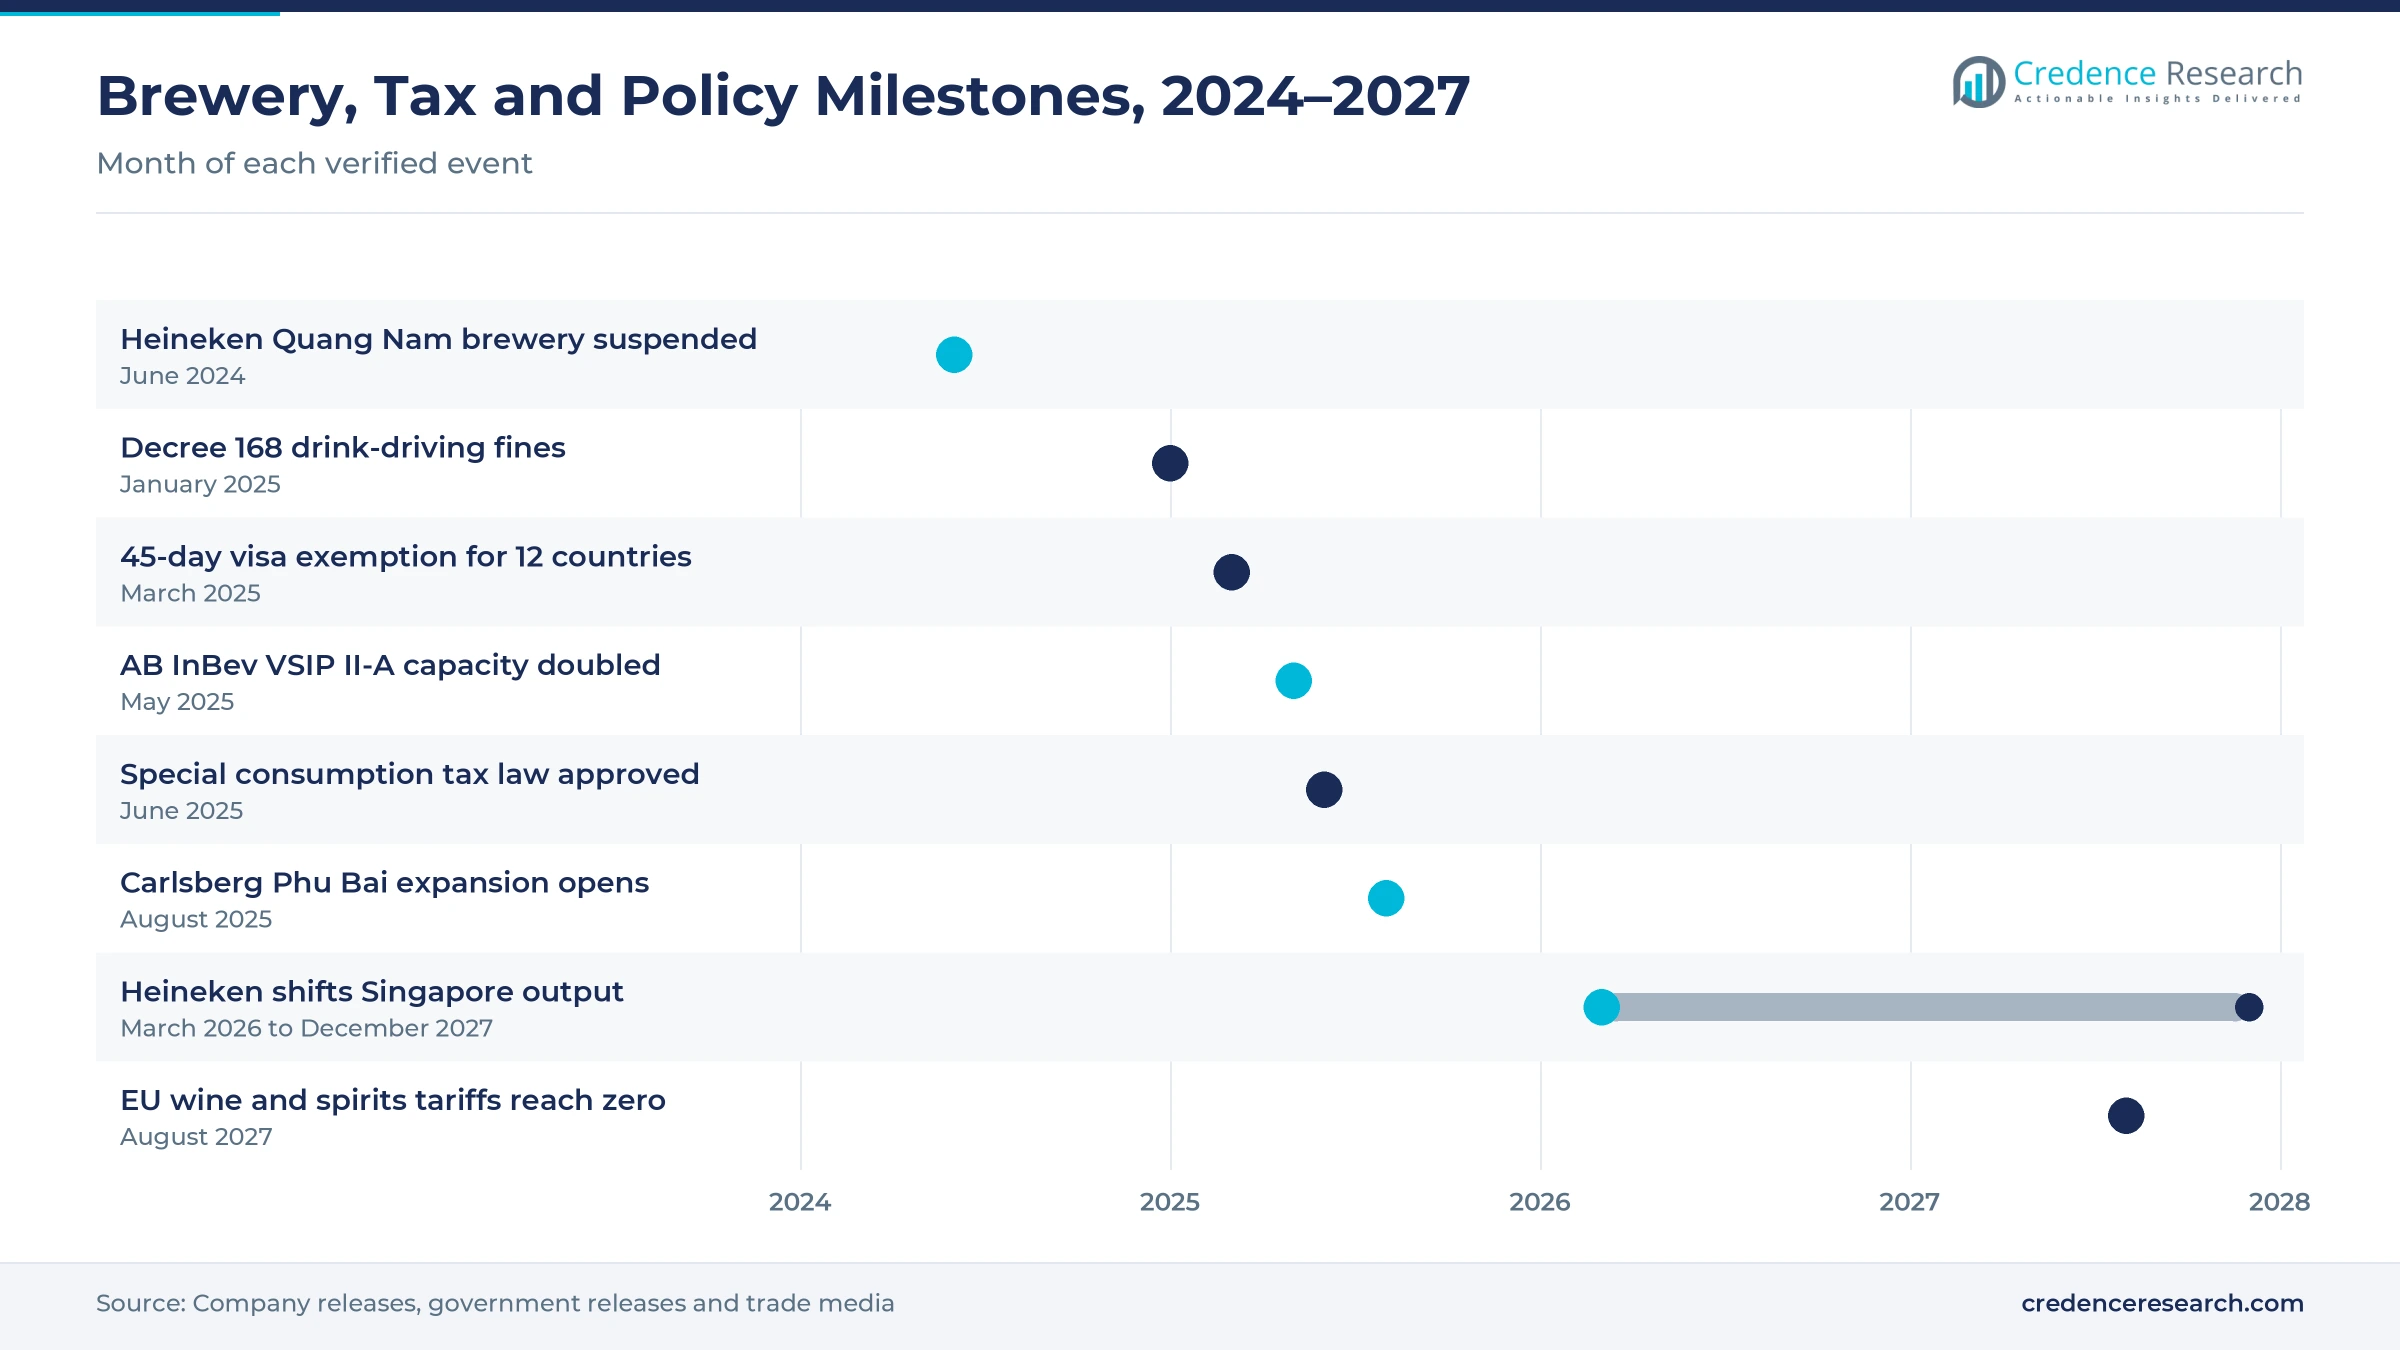
Portfolio premiumization and formal retail raise spending per drink, because brewers and importers now push higher-priced labels through supermarkets, convenience chains and online stores. SABECO said in April 2026 that its 2026 plan puts quality over volume and moves its portfolio toward premium, higher-value segments. The same plan expands e-commerce, modern trade and the use of data analytics and artificial intelligence in sales. Anheuser-Busch InBev doubled the capacity of its VSIP II-A brewery in Binh Duong to 1 million hectoliters a year, as announced on May 21, 2025, and the plant brews Budweiser and Beck's. As a result, super-premium labels grow at 7.55% a year during 2026–2035.
Why does new brewery capacity support long-term supply?
Brewery capacity investment supports long-term supply, because global brewers still see Vietnam as one of the largest beer markets in Asia. Heineken operates six breweries in Vietnam and plans USD 500 million of new investment over the next decade, on top of USD 1 billion already invested, according to The Investor. Its Vung Tau plant expansion adds 500 million liters, raising capacity to 1.6 billion liters a year. Carlsberg Vietnam lifted brewing capacity at its Phu Bai site in Hue by 50% after an investment of about USD 90 million, according to Carlsberg Group. In turn, beer keeps 78.0% of 2025 value, as larger plants lower costs per case.
Tariff cuts, cocktail bars and small packs reshape demand
How is the shift to lower European tariffs widening choice?
The shift to lower European tariffs is widening choice, because imported wine and spirits have long carried high duties in Vietnam. The EU and Vietnam trade agreement entered into force on Aug. 1, 2020, according to the European Commission. Under the agreement, Vietnam removes its 50% tariff on wine and its 48% tariff on spirits gradually by August 2027. The 35% tariff on beer from the European Union falls to zero by August 2030, which opens space for imported lagers and specialty brews. As a result, shelves of imported vodka, whisky and wine widen in supermarkets and hotel bars across the largest cities.
Why is the rise of cocktail bars changing spirits demand?
The rise of cocktail bars is changing spirits demand, because younger professionals in Hanoi and Ho Chi Minh City now spend more on mixed drinks and premium serves. Halflington in Hanoi debuted at No. 47 on the Asia's 50 Best Bars list in 2024, and five Vietnamese venues appeared on the extended list in 2025. Diageo has run its World Class bartending competition in Vietnam since 2012, and the country has crowned seven national champions. Nguyen Ngoc Khanh won the national title in 2025 after a Rising Star award in 2024. In turn, spirits and ready-to-drink alcohol gain space on bar menus, with ready-to-drink products growing at 8.20% a year.
Can smaller packs and premium beer open new sales?
Smaller packs and premium beer can open new sales, because drinkers who now drink less per session still pay more for quality and convenience. SABECO said its 250ml Bia Saigon Chill format built strong momentum in 2025, which shows demand for smaller serving sizes. SABECO brewed about 30.1 million hectoliters and Heineken Vietnam about 27.8 million hectoliters in the latest annual volumes cited by inside.beer in December 2024. HABECO followed with about 8 million hectoliters, Carlsberg with 3.6 million and Sapporo with 1.5 million. As a result, aluminum cans grow at 5.37% a year, while craft beer brewers find room in city taprooms.
Is visa-free travel an opening for tourist and travel sales?
Visa-free travel offers an opening for tourist and travel sales, because longer stays mean more meals, bar visits and gift purchases. The government issued Resolution No. 44 on March 7, 2025, allowing citizens of 12 countries, including Germany, France, Japan and South Korea, to stay up to 45 days without a visa. The policy runs from March 15, 2025, to March 14, 2028. Arrivals from China rose 41.3% to more than 5.28 million in 2025, while arrivals from Russia nearly tripled to about 690,000. In turn, airport stores selling duty-free liquor and resort bars in the Central Coast gain more foreign buyers.
Excise hikes and drink-driving rules pressure volumes
How do higher excise taxes raise shelf prices?
Higher excise taxes raise shelf prices, because the special consumption tax is the largest single cost in a bottle of beer or spirits. The National Assembly approved the new law on June 14, 2025, according to Tuoi Tre. The rate on beer and spirits rises from 65% to 70% in 2027 and to 90% in 2031. As a result, producers face lower volumes in price-sensitive rural shops and can respond with cost savings, price packs and a richer premium mix.
Why does strict drink-driving enforcement cut on-trade visits?
Strict drink-driving enforcement cuts on-trade visits, because Vietnam keeps a zero-tolerance rule for alcohol while driving. Decree 168 took effect on Jan. 1, 2025, and set fines of up to VND 40 million for car drivers with high alcohol levels. Police handled more than 126,400 drink-driving violations between Oct. 8 and Dec. 7, 2025. In turn, brewers can respond with ride-hailing partnerships, alcohol-free lagers and home drinking packs that keep buyers loyal.
How do weak beer volumes force capacity cuts?
Weak beer volumes force capacity cuts, because the market fell by double digits in 2023 and kept declining in 2024. Heineken Vietnam suspended its Quang Nam brewery, the smallest of its six plants, on June 12, 2024, and moved affected staff to other plants. As a result, brewers now focus on fewer, larger and more efficient breweries. They also cut costs and shift production toward premium brands that earn more per liter sold.
Why does unrecorded alcohol undercut branded sales?
Unrecorded alcohol undercuts branded sales, because home-made rice spirit sells far below the price of taxed brands in rural areas. As a result, each excise increase widens the price gap between legal and unrecorded drinks. Producers respond with smaller bottles, economy brands and campaigns on safe drinking. Stronger labeling and inspection rules also help shift drinkers toward registered products from licensed producers.
Hanoi leads while the Central Coast adds the fastest growth
| Region | Value, 2025 (USD billion) | Share, 2025 | CAGR, 2026–2035 |
|---|---|---|---|
| Hanoi and Red River Delta | 4.31 | 38.0% | 4.41% |
| Ho Chi Minh City and Southeast | 3.40 | 30.0% | 5.01% |
| Central Coast and Da Nang | 2.27 | 20.0% | 5.21% |
| Mekong Delta | 1.36 | 12.0% | 4.41% |
Why does Hanoi and Red River Delta hold the largest share?
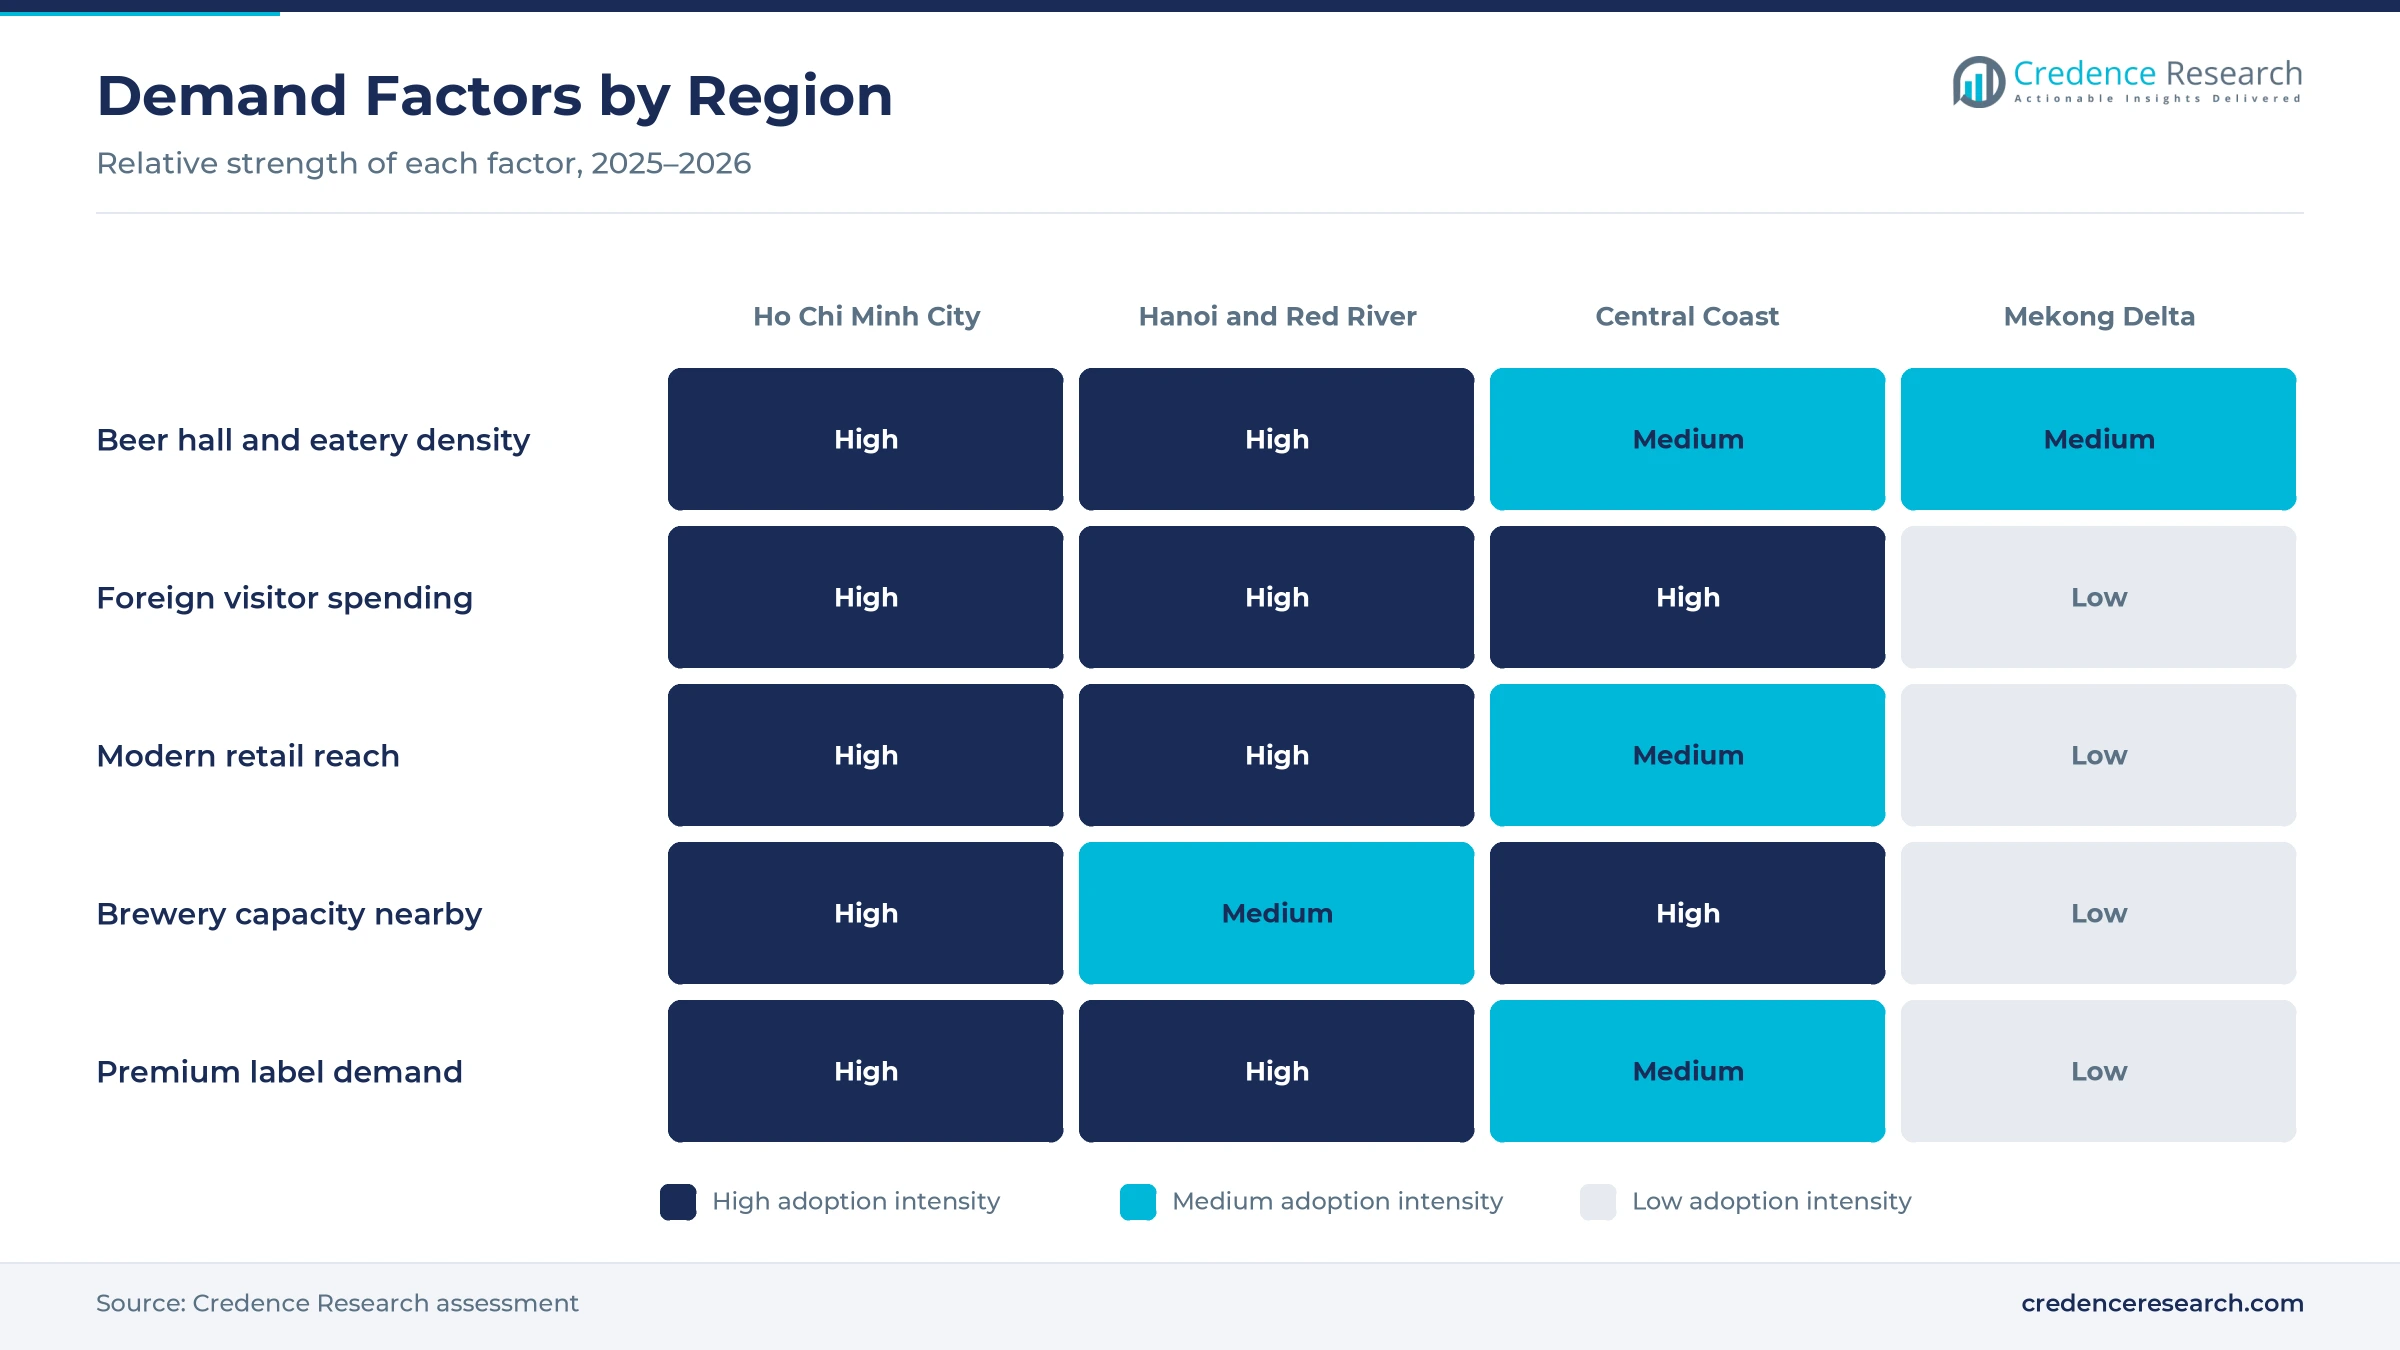
Hanoi and Red River Delta held a 38.0% share of 2025 value and grows at 4.41% a year, because the capital region has dense beer halls and strong local brands. HABECO brews about 8 million hectoliters a year and is rooted in northern provinces. Hanoi also hosts Halflington and other cocktail bars that rank among the best in Asia. As a result, the region leads in both draft beer and premium spirits sales.
How does Ho Chi Minh City and Southeast anchor premium sales?
Ho Chi Minh City and Southeast held a 30.0% share of 2025 value and grows at 5.01% a year, because the largest city has the most supermarkets, hotels and nightlife venues. Heineken's Vung Tau plant and the AB InBev breweries in Binh Duong sit close to these buyers. SABECO, the largest brewer by volume, sells its main lager under the Bia Saigon name. In turn, the region leads in modern retail and imported labels.
Why is Central Coast and Da Nang growing fastest?
Central Coast and Da Nang held a 20.0% share of 2025 value and grows fastest at 5.21% a year, because beach resorts and cruise visitors lift hotel and bar sales. Carlsberg Vietnam expanded its Phu Bai brewery in Hue in August 2025, which now ranks as its largest beer plant in Asia. Its Huda and Halida brands have long been rooted in central provinces. As a result, the region gains from both tourism and local brand loyalty.
How does the Mekong Delta grow from a smaller base?
Mekong Delta held a 12.0% share of 2025 value and grows at 4.41% a year, because farm incomes are lower and many drinkers buy economy beer at local shops. However, family gatherings, weddings and Tet celebrations keep beer demand steady across the region. Brewers reach these buyers through traditional wholesalers and returnable glass bottles. In turn, the Mekong Delta remains a volume market for mainstream lager rather than imported spirits.
Brewery, tax and capacity moves since 2024
| Development | Status and market relevance |
|---|---|
| In June 2024, Heineken Vietnam suspended its Quang Nam brewery, the smallest of its six plants in the country. | Consolidates beer supply after weaker demand |
| In May 2025, Anheuser-Busch InBev doubled the capacity of its VSIP II-A brewery in Binh Duong to 1 million hectoliters a year. | Adds premium Budweiser and Beck's supply |
| In June 2025, the National Assembly approved a special consumption tax law that raises the rate on beer and spirits to 90% by 2031. | Raises long-term price pressure |
| In August 2025, Carlsberg Vietnam inaugurated its expanded Phu Bai brewery in Hue after an investment of about USD 90 million. | Lifts central beer capacity by 50% |
| In March 2026, Heineken said it will move large-scale beer production from Singapore to breweries in Vietnam and Malaysia by the end of 2027. | Raises the export role of Vietnamese breweries |
Efficient brewing, canning and digital sales tools
- High-efficiency brew lines cut water and energy use per liter, and the new Phu Bai line uses 20% less water and 15% less energy.
- High-speed canning lines fill beer and ready-to-drink products in lighter packs, which lowers freight costs and suits home drinking.
- Returnable glass handling cleans and inspects used bottles for refilling, which cuts packaging costs for mainstream lager brands.
- Data analytics and online ordering help brewers plan stock for shops and eateries, which supports e-commerce and modern trade growth.
Need a Custom Version of This Report?
Tailor the scope, geography, or segments to your exact requirements.
- Custom geography or segment scope
- Direct access to our analyst team
Global brewers and state-rooted groups compete on reach
Competition is led by large brewers with national distribution, alongside spirits importers, local liquor makers and wine producers. SABECO and Heineken Vietnam lead beer volumes, with about 30.1 million and 27.8 million hectoliters a year in the latest figures cited by inside.beer. HABECO competes strongly in the north, Carlsberg Vietnam in central provinces through Huda, and Sapporo and Anheuser-Busch InBev in premium beer. Diageo builds spirits demand through bar training and its World Class competition. Rivals compete on brand strength, eatery coverage, price packs, Tet promotions and premium launches. Because excise taxes and drink-driving rules squeeze volumes, groups with efficient large breweries and strong premium portfolios gain share fastest. Spirits importers also benefit from falling European tariffs, while local liquor and wine makers such as HALICO and Ladofoods defend their place through familiar brands, Tet gift packs and wide coverage in traditional shops.
Which producers shape Vietnamese drinks shelves?
| Company | Type | Role in the market |
|---|---|---|
| Saigon Beer-Alcohol-Beverage Corporation (SABECO) | Brewer | Largest brewer by volume and rolled out the 250ml Bia Saigon Chill format |
| HEINEKEN Vietnam Brewery Limited | Brewer | Runs six breweries and expanded its Vung Tau plant to 1.6 billion liters |
| Hanoi Beer Alcohol and Beverage JSC (HABECO) | Brewer | Leads northern beer with about 8 million hectoliters a year |
| Carlsberg Vietnam Breweries Limited | Brewer | Expanded the Phu Bai brewery in Hue in August 2025 |
| Anheuser-Busch InBev Vietnam Brewery | Brewer | Doubled VSIP II-A capacity to 1 million hectoliters in 2025 |
| Sapporo Vietnam Limited | Brewer | Brews about 1.5 million hectoliters a year for premium buyers |
| Diageo Vietnam | Spirits marketer | Runs the World Class bartending competition in Vietnam since 2012 |
Credence Research view on Vietnamese drinking habits
Credence Research's view is that the Vietnamese drinks market will grow mainly through trading up rather than volume alone, because higher excise taxes and strict drink-driving rules limit how much people drink. Beer remains the largest value pool, while ready-to-drink alcohol, wine and super-premium labels add the fastest growth. Tourism, lower European tariffs and larger, more efficient breweries will support supply and choice. Producers with strong premium portfolios, modern retail reach and efficient plants should gain the most, while unrecorded alcohol and tax increases keep pressure on economy brands.
How the national drinks estimate was built
The report uses 2025 as the base year on a calendar basis, and market values come from the Credence Research model. That model combines national statistics on retail sales and tourism, World Bank income and population data, tax law terms, trade agreement schedules and company releases. Regional shares follow the client zone definitions, while segment splits and growth rates are Credence Research estimates. Sources used are official statistics, government and trade agreement pages, company releases and trade media, and no interviews or surveys were used.
Premium beer and tourist demand carry growth to 2035
The Vietnam alcoholic beverages market is expected to reach USD 17.91 billion by 2035, a 4.75% CAGR during 2026–2035, as rising incomes, tourism and premium portfolios lift spending per drink. Growth should be strongest in ready-to-drink alcohol, super-premium labels, online sales and the Central Coast, because these areas gain most from younger drinkers and visitors. Lower European tariffs will widen imported choice by 2027, while higher excise taxes and strict drink-driving enforcement could slow beer volumes in price-sensitive areas.
Frequently Asked Questions
How big is the Vietnam alcoholic beverages market?
Which product type leads Vietnamese drinks value?
Which region leads the Vietnamese market?
How will the new special consumption tax affect drinks prices?
How does tourism support drinks sales in Vietnam?
What recent investments have changed beer supply?
Who are the leading companies in the Vietnamese market?
What are the main challenges for drinks producers in Vietnam?
Table of Content
Chapter 1 Market Segmentation
- 1.1 Segmentation Framework
- 1.1.1 Product and Service Classification
- 1.1.2 Application and End-Use Classification
- 1.1.3 Technology and Solution Classification
- 1.1.4 Customer and Distribution Channel Classification
- 1.1.5 Geographic Segmentation
- 1.1.6 Market Segment Definitions and Boundaries
- 1.2 By Product Type
- 1.2.1 Beer
- 1.2.2 Spirits
- 1.2.3 Wine
- 1.2.4 Ready-to-Drink Alcohol
- 1.2.5 Cider
- 1.3 By Price Tier
- 1.3.1 Economy
- 1.3.2 Mainstream
- 1.3.3 Premium
- 1.3.4 Super-Premium
- 1.4 By Packaging Format
- 1.4.1 Returnable Glass Bottles
- 1.4.2 One-Way Glass Bottles
- 1.4.3 Aluminum Cans
- 1.4.4 PET and Pouches
Chapter 2 Introduction
- 2.1 Report Objectives and Scope
- 2.2 Product Definition and Industry Terminology
- 2.3 Market Inclusions and Exclusions
- 2.4 Research Process
- 2.4.1 Primary Research and Expert Interviews
- 2.4.2 Secondary Research and Source Review
- 2.4.3 Top-Down and Bottom-Up Estimation
- 2.4.4 Data Triangulation and Verification
- 2.5 Market Size Measurement Basis
- 2.5.1 2025: USD 11.34 billion → 2035: USD 17.91 billion
- 2.6 Historical and Forecast Reference Periods
- 2.6.1 Historical Period: 2018-2025
- 2.6.2 Base Year: 2025
- 2.6.3 Forecast Period: 2025-2035
- 2.7 Research Assumptions and Limitations
Chapter 3 Executive Summary
- 3.1 Market Snapshot and Key Findings
- 3.2 Base-Year Market Size, 2025
- 3.3 Forecast Market Size, 2035
- 3.4 Revenue and Volume Growth Outlook
- 3.5 Key Demand and Supply Indicators
- 3.6 Leading Market Segments
- 3.7 Fastest-Growing Market Opportunities
- 3.8 Regional Performance Highlights
- 3.9 Technology and Industry Transformation
- 3.10 Competitive Landscape Summary
- 3.11 Analyst View and Strategic Implications
Chapter 4 Vietnam Alcoholic Beverages Market Trends and Developments
- 4.1 Historical Industry Development, 2018-2025
- 4.2 Recent Market Trends and Developments
- 4.3 Demand and Customer Behavior Trends
- 4.4 Technology and Product Innovation
- 4.5 Artificial Intelligence, Automation and Digitalization
- 4.6 Local Manufacturing and Supply Chain Realignment
- 4.7 Industry Partnerships, Mergers and Acquisitions
- 4.8 Sustainability and Circular Economy Developments
- 4.9 Government and Private Sector Investment Trends
- 4.10 Emerging Business Models and Commercialization
- 4.11 Industry Developments and Announcements
Chapter 5 Vietnam Alcoholic Beverages Market Production, Supply and Demand Analysis
- 5.1 Demand Trend and Consumption Analysis, 2018-2025
- 5.2 Demand Forecast, 2025-2035
- 5.3 Production and Output Trend, 2018-2025
- 5.4 Production and Output Forecast, 2025-2035
- 5.5 Installed Capacity and Capacity Utilization
- 5.6 Company-Wise Production Plants and Statistics
- 5.6.1 Installed Production Capacity
- 5.6.2 Actual Production
- 5.6.3 Planned Capacity and Expansion Targets
- 5.7 Supply Chain Structure and Procurement Trends
- 5.8 Supply-Demand Gap and Bottlenecks
- 5.9 Import Dependence and Sourcing Structure
- 5.10 Contract Manufacturing and Outsourcing
- 5.11 Regional Supply and Demand Concentration
Chapter 6 Vietnam Alcoholic Beverages Market Pricing Analysis
- 6.1 Pricing Structure and Measurement
- 6.2 Historical Pricing Trends, 2018-2025
- 6.3 Pricing Outlook, 2025-2035
- 6.4 Average Selling Price and Unit Economics
- 6.5 Pricing by Product and Market Segment
- 6.6 Geographic Pricing Differences
- 6.7 Key Input, Energy, Labor and Logistics Costs
- 6.8 Contract Pricing and Purchasing Models
- 6.9 Pricing Sensitivity and Competitive Positioning
- 6.10 Price, Margin and Profitability Implications
Chapter 7 Vietnam Alcoholic Beverages Market Dynamics
- 7.1 Market Growth Drivers
- 7.1.1 Demand-Side Drivers
- 7.1.2 Technology and Innovation Drivers
- 7.1.3 Infrastructure and Investment Drivers
- 7.1.4 Regulatory and Policy Drivers
- 7.2 Market Restraints
- 7.2.1 Cost and Affordability Constraints
- 7.2.2 Technology and Adoption Barriers
- 7.2.3 Supply Chain and Operational Constraints
- 7.3 Market Challenges
- 7.3.1 Competitive Pressure and Margin Erosion
- 7.3.2 Skills, Infrastructure and Implementation Gaps
- 7.4 Emerging Market Opportunities
- 7.5 Market Dynamics Impact and Time-Horizon Assessment
Chapter 8 Vietnam Alcoholic Beverages Value Chain Analysis
- 8.1 Industry Value Chain Overview
- 8.2 Upstream Suppliers and Critical Inputs
- 8.3 Technology and Component Providers
- 8.4 Manufacturing or Service Delivery
- 8.5 Distribution, Channel Partners and Integrators
- 8.6 Downstream Applications and End Users
- 8.7 Value Addition and Profit Pools
- 8.8 Vertical Integration and Outsourcing
- 8.9 Supplier Concentration and Risk
- 8.10 Supply Chain Localization and Resilience
Chapter 9 Vietnam Alcoholic Beverages Market Regulations and Policies
- 9.1 Relevant Laws, Standards and Compliance Frameworks
- 9.2 Product, Service, Safety and Quality Requirements
- 9.3 Government Policies, Incentives and Subsidies
- 9.4 Imports, Exports and Trade Barriers
- 9.5 Public Procurement and Local Content Requirements
- 9.6 Environmental and Sustainability Compliance
- 9.7 Upcoming Policy Changes and Market Implications
Chapter 10 Vietnam Alcoholic Beverages Market Hotspots and Opportunities
- 10.1 Market Opportunity Mapping and Growth Hotspots
- 10.2 High-Growth Applications and Customer Groups
- 10.3 Underserved Markets and White-Space Opportunities
- 10.4 Emerging Technology and Product Opportunities
- 10.5 New Capacity and Investment Hotspots
- 10.6 Market Entry and Expansion Opportunities
- 10.7 Distribution and Partnership Opportunities
- 10.8 Near-Term and Long-Term Commercial Potential
- 10.9 Opportunity Attractiveness and Execution Risks
Chapter 11 Vietnam Alcoholic Beverages Market Outlook, 2025-2035
- 11.1 Market Size and Analysis
- 11.1.1 Revenue (Market Measurement: 2025: USD 11.34 billion → 2035: USD 17.91 billion)
- 11.1.2 Market Volume and Quantity Sold
- 11.1.3 Historical Market Size, 2018-2025
- 11.1.4 Base-Year Market Size, 2025
- 11.2 Market Forecast, 2025-2035
- 11.2.1 Revenue Forecast to 2035
- 11.2.2 Volume Forecast to 2035
- 11.2.3 CAGR and Year-on-Year Growth
- 11.2.4 Incremental Revenue Opportunity
- 11.3 Forecast Assumptions and Scenario Analysis
- 11.3.1 Base-Case Forecast
- 11.3.2 Optimistic and Conservative Scenarios
- 11.3.3 Technology, Pricing and Policy Sensitivities
- 11.4 Market Attractiveness and Growth Outlook
Chapter 12 Vietnam Alcoholic Beverages Market Segmentation and Outlook
- 12.1 Segmentation Summary and Market Shares, 2025
- 12.2 Largest and Fastest-Growing Segments
- 12.3 By Product Type - Market Size and Forecast, 2025-2035
- 12.3.1 Segment Definition and Scope
- 12.3.2 Historical Market Size, 2018-2025
- 12.3.3 Revenue Forecast, 2025-2035
- 12.3.4 Volume Forecast, 2025-2035
- 12.3.5 Base-Year Market Share, 2025
- 12.3.6 Segment CAGR and Growth Drivers
- 12.3.7 Subsegment Market Size and Forecast
- 12.3.7.1 Beer
- 12.3.7.2 Spirits
- 12.3.7.3 Wine
- 12.3.7.4 Ready-to-Drink Alcohol
- 12.3.7.5 Cider
- 12.3.8 Subsegment Pricing and Adoption Trends
- 12.3.9 Leading Suppliers and Competition
- 12.3.10 Regional Demand and Opportunities
- 12.4 By Price Tier - Market Size and Forecast, 2025-2035
- 12.4.1 Segment Definition and Scope
- 12.4.2 Historical Market Size, 2018-2025
- 12.4.3 Revenue Forecast, 2025-2035
- 12.4.4 Volume Forecast, 2025-2035
- 12.4.5 Base-Year Market Share, 2025
- 12.4.6 Segment CAGR and Growth Drivers
- 12.4.7 Subsegment Market Size and Forecast
- 12.4.7.1 Economy
- 12.4.7.2 Mainstream
- 12.4.7.3 Premium
- 12.4.7.4 Super-Premium
- 12.4.8 Subsegment Pricing and Adoption Trends
- 12.4.9 Leading Suppliers and Competition
- 12.4.10 Regional Demand and Opportunities
- 12.5 By Packaging Format - Market Size and Forecast, 2025-2035
- 12.5.1 Segment Definition and Scope
- 12.5.2 Historical Market Size, 2018-2025
- 12.5.3 Revenue Forecast, 2025-2035
- 12.5.4 Volume Forecast, 2025-2035
- 12.5.5 Base-Year Market Share, 2025
- 12.5.6 Segment CAGR and Growth Drivers
- 12.5.7 Subsegment Market Size and Forecast
- 12.5.7.1 Returnable Glass Bottles
- 12.5.7.2 One-Way Glass Bottles
- 12.5.7.3 Aluminum Cans
- 12.5.7.4 PET and Pouches
- 12.5.8 Subsegment Pricing and Adoption Trends
- 12.5.9 Leading Suppliers and Competition
- 12.5.10 Regional Demand and Opportunities
- 12.6 Segment Growth Comparison
- 12.7 Segment Attractiveness and Priority Matrix
Chapter 13 Vietnam Alcoholic Beverages Geographic Market Outlook, 2025-2035
- 13.1 Domestic Market Distribution and Demand Clusters
- 13.2 State- or Province-Wise Market Size and Forecast, 2025-2035
- 13.3 City and Metropolitan Market Outlook
- 13.4 Industrial, Manufacturing and Commercial Clusters
- 13.5 Geographic Concentration of Key End Users
- 13.6 Local Pricing and Purchasing Differences
- 13.7 Domestic Production Facilities and Capacity Map
- 13.8 Local Infrastructure and Project Pipeline
- 13.9 State-Level Policy and Incentive Differences
- 13.10 Subnational Investment Hotspots and Opportunities
- 13.11 Distribution and Logistics Networks
- 13.12 Domestic Competitive Footprint
Chapter 14 Vietnam Alcoholic Beverages Technology, Innovation and Sustainability Outlook
- 14.1 Technology Landscape and Maturity
- 14.2 Product, Process and Service Innovation
- 14.3 AI, Automation and Digital Tools in the Industry
- 14.4 Technology Adoption and Performance Benchmarking
- 14.5 Innovation Pipeline and R&D Investment
- 14.6 Patent and Intellectual Property Trends
- 14.7 Energy Efficiency and Resource Management
- 14.8 Sustainability, Recycling and Circularity
- 14.9 Technology Roadmap, 2025-2035
- 14.10 Risks of Obsolescence and Technology Substitution
Chapter 15 Vietnam Alcoholic Beverages Market Key Strategic Imperatives
- 15.1 Growth and Market Entry Priorities
- 15.2 High-Return Products and Segments
- 15.3 Pricing, Profitability and Cost Optimization
- 15.4 Technology Investment and Product Differentiation
- 15.5 Supply Chain Localization and Resilience
- 15.6 Distribution and Customer Acquisition
- 15.7 Partnership, Acquisition and Capacity Strategy
- 15.8 Regional Expansion Priorities
- 15.9 Short-, Medium- and Long-Term Actions
Chapter 16 Competition Outlook
- 16.1 Industry Competition Characteristics
- 16.2 Market Structure and Concentration
- 16.3 Market Share and Competitive Positioning, 2025
- 16.4 Company-Wise Revenue and Product Benchmarking
- 16.5 Production and Service Capacity Benchmarking
- 16.6 Technology, Pricing and Differentiation
- 16.7 Regional Footprint and Distribution Strength
- 16.8 Mergers, Acquisitions and Strategic Alliances
- 16.9 New Entrants and Competitive Threats
- 16.10 Porter's Five Forces and Industry Attractiveness
- 16.11 Competitive Outlook, 2025-2035
Chapter 17 Company Profiles
- 17.1 Company Coverage and Selection Criteria
- 17.2 HEINEKEN Vietnam Brewery Limited
- 17.2.1 Business Description
- 17.2.2 Company Ownership and Geographic Presence
- 17.2.3 Product and Service Portfolio
- 17.2.4 Manufacturing and Operating Footprint
- 17.2.5 Production Capacity and Expansion Plans
- 17.2.6 Financial Performance and Investment
- 17.2.7 Market Share and Competitive Position
- 17.2.8 Technology and Innovation Capabilities
- 17.2.9 Strategic Alliances or Partnerships
- 17.2.10 Recent Developments
- 17.2.11 Growth Strategy and Outlook
- 17.3 Saigon Beer-Alcohol-Beverage Corporation (SABECO)
- 17.4 Hanoi Beer Alcohol and Beverage JSC (HABECO)
- 17.5 Carlsberg Vietnam Breweries Limited
- 17.6 Sapporo Vietnam Limited
- 17.7 Anheuser-Busch InBev Vietnam Brewery
- 17.8 Hanoi Liquor Joint Stock Company (HALICO)
- 17.9 Lam Dong Foodstuffs Joint Stock Company (Ladofoods)
- 17.10 Pernod Ricard Vietnam
- 17.11 Diageo Vietnam
- 17.12 Other Relevant Market Participants
Note: Every listed company is profiled on the structure shown under the first company. The company list is preliminary and may change based on research findings, market developments, data availability and client requirements.
Chapter 18 Disclaimer
- 18.1 Research and Forecast Disclaimer
- 18.2 Data Source and Estimation Limitations
Note: The depth of individual sections depends on data availability for this market. Volume, capacity, trade and other unit-based metrics are included where applicable.

