
Bar menus and home mixing anchor national syrup demand
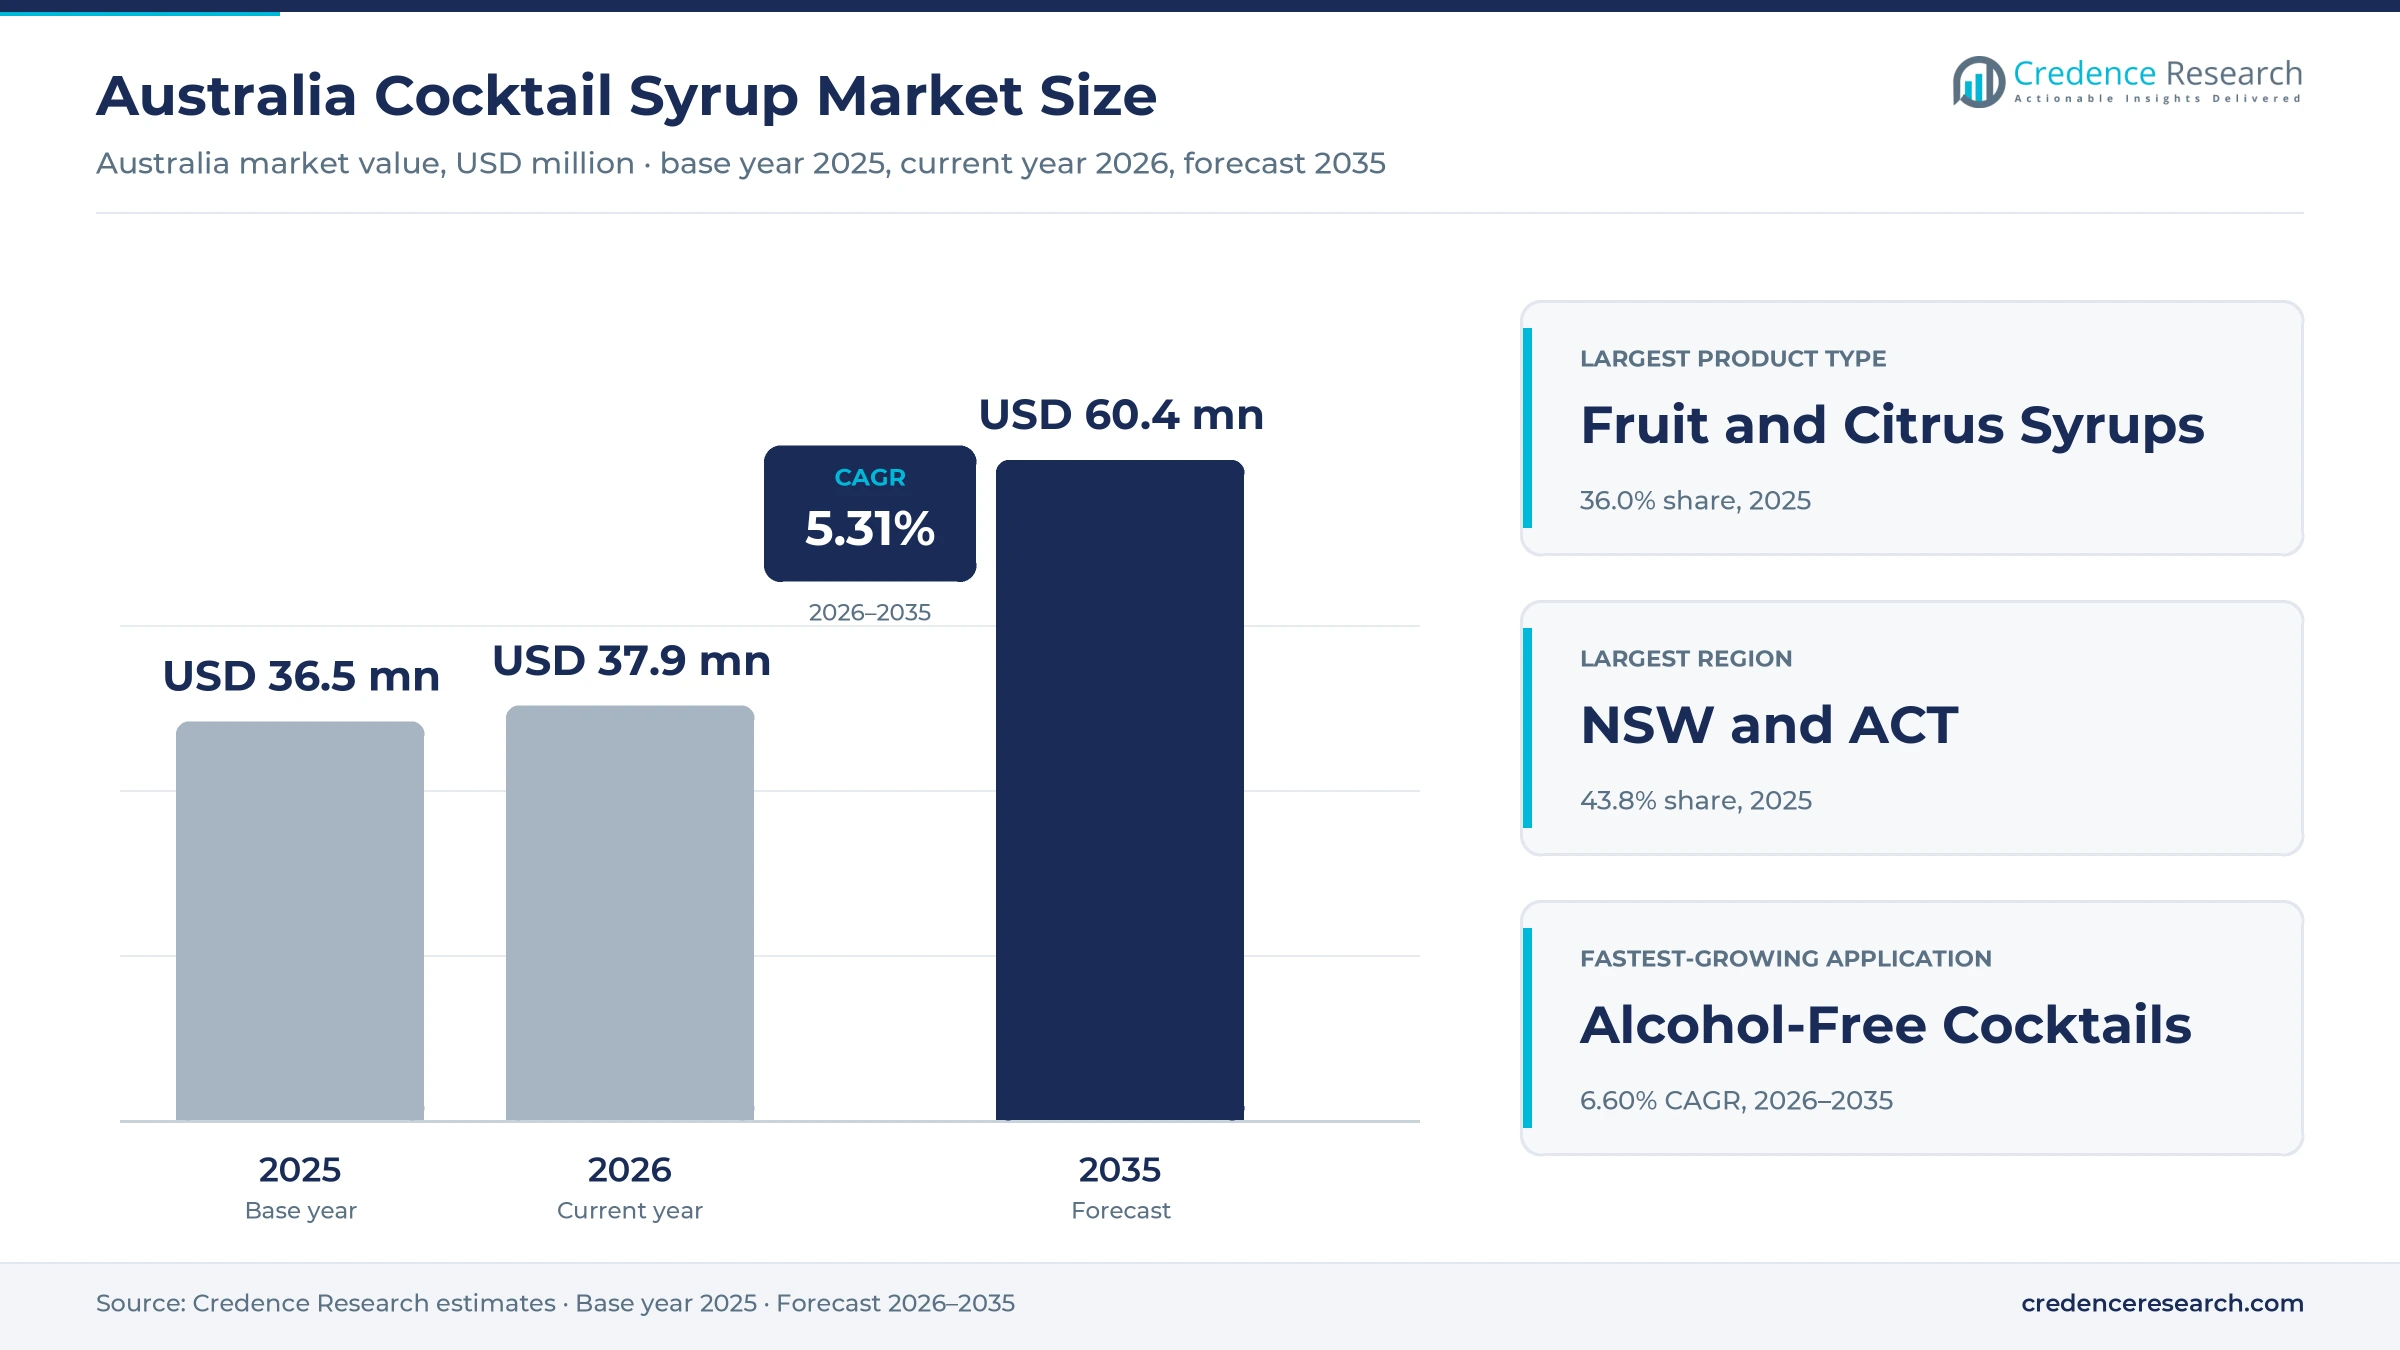
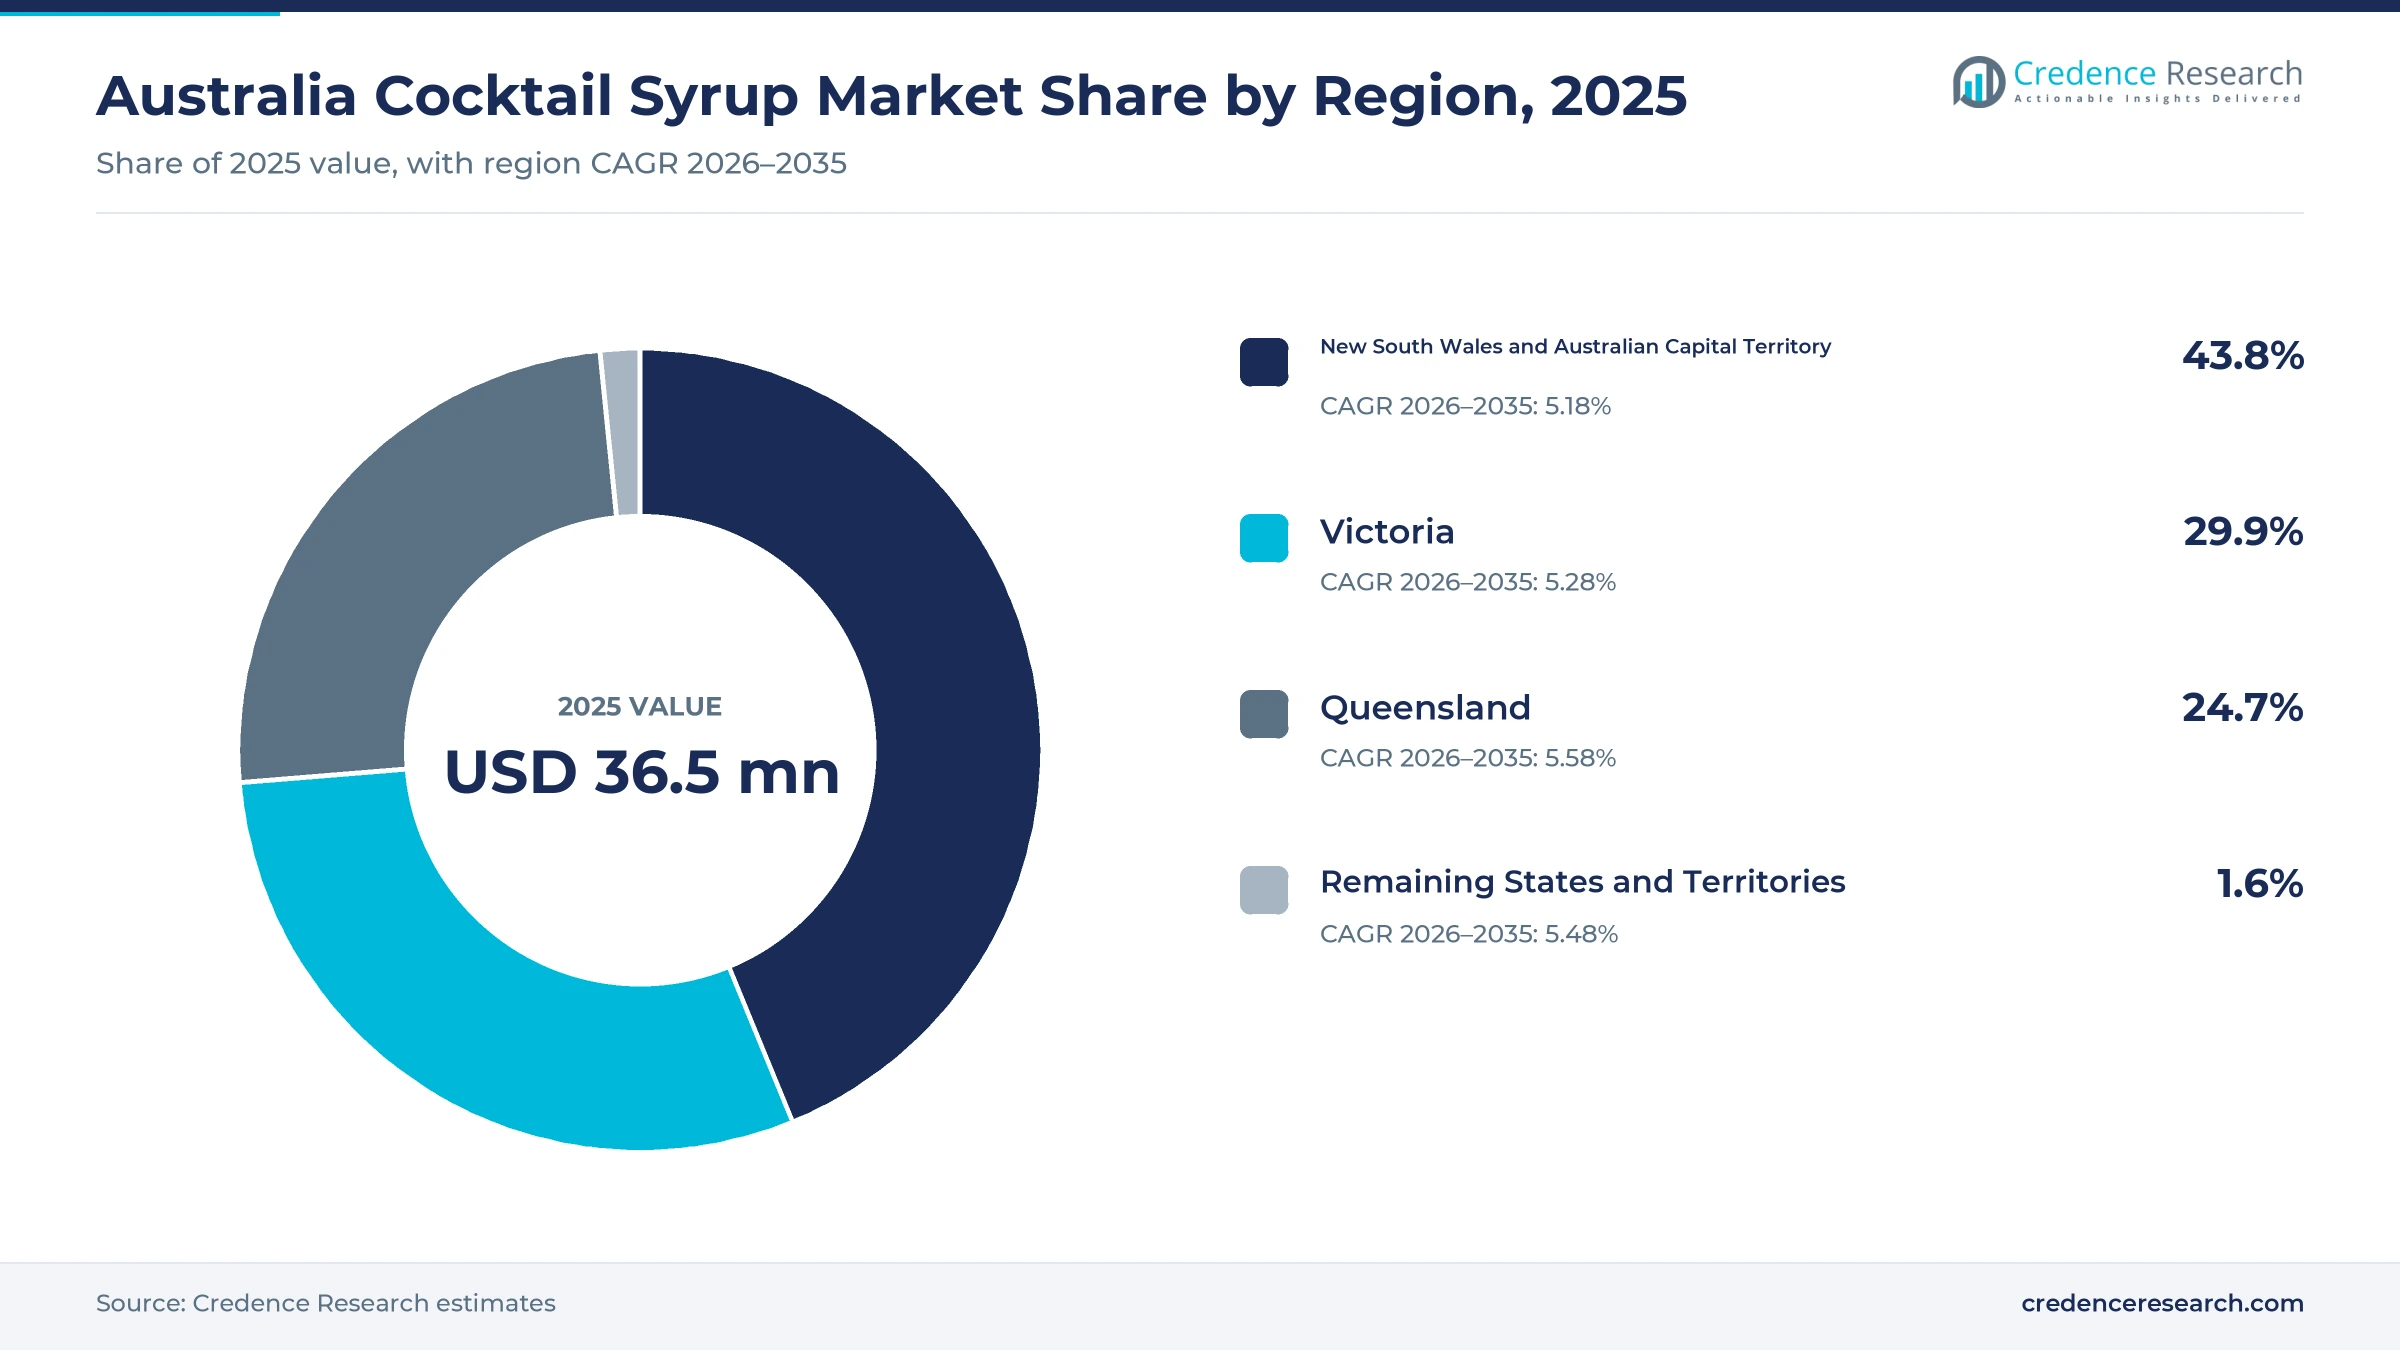
The Australia cocktail syrup market was valued at USD 36.5 million in 2025 and is projected to increase from USD 37.9 million in 2026 to USD 60.4 million by 2035, registering a CAGR of 5.31% during 2026–2035. Demand comes from cocktail bars, pubs, hotel bars, restaurants, caterers and home drinkers that buy flavored, sweetening and classic bar syrups to build consistent drinks at speed. New South Wales and Australian Capital Territory held the largest regional share, 43.8% in 2025, because Sydney hosts the densest cluster of cocktail venues and hotel bars. Queensland is the fastest-growing region at 5.58% a year, as Brisbane visitor spending and new nightlife reforms support venue trade. However, bartenders are shifting toward lighter, citrus-led and lower-alcohol serves, which raises the role of syrups in alcohol-free menus and at-home cocktail kits.
Which syrup types, buyers and sales routes does the estimate cover?
The estimate measures the value of ready-made syrups sold in Australia for mixing cocktails, including fruit and citrus syrups, simple and speciality sweetening syrups, botanical and spice syrups and classic bar syrups such as grenadine, orgeat and falernum. It counts syrups used in spirit-based, wine-based and alcohol-free cocktails, whether bought by venues, caterers or households.
The estimate excludes syrups made from scratch inside venues, coffee-only flavorings sold to cafes, cordials sold mainly as soft drinks, and premixed bottled or canned cocktails. The value chain runs from sugar, fruit and botanical inputs through domestic and imported manufacturing to importers, foodservice wholesalers, liquor retailers, supermarkets and online stores.
Australia Cocktail Syrup Market Insights
- The Australia cocktail syrup market was valued at USD 36.5 million in 2025 and is projected to reach USD 60.4 million by 2035, registering a CAGR of 5.31% during 2026–2035.
- New South Wales and Australian Capital Territory held a 43.8% share of 2025 value, because Sydney combines the largest population with the densest cocktail bar scene.
- Fruit and citrus syrups led with a 36.0% share of 2025 value, because margaritas, daiquiris and palomas rely on bright citrus and fruit bases.
- Endeavour Group reported that its online liquor sales rose 34.8% in fiscal 2026, which widens household access to bar-grade mixing ingredients.
- Alcohol-free cocktails grow fastest by application at 6.60% a year during 2026–2035, as venues add zero-proof menus for younger and moderating drinkers.
Fruit and citrus flavors lead while botanicals grow fastest
Why do fruit and citrus syrups hold the largest value?
Based on product type, the market is categorized into fruit and citrus syrups, simple and speciality sweetening syrups, botanical and spice syrups and classic bar syrups. Fruit and Citrus Syrups led with a 36.0% share of 2025 value, because daiquiris, margaritas and palomas dominate venue menus. Botanical and Spice Syrups grow fastest at 6.42% a year, as bartenders use tea, spice and native botanical flavors to set menus apart.
How do spirit-based serves anchor syrup use?
Based on application, the market is categorized into spirit-based cocktails, wine-based cocktails and alcohol-free cocktails. Spirit-Based Cocktails led with a 72.0% share of 2025 value, because sours, margaritas and old fashioneds each need a sweetening or flavor component. Alcohol-Free Cocktails grow fastest at 6.60% a year, as venues build full zero-proof lists that depend on syrups for body and flavor.
Which customers buy the most cocktail syrup?
Based on customer type, the market is categorized into bars and pubs, hotels and restaurants, catering and events, and households. Bars and Pubs led with a 46.0% share of 2025 value, because high-volume venues use syrups across every shift and menu change. Households grow fastest at 6.18% a year, as home drinkers buy bar-grade bottles through liquor chains and online stores.
How do wholesale and online channels divide sales?
Based on distribution channel, the market is categorized into foodservice wholesale, direct venue sales, retail stores and e-commerce. Foodservice Wholesale led with a 48.0% share of 2025 value, because importers and drinks distributors supply venues alongside spirits and mixers. E-Commerce grows fastest at 6.73% a year, as liquor chains expand delivery and click-and-collect services. Retail stores remain important for households, which buy syrups alongside spirits in liquor chains and supermarkets.
| Segment Group | Leading Sub-segment | Share, 2025 | Fastest-growing Sub-segment | CAGR, 2026–2035 |
|---|---|---|---|---|
| By Product Type | Fruit and Citrus Syrups | 36.0% | Botanical and Spice Syrups | 6.42% |
| By Application | Spirit-Based Cocktails | 72.0% | Alcohol-Free Cocktails | 6.60% |
| By Customer Type | Bars and Pubs | 46.0% | Households | 6.18% |
| By Distribution Channel | Foodservice Wholesale | 48.0% | E-Commerce | 6.73% |
Request a Free Sample
Fill in your details and we'll send you a free sample report.
- Sample data tables & charts
- Research methodology
Menu craft, home mixing and zero-proof serves lift sales
How does cocktail menu differentiation lift syrup use?
Melbourne bar Caretaker's Cottage ranked 19th and Sydney bar Maybe Sammy ranked 42nd in The World's 50 Best Bars list announced in October 2025, which keeps local venues competing on signature serves. Those serves need consistent flavor in every glass, which is why bartenders rely on ready-made syrups. Maybe Sammy now sells a signature paloma for $26 built on smoked rooibos tea and burnt sugar, according to Forbes Australia. Gimlet in Melbourne prices its house spicy margarita at $24, while Sydney group Mucho relaunched its Bar Herbs venue as a martini bar in November 2025. As a result, botanical and spice syrups grow at 6.42% a year, the fastest product type during 2026–2035.
Why does household access to bar-grade ingredients matter?
Dan Murphy's launched its first cocktail book on Oct. 9, 2025, with 68 recipes and a note that cocktails out cost $20 to $30 each, according to owner Endeavour Group. That price gap pushes home drinkers to buy the same bottles that bartenders use behind the counter. Woolworths lists Cawsey's Sugar Syrup, an Australian-origin product, for whiskey sours, mojitos and daiquiris, while Dan Murphy's has listed Crawley's orgeat at $24.95 a bottle. Endeavour Group also reported that online sales rose 34.8% in fiscal 2026 and reached 11.6% of its retail sales. In turn, households grow at 6.18% a year, the fastest customer type during 2026–2035.
How does alcohol-free recipe versatility widen demand?
Non-alcoholic drink sales rose more than 30% year on year, according to Restaurant & Catering Australia, which also said about 70% of younger diners check zero-alcohol options before ordering. Syrups matter here, because they give a zero-proof drink the sweetness, body and flavor that spirits usually provide. Sofitel Darling Harbour partnered with Lyre's on a five-drink alcohol-free menu for Dry July 2025, including an old fashioned built with rosemary and honey syrup. Amber Beverage Group also signed on as the national distributor of Lyre's on April 1, 2025, according to Australian Bartender. As a result, alcohol-free cocktails grow at 6.60% a year, the fastest application during 2026–2035.
Why does distributor depth support imported brands?
Stuart Alexander has distributed MONIN in Australia since 2012, according to BeanScene, and sells the range to bars, hotels and cafes. That reach matters, because venues prefer suppliers that deliver syrups with spirits, mixers and staff training in one order. MONIN reports more than 200 flavors and says 98% of its products use 100% natural ingredients, which gives bartenders a wide menu toolkit. When Stuart Alexander took the brand in August 2012, 85 of 140 MONIN flavors were sold in Australia, according to TheShout. In turn, foodservice wholesale holds 48.0% of 2025 value, because venues buy most syrups through drinks distributors and wholesalers.
Lighter serves, native flavors and online orders gain ground
How is the shift toward lighter serves changing syrup choice?
Odd Culture's Razz Room in Sydney anchors its late-night menu on daiquiris, including a $25 dirty daiquiri and a $25 strawberry slushy with Sichuan peppercorns, which shows the move toward bright, citrus-led drinks. Lachlan Bentley, who runs drinks programs at Gimlet and Apollo Inn in Melbourne, said in July 2026 that spicy margaritas had surged over the previous six to eight months. Paolo Maffietti of Maybe Sammy also said tall drinks with plenty of ice and fresh citrus are rising, with some guests ordering three or four cocktails a visit. MONIN said in March 2026 that it is developing less sweet flavors in response to consumer demand. As a result, fruit and citrus syrups keep 36.0% of 2025 value, the largest product type.
Why is the rise of native Australian flavors notable?
Sydney confectioner Sticky launched Syrups by Sticky at The Rocks on Nov. 8, 2025, describing the product as a syrup inspired by native Australian fruits. This launch reflects a wider push by local makers to give serves a clear sense of place. The company markets the syrup for cocktails, mocktails, slushies and sodas, which spans both alcohol and zero-proof uses. Crawley's, which began in a Bronte living room in 2008, has built a natural range of syrups that includes rose, orgeat and falernum. Real Falernum later became its fastest-growing line, according to Cocktails & Bars, which shows bartender demand for spiced classic syrups. In turn, botanical and spice syrups gain menu space, as venues pair native fruits with liqueur and gin serves.
Can zero-proof menus open new venue accounts?
Restaurant & Catering Australia said in December 2025 that one in three Australians had cut back on alcohol over the past year. Hotels, restaurants and caterers therefore need full alcohol-free lists rather than one soft drink option, which opens new syrup accounts. Lyre's now offers 13 classic spirit styles, which bartenders pair with syrups to build familiar sours and spritzes without alcohol. Dry July has raised more than $97 million since 2008, which keeps July a peak month for alcohol-free menus. As a result, hotels and restaurants can add syrup volume as they pair non-alcoholic spirits with house-made style flavors across bar, banquet and room service menus.
Is there room to grow through online and retail channels?
Online orders now make up 11.6% of Endeavour Group's retail sales, which shows how quickly home drinkers have moved to delivery and click-and-collect. This growth gives syrup brands a direct route to home bartenders who want the same bottles that professional venues stock. Australia had an urban population share of about 87.7% in 2025, according to the World Bank, which suits fast delivery from city warehouses. Many syrup brands also serve cafes, which lets them cross-sell through specialty coffee channels and coffee equipment retailers. In turn, e-commerce grows at 6.73% a year, the fastest distribution channel during 2026–2035.
Spirits tax, venue costs and sugar scrutiny weigh on buyers
How does the spirits tax affect cocktail volumes?
Spirits excise rose to $110.15 per liter of alcohol on Aug. 3, 2026, according to the Australian Taxation Office. As a result, venues pass higher spirits costs into $24 to $26 cocktails, which can cut the number of rounds each guest orders. Draught beer rates stay frozen for two years, which widens the price gap between cocktails and beer at the bar. Syrup makers respond by promoting lower-alcohol and zero-proof serves that avoid most of the duty.
Why do venue operating costs slow menu changes?
Wages, rent and energy bills leave many small bars with thin margins, which slows investment in new cocktail menus. In turn, operators trim cocktail lists and favor syrups that work across several drinks rather than single-use flavors. Suppliers respond with multi-use classic flavors, staff training and recipe support that cut waste behind the bar. This pressure falls hardest on independent bars outside Sydney and Melbourne city centers, where trade is more seasonal and weekday demand is thin.
How does sugar scrutiny shape product development?
Health-focused drinkers and venues increasingly question the sweetness of classic syrup recipes, which pushes makers to rework their formulas. As a result, makers must cut sugar or use alternative sweeteners while keeping texture, stability and shelf life in bar conditions. Reformulation adds testing and label costs, which hits smaller local brands with short production runs hardest. Suppliers respond with less sweet ranges, natural ingredients and smaller pack sizes that suit households and low-volume venues.
Why does import dependence add cost risk?
MONIN is a French company, and several other leading syrup brands are also made overseas and shipped to Australia, which exposes distributors to currency and freight swings. In turn, exchange rate moves change landed prices for distributors and venues from one order to the next. Long shipping lead times also force importers to hold larger stocks of slow-selling flavors. Local makers such as Crawley's and Cawsey's benefit, because shorter supply chains let them react faster to menu trends.
Sydney bar density leads as Brisbane visitor trade rises
| Region | Value, 2025 (USD million) | Share, 2025 | CAGR, 2026–2035 |
|---|---|---|---|
| New South Wales and Australian Capital Territory | 16.0 | 43.8% | 5.18% |
| Victoria | 10.9 | 29.9% | 5.28% |
| Queensland | 9.0 | 24.7% | 5.58% |
| Remaining States and Territories | 0.6 | 1.6% | 5.48% |
What keeps Sydney and Canberra venues ahead on syrup use?
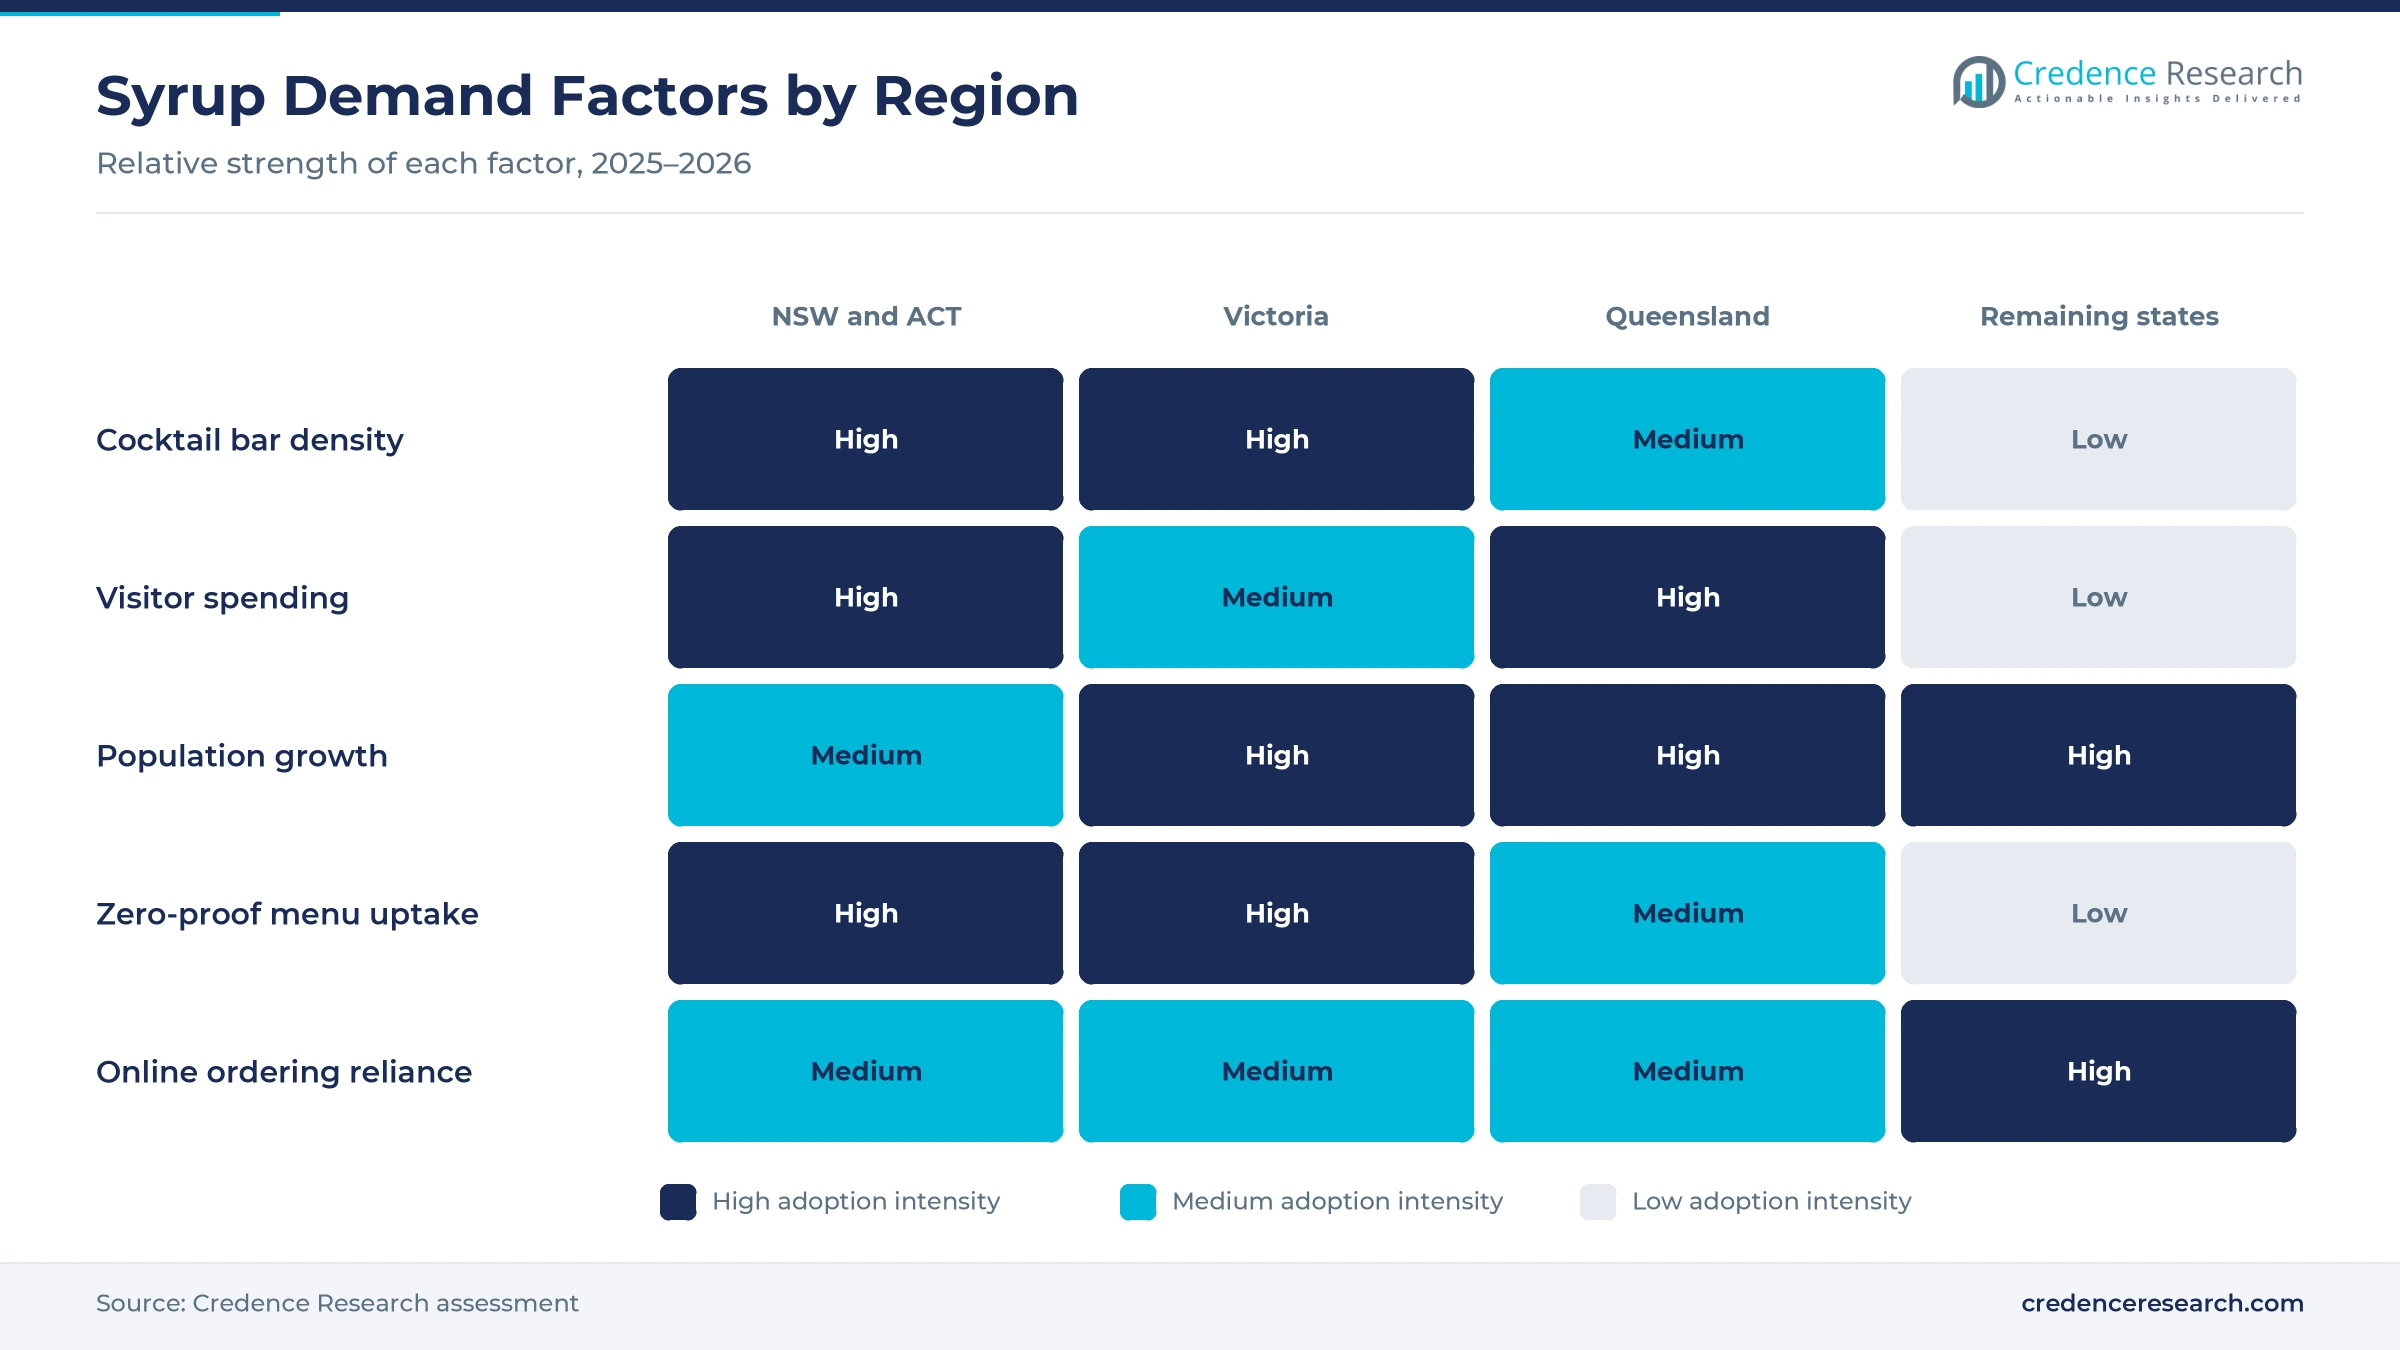
New South Wales and Australian Capital Territory held a 43.8% share of 2025 value and grow at 5.18% a year, because Sydney hosts the densest cluster of cocktail bars. The two jurisdictions, centered on Sydney and Canberra, had about 9.16 million residents at March 31, 2026, according to the Australian Bureau of Statistics. New South Wales vibrancy reforms from July 1, 2024 also allowed small bars a limited takeaway authorization. As a result, Sydney remains the main launch market for new syrup flavors.
How does Victoria support cocktail syrup demand?
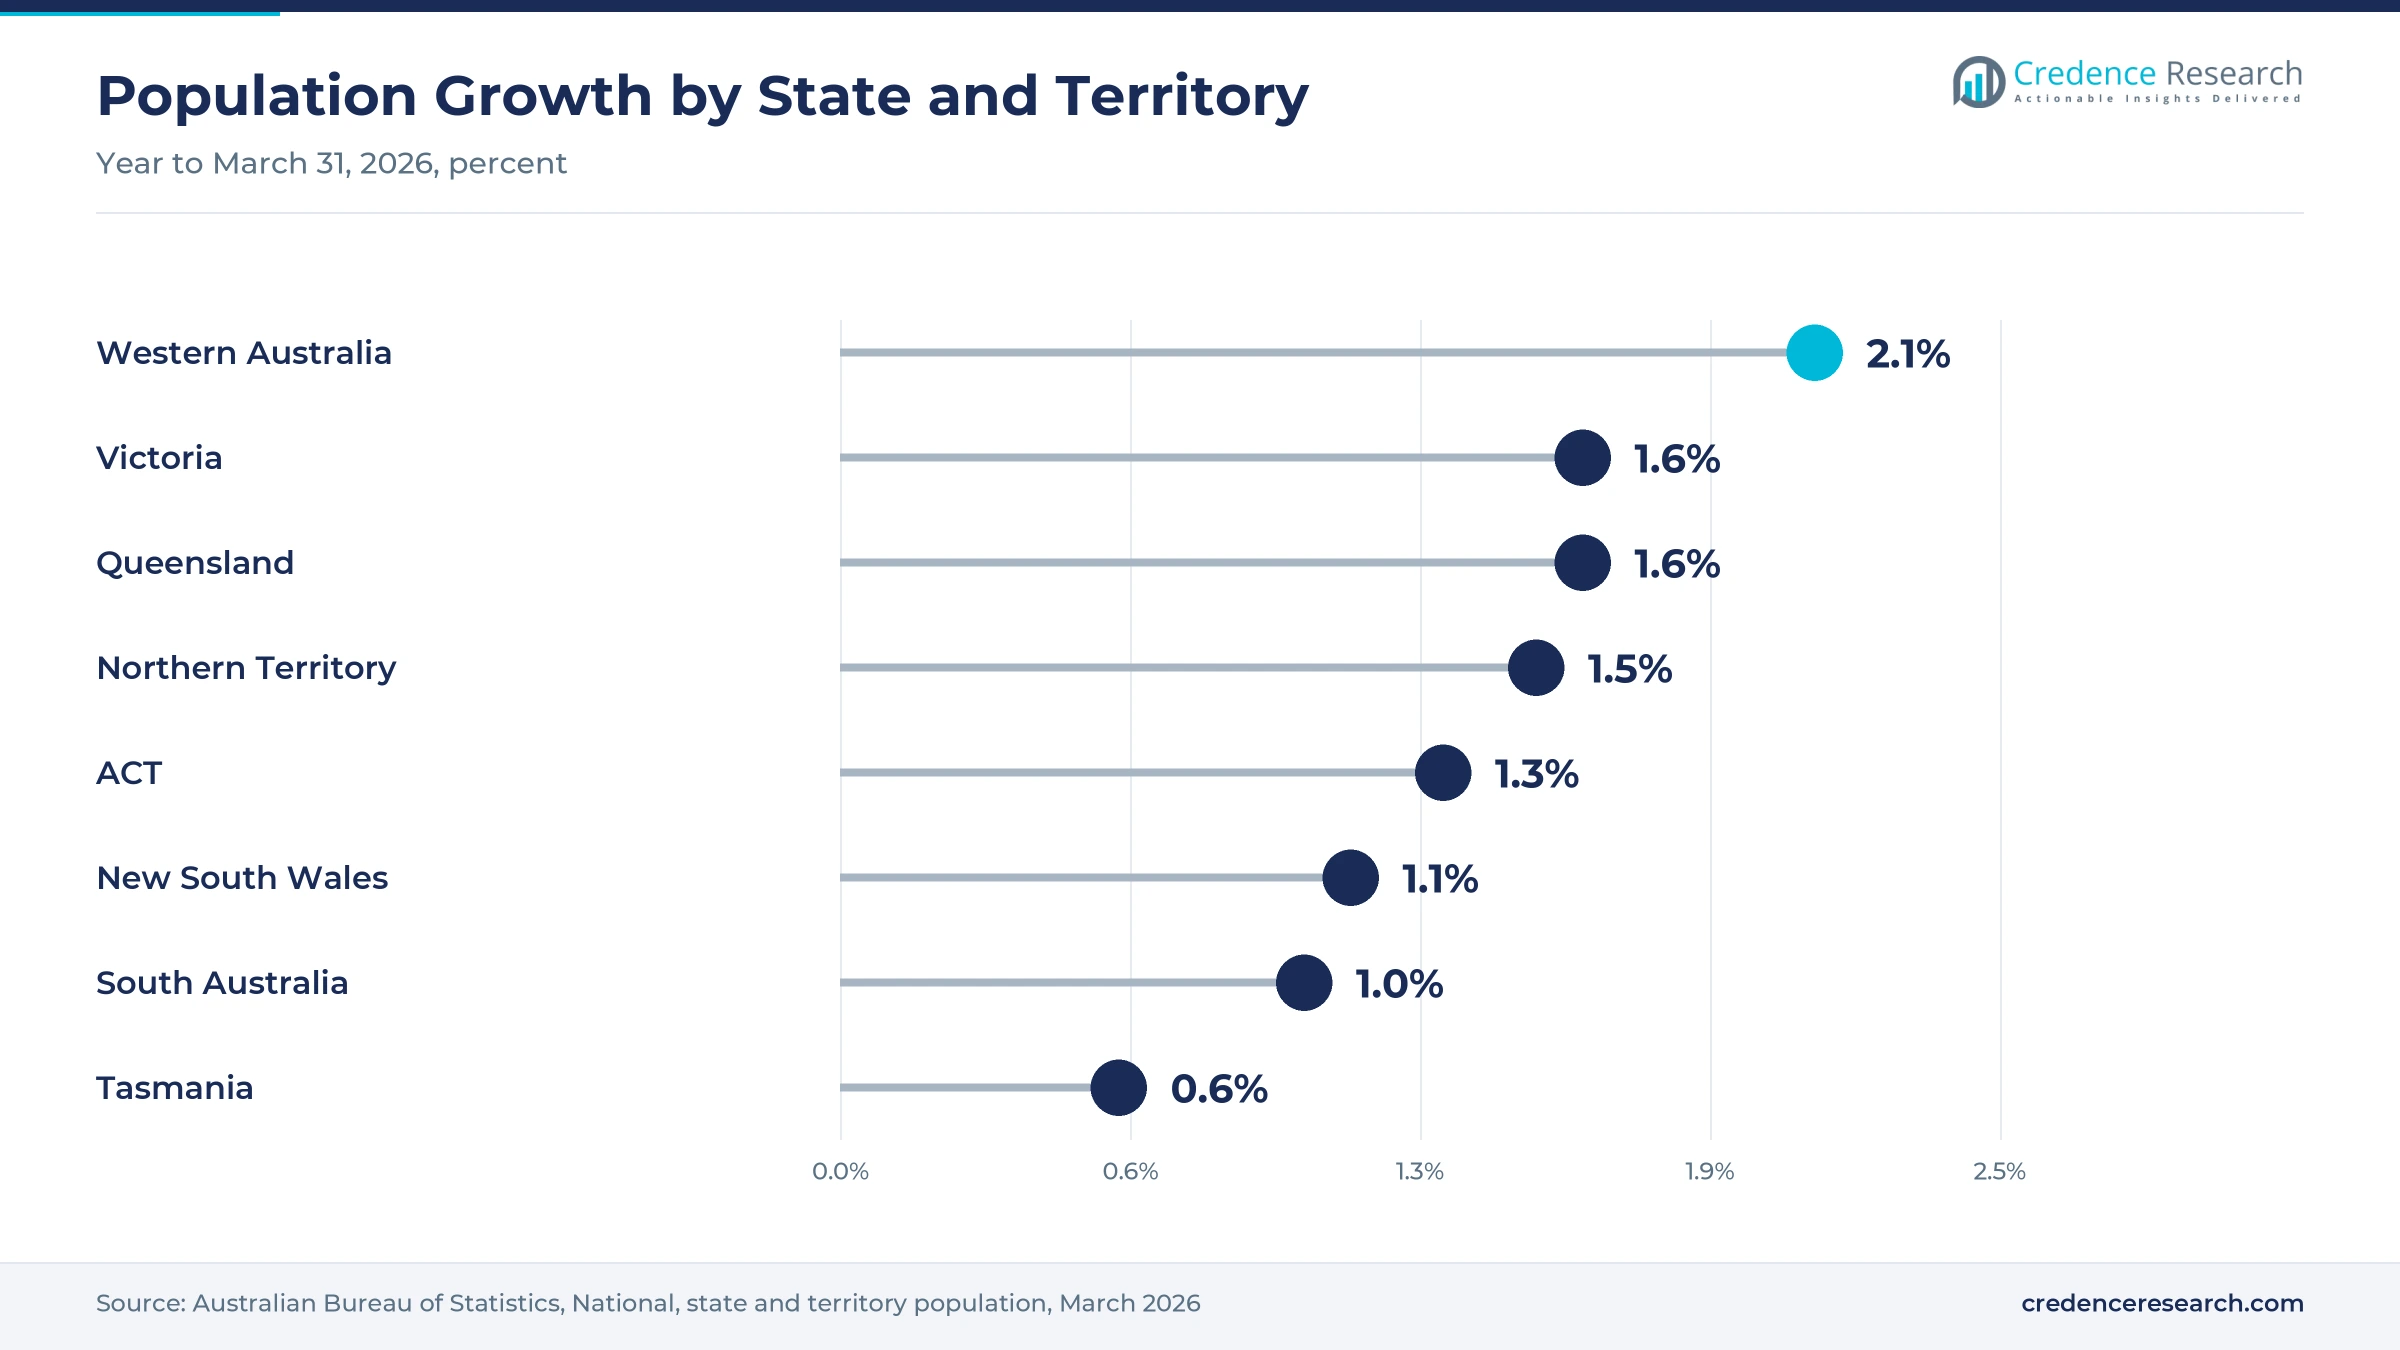
Victoria held a 29.9% share of 2025 value and grows at 5.28% a year, because Melbourne has a deep laneway bar and restaurant culture. Victoria added 109,500 residents in the year to March 2026, the largest gain of any state, according to the Australian Bureau of Statistics. That growth adds new drinkers and venues across Melbourne and regional centers, which widens the customer base for distributors. In turn, Melbourne remains a key market for premium and classic bar syrups.
What lifts Queensland venue demand above other states?
Queensland held a 24.7% share of 2025 value and grows fastest at 5.58% a year, because tourism and population growth lift venue trade. International visitor spending in Brisbane reached a record $3.6 billion in 2025, up 14.8%, according to the Brisbane Economic Development Agency. The state released a Night-life Economy Action Plan on July 29, 2026, with streamlined approval for extended trading. As a result, Queensland should add the most new venue accounts by 2035.
How do the remaining states and territories contribute?
Remaining States and Territories held a 1.6% share of 2025 value and grow at 5.48% a year, because venue demand there is smaller and widely spread. Western Australia had the fastest population growth of any state at 2.1% in the year to March 2026. Many venues in these areas order through national distributors and online stores rather than local wholesalers. In turn, e-commerce and retail stores carry much of the growth in these markets.
Distribution deals, venue programs and policy milestones
| Development | Status and market relevance |
|---|---|
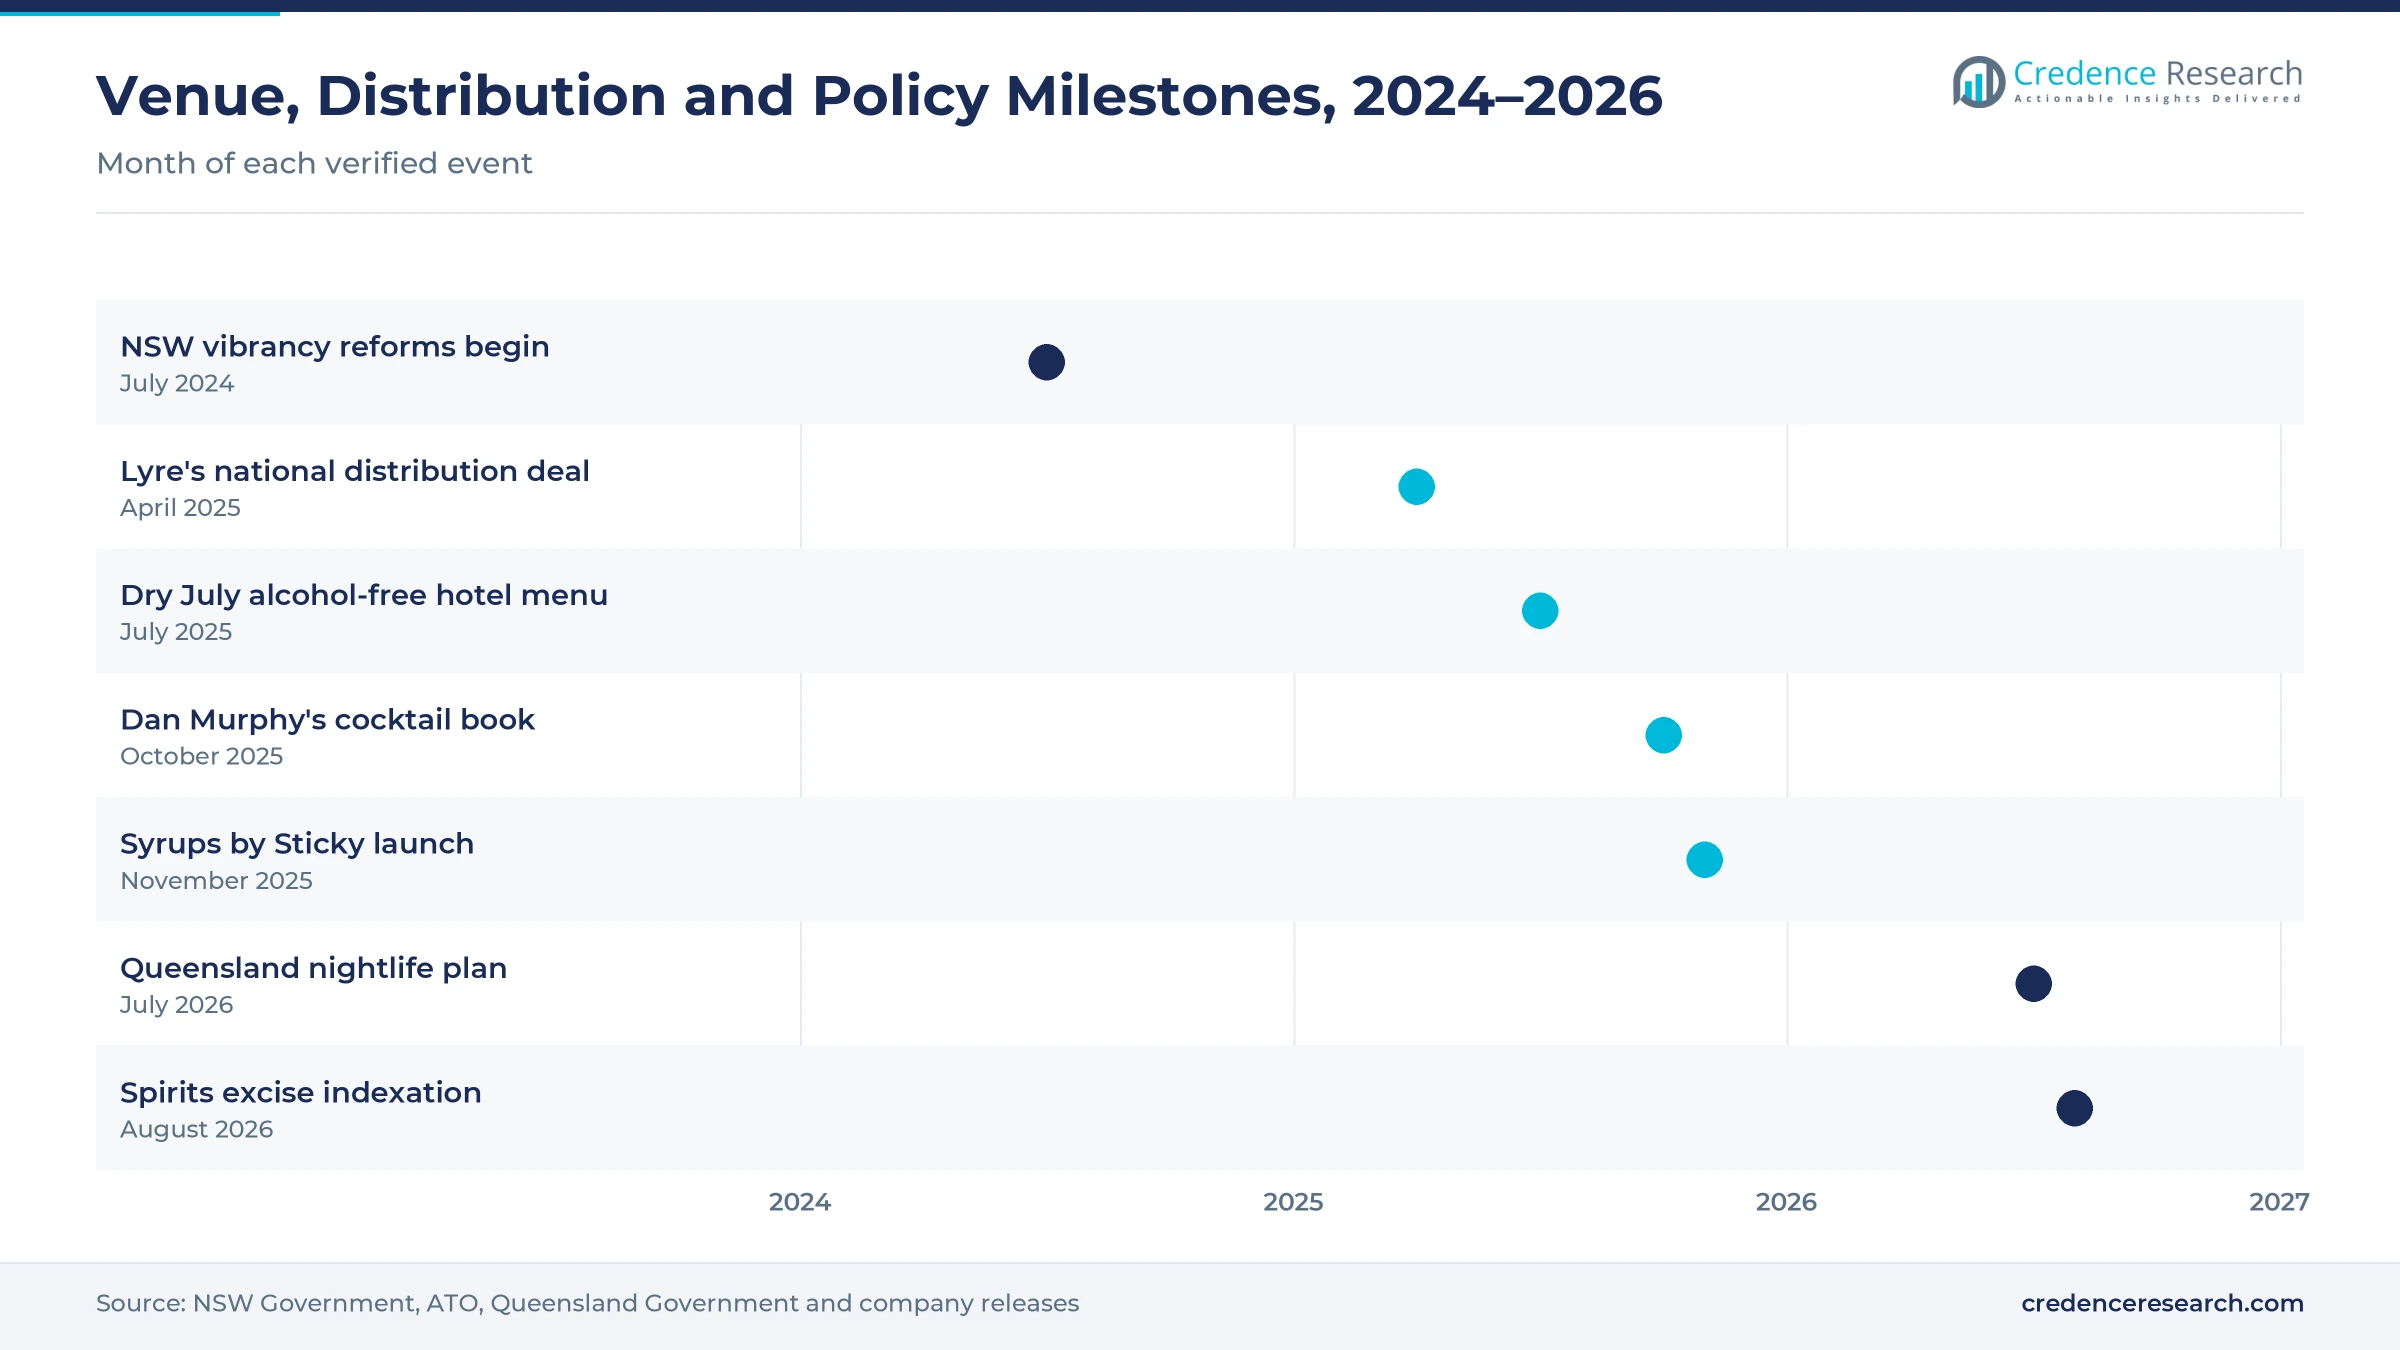
| In July 2024, New South Wales vibrancy reforms began, including a limited takeaway authorization for small bars and restaurants. | Supports small bar trade in the largest regional market |
| In April 2025, Amber Beverage Group became the national distributor of Lyre's non-alcoholic spirits. | Widens zero-proof cocktail supply to venues |
| In October 2025, Dan Murphy's released its first cocktail book with 68 recipes. | Promotes home cocktail making through the largest liquor chain |
| In November 2025, Sticky launched Syrups by Sticky, inspired by native Australian fruits. | Adds a local native flavor range for cocktails and mocktails |
| In July 2026, Queensland released its Night-life Economy Action Plan. | Streamlines extended trading approvals for venues |
Formulation, sourcing and packaging shape syrup quality
- Flavor formulation balances sugar, acid and flavor extracts, which lets one bottle deliver the same taste across thousands of drinks.
- Natural ingredient sourcing replaces artificial colors and flavors with fruit, botanicals and cane sugar, which meets venue demand for clean labels.
- Low-sugar reformulation reduces sweetness with less sugar or alternative sweeteners, which supports lighter and health-focused serves.
- Pour-ready packaging uses pump-ready glass and plastic bottles in bar sizes, which speeds service and limits waste behind the counter.
Need a Custom Version of This Report?
Tailor the scope, geography, or segments to your exact requirements.
- Custom geography or segment scope
- Direct access to our analyst team
Imported brands and local bartender labels compete
Competition centers on imported international syrup brands and a small group of local bartender labels. MONIN, distributed by Stuart Alexander since 2012, offers more than 200 flavors and sells to bars, hotels and cafes nationwide. Crawley's Bartender Syrups, founded by former bartender Jason Crawley in Sydney in 2008, sells natural classic syrups such as orgeat and falernum through Vanguard Luxury Brands and Dan Murphy's. Cawsey's supplies Australian-origin sugar and grenadine syrups through Woolworths and Dan Murphy's, which gives it strong household reach. Newer local entrants such as Sticky use native fruit flavors to stand out. Suppliers compete on flavor range, natural ingredients, price per serve, distributor reach and bartender training. Venues often buy syrups with spirits and liquid sugar through the same wholesaler, which rewards brands with broad distributor partnerships.
Which syrup brands supply Australian venues and homes?
| Company | Type | Role in the market |
|---|---|---|
| MONIN | Imported brand | Distributed by Stuart Alexander to bars, hotels and cafes since 2012 |
| Crawley's Bartender Syrups | Domestic brand | Sydney-founded natural syrup range sold through Vanguard Luxury Brands |
| Cawsey's | Domestic brand | Australian-origin sugar and grenadine syrups sold through major retailers |
| Sticky | Domestic entrant | Launched a native fruit syrup range in Sydney in November 2025 |
Zero-proof lists and home bars set the next growth leg
Credence Research's view is that Australian cocktail syrup demand will grow steadily because venues compete on signature serves and households buy more bar-grade ingredients. Fruit and citrus syrups remain the largest product type, while botanical and spice syrups grow fastest. Alcohol-free cocktails offer the clearest new volume, as younger drinkers moderate and venues build full zero-proof lists. Suppliers that combine natural formulas, less sweet options and broad distributor reach should gain the most share by 2035.
Retail listings, venue menus and tax data frame the model
The report uses 2025 as the base year on a calendar basis, and market values come from the Credence Research model. That model combines company releases, retailer listings, trade and industry association publications, tax rates, official population statistics and international economic data. Regional shares, segment splits and regional growth rates are Credence Research estimates based on population, venue activity and visitor spending. The analysis did not use interviews or surveys, and every dated fact comes from a public source.
Alcohol-free serves and home bars carry growth to 2035
The Australia cocktail syrup market is expected to reach USD 60.4 million by 2035, a 5.31% CAGR during 2026–2035, as bars, restaurants and households keep building more cocktails and zero-proof drinks. Growth should be strongest in alcohol-free cocktails, households, e-commerce and Queensland, because these areas gain most from moderation, home mixing and tourism. Rising spirits tax and venue costs could slow some on-premise demand, while less sweet and native flavor ranges should keep menus fresh.
Frequently Asked Questions
How big is the Australia cocktail syrup market?
Which product type leads cocktail syrup value?
Which region leads the market?
Why are alcohol-free cocktails important for syrup demand?
How are households changing the market?
How does the spirits tax affect demand?
Who are the leading companies in the Australian cocktail syrup market?
What are the main challenges for syrup suppliers?
Table of Content
Chapter 1 Market Segmentation
- 1.1 Segmentation Framework
- 1.1.1 Product and Service Classification
- 1.1.2 Application and End-Use Classification
- 1.1.3 Technology and Solution Classification
- 1.1.4 Customer and Distribution Channel Classification
- 1.1.5 Geographic Segmentation
- 1.1.6 Market Segment Definitions and Boundaries
- 1.2 By Product Type
- 1.2.1 Fruit and Citrus Syrups
- 1.2.2 Simple and Speciality Sweetening Syrups
- 1.2.3 Botanical and Spice Syrups
- 1.2.4 Classic Bar Syrups
- 1.3 By Application
- 1.3.1 Spirit-Based Cocktails
- 1.3.2 Wine-Based Cocktails
- 1.3.3 Alcohol-Free Cocktails
- 1.4 By Customer Type
- 1.4.1 Bars and Pubs
- 1.4.2 Hotels and Restaurants
- 1.4.3 Catering and Events
- 1.4.4 Households
Chapter 2 Introduction
- 2.1 Report Objectives and Scope
- 2.2 Product Definition and Industry Terminology
- 2.3 Market Inclusions and Exclusions
- 2.4 Research Process
- 2.4.1 Primary Research and Expert Interviews
- 2.4.2 Secondary Research and Source Review
- 2.4.3 Top-Down and Bottom-Up Estimation
- 2.4.4 Data Triangulation and Verification
- 2.5 Market Size Measurement Basis
- 2.5.1 2025: USD 36.5 million → 2035: USD 60.4 million
- 2.6 Historical and Forecast Reference Periods
- 2.6.1 Historical Period: 2018-2025
- 2.6.2 Base Year: 2025
- 2.6.3 Forecast Period: 2025-2035
- 2.7 Research Assumptions and Limitations
Chapter 3 Executive Summary
- 3.1 Market Snapshot and Key Findings
- 3.2 Base-Year Market Size, 2025
- 3.3 Forecast Market Size, 2035
- 3.4 Revenue and Volume Growth Outlook
- 3.5 Key Demand and Supply Indicators
- 3.6 Leading Market Segments
- 3.7 Fastest-Growing Market Opportunities
- 3.8 Regional Performance Highlights
- 3.9 Technology and Industry Transformation
- 3.10 Competitive Landscape Summary
- 3.11 Analyst View and Strategic Implications
Chapter 4 Australia Cocktail Syrup Market Trends and Developments
- 4.1 Historical Industry Development, 2018-2025
- 4.2 Recent Market Trends and Developments
- 4.3 Demand and Customer Behavior Trends
- 4.4 Technology and Product Innovation
- 4.5 Artificial Intelligence, Automation and Digitalization
- 4.6 Local Manufacturing and Supply Chain Realignment
- 4.7 Industry Partnerships, Mergers and Acquisitions
- 4.8 Sustainability and Circular Economy Developments
- 4.9 Government and Private Sector Investment Trends
- 4.10 Emerging Business Models and Commercialization
- 4.11 Industry Developments and Announcements
Chapter 5 Australia Cocktail Syrup Market Production, Supply and Demand Analysis
- 5.1 Demand Trend and Consumption Analysis, 2018-2025
- 5.2 Demand Forecast, 2025-2035
- 5.3 Production and Output Trend, 2018-2025
- 5.4 Production and Output Forecast, 2025-2035
- 5.5 Installed Capacity and Capacity Utilization
- 5.6 Company-Wise Production Plants and Statistics
- 5.6.1 Installed Production Capacity
- 5.6.2 Actual Production
- 5.6.3 Planned Capacity and Expansion Targets
- 5.7 Supply Chain Structure and Procurement Trends
- 5.8 Supply-Demand Gap and Bottlenecks
- 5.9 Import Dependence and Sourcing Structure
- 5.10 Contract Manufacturing and Outsourcing
- 5.11 Regional Supply and Demand Concentration
Chapter 6 Australia Cocktail Syrup Market Pricing Analysis
- 6.1 Pricing Structure and Measurement
- 6.2 Historical Pricing Trends, 2018-2025
- 6.3 Pricing Outlook, 2025-2035
- 6.4 Average Selling Price and Unit Economics
- 6.5 Pricing by Product and Market Segment
- 6.6 Geographic Pricing Differences
- 6.7 Key Input, Energy, Labor and Logistics Costs
- 6.8 Contract Pricing and Purchasing Models
- 6.9 Pricing Sensitivity and Competitive Positioning
- 6.10 Price, Margin and Profitability Implications
Chapter 7 Australia Cocktail Syrup Market Dynamics
- 7.1 Market Growth Drivers
- 7.1.1 Demand-Side Drivers
- 7.1.2 Technology and Innovation Drivers
- 7.1.3 Infrastructure and Investment Drivers
- 7.1.4 Regulatory and Policy Drivers
- 7.2 Market Restraints
- 7.2.1 Cost and Affordability Constraints
- 7.2.2 Technology and Adoption Barriers
- 7.2.3 Supply Chain and Operational Constraints
- 7.3 Market Challenges
- 7.3.1 Competitive Pressure and Margin Erosion
- 7.3.2 Skills, Infrastructure and Implementation Gaps
- 7.4 Emerging Market Opportunities
- 7.5 Market Dynamics Impact and Time-Horizon Assessment
Chapter 8 Australia Cocktail Syrup Value Chain Analysis
- 8.1 Industry Value Chain Overview
- 8.2 Upstream Suppliers and Critical Inputs
- 8.3 Technology and Component Providers
- 8.4 Manufacturing or Service Delivery
- 8.5 Distribution, Channel Partners and Integrators
- 8.6 Downstream Applications and End Users
- 8.7 Value Addition and Profit Pools
- 8.8 Vertical Integration and Outsourcing
- 8.9 Supplier Concentration and Risk
- 8.10 Supply Chain Localization and Resilience
Chapter 9 Australia Cocktail Syrup Market Regulations and Policies
- 9.1 Relevant Laws, Standards and Compliance Frameworks
- 9.2 Product, Service, Safety and Quality Requirements
- 9.3 Government Policies, Incentives and Subsidies
- 9.4 Imports, Exports and Trade Barriers
- 9.5 Public Procurement and Local Content Requirements
- 9.6 Environmental and Sustainability Compliance
- 9.7 Upcoming Policy Changes and Market Implications
Chapter 10 Australia Cocktail Syrup Market Hotspots and Opportunities
- 10.1 Market Opportunity Mapping and Growth Hotspots
- 10.2 High-Growth Applications and Customer Groups
- 10.3 Underserved Markets and White-Space Opportunities
- 10.4 Emerging Technology and Product Opportunities
- 10.5 New Capacity and Investment Hotspots
- 10.6 Market Entry and Expansion Opportunities
- 10.7 Distribution and Partnership Opportunities
- 10.8 Near-Term and Long-Term Commercial Potential
- 10.9 Opportunity Attractiveness and Execution Risks
Chapter 11 Australia Cocktail Syrup Market Outlook, 2025-2035
- 11.1 Market Size and Analysis
- 11.1.1 Revenue (Market Measurement: 2025: USD 36.5 million → 2035: USD 60.4 million)
- 11.1.2 Market Volume and Quantity Sold
- 11.1.3 Historical Market Size, 2018-2025
- 11.1.4 Base-Year Market Size, 2025
- 11.2 Market Forecast, 2025-2035
- 11.2.1 Revenue Forecast to 2035
- 11.2.2 Volume Forecast to 2035
- 11.2.3 CAGR and Year-on-Year Growth
- 11.2.4 Incremental Revenue Opportunity
- 11.3 Forecast Assumptions and Scenario Analysis
- 11.3.1 Base-Case Forecast
- 11.3.2 Optimistic and Conservative Scenarios
- 11.3.3 Technology, Pricing and Policy Sensitivities
- 11.4 Market Attractiveness and Growth Outlook
Chapter 12 Australia Cocktail Syrup Market Segmentation and Outlook
- 12.1 Segmentation Summary and Market Shares, 2025
- 12.2 Largest and Fastest-Growing Segments
- 12.3 By Product Type - Market Size and Forecast, 2025-2035
- 12.3.1 Segment Definition and Scope
- 12.3.2 Historical Market Size, 2018-2025
- 12.3.3 Revenue Forecast, 2025-2035
- 12.3.4 Volume Forecast, 2025-2035
- 12.3.5 Base-Year Market Share, 2025
- 12.3.6 Segment CAGR and Growth Drivers
- 12.3.7 Subsegment Market Size and Forecast
- 12.3.7.1 Fruit and Citrus Syrups
- 12.3.7.2 Simple and Speciality Sweetening Syrups
- 12.3.7.3 Botanical and Spice Syrups
- 12.3.7.4 Classic Bar Syrups
- 12.3.8 Subsegment Pricing and Adoption Trends
- 12.3.9 Leading Suppliers and Competition
- 12.3.10 Regional Demand and Opportunities
- 12.4 By Application - Market Size and Forecast, 2025-2035
- 12.4.1 Segment Definition and Scope
- 12.4.2 Historical Market Size, 2018-2025
- 12.4.3 Revenue Forecast, 2025-2035
- 12.4.4 Volume Forecast, 2025-2035
- 12.4.5 Base-Year Market Share, 2025
- 12.4.6 Segment CAGR and Growth Drivers
- 12.4.7 Subsegment Market Size and Forecast
- 12.4.7.1 Spirit-Based Cocktails
- 12.4.7.2 Wine-Based Cocktails
- 12.4.7.3 Alcohol-Free Cocktails
- 12.4.8 Subsegment Pricing and Adoption Trends
- 12.4.9 Leading Suppliers and Competition
- 12.4.10 Regional Demand and Opportunities
- 12.5 By Customer Type - Market Size and Forecast, 2025-2035
- 12.5.1 Segment Definition and Scope
- 12.5.2 Historical Market Size, 2018-2025
- 12.5.3 Revenue Forecast, 2025-2035
- 12.5.4 Volume Forecast, 2025-2035
- 12.5.5 Base-Year Market Share, 2025
- 12.5.6 Segment CAGR and Growth Drivers
- 12.5.7 Subsegment Market Size and Forecast
- 12.5.7.1 Bars and Pubs
- 12.5.7.2 Hotels and Restaurants
- 12.5.7.3 Catering and Events
- 12.5.7.4 Households
- 12.5.8 Subsegment Pricing and Adoption Trends
- 12.5.9 Leading Suppliers and Competition
- 12.5.10 Regional Demand and Opportunities
- 12.6 Segment Growth Comparison
- 12.7 Segment Attractiveness and Priority Matrix
Chapter 13 Australia Cocktail Syrup End-Use and Application Market Outlook
- 13.1 End-Use Industry and Customer Demand Structure
- 13.2 Leading Applications and Customer Groups
- 13.3 End-Use Market Size, Share and Forecast
- 13.4 Major End-Use Industry Deep Dives
- 13.4.1 Customer Requirements and Use Cases
- 13.4.2 Demand and Replacement Cycles
- 13.4.3 Technical and Regulatory Considerations
- 13.4.4 Purchasing and Procurement Models
- 13.4.5 Leading Vendors and Distribution Channels
- 13.4.6 Forecast and Commercial Opportunities
- 13.5 Emerging Applications and Cross-Segment Demand
- 13.6 End-Use Industry Investment Priorities
Chapter 14 Australia Cocktail Syrup Geographic Market Outlook, 2025-2035
- 14.1 Domestic Market Distribution and Demand Clusters
- 14.2 State- or Province-Wise Market Size and Forecast, 2025-2035
- 14.3 City and Metropolitan Market Outlook
- 14.4 Industrial, Manufacturing and Commercial Clusters
- 14.5 Geographic Concentration of Key End Users
- 14.6 Local Pricing and Purchasing Differences
- 14.7 Domestic Production Facilities and Capacity Map
- 14.8 Local Infrastructure and Project Pipeline
- 14.9 State-Level Policy and Incentive Differences
- 14.10 Subnational Investment Hotspots and Opportunities
- 14.11 Distribution and Logistics Networks
- 14.12 Domestic Competitive Footprint
Chapter 15 Australia Cocktail Syrup Technology, Innovation and Sustainability Outlook
- 15.1 Technology Landscape and Maturity
- 15.2 Product, Process and Service Innovation
- 15.3 AI, Automation and Digital Tools in the Industry
- 15.4 Technology Adoption and Performance Benchmarking
- 15.5 Innovation Pipeline and R&D Investment
- 15.6 Patent and Intellectual Property Trends
- 15.7 Energy Efficiency and Resource Management
- 15.8 Sustainability, Recycling and Circularity
- 15.9 Technology Roadmap, 2025-2035
- 15.10 Risks of Obsolescence and Technology Substitution
Chapter 16 Australia Cocktail Syrup Market Key Strategic Imperatives
- 16.1 Growth and Market Entry Priorities
- 16.2 High-Return Products and Segments
- 16.3 Pricing, Profitability and Cost Optimization
- 16.4 Technology Investment and Product Differentiation
- 16.5 Supply Chain Localization and Resilience
- 16.6 Distribution and Customer Acquisition
- 16.7 Partnership, Acquisition and Capacity Strategy
- 16.8 Regional Expansion Priorities
- 16.9 Short-, Medium- and Long-Term Actions
Chapter 17 Competition Outlook
- 17.1 Industry Competition Characteristics
- 17.2 Market Structure and Concentration
- 17.3 Market Share and Competitive Positioning, 2025
- 17.4 Company-Wise Revenue and Product Benchmarking
- 17.5 Production and Service Capacity Benchmarking
- 17.6 Technology, Pricing and Differentiation
- 17.7 Regional Footprint and Distribution Strength
- 17.8 Mergers, Acquisitions and Strategic Alliances
- 17.9 New Entrants and Competitive Threats
- 17.10 Porter's Five Forces and Industry Attractiveness
- 17.11 Competitive Outlook, 2025-2035
Chapter 18 Company Profiles
- 18.1 Company Coverage and Selection Criteria
- 18.2 MONIN
- 18.2.1 Business Description
- 18.2.2 Company Ownership and Geographic Presence
- 18.2.3 Product and Service Portfolio
- 18.2.4 Manufacturing and Operating Footprint
- 18.2.5 Production Capacity and Expansion Plans
- 18.2.6 Financial Performance and Investment
- 18.2.7 Market Share and Competitive Position
- 18.2.8 Technology and Innovation Capabilities
- 18.2.9 Strategic Alliances or Partnerships
- 18.2.10 Recent Developments
- 18.2.11 Growth Strategy and Outlook
- 18.3 1883 Maison Routin
- 18.4 Torani
- 18.5 DaVinci Gourmet
- 18.6 Finest Call
- 18.7 Giffard
- 18.8 SHOTT Beverages
- 18.9 Crawley's Bartender Syrups
- 18.10 Cawsey's
- 18.11 Solano's Syrups
- 18.12 Other Relevant Market Participants
Note: Every listed company is profiled on the structure shown under the first company. The company list is preliminary and may change based on research findings, market developments, data availability and client requirements.
Chapter 19 Disclaimer
- 19.1 Research and Forecast Disclaimer
- 19.2 Data Source and Estimation Limitations
Note: The depth of individual sections depends on data availability for this market. Volume, capacity, trade and other unit-based metrics are included where applicable.

