
Steady imports and new formats widen everyday buying
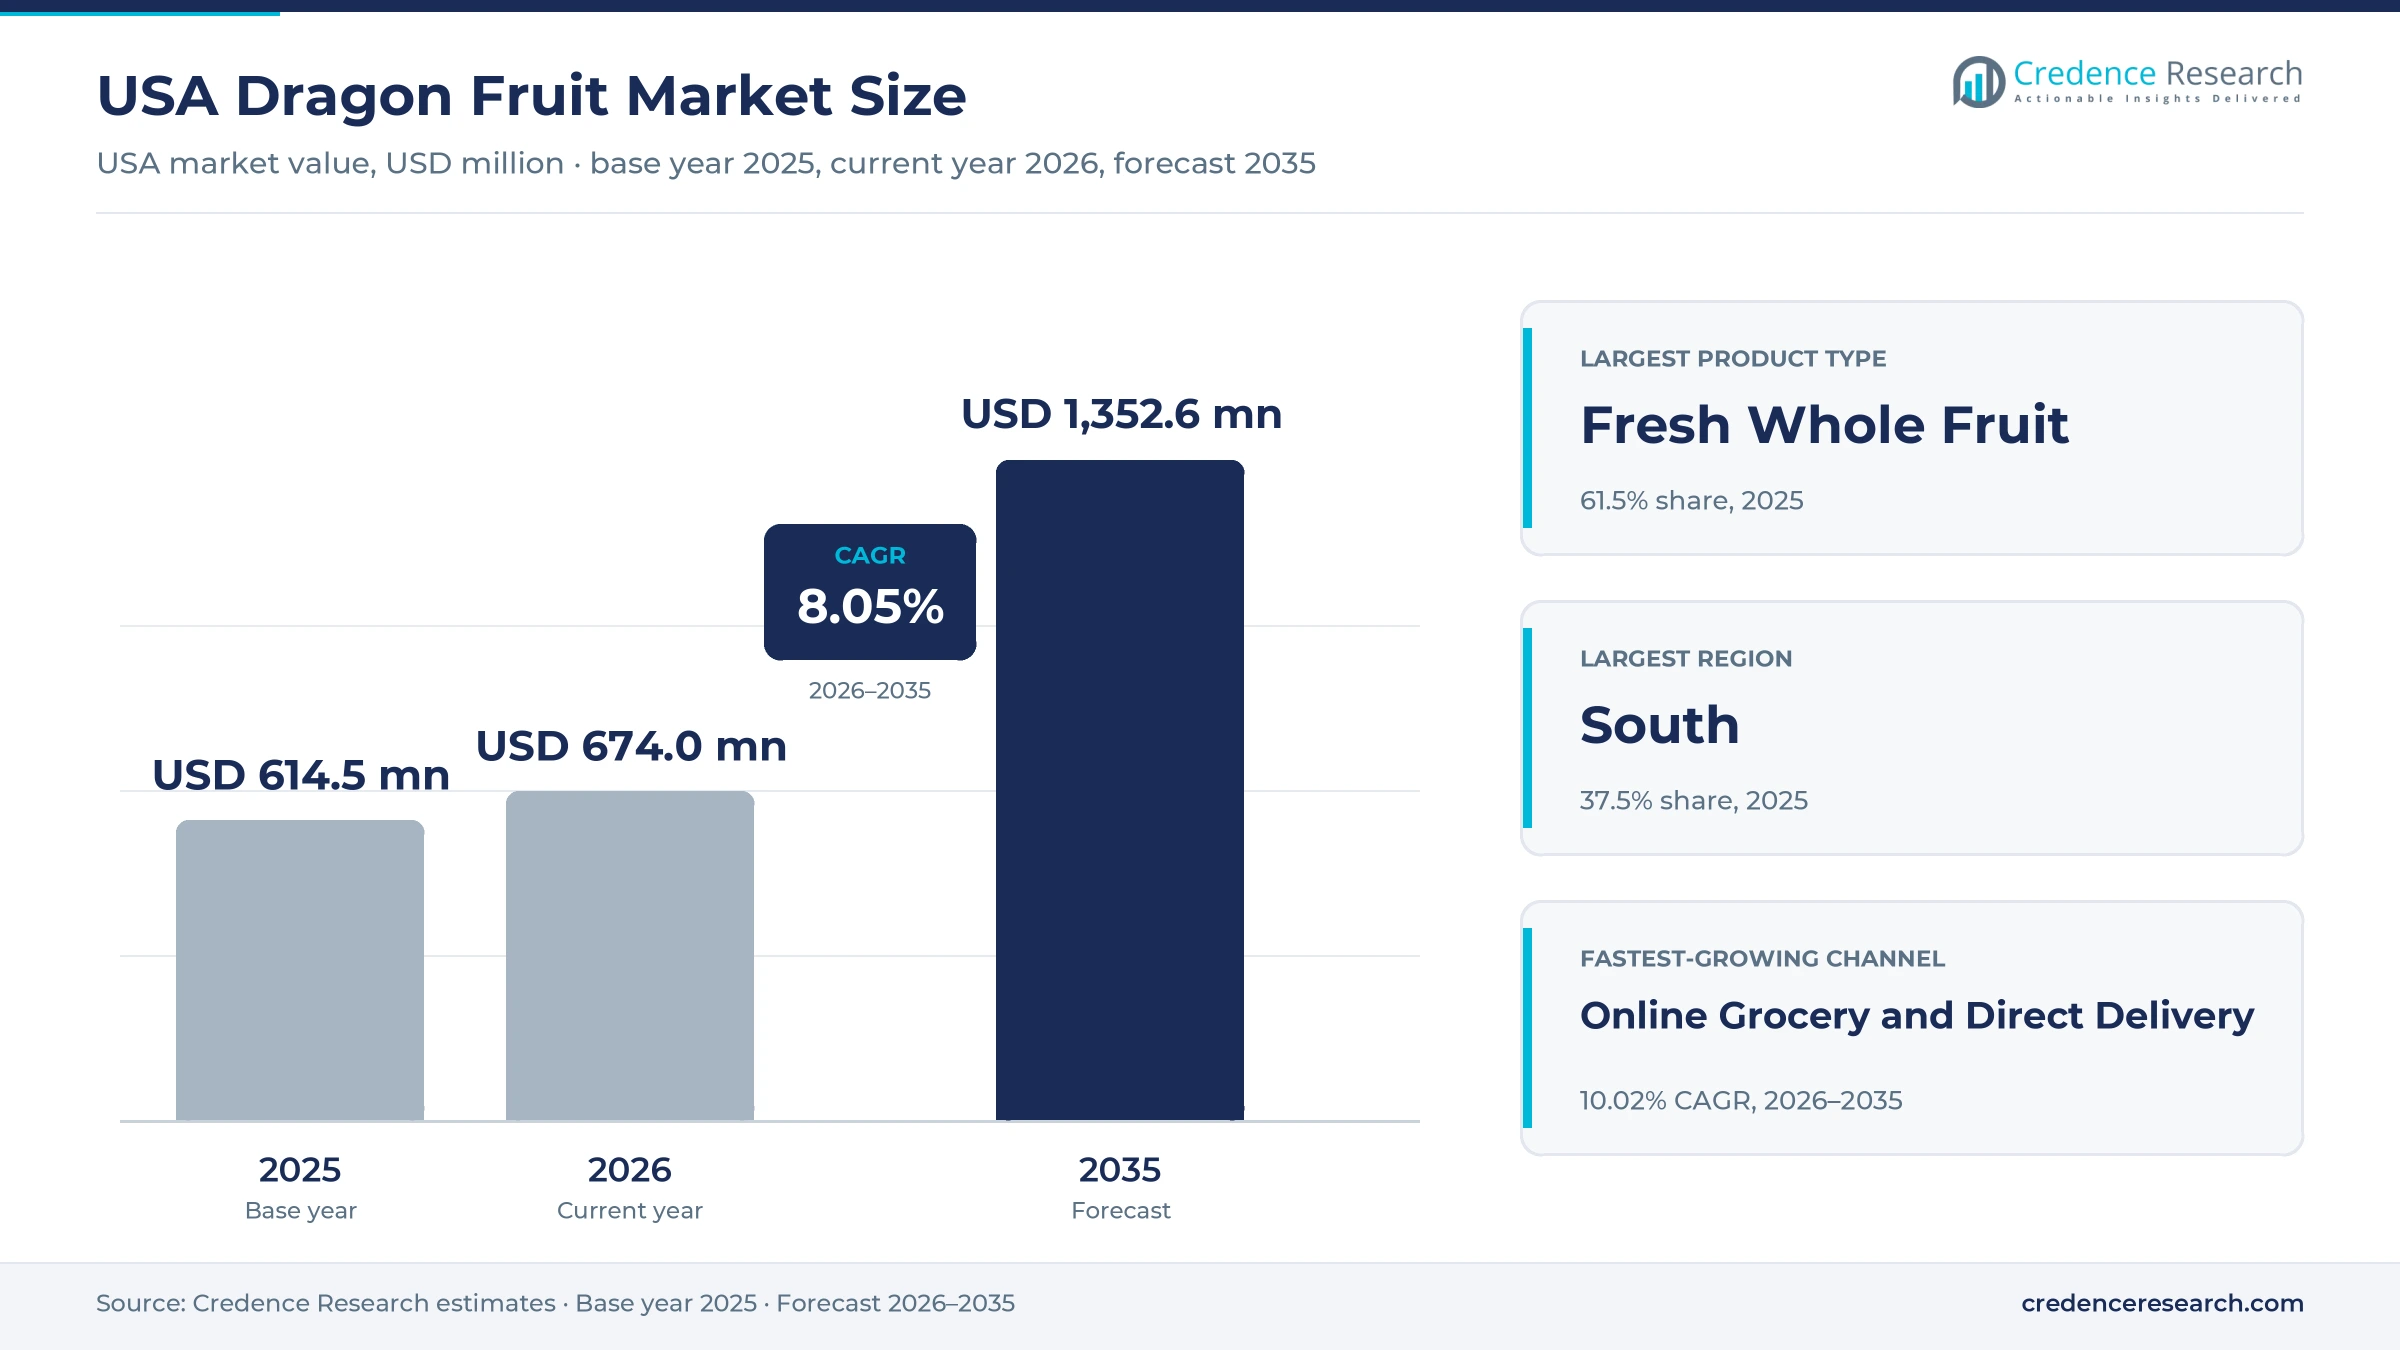
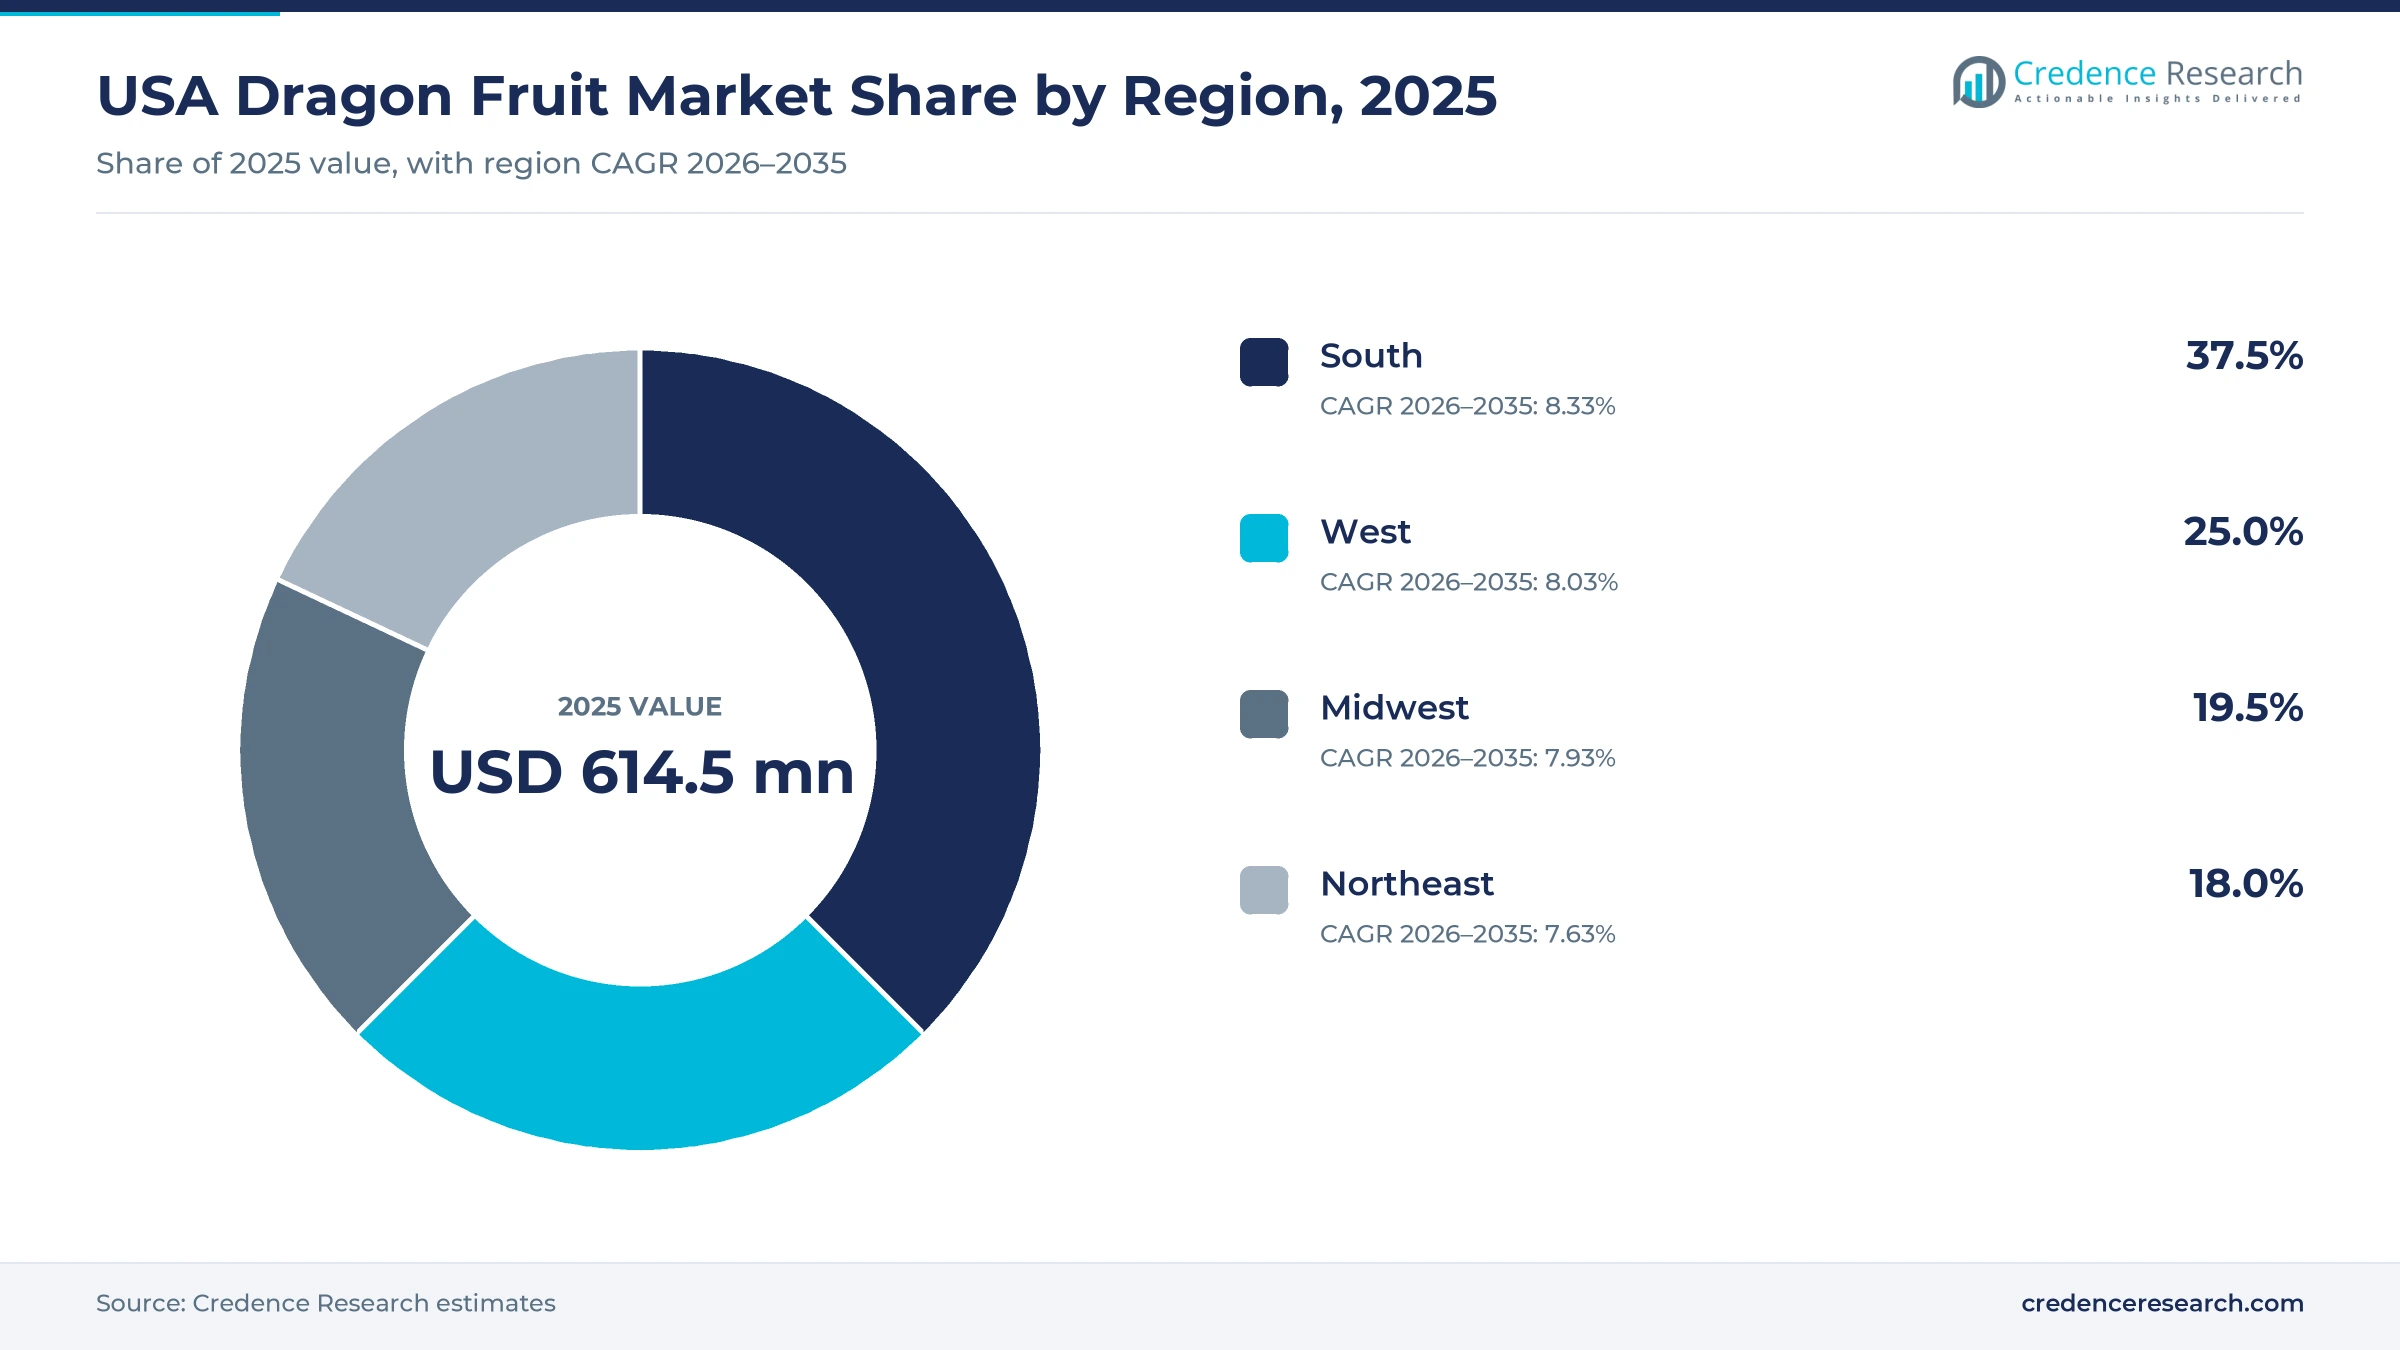
The USA dragon fruit market was valued at USD 614.5 million in 2025 and is projected to increase from USD 674.0 million in 2026 to USD 1.35 billion by 2035, registering a CAGR of 8.05% during 2026–2035. Demand comes from households, smoothie shops, restaurants and food makers that buy fresh pitaya and frozen pulp for color, mild sweetness and a healthy image. The South held the largest regional share, 37.5% in 2025, because it is the most populous region and the main entry point for tropical produce. The South is also the fastest-growing region at 8.33% a year, as its population keeps rising faster than other regions. In turn, Ecuador shipped about three-quarters of its pitahaya exports to the United States in 2025, which keeps supermarket shelves supplied for most of the year.
Which pitaya products does the U.S. estimate count?
The estimate measures the value of fresh whole pitaya, frozen fruit and pulp, puree and juice ingredients, and dried and freeze-dried products sold in the United States. It counts sales to households through supermarkets, specialty produce stores and online grocery, plus sales to restaurants, smoothie shops and food manufacturers.
The estimate excludes plants and cuttings sold to growers, finished beverages and desserts where pitaya is only a minor ingredient, and exports. The value chain runs from growers in Ecuador, Central America, Vietnam and Florida through importers, packers and distributors to retailers and foodservice buyers.
USA Dragon Fruit Market Insights
- The USA dragon fruit market was valued at USD 614.5 million in 2025 and is projected to reach USD 1.35 billion by 2035, registering a CAGR of 8.05% during 2026–2035.
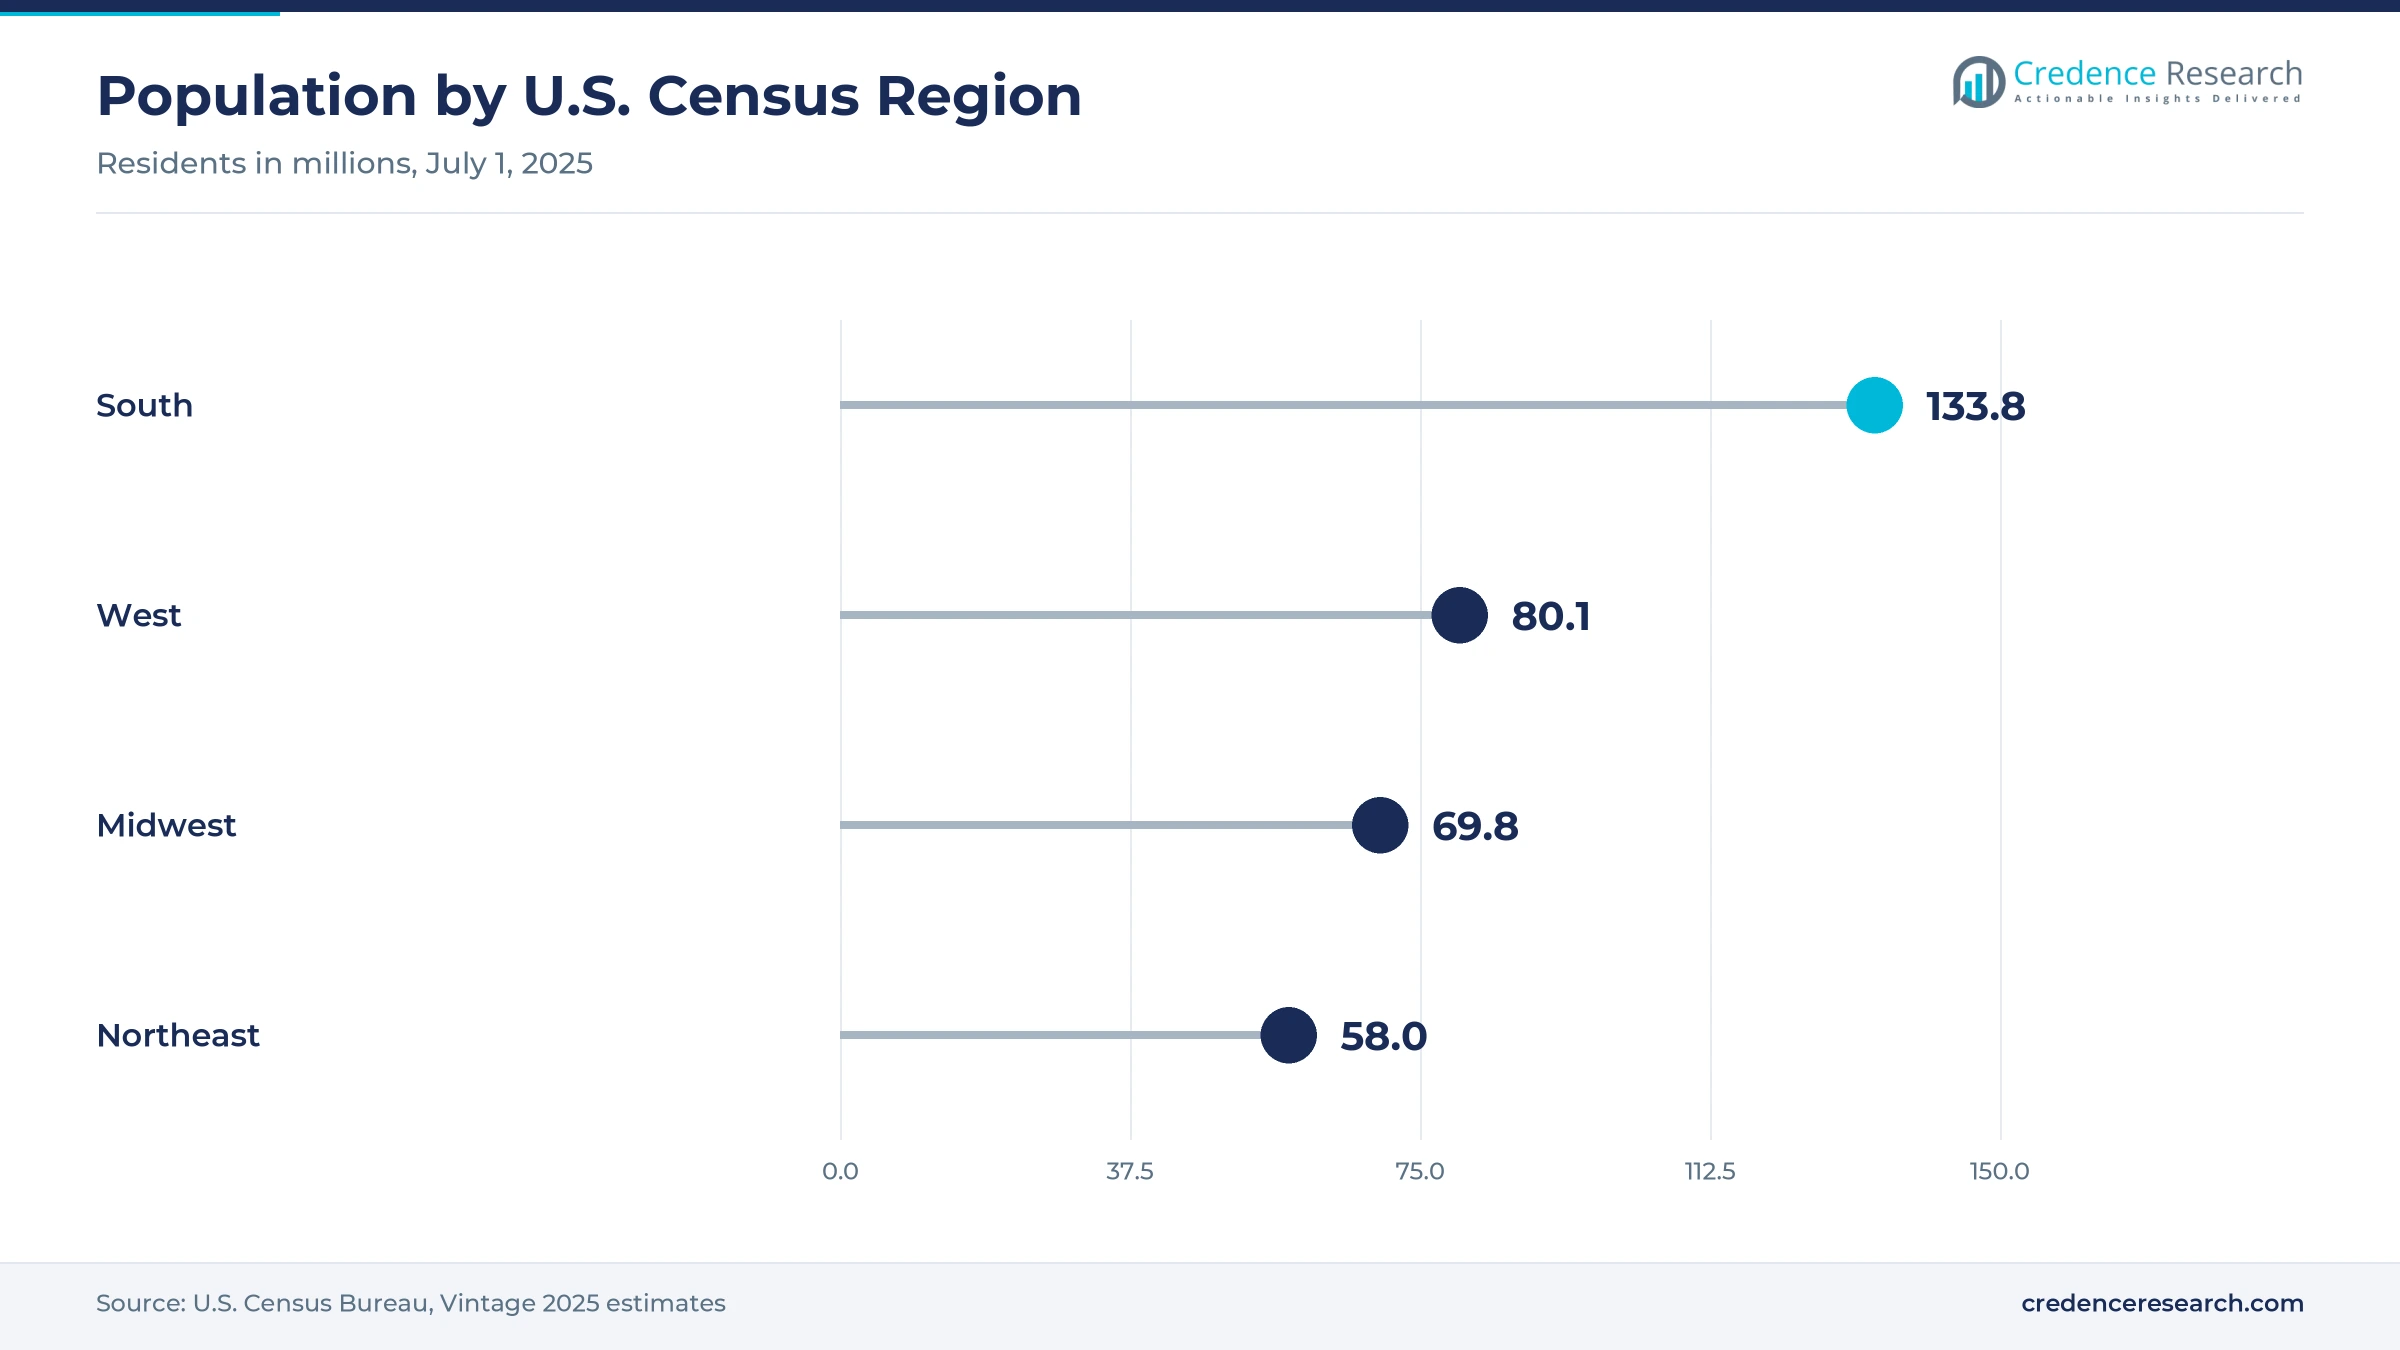
- The South held a 37.5% share of 2025 value, because the region had about 133.8 million residents in July 2025, the largest of four regions.
- Fresh whole fruit led with a 61.5% share of 2025 value, because shoppers mainly buy whole red and white pitaya in supermarkets.
- Ecuador exported 52,853 metric tons of pitahaya in 2025, and 74% of export value went to the United States.
- Online grocery and direct delivery grows fastest at 10.02% a year during 2026–2035, as e-commerce reached 17.1% of U.S. retail sales in the second quarter of 2026.
Fresh fruit leads while freeze-dried products grow fastest
Why does fresh whole pitaya lead product value?
Based on product type, the market is categorized into fresh whole fruit, frozen fruit and pulp, puree and juice ingredients, and dried and freeze-dried products. Fresh Whole Fruit led with a 61.5% share of 2025 value, because shoppers buy whole red, white and yellow pitaya in produce aisles. Dried and Freeze-Dried Products grow fastest at 9.39% a year, as snack brands use crunchy, shelf-stable pieces.
Which buyers account for most pitaya purchases?
Based on customer type, the market is categorized into household consumers, foodservice buyers, beverage and smoothie operators, and food manufacturers. Household Consumers led with a 55.0% share of 2025 value, because most fruit is bought fresh for home eating. Beverage and Smoothie Operators grow fastest at 8.81% a year, as bright pink bowls and drinks remain popular menu items.
How do supermarkets and online channels share sales?
Based on distribution channel, the market is categorized into supermarkets and hypermarkets, specialty produce retailers, online grocery and direct delivery, and foodservice and wholesale. Supermarkets and Hypermarkets led with a 52.0% share of 2025 value, because large chains carry fresh and frozen pitaya year round. Online Grocery and Direct Delivery grows fastest at 10.02% a year, as shoppers order tropical boxes and grocery deliveries.
How do mainstream and organic price tiers compare?
Based on price tier, the market is categorized into value, mainstream, premium and organic premium products. Mainstream led with a 45.0% share of 2025 value, because most supermarket fruit and frozen packs sell at standard prices. Organic Premium grows fastest at 9.03% a year, as health-minded buyers pay more for certified organic frozen pitaya and specialty varieties.
| Segment Group | Leading Sub-segment | Share, 2025 | Fastest-growing Sub-segment | CAGR, 2026–2035 |
|---|---|---|---|---|
| By Product Type | Fresh Whole Fruit | 61.5% | Dried and Freeze-Dried Products | 9.39% |
| By Customer Type | Household Consumers | 55.0% | Beverage and Smoothie Operators | 8.81% |
| By Distribution Channel | Supermarkets and Hypermarkets | 52.0% | Online Grocery and Direct Delivery | 10.02% |
| By Price Tier | Mainstream | 45.0% | Organic Premium | 9.03% |
Request a Free Sample
Fill in your details and we'll send you a free sample report.
- Sample data tables & charts
- Research methodology
Imports, new formats and local farms lift demand
How does year-round import supply support demand?
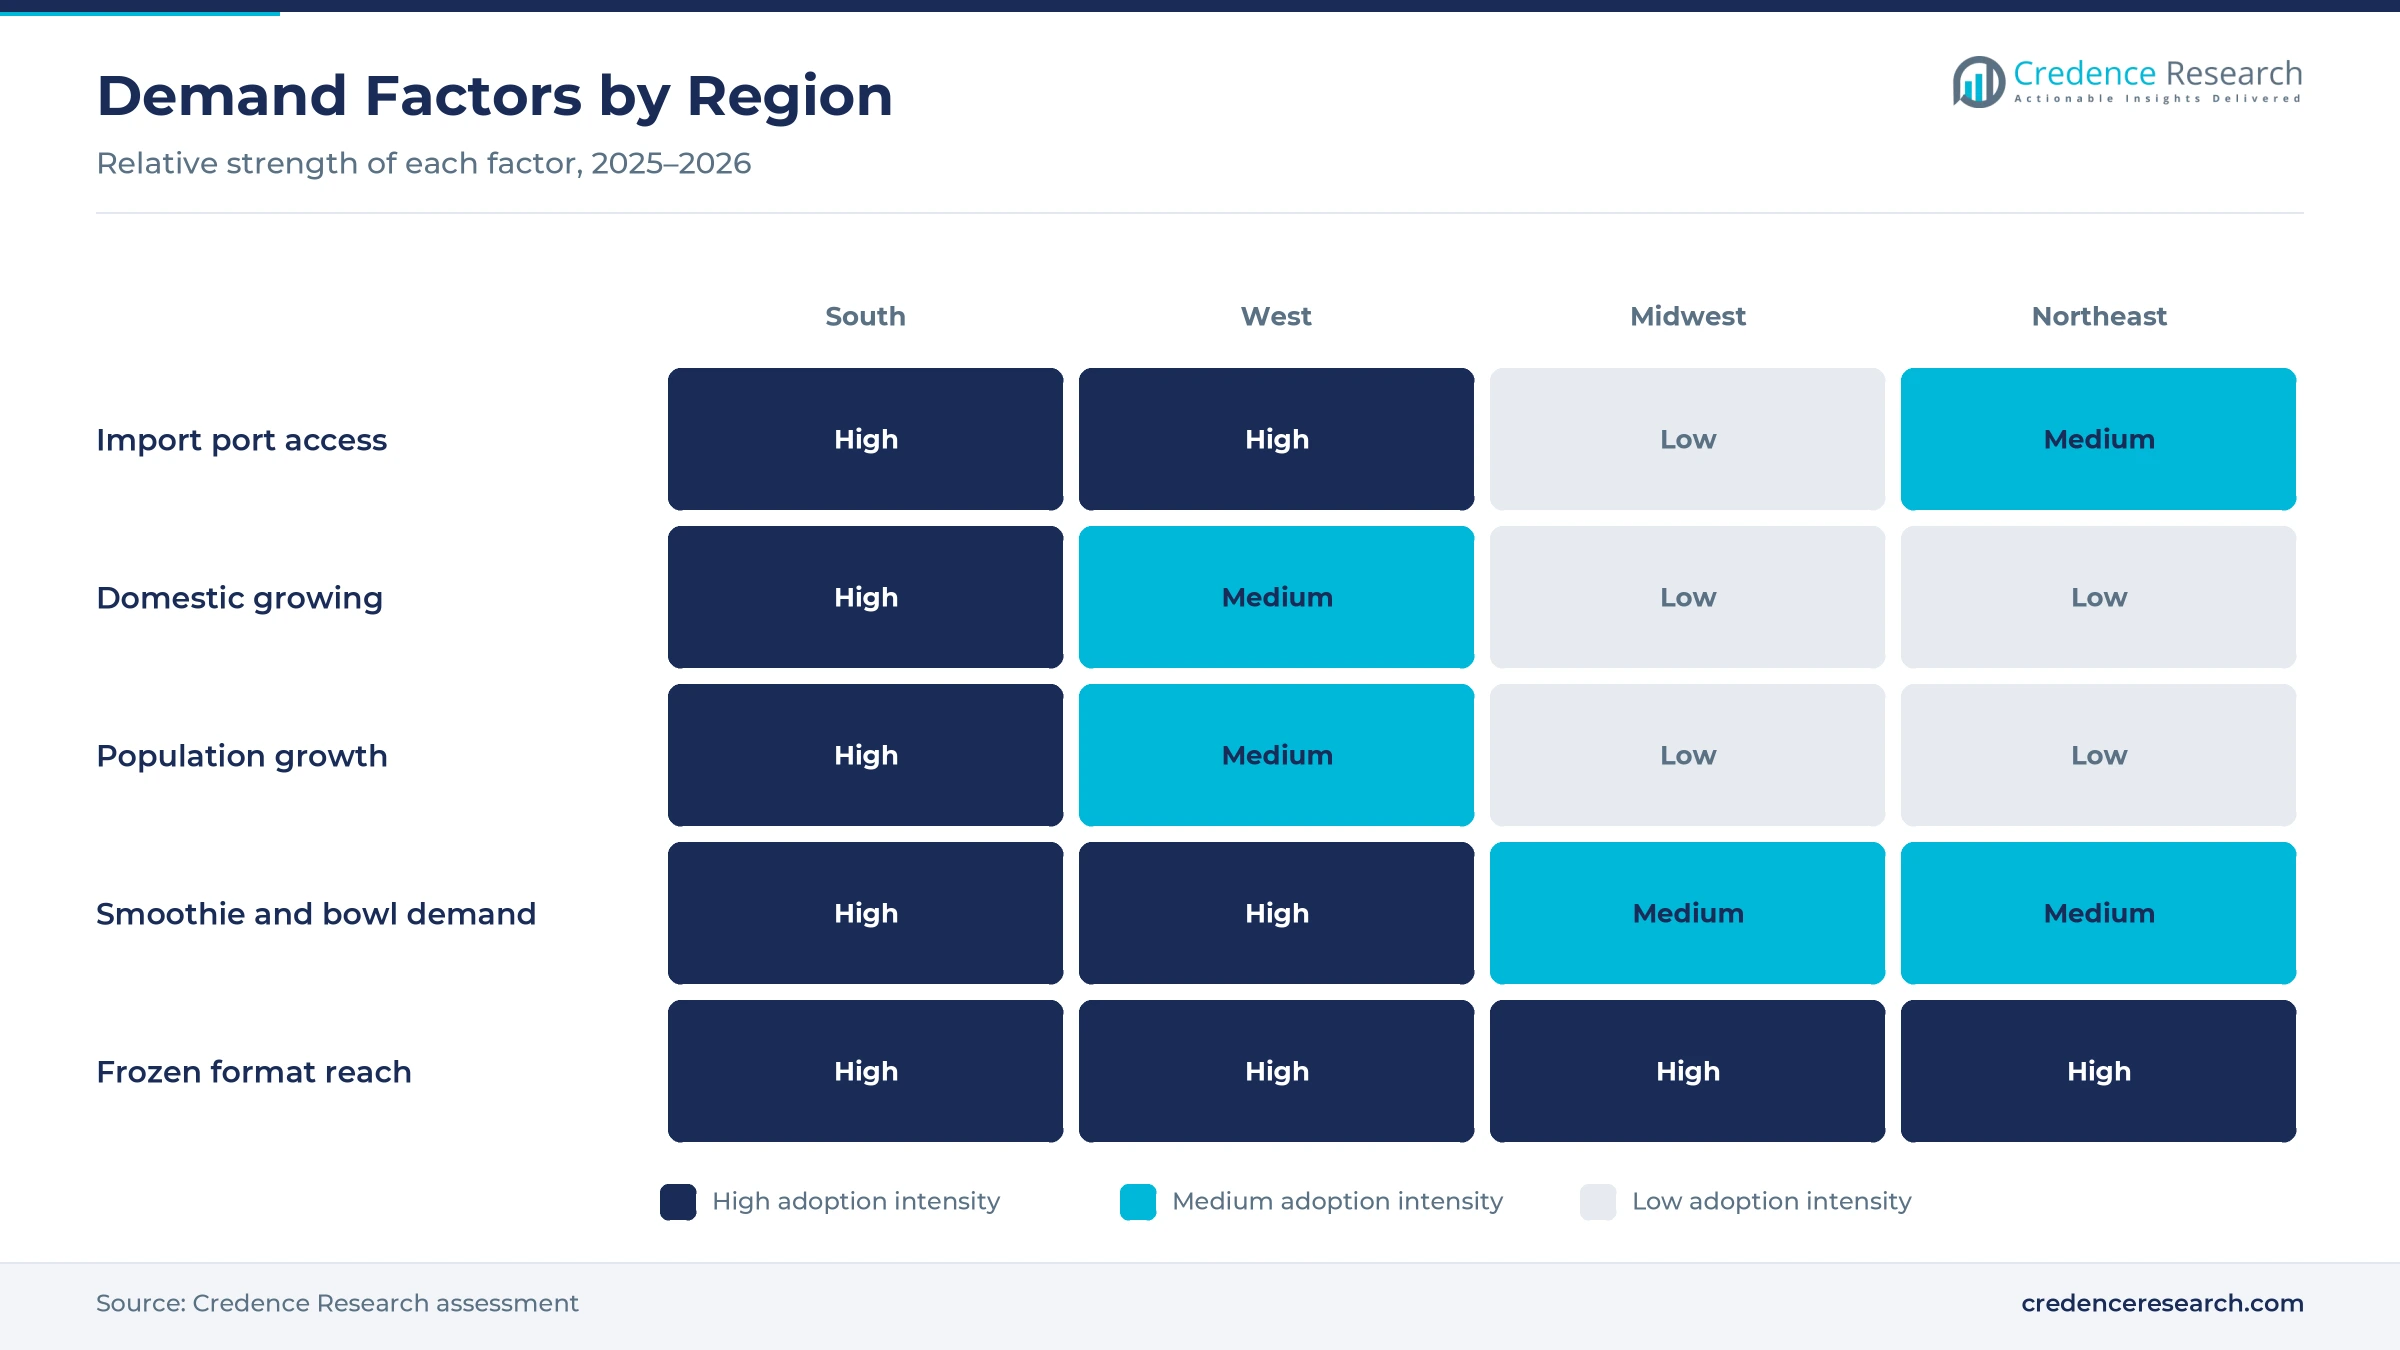
Year-round import availability supports demand, because supply from several countries keeps pitaya on shelves in most months. Ecuador exported 52,853 metric tons of pitahaya in 2025, up 11%, and 74% of its export value, about USD 166 million, went to the United States, according to Portal Frutícola. U.S. access for Ecuadorian fruit has been open since July 20, 2017 under a systems approach set by USDA APHIS. Vietnam also shipped about USD 547 million of fruit and vegetables to the United States in 2025, and dragon fruit is among the fruits that must be irradiated first. As a result, fresh whole fruit holds 61.5% of 2025 value.
Why do fresh and processed formats widen use?
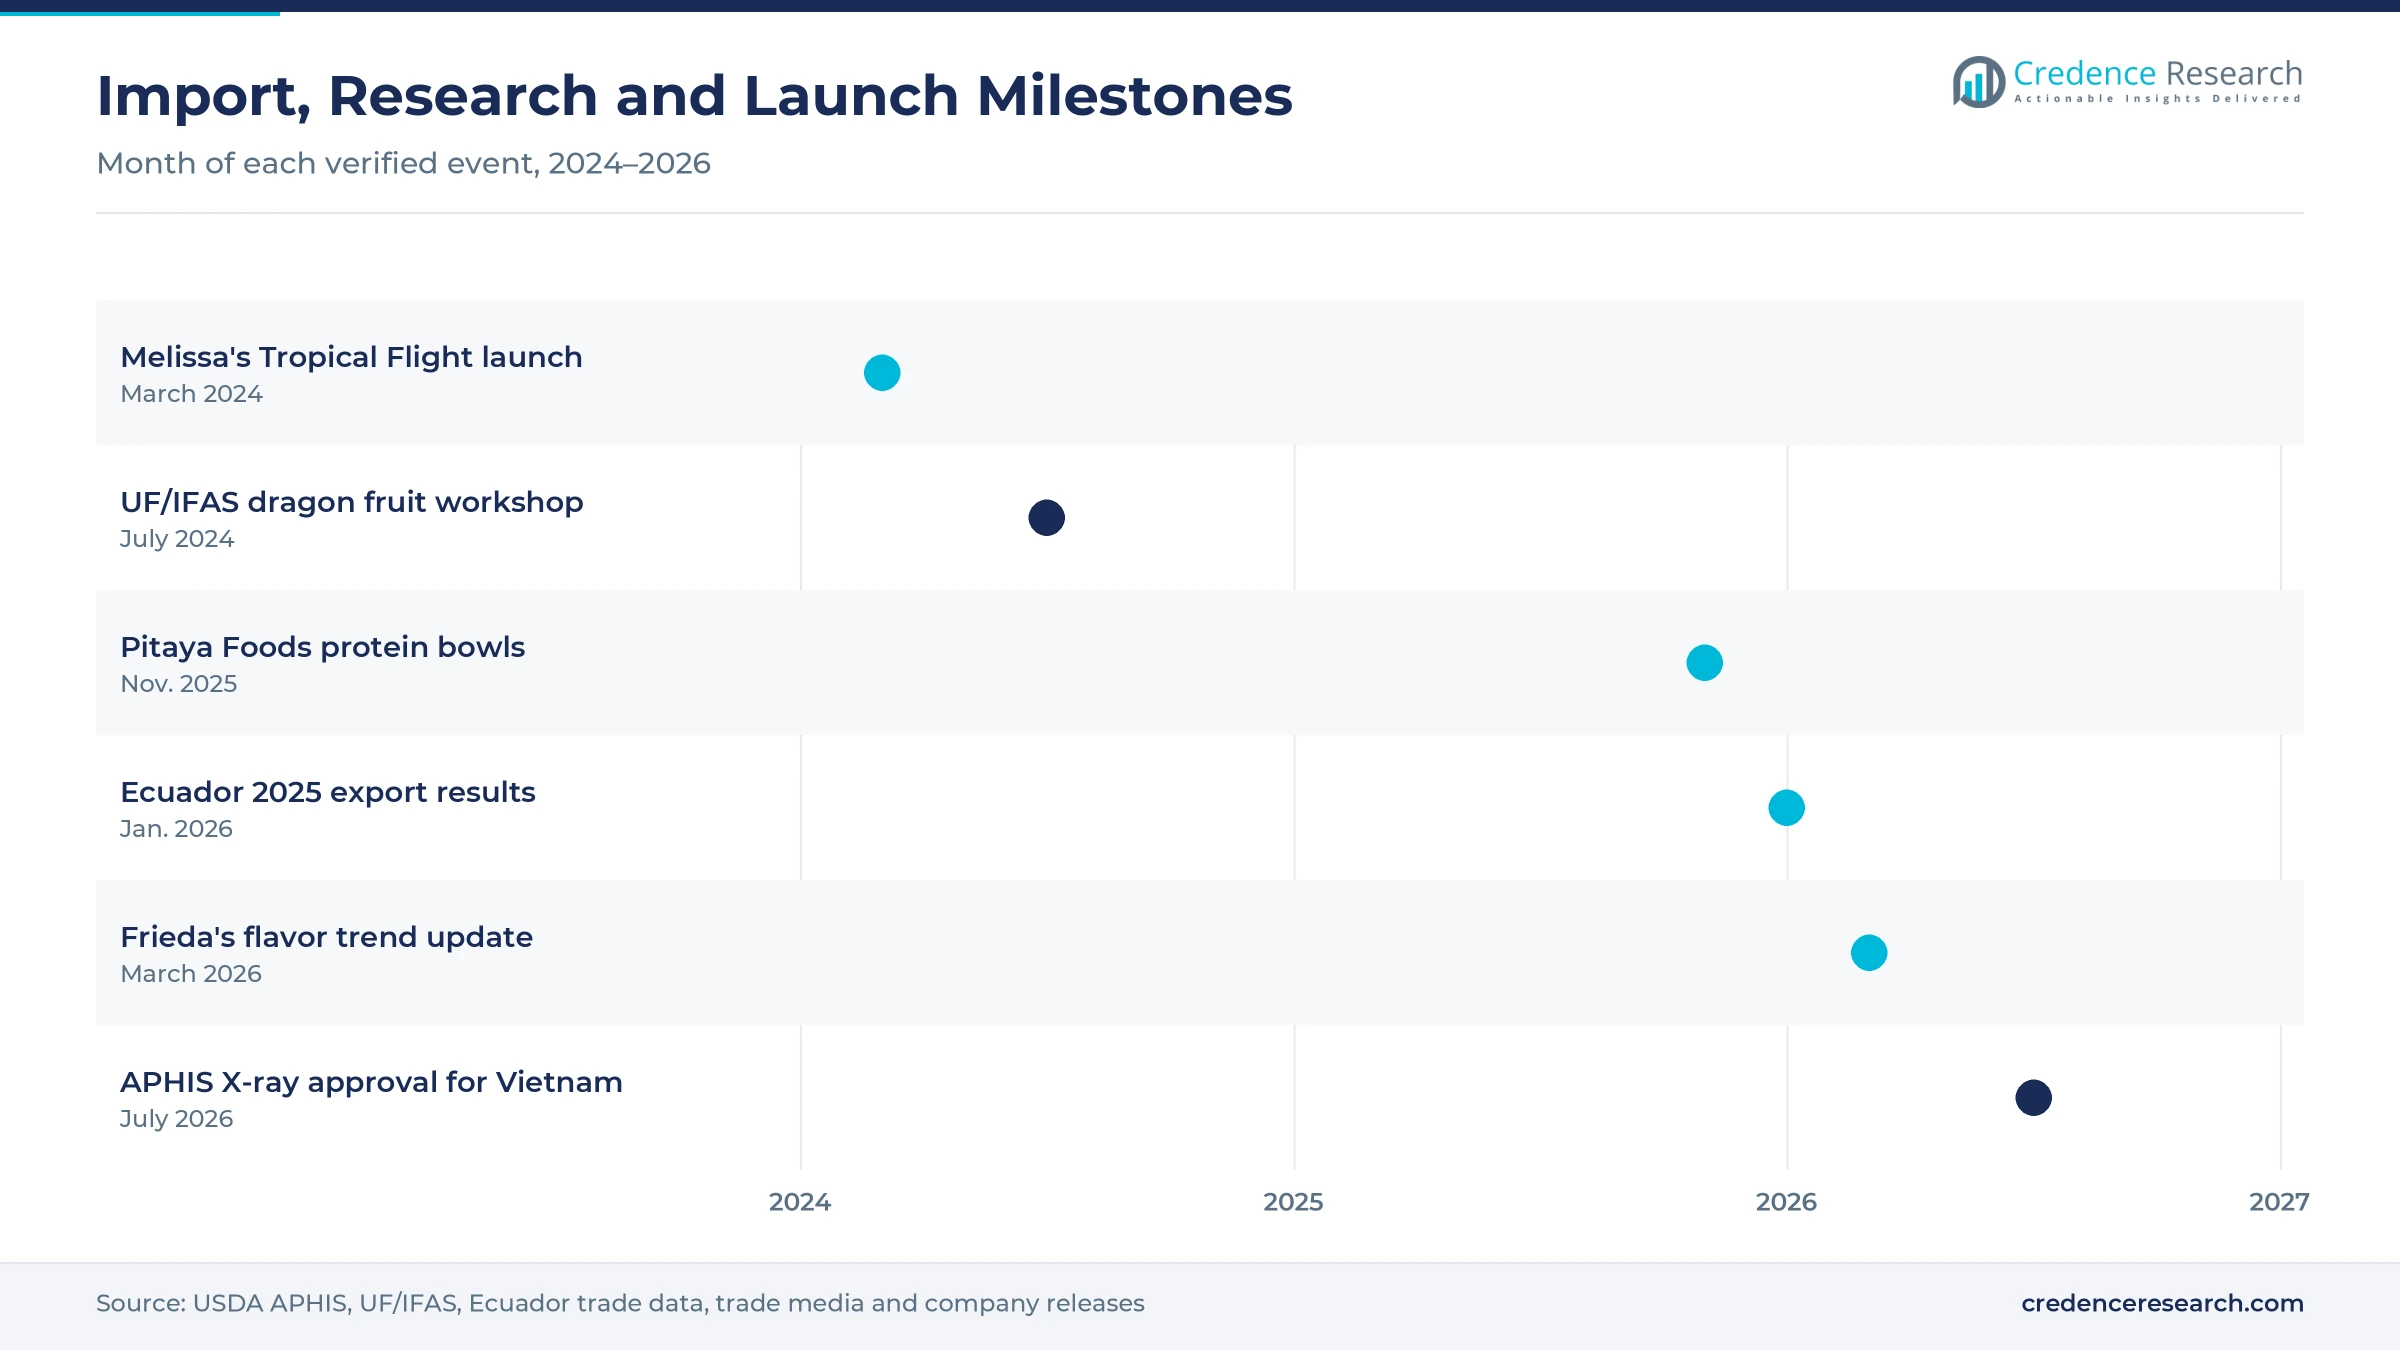
Expansion across fresh and processed formats widens use, because frozen packs and bowls let buyers enjoy pitaya without cutting or ripening fruit. Pitaya Foods sells in more than 15,000 retail stores and 5,000 foodservice outlets, and it launched Protein Smoothie Bowls with 10 grams of plant protein in November 2025, according to Refrigerated & Frozen Foods. Frieda's said in March 2026 that new dragon fruit-flavored product launches grew 17% through 2025. Melissa's also introduced a Tropical Flight pack with white, red and yellow fruit in March 2024. In turn, beverage and smoothie operators grow fastest by customer type at 8.81% a year.
How do domestic farms and research build supply?
Domestic cultivation and knowledge development build supply, because growers in Florida, California and Hawaii now treat pitaya as a serious specialty crop. Dragon fruit is grown on about 721 acres in five Florida counties, and new plantings continue, according to UF/IFAS. The UF/IFAS Tropical Research and Education Center received a USD 50,000 USDA-NIFA grant in 2023 and held a July 2024 workshop with more than 80 participants. The University of California Cooperative Extension in San Diego also runs pitahaya field research on pruning, pollination and harvest timing. As a result, local fruit supports premium sales during the summer and fall harvest season.
Why does population growth in the South lift sales?
Population growth in the South lifts sales, because the region adds new households faster than any other part of the country. The South reached about 133.8 million residents on July 1, 2025, up 6.0% from April 2020, according to the U.S. Census Bureau. The U.S. population reached about 341.8 million in 2025, and the South was the only region that grew in all five age groups. Miami-area distributors such as J&C Tropicals also handle more than 70 tropical items for national buyers. In turn, supermarkets and hypermarkets hold 52.0% of 2025 value, as chains in fast-growing metros expand tropical displays.
Variety packs, smoothie bowls and new uses reshape sales
How is the shift to multi-variety displays changing sales?
The shift to multi-variety displays is changing sales, because retailers now show white, red and yellow pitaya together so shoppers can compare taste and color. Melissa's Tropical Flight pack, launched in March 2024, holds one fruit of each variety for online orders and grab-and-go purchases. Frieda's markets Snow Dragons, Fire Dragons and Honey Dragons, and it rates the yellow Honey Dragon at 23 brix. Yellow fruit from Ecuador often reaches 18 to 22 brix, which is far sweeter than common white fruit. As a result, organic premium products grow fastest by price tier at 9.03% a year, as exotic produce buyers pay for flavor.
Why is the rise of frozen bowls and blends notable?
The rise of frozen bowls and blends is notable, because ready-to-eat products bring pitaya to shoppers who rarely buy whole tropical fruit. Pitaya Foods placed its new Protein Smoothie Bowls at Walmart, Publix, Giant, Schnucks and other chains in November 2025, and each bowl carries 10 grams of plant protein. The brand already reaches more than 15,000 retail stores and 5,000 foodservice outlets. The bowls come in four flavors, including Dragon Fruit and Mango and Acai, Strawberry and Banana, which pairs pitaya with acai and other familiar ingredients. Dole also started a dragon fruit program for the western United States and Canada in November 2023, using atmosphere-controlled containers from Ecuador. In turn, frozen pulp and bowls reach more freezer aisles every year.
Can freeze-dried and ingredient uses open new demand?
Freeze-dried and ingredient uses can open new demand, because off-grade fruit can become powders, pieces and purees with long shelf life. A UF/IFAS workshop in July 2024 identified a possible ancillary industry that would turn pulp into value-added products using fruit unsuited for fresh sale. Frieda's reported that new dragon fruit-flavored product launches grew 17% through 2025, mainly in beverages and confections. Florida growers already farm about 721 acres, which gives processors a local source of off-grade fruit. Food makers also use the natural pink color of red pitaya in snacks, yogurts and drinks. As a result, dried and freeze-dried products grow fastest at 9.39% a year, alongside wider freeze-dried produce demand.
Is there room to grow through online grocery and delivery?
Online grocery and delivery offer room to grow, because shoppers far from coastal ports can order tropical boxes and frozen packs to their door. U.S. e-commerce sales reached about USD 340.2 billion in the second quarter of 2026, or 17.1% of total retail sales, according to Census Bureau data. That figure was 12.2% higher than a year earlier, which shows steady growth in online buying. Frozen pitaya brands already sell through Walmart and other chains that run large grocery delivery services. As a result, online grocery and direct delivery grow fastest by channel at 10.02% a year, as smoothie fans buy frozen pitaya online.
Pest rules, short shelf life and price swings weigh
How do pest and treatment rules raise import costs?
Pest and treatment rules raise import costs, because pitaya from many countries must pass fruit fly controls, inspection or irradiation before entry. As a result, exporters pay for trapping, registered packhouses and treatment, and one larva can stop a shipment from a production site. Smaller exporters often struggle to cover these added compliance costs each season. Importers respond with long-term grower programs and approved treatment facilities that keep supply flowing steadily.
Why does short shelf life limit fresh sales?
Short shelf life limits fresh sales, because ripe pitaya bruises easily and loses quality within days at room temperature. As a result, retailers face waste and markdowns when fruit sits too long on display. The risk is highest for stores far from Florida and California ports. Distributors respond with cold chain control, clamshell packs and ripening programs, while off-grade fruit moves into frozen pulp and puree.
How do supply surges cause price swings?
Supply surges cause price swings, because many young farms in Ecuador and Central America reach harvest at similar times. In turn, wholesale prices can fall sharply during peak months and rise when supply is short. Price swings make retail planning harder for buyers and growers alike. Importers respond with year-round sourcing from several countries, promotions during peak months and frozen storage that smooths supply.
Why does low shopper familiarity slow trial?
Low shopper familiarity slows trial, because many households still do not know how to choose, cut or serve pitaya. As a result, sales stay concentrated among shoppers who already know tropical fruit and health-minded younger buyers. Retailers respond with in-store sampling, recipe cards and sliced fruit in fresh-cut cases. Brands also explain the differences between white, red and yellow fruit on packaging and shelf signs.
The South leads and grows fastest as population rises
| Region | Value, 2025 (USD million) | Share, 2025 | CAGR, 2026–2035 |
|---|---|---|---|
| South | 230.4 | 37.5% | 8.33% |
| West | 153.6 | 25.0% | 8.03% |
| Midwest | 119.8 | 19.5% | 7.93% |
| Northeast | 110.6 | 18.0% | 7.63% |
Why does the South hold the top share?
The South held a 37.5% share of 2025 value and grows fastest at 8.33% a year, because the region had about 133.8 million residents on July 1, 2025 and grew 6.0% since April 2020. Florida also grows dragon fruit on about 721 acres across five counties, led by Miami-Dade. As a result, Miami-area distributors such as J&C Tropicals supply supermarkets across the region with imported and local fruit.
How does the West support pitaya demand?
The West held a 25.0% share of 2025 value and grows at 8.03% a year, because the region had about 80.1 million residents in 2025 and large Asian and Latin American communities. In turn, Southern California growers supply local fruit, while Dole targets western U.S. stores with Ecuadorian fruit. Smoothie shops and specialty grocers in the region also use frozen pulp for bowls and drinks.
What role does the Midwest play?
The Midwest held a 19.5% share of 2025 value and grows at 7.93% a year, because the region had about 69.8 million residents in 2025 and wide supermarket and freezer coverage. As a result, frozen packs and smoothie bowls sell well in Midwest chains such as Schnucks and Lunds and Byerlys, where fresh tropical fruit is less common and buyers prefer convenient formats.
How does the Northeast add demand?
The Northeast accounted for 18.0% of 2025 value and grows at 7.63% a year, because the region had about 58.0 million residents in 2025 and slower population growth. In turn, dense cities, specialty distributors and restaurants in New York and Boston keep demand for premium fresh fruit steady.
Import, research and product launch milestones
| Development | Status and market relevance |
|---|---|
| In March 2024, Melissa's launched its Tropical Flight program, packing white, red and yellow dragon fruit together. | Encourages trial of several varieties |
| In July 2024, UF/IFAS held a three-day dragon fruit workshop in Homestead, Florida, with more than 80 participants. | Sets research priorities for domestic growers |
| In November 2025, Pitaya Foods launched Protein Smoothie Bowls at Walmart, Publix and other chains. | Widens frozen ready-to-eat formats |
| In January 2026, Ecuadorian trade data showed 2025 pitahaya exports of 52,853 metric tons, with 74% of value shipped to the United States. | Confirms the United States as the main destination |
| In July 2026, USDA APHIS approved X-ray irradiation at Vietnam's Toan Phat plant for fresh fruit exports to the United States. | Could nearly double treatment capacity for Vietnamese fruit |
Treatment, cold chain and freezing shape supply quality
- Phytosanitary irradiation treats fruit from Vietnam with Cobalt-60 or X-ray before shipment, which meets U.S. pest rules without chemical fumigation and protects fruit quality.
- Controlled-atmosphere containers slow ripening and moisture loss during ocean transit from Ecuador, which lets shippers use cheaper sea freight instead of air.
- Individual quick freezing freezes cubes and pulp within minutes of processing, which keeps the bright pink color and nutrients for smoothie and bowl makers.
- Freeze-drying lines remove almost all water from slices and powder, which creates light, shelf-stable snacks and natural color ingredients for food manufacturers.
Need a Custom Version of This Report?
Tailor the scope, geography, or segments to your exact requirements.
- Custom geography or segment scope
- Direct access to our analyst team
Tropical specialists and frozen brands compete
Competition combines tropical produce specialists, large fresh fruit companies and frozen food brands. J&C Tropicals, based in Doral, Florida, calls itself the largest U.S. distributor of dragon fruit and handles more than 70 tropical items. Frieda's Branded Produce, which helped introduce dragon fruit to U.S. shoppers in the 1970s, competes with branded Snow, Fire and Honey Dragons. Melissa's competes with its three-variety Tropical Flight pack for retail and online orders. Dole sources Ecuadorian fruit for the western United States and Canada. Pitaya Foods leads frozen pitaya with packs and bowls in more than 15,000 stores. Rivals compete on year-round supply, ripeness, variety choice and retail support. Because fresh pitaya spoils quickly, companies with strong cold chains and several sourcing countries usually win.
Which companies lead pitaya supply in the United States?
| Company | Type | Role in the market |
|---|---|---|
| J&C Tropicals | Grower and distributor | Doral-based tropical specialist that calls itself the top U.S. dragon fruit distributor |
| Frieda's Branded Produce | Specialty produce marketer | Sells Snow, Fire and Honey Dragons and reports strong volume growth |
| Melissa's Produce / World Variety Produce | Specialty produce marketer | Launched the Tropical Flight three-variety pack in 2024 |
| Dole plc | Fresh fruit company | Runs an Ecuadorian dragon fruit program for the western U.S. and Canada |
| Pitaya Foods | Frozen food brand | Sold in more than 15,000 stores and launched protein bowls in 2025 |
Credence Research view on tropical produce demand
Credence Research's view is that the USA dragon fruit market will keep growing steadily, because imports now arrive in most months and frozen formats reach shoppers who never buy whole tropical fruit. Fresh whole fruit remains the largest value pool, while freeze-dried products, smoothie operators and online delivery add the fastest growth. Ecuador's rising exports and Vietnam's added treatment capacity should keep supply strong. Companies that combine several sourcing countries, reliable cold chains and clear variety marketing should gain the most.
How the national estimate for pitaya was built
The report uses 2025 as the base year on a calendar basis, and market values come from the Credence Research model. That model combines population data, trade statistics, import rules and treatment capacity, crop acreage from extension services and company product releases. Segment splits and regional growth rates are Credence Research estimates, and the regional shares follow the client's 2025 split. Sources used are official statistics, federal rules, university extension reports, trade media and company releases, and no interviews or surveys were used.
Frozen, freeze-dried and online sales carry growth to 2035
The USA dragon fruit market is expected to reach USD 1.35 billion by 2035, an 8.05% CAGR during 2026–2035, as households, smoothie shops and food makers use more pitaya in fresh and processed forms. Growth should be strongest in freeze-dried products, online delivery and the South, because these areas gain the most from shelf-stable formats, digital grocery and population growth. Steady imports and new Florida plantings will support supply, while pest rules, short shelf life and price swings could slow some sellers.
Frequently Asked Questions
How big is the USA dragon fruit market?
Which product type leads the market?
Which region leads U.S. dragon fruit demand?
Where does most U.S. dragon fruit come from?
Which channel is growing fastest?
How large is domestic dragon fruit farming?
Who are the leading companies in the USA dragon fruit market?
What are the main challenges for dragon fruit sellers?
Table of Content
Chapter 1 Market Segmentation
- 1.1 Segmentation Framework
- 1.1.1 Product and Service Classification
- 1.1.2 Application and End-Use Classification
- 1.1.3 Technology and Solution Classification
- 1.1.4 Customer and Distribution Channel Classification
- 1.1.5 Geographic Segmentation
- 1.1.6 Market Segment Definitions and Boundaries
- 1.2 By Product Type
- 1.2.1 Fresh Whole Fruit
- 1.2.2 Frozen Fruit and Pulp
- 1.2.3 Puree and Juice Ingredients
- 1.2.4 Dried and Freeze-Dried Products
- 1.3 By Customer Type
- 1.3.1 Household Consumers
- 1.3.2 Foodservice Buyers
- 1.3.3 Beverage and Smoothie Operators
- 1.3.4 Food Manufacturers
- 1.4 By Price Tier
- 1.4.1 Value
- 1.4.2 Mainstream
- 1.4.3 Premium
- 1.4.4 Organic Premium
Chapter 2 Introduction
- 2.1 Report Objectives and Scope
- 2.2 Product Definition and Industry Terminology
- 2.3 Market Inclusions and Exclusions
- 2.4 Research Process
- 2.4.1 Primary Research and Expert Interviews
- 2.4.2 Secondary Research and Source Review
- 2.4.3 Top-Down and Bottom-Up Estimation
- 2.4.4 Data Triangulation and Verification
- 2.5 Market Size Measurement Basis
- 2.5.1 2025: USD 614.5 million → 2035: USD 1.35 billion
- 2.6 Historical and Forecast Reference Periods
- 2.6.1 Historical Period: 2018-2025
- 2.6.2 Base Year: 2025
- 2.6.3 Forecast Period: 2025-2035
- 2.7 Research Assumptions and Limitations
Chapter 3 Executive Summary
- 3.1 Market Snapshot and Key Findings
- 3.2 Base-Year Market Size, 2025
- 3.3 Forecast Market Size, 2035
- 3.4 Revenue and Volume Growth Outlook
- 3.5 Key Demand and Supply Indicators
- 3.6 Leading Market Segments
- 3.7 Fastest-Growing Market Opportunities
- 3.8 Regional Performance Highlights
- 3.9 Technology and Industry Transformation
- 3.10 Competitive Landscape Summary
- 3.11 Analyst View and Strategic Implications
Chapter 4 USA Dragon Fruit Market Trends and Developments
- 4.1 Historical Industry Development, 2018-2025
- 4.2 Recent Market Trends and Developments
- 4.3 Demand and Customer Behavior Trends
- 4.4 Technology and Product Innovation
- 4.5 Artificial Intelligence, Automation and Digitalization
- 4.6 Local Manufacturing and Supply Chain Realignment
- 4.7 Industry Partnerships, Mergers and Acquisitions
- 4.8 Sustainability and Circular Economy Developments
- 4.9 Government and Private Sector Investment Trends
- 4.10 Emerging Business Models and Commercialization
- 4.11 Industry Developments and Announcements
Chapter 5 USA Dragon Fruit Market Production, Supply and Demand Analysis
- 5.1 Demand Trend and Consumption Analysis, 2018-2025
- 5.2 Demand Forecast, 2025-2035
- 5.3 Production and Output Trend, 2018-2025
- 5.4 Production and Output Forecast, 2025-2035
- 5.5 Installed Capacity and Capacity Utilization
- 5.6 Company-Wise Production Plants and Statistics
- 5.6.1 Installed Production Capacity
- 5.6.2 Actual Production
- 5.6.3 Planned Capacity and Expansion Targets
- 5.7 Supply Chain Structure and Procurement Trends
- 5.8 Supply-Demand Gap and Bottlenecks
- 5.9 Import Dependence and Sourcing Structure
- 5.10 Contract Manufacturing and Outsourcing
- 5.11 Regional Supply and Demand Concentration
Chapter 6 USA Dragon Fruit Market Pricing Analysis
- 6.1 Pricing Structure and Measurement
- 6.2 Historical Pricing Trends, 2018-2025
- 6.3 Pricing Outlook, 2025-2035
- 6.4 Average Selling Price and Unit Economics
- 6.5 Pricing by Product and Market Segment
- 6.6 Geographic Pricing Differences
- 6.7 Key Input, Energy, Labor and Logistics Costs
- 6.8 Contract Pricing and Purchasing Models
- 6.9 Pricing Sensitivity and Competitive Positioning
- 6.10 Price, Margin and Profitability Implications
Chapter 7 USA Dragon Fruit Market Dynamics
- 7.1 Market Growth Drivers
- 7.1.1 Demand-Side Drivers
- 7.1.2 Technology and Innovation Drivers
- 7.1.3 Infrastructure and Investment Drivers
- 7.1.4 Regulatory and Policy Drivers
- 7.2 Market Restraints
- 7.2.1 Cost and Affordability Constraints
- 7.2.2 Technology and Adoption Barriers
- 7.2.3 Supply Chain and Operational Constraints
- 7.3 Market Challenges
- 7.3.1 Competitive Pressure and Margin Erosion
- 7.3.2 Skills, Infrastructure and Implementation Gaps
- 7.4 Emerging Market Opportunities
- 7.5 Market Dynamics Impact and Time-Horizon Assessment
Chapter 8 USA Dragon Fruit Value Chain Analysis
- 8.1 Industry Value Chain Overview
- 8.2 Upstream Suppliers and Critical Inputs
- 8.3 Technology and Component Providers
- 8.4 Manufacturing or Service Delivery
- 8.5 Distribution, Channel Partners and Integrators
- 8.6 Downstream Applications and End Users
- 8.7 Value Addition and Profit Pools
- 8.8 Vertical Integration and Outsourcing
- 8.9 Supplier Concentration and Risk
- 8.10 Supply Chain Localization and Resilience
Chapter 9 USA Dragon Fruit Market Regulations and Policies
- 9.1 Relevant Laws, Standards and Compliance Frameworks
- 9.2 Product, Service, Safety and Quality Requirements
- 9.3 Government Policies, Incentives and Subsidies
- 9.4 Imports, Exports and Trade Barriers
- 9.5 Public Procurement and Local Content Requirements
- 9.6 Environmental and Sustainability Compliance
- 9.7 Upcoming Policy Changes and Market Implications
Chapter 10 USA Dragon Fruit Market Hotspots and Opportunities
- 10.1 Market Opportunity Mapping and Growth Hotspots
- 10.2 High-Growth Applications and Customer Groups
- 10.3 Underserved Markets and White-Space Opportunities
- 10.4 Emerging Technology and Product Opportunities
- 10.5 New Capacity and Investment Hotspots
- 10.6 Market Entry and Expansion Opportunities
- 10.7 Distribution and Partnership Opportunities
- 10.8 Near-Term and Long-Term Commercial Potential
- 10.9 Opportunity Attractiveness and Execution Risks
Chapter 11 USA Dragon Fruit Market Outlook, 2025-2035
- 11.1 Market Size and Analysis
- 11.1.1 Revenue (Market Measurement: 2025: USD 614.5 million → 2035: USD 1.35 billion)
- 11.1.2 Market Volume and Quantity Sold
- 11.1.3 Historical Market Size, 2018-2025
- 11.1.4 Base-Year Market Size, 2025
- 11.2 Market Forecast, 2025-2035
- 11.2.1 Revenue Forecast to 2035
- 11.2.2 Volume Forecast to 2035
- 11.2.3 CAGR and Year-on-Year Growth
- 11.2.4 Incremental Revenue Opportunity
- 11.3 Forecast Assumptions and Scenario Analysis
- 11.3.1 Base-Case Forecast
- 11.3.2 Optimistic and Conservative Scenarios
- 11.3.3 Technology, Pricing and Policy Sensitivities
- 11.4 Market Attractiveness and Growth Outlook
Chapter 12 USA Dragon Fruit Market Segmentation and Outlook
- 12.1 Segmentation Summary and Market Shares, 2025
- 12.2 Largest and Fastest-Growing Segments
- 12.3 By Product Type - Market Size and Forecast, 2025-2035
- 12.3.1 Segment Definition and Scope
- 12.3.2 Historical Market Size, 2018-2025
- 12.3.3 Revenue Forecast, 2025-2035
- 12.3.4 Volume Forecast, 2025-2035
- 12.3.5 Base-Year Market Share, 2025
- 12.3.6 Segment CAGR and Growth Drivers
- 12.3.7 Subsegment Market Size and Forecast
- 12.3.7.1 Fresh Whole Fruit
- 12.3.7.2 Frozen Fruit and Pulp
- 12.3.7.3 Puree and Juice Ingredients
- 12.3.7.4 Dried and Freeze-Dried Products
- 12.3.8 Subsegment Pricing and Adoption Trends
- 12.3.9 Leading Suppliers and Competition
- 12.3.10 Regional Demand and Opportunities
- 12.4 By Customer Type - Market Size and Forecast, 2025-2035
- 12.4.1 Segment Definition and Scope
- 12.4.2 Historical Market Size, 2018-2025
- 12.4.3 Revenue Forecast, 2025-2035
- 12.4.4 Volume Forecast, 2025-2035
- 12.4.5 Base-Year Market Share, 2025
- 12.4.6 Segment CAGR and Growth Drivers
- 12.4.7 Subsegment Market Size and Forecast
- 12.4.7.1 Household Consumers
- 12.4.7.2 Foodservice Buyers
- 12.4.7.3 Beverage and Smoothie Operators
- 12.4.7.4 Food Manufacturers
- 12.4.8 Subsegment Pricing and Adoption Trends
- 12.4.9 Leading Suppliers and Competition
- 12.4.10 Regional Demand and Opportunities
- 12.5 By Price Tier - Market Size and Forecast, 2025-2035
- 12.5.1 Segment Definition and Scope
- 12.5.2 Historical Market Size, 2018-2025
- 12.5.3 Revenue Forecast, 2025-2035
- 12.5.4 Volume Forecast, 2025-2035
- 12.5.5 Base-Year Market Share, 2025
- 12.5.6 Segment CAGR and Growth Drivers
- 12.5.7 Subsegment Market Size and Forecast
- 12.5.7.1 Value
- 12.5.7.2 Mainstream
- 12.5.7.3 Premium
- 12.5.7.4 Organic Premium
- 12.5.8 Subsegment Pricing and Adoption Trends
- 12.5.9 Leading Suppliers and Competition
- 12.5.10 Regional Demand and Opportunities
- 12.6 Segment Growth Comparison
- 12.7 Segment Attractiveness and Priority Matrix
Chapter 13 USA Dragon Fruit End-Use and Application Market Outlook
- 13.1 End-Use Industry and Customer Demand Structure
- 13.2 Leading Applications and Customer Groups
- 13.3 End-Use Market Size, Share and Forecast
- 13.4 Major End-Use Industry Deep Dives
- 13.4.1 Customer Requirements and Use Cases
- 13.4.2 Demand and Replacement Cycles
- 13.4.3 Technical and Regulatory Considerations
- 13.4.4 Purchasing and Procurement Models
- 13.4.5 Leading Vendors and Distribution Channels
- 13.4.6 Forecast and Commercial Opportunities
- 13.5 Emerging Applications and Cross-Segment Demand
- 13.6 End-Use Industry Investment Priorities
Chapter 14 USA Dragon Fruit Geographic Market Outlook, 2025-2035
- 14.1 Domestic Market Distribution and Demand Clusters
- 14.2 State- or Province-Wise Market Size and Forecast, 2025-2035
- 14.3 City and Metropolitan Market Outlook
- 14.4 Industrial, Manufacturing and Commercial Clusters
- 14.5 Geographic Concentration of Key End Users
- 14.6 Local Pricing and Purchasing Differences
- 14.7 Domestic Production Facilities and Capacity Map
- 14.8 Local Infrastructure and Project Pipeline
- 14.9 State-Level Policy and Incentive Differences
- 14.10 Subnational Investment Hotspots and Opportunities
- 14.11 Distribution and Logistics Networks
- 14.12 Domestic Competitive Footprint
Chapter 15 USA Dragon Fruit Technology, Innovation and Sustainability Outlook
- 15.1 Technology Landscape and Maturity
- 15.2 Product, Process and Service Innovation
- 15.3 AI, Automation and Digital Tools in the Industry
- 15.4 Technology Adoption and Performance Benchmarking
- 15.5 Innovation Pipeline and R&D Investment
- 15.6 Patent and Intellectual Property Trends
- 15.7 Energy Efficiency and Resource Management
- 15.8 Sustainability, Recycling and Circularity
- 15.9 Technology Roadmap, 2025-2035
- 15.10 Risks of Obsolescence and Technology Substitution
Chapter 16 USA Dragon Fruit Market Key Strategic Imperatives
- 16.1 Growth and Market Entry Priorities
- 16.2 High-Return Products and Segments
- 16.3 Pricing, Profitability and Cost Optimization
- 16.4 Technology Investment and Product Differentiation
- 16.5 Supply Chain Localization and Resilience
- 16.6 Distribution and Customer Acquisition
- 16.7 Partnership, Acquisition and Capacity Strategy
- 16.8 Regional Expansion Priorities
- 16.9 Short-, Medium- and Long-Term Actions
Chapter 17 Competition Outlook
- 17.1 Industry Competition Characteristics
- 17.2 Market Structure and Concentration
- 17.3 Market Share and Competitive Positioning, 2025
- 17.4 Company-Wise Revenue and Product Benchmarking
- 17.5 Production and Service Capacity Benchmarking
- 17.6 Technology, Pricing and Differentiation
- 17.7 Regional Footprint and Distribution Strength
- 17.8 Mergers, Acquisitions and Strategic Alliances
- 17.9 New Entrants and Competitive Threats
- 17.10 Porter's Five Forces and Industry Attractiveness
- 17.11 Competitive Outlook, 2025-2035
Chapter 18 Company Profiles
- 18.1 Company Coverage and Selection Criteria
- 18.2 Melissa's Produce / World Variety Produce
- 18.2.1 Business Description
- 18.2.2 Company Ownership and Geographic Presence
- 18.2.3 Product and Service Portfolio
- 18.2.4 Manufacturing and Operating Footprint
- 18.2.5 Production Capacity and Expansion Plans
- 18.2.6 Financial Performance and Investment
- 18.2.7 Market Share and Competitive Position
- 18.2.8 Technology and Innovation Capabilities
- 18.2.9 Strategic Alliances or Partnerships
- 18.2.10 Recent Developments
- 18.2.11 Growth Strategy and Outlook
- 18.3 Frieda's Branded Produce
- 18.4 Fresh Del Monte Produce Inc.
- 18.5 Dole plc
- 18.6 J&C Tropicals
- 18.7 Brooks Tropicals
- 18.8 Baldor Specialty Foods
- 18.9 Pitaya Foods
- 18.10 Miami Fruit
- 18.11 Tropical Fruit Box
- 18.12 Other Relevant Market Participants
Note: Every listed company is profiled on the structure shown under the first company. The company list is preliminary and may change based on research findings, market developments, data availability and client requirements.
Chapter 19 Disclaimer
- 19.1 Research and Forecast Disclaimer
- 19.2 Data Source and Estimation Limitations
Note: The depth of individual sections depends on data availability for this market. Volume, capacity, trade and other unit-based metrics are included where applicable.

