
Poultry gut health keeps butyrate in steady feed demand
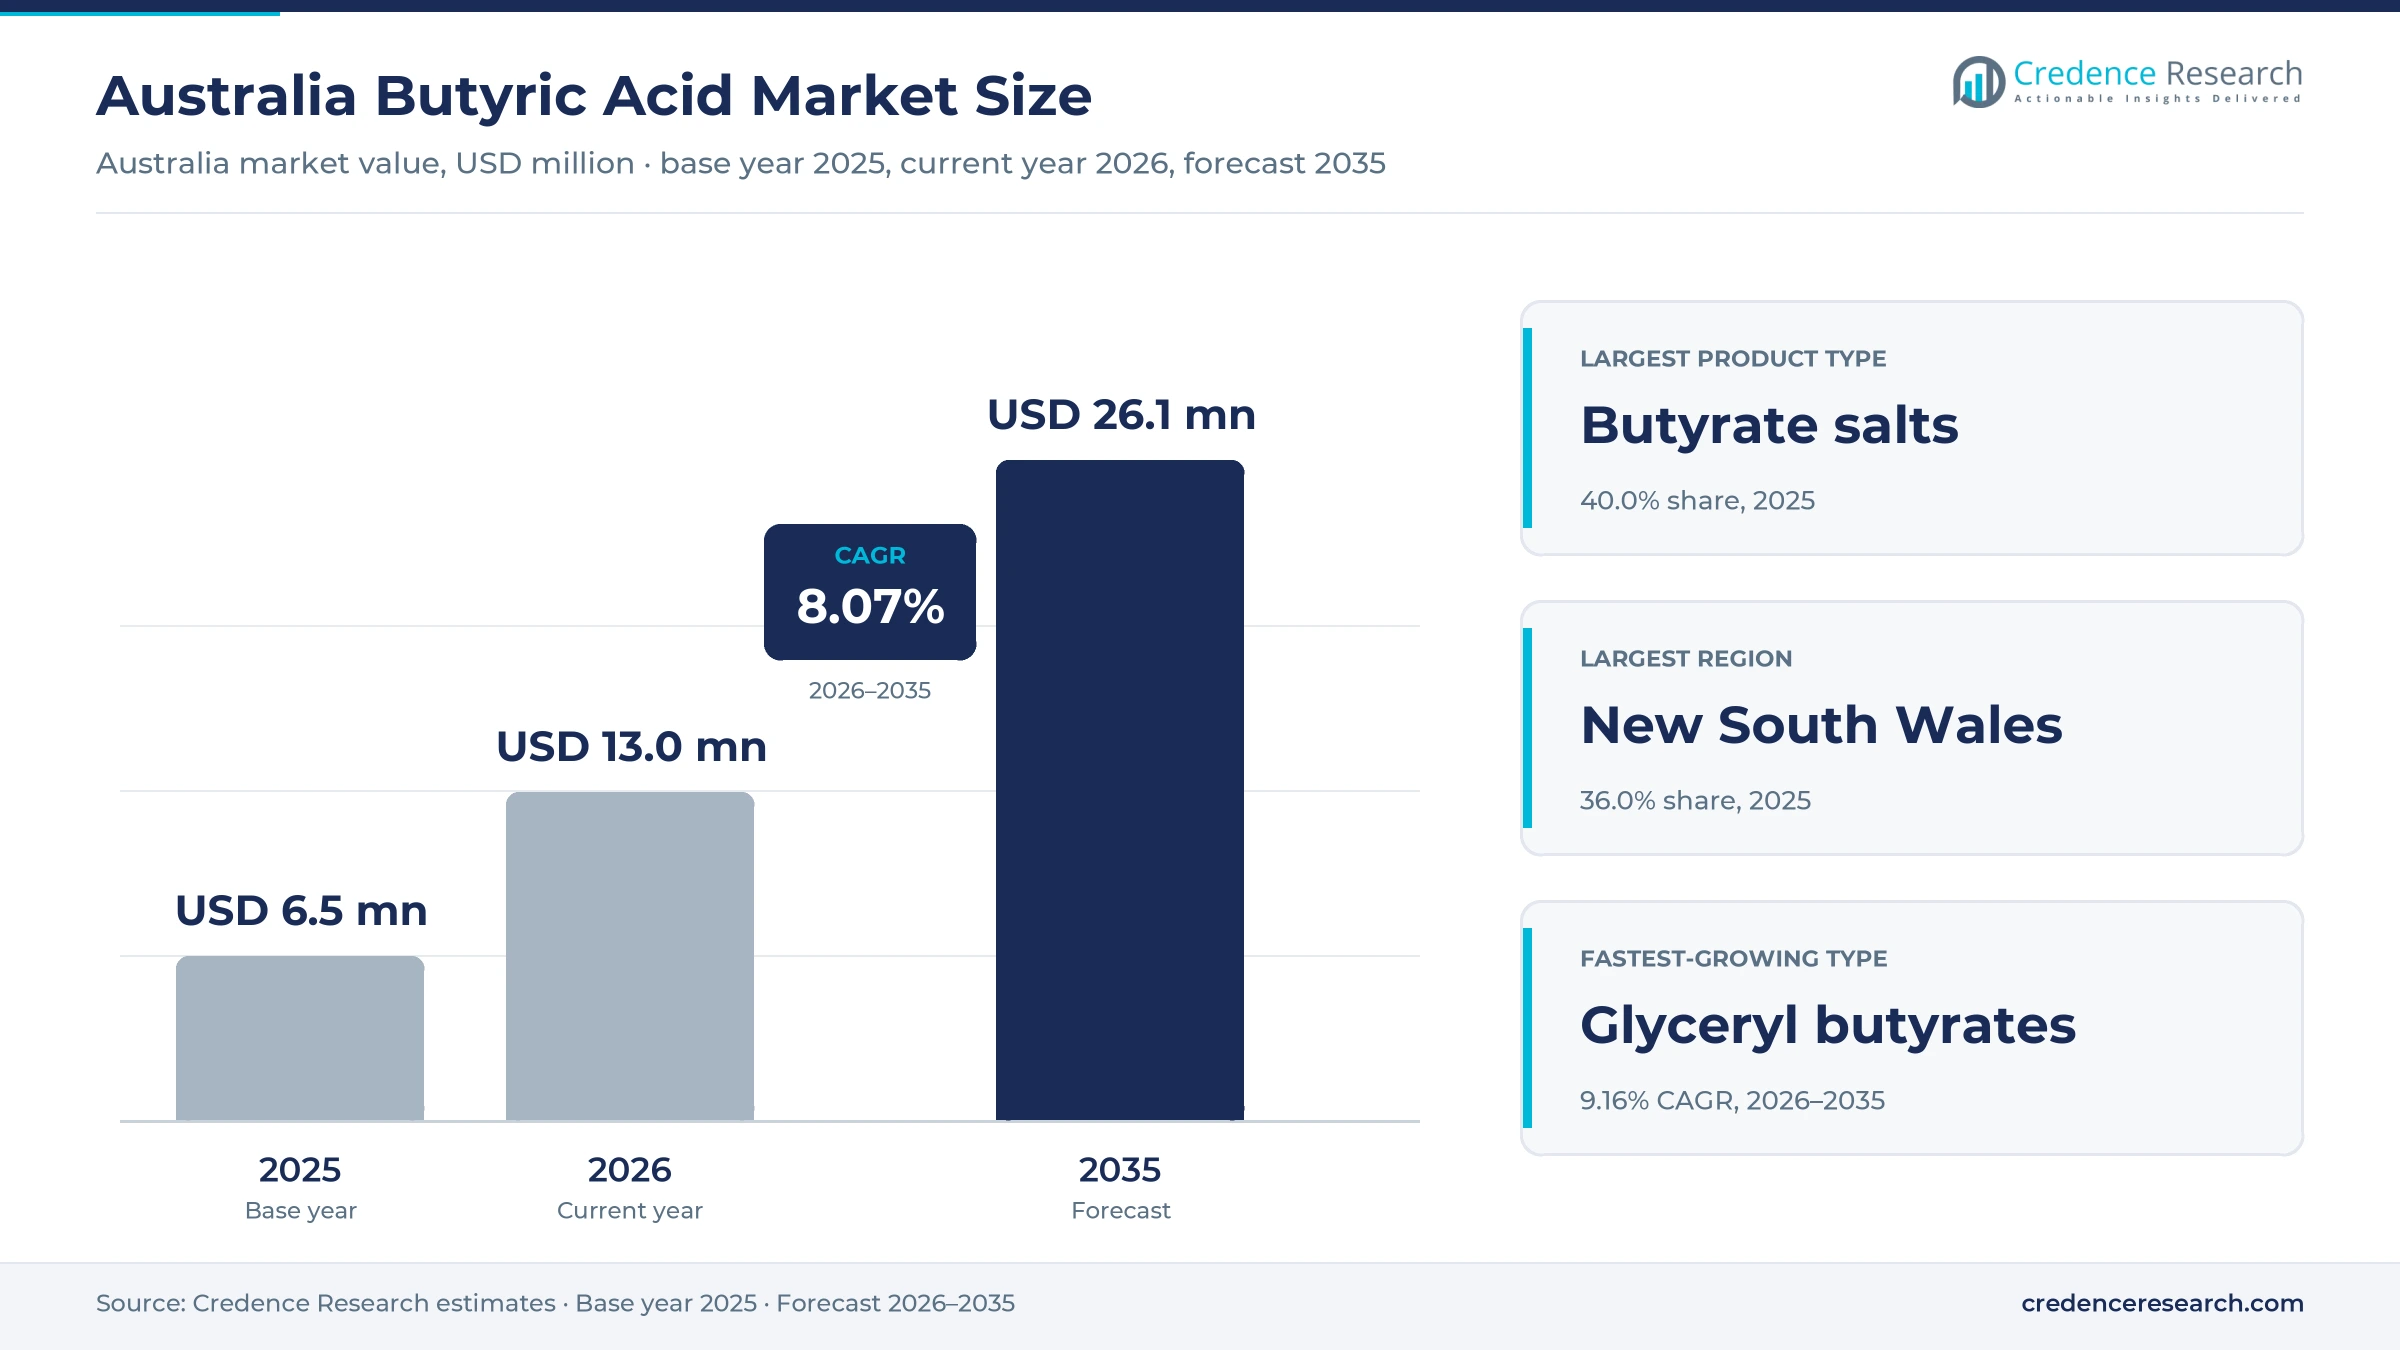
The Australia butyric acid market was valued at USD 6.5 million in 2025 and is projected to increase from USD 13.0 million in 2026 to USD 26.1 million by 2035, registering a CAGR of 8.07% during 2026–2035. Demand comes from poultry and pig feed mills, flavor houses, supplement makers and laboratories that buy butyric acid, its salts and its glycerol esters for gut health, flavor and synthesis. New South Wales held the largest regional share, 36.0% in 2025, because the state produces the most chicken meat and hosts large integrated poultry operators. Queensland is the fastest-growing region at 8.51% a year, as broiler and layer farms expand along the southeast coast. In turn, feed formulators are moving from free acid toward coated salts and glycerides that release butyrate further along the gut. Imported supply also tightened after a global producer raised butyric acid prices from Jan. 1, 2025.
Which butyrate products are counted in Australia?
The estimate measures spending in Australia on free n-butyric acid, butyrate salts such as sodium and calcium butyrate, glyceryl butyrates such as mono-, di- and tributyrin, and butyrate flavor esters. It covers purchases by animal feed, food and flavor, pharmaceutical and nutraceutical, chemical and laboratory buyers through direct producer contracts, specialty chemical distributors, feed additive distributors and laboratory catalogs. Values are stated in USD million at current prices and exclude goods and services tax.
The estimate excludes finished compound feeds, finished supplements, butanol and isobutyric acid. The value chain runs from overseas oxo chemical producers and feed additive formulators through importers and distributors to premix plants, integrated poultry companies, flavor houses, contract formulators and research laboratories.
Australia Butyric Acid Market Insights
- The Australia butyric acid market was valued at USD 6.5 million in 2025 and is projected to reach USD 26.1 million by 2035, at an 8.07% CAGR during 2026–2035.
- New South Wales held 36.0% of 2025 value, because the state produced 39% of national chicken meat in 2024-25.
- Animal feed led end uses with 64.0% of 2025 value, as broiler and layer diets use butyrate for gut health.
- Chicken meat production rose 1.6% to 395,749 metric tons in the June 2025 quarter, which lifted recurring demand for poultry feed additives.
- Glyceryl butyrates grow fastest at 9.16% a year during 2026–2035, as odor-free esters deliver butyrate further along the gut.
Butyrate salts lead while glyceryl grades grow fastest
Why do butyrate salts lead product demand?
Based on product type, the market is categorized into free n-butyric acid, butyrate salts, glyceryl butyrates and flavor esters. Butyrate salts led with 40.0% of 2025 value, because coated sodium and calcium butyrate are easy to dose in pelleted poultry and pig feed. Glyceryl butyrates grow fastest at 9.16% a year, as odor-free esters release butyrate further along the gut.
Which industries buy the most butyrate?
Based on end-use industry, the market is categorized into animal feed, food and flavor manufacturing, pharmaceutical and nutraceutical manufacturing, and chemical and laboratory supply. Animal feed led with 64.0% of 2025 value, because broiler and layer diets use butyrate for gut health. Pharmaceutical and nutraceutical manufacturing grows fastest at 9.03% a year, as supplement brands add encapsulated butyrate for digestive health.
How do protected formulations change dosing?
Based on technology, the market is categorized into unprotected formulations, protected formulations and esterified formulations. Protected formulations led with 46.0% of 2025 value, because fat coatings and microencapsulation stop butyrate from being absorbed too early in the stomach. Esterified formulations grow fastest at 9.30% a year, as feed mills seek stable, low-odor glycerides for premixes.
How do buyers source butyrate ingredients?
Based on sales channel, the market is categorized into direct producer sales, specialty chemical distribution, feed additive distribution and laboratory catalog sales. Feed additive distribution led with 41.0% of 2025 value, because premix plants buy branded gut health products with technical support. Feed additive distribution grows fastest at 8.32% a year, as integrated operators negotiate supply with global producers.
| Segment Group | Leading Sub-segment | Share, 2025 | Fastest-growing Sub-segment | CAGR, 2026–2035 |
|---|---|---|---|---|
| By Product Type | Butyrate salts | 40.0% | Glyceryl butyrates | 9.16% |
| By End-Use Industry | Animal feed | 64.0% | Pharmaceutical and nutraceutical manufacturing | 9.03% |
| By Technology | Protected formulations | 46.0% | Esterified formulations | 9.30% |
| By Sales Channel | Feed additive distribution | 41.0% | Feed additive distribution | 8.32% |
Request a Free Sample
Fill in your details and we'll send you a free sample report.
- Sample data tables & charts
- Research methodology
Poultry output, protected grades and AMR policy lift demand
How does recurring poultry feed demand lift volumes?
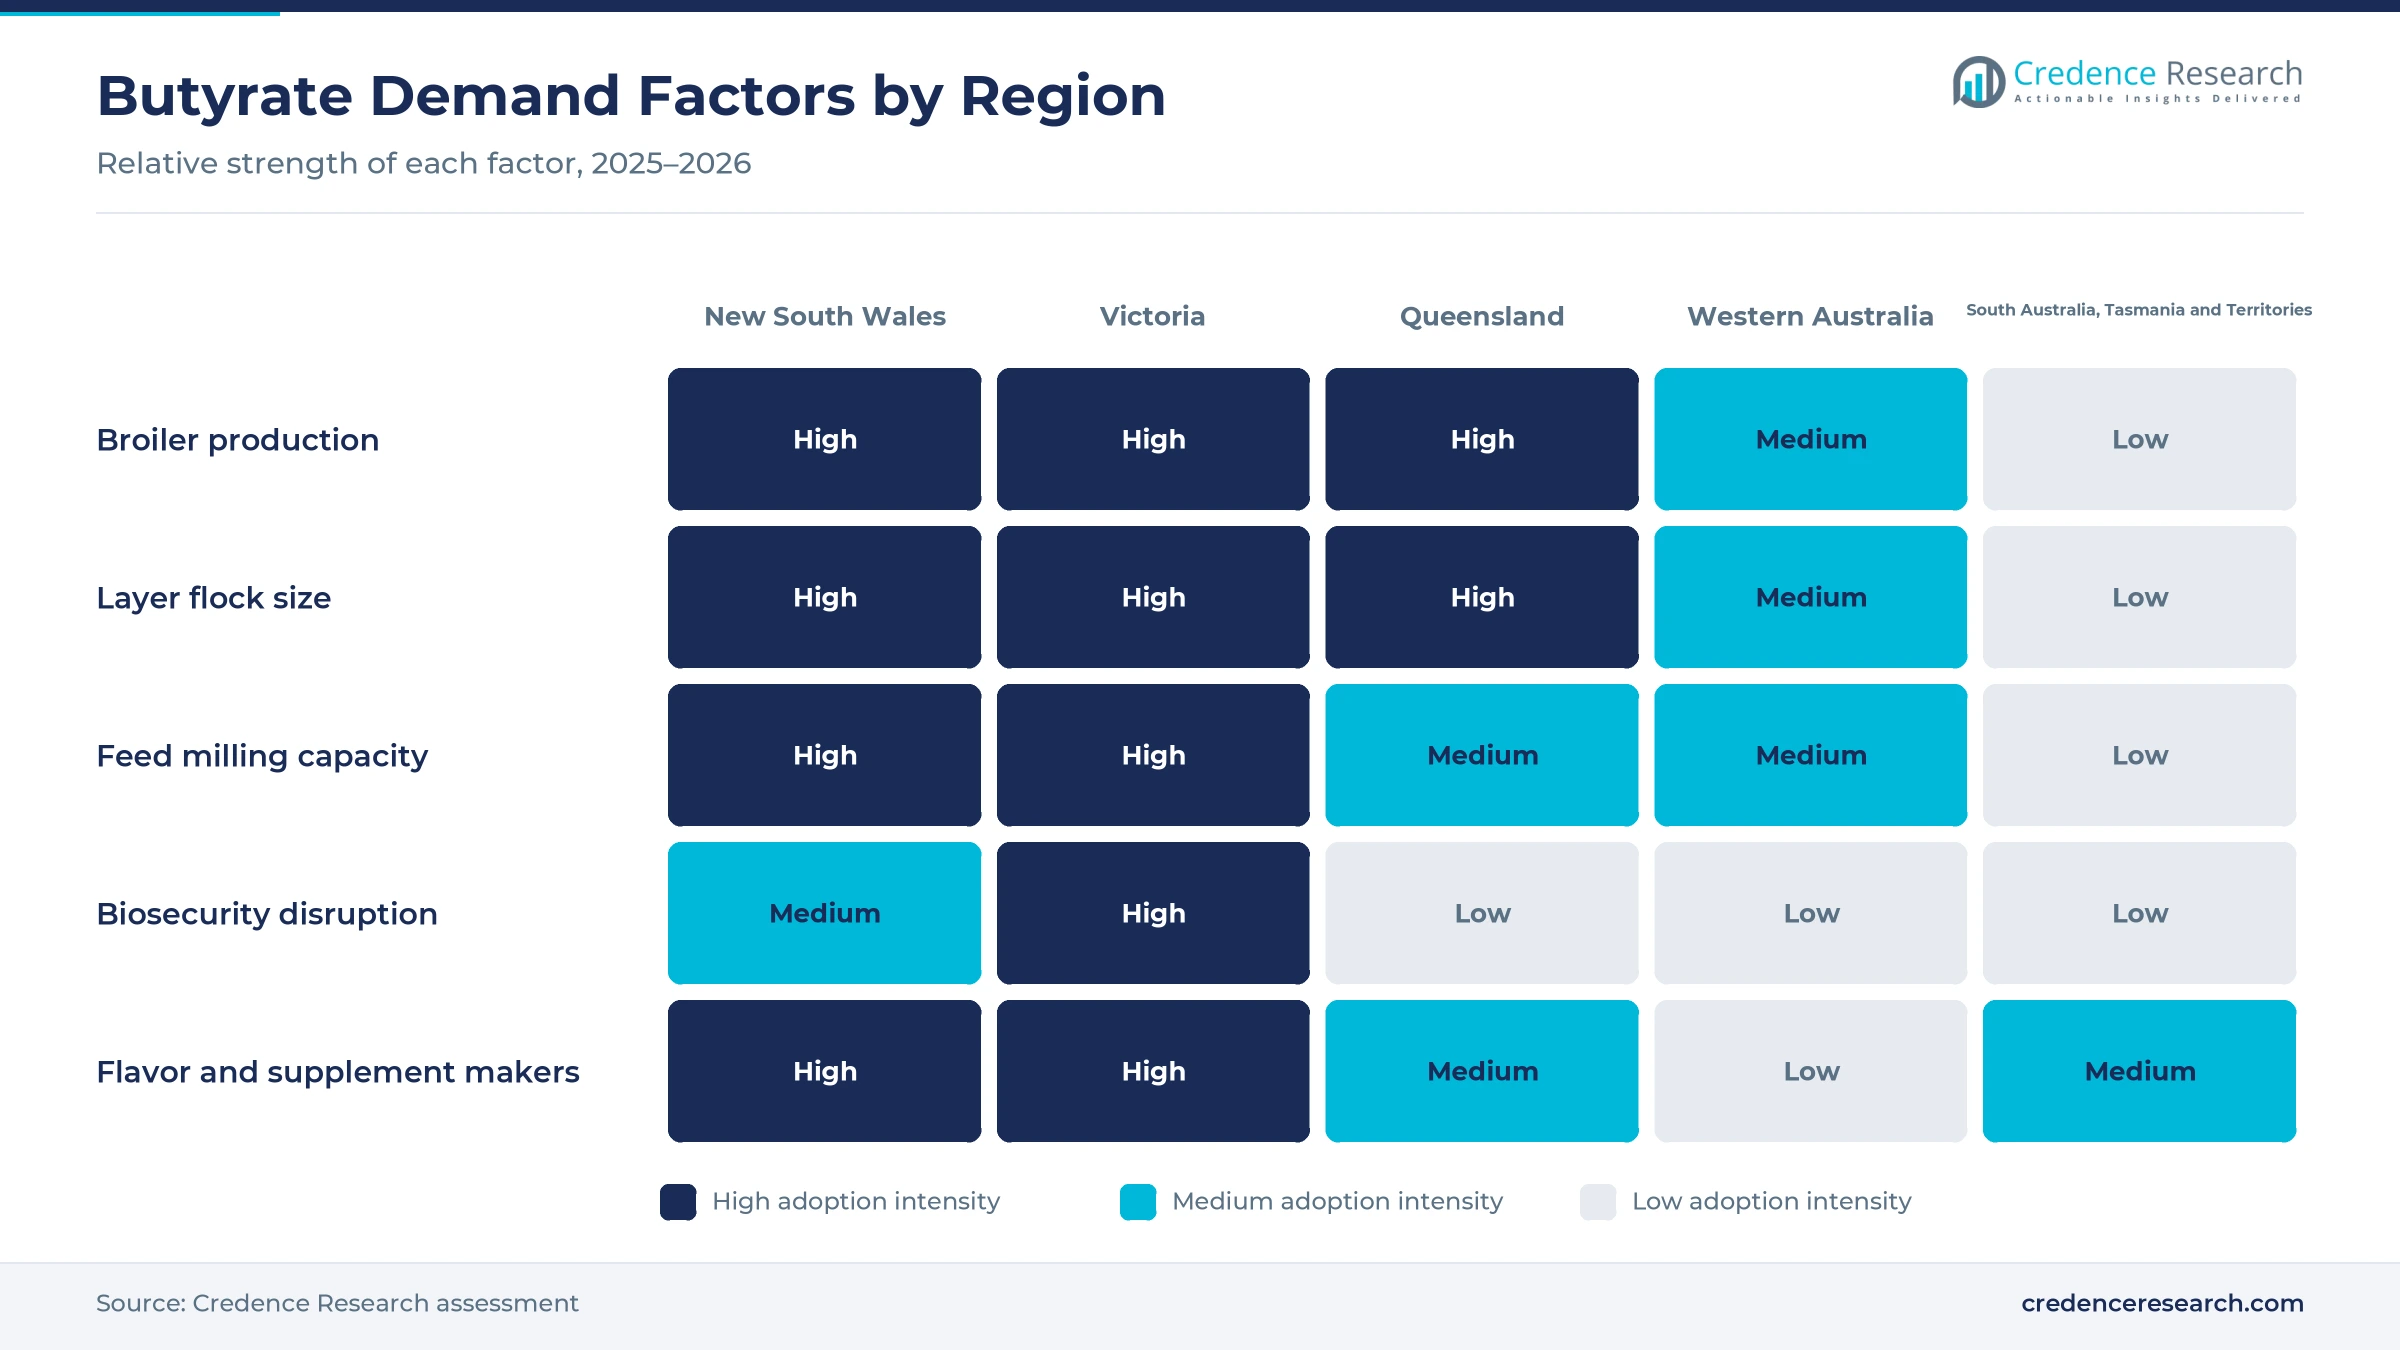
Recurring poultry feed demand lifts volumes, because butyrate is added to broiler and layer diets every day to support gut health. Chicken meat production rose 1.6% to 395,749 metric tons in the June 2025 quarter, according to the Australian Bureau of Statistics, while 190.3 million chickens were slaughtered over the same period. The national chicken meat federation estimates per capita consumption at about 54 kilograms in 2024-25, with around 700 million chickens raised a year. The layer flock also reached 24.89 million hens in June 2025. As a result, animal feed holds 64.0% of 2025 value in the Australia butyric acid market, and poultry feed mills remain the core buyers.
Why do protected ingredients win premium feed contracts?
Protected ingredients win premium feed contracts, because free butyric acid is absorbed early and smells strongly in feed mills. Perstorp describes ProPhorce SR 130 as an odor-free glycerol ester with up to twice the butyric acid activity of coated products. Perstorp joined Petronas Chemicals Group on Oct. 11, 2022, which gave the butyrin range a larger Asian parent. Kemin also encapsulates butyrate with zinc in its ButiPEARL Z product for swine and poultry. Consequently, protected formulations lead technology types with 46.0% of 2025 value, as integrators in the Australia butyric acid market pay more for precise release and lower handling odor.
How does spray-freezing encapsulation widen butyrate use?
Spray-freezing encapsulation widens butyrate use, because it hides odor and controls where the acid is released. Kemin uses its MicroPEARLS spray-freezing technology to encapsulate butyric acid and zinc in ButiPEARL Z, a product made in Des Moines for swine and poultry. On Oct. 12, 2023, Kemin also introduced ButiShield, a microencapsulated calcium butyrate for people that contains more than 35% butyric acid. Kemin operates in 90 countries and runs manufacturing facilities in Singapore, China and India. As a result, pharmaceutical and nutraceutical manufacturing grows fastest among end uses at 9.03% a year, while feed buyers adopt the same encapsulation for heat-stable premixes.
Why does antimicrobial stewardship support gut health additives?
Antimicrobial stewardship supports gut health additives, because producers need alternatives that keep flocks healthy with fewer antibiotics. The national antimicrobial resistance strategy, endorsed on March 13, 2020, sets a 20-year vision that covers human, animal and environmental health, according to the World Health Organization. The strategy runs from 2020 to 2040 and builds on a first strategy for 2015 to 2019. Perstorp also states that its butyrin product helps lower antibiotic-related costs such as veterinary expenses. Consequently, feed additive suppliers position butyrate within gut health programs for integrated operators, such as Baiada and Inghams, which together supply about 70% of meat chickens nationally.
Biosecurity, glycerides and human gut health shape demand
How is the rise of biosecurity pressure shaping feed programs?
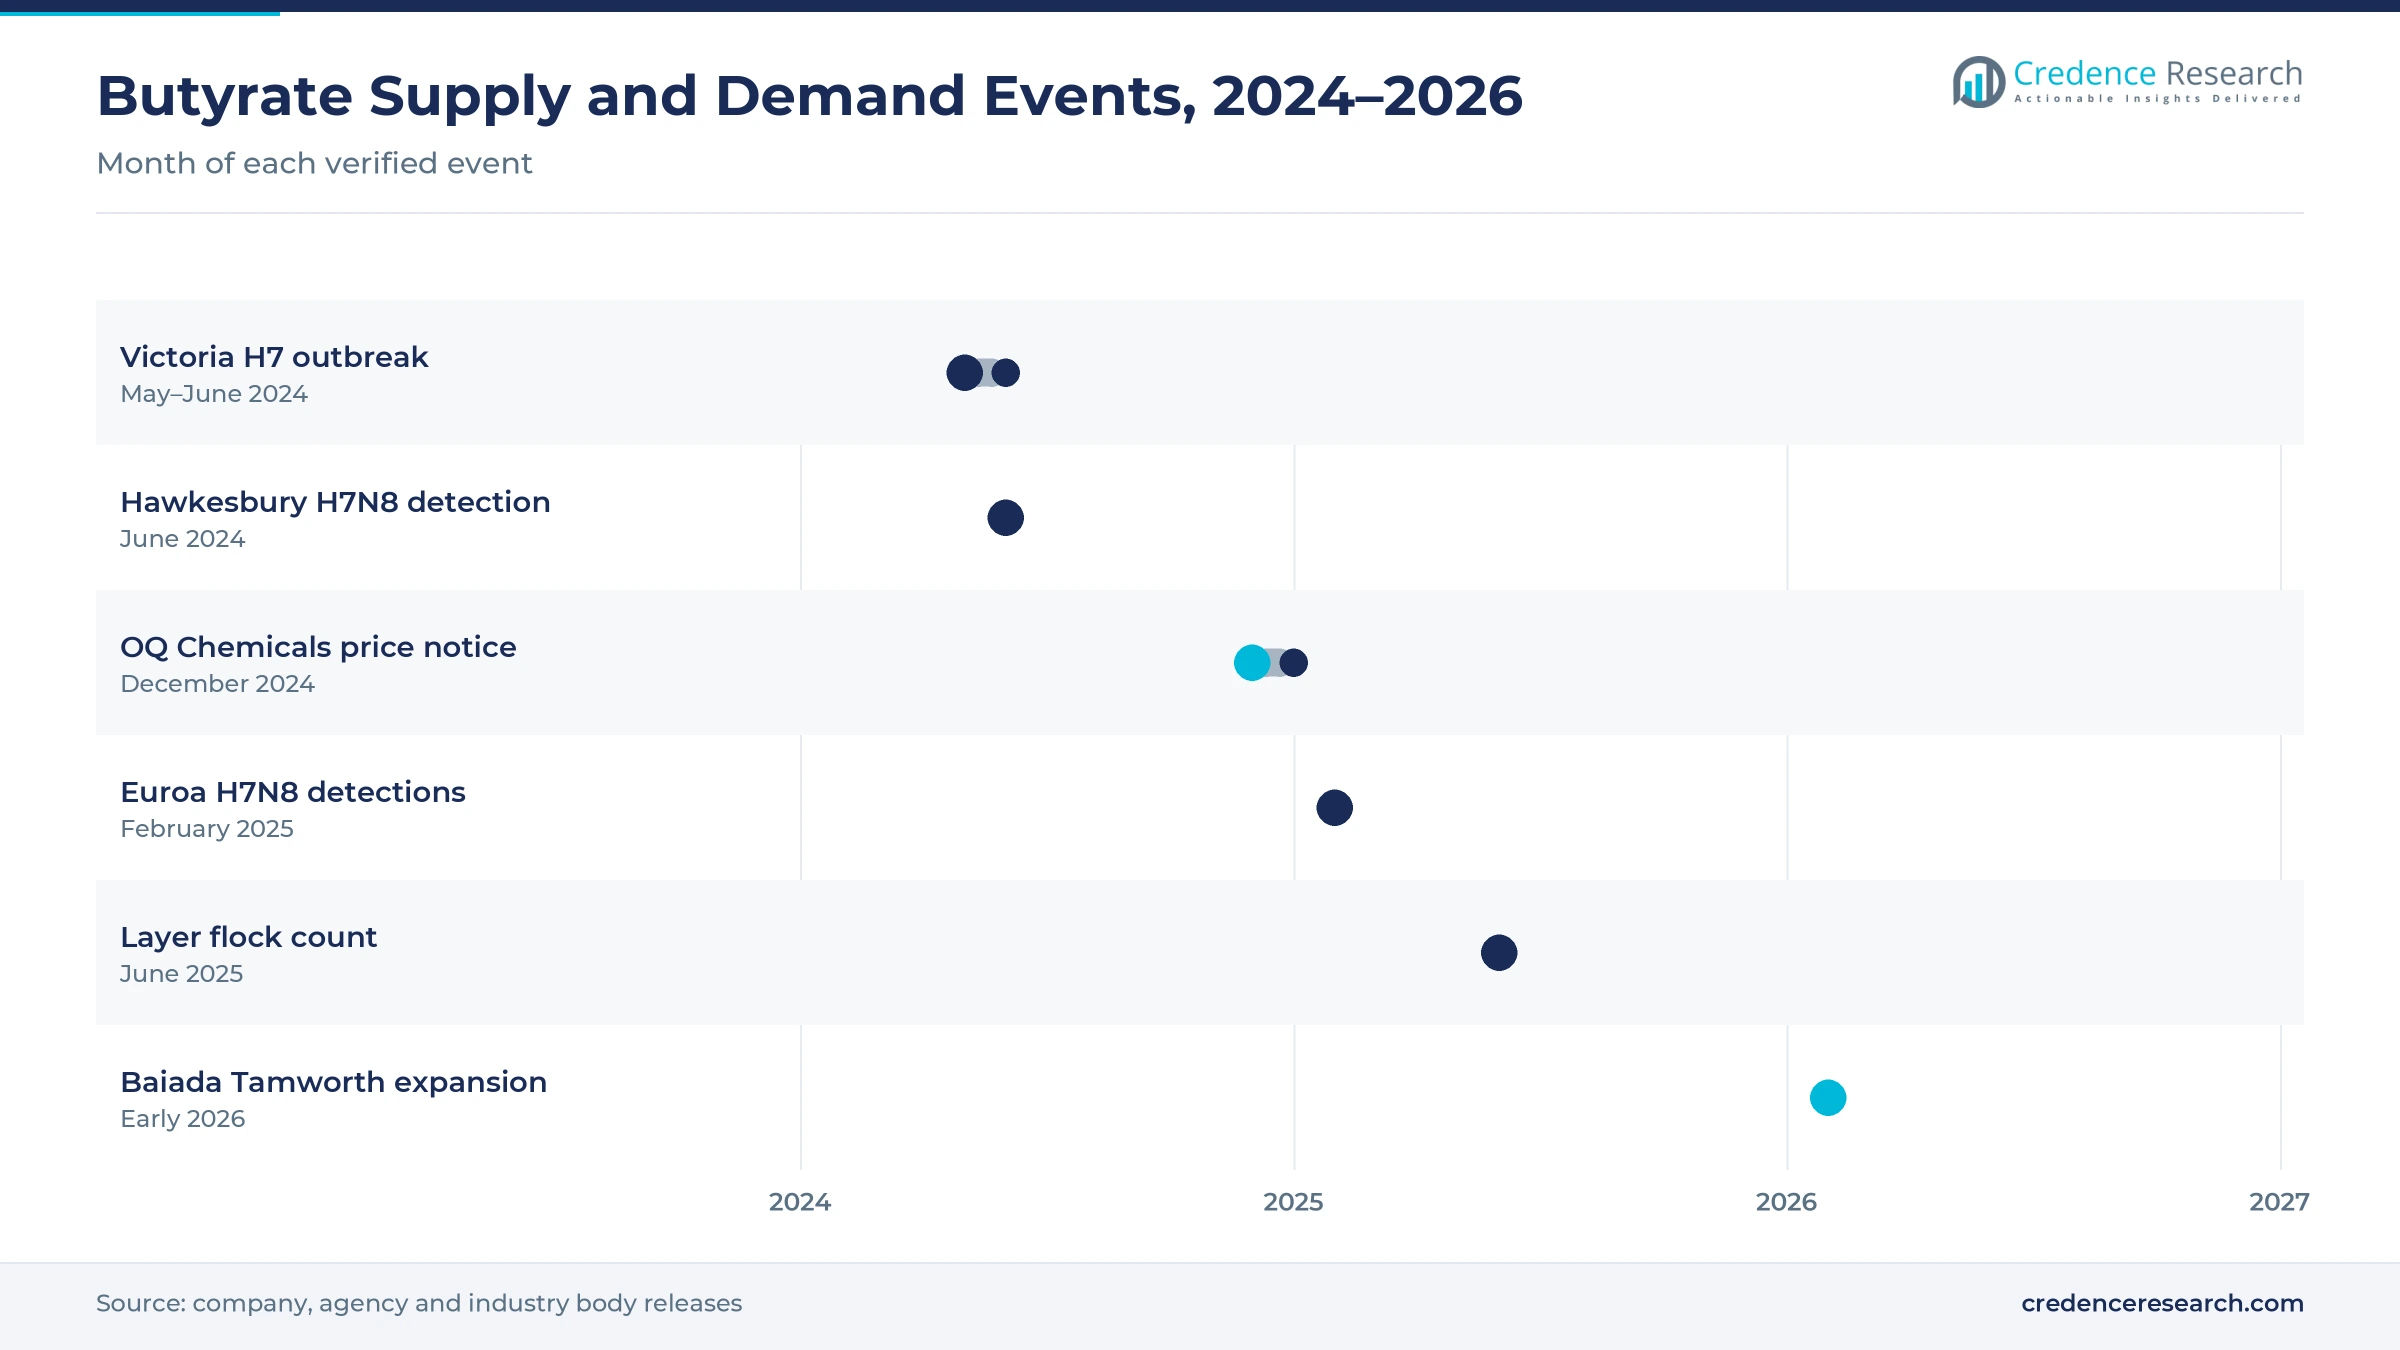
The rise of biosecurity pressure is shaping feed programs, because avian influenza outbreaks have forced farms to protect flock health more closely. Eight commercial poultry properties in Victoria had infected birds between May 22 and June 24, 2024, and more than one million birds were euthanized. Governments committed about AUD 116.49 million to that response, which was the largest bird flu outbreak in the country. H7N8 was then confirmed at a fourth Euroa property on Feb. 25, 2025. In New South Wales, H7N8 was found on two Hawkesbury farms in June 2024, according to the state primary industries department. As a result, producers add gut health additives to rebuild flock resilience after restocking.
Why is the shift toward glyceryl butyrates rising?
The shift toward glyceryl butyrates is rising, because esters are stable, odor-free and easy to blend into pelleted feed. Perstorp lists ProPhorce SR 130 as a dry butyrin feed additive under HS number 230990. The company states that its targeted release gives up to twice the butyric acid activity of coated products. In addition, OQ Chemicals raised butyric acid prices by USD 85 per metric ton outside Europe and North America from Jan. 1, 2025, according to its price notice. Consequently, glyceryl butyrates grow fastest among product types at 9.16% a year, as buyers seek more activity per kilogram of additive.
Can human gut health products open new demand?
Human gut health products open new demand, because supplement brands want butyrate in capsules and powders without the strong odor of the free acid. Kemin introduced ButiShield on Oct. 12, 2023, describing it as a non-GMO, allergen-free, halal and vegetarian ingredient with more than 35% butyric acid. Eastman also produces a food and feed grade under good manufacturing practice at Kingsport, Tennessee, with a kosher grade available. The U.S. FDA lists butyric acid as generally recognized as safe for use as a flavoring agent. As a result, supplement makers form a fast-growing niche for encapsulated grades, while feed mills pair butyrate with probiotic feed products.
Is there room to grow with new poultry processing capacity?
New poultry processing capacity offers a clear opening, because each added bird needs feed with gut health additives. New South Wales produced 597,000 metric tons of chicken meat in 2024-25, up 11%, or 39% of national output. Baiada is expanding its Tamworth processing plant, due for completion in early 2026, with capacity for up to three million chickens a week. Baiada and Inghams together supply about 70% of meat chickens, which concentrates purchasing with integrated operators. Consequently, feed additive distribution leads channels with 41.0% of 2025 value, as integrators expand regional processing in Tamworth and other inland towns of New South Wales.
Import reliance, odor handling and price swings weigh
How does import reliance raise supply risk?
Import reliance raises supply risk, because butyric acid and most butyrate salts and esters reach Australia from overseas producers. Shipping delays and currency swings can lift landed costs quickly for premix plants. As a result, smaller feed mills without safety stock face higher prices or product switches. Distributors reduce this risk by holding local inventory and qualifying more than one supplier for each grade, which protects customers during long shipping disruptions.
Why does odor and handling limit free acid use?
Odor and handling limit free acid use, because butyric acid has a strong, rancid smell and corrodes some equipment. Feed mill workers and neighbors notice the smell quickly when the acid is handled in bulk. Consequently, many buyers avoid free acid in favor of coated salts or glycerides. Suppliers answer with encapsulated and esterified grades, although these cost more per kilogram of active butyrate and raise feed costs for price-sensitive operators.
How do raw material price swings affect buyers?
Raw material price swings affect buyers, because butyric acid is made from oxo chemical feedstocks tied to propylene and energy prices. Producers pass these changes through price notices that can move costs within months. In turn, feed formulators on fixed-price contracts absorb margin pressure. Buyers manage this risk through shorter price reviews, blended products and dose adjustments that keep gut health programs within budget during volatile periods.
Will flock disruptions slow feed additive volumes?
Flock disruptions can slow feed additive volumes, because disease outbreaks and depopulation cut the number of birds that need feed. Egg production fell to 6.87 billion eggs in 2024-25 from 6.98 billion a year earlier. As a result, additive suppliers lose volume until farms restock and flocks return to full production. Suppliers that support restocking programs with gut health advice can recover sales faster once sheds are cleared and refilled.
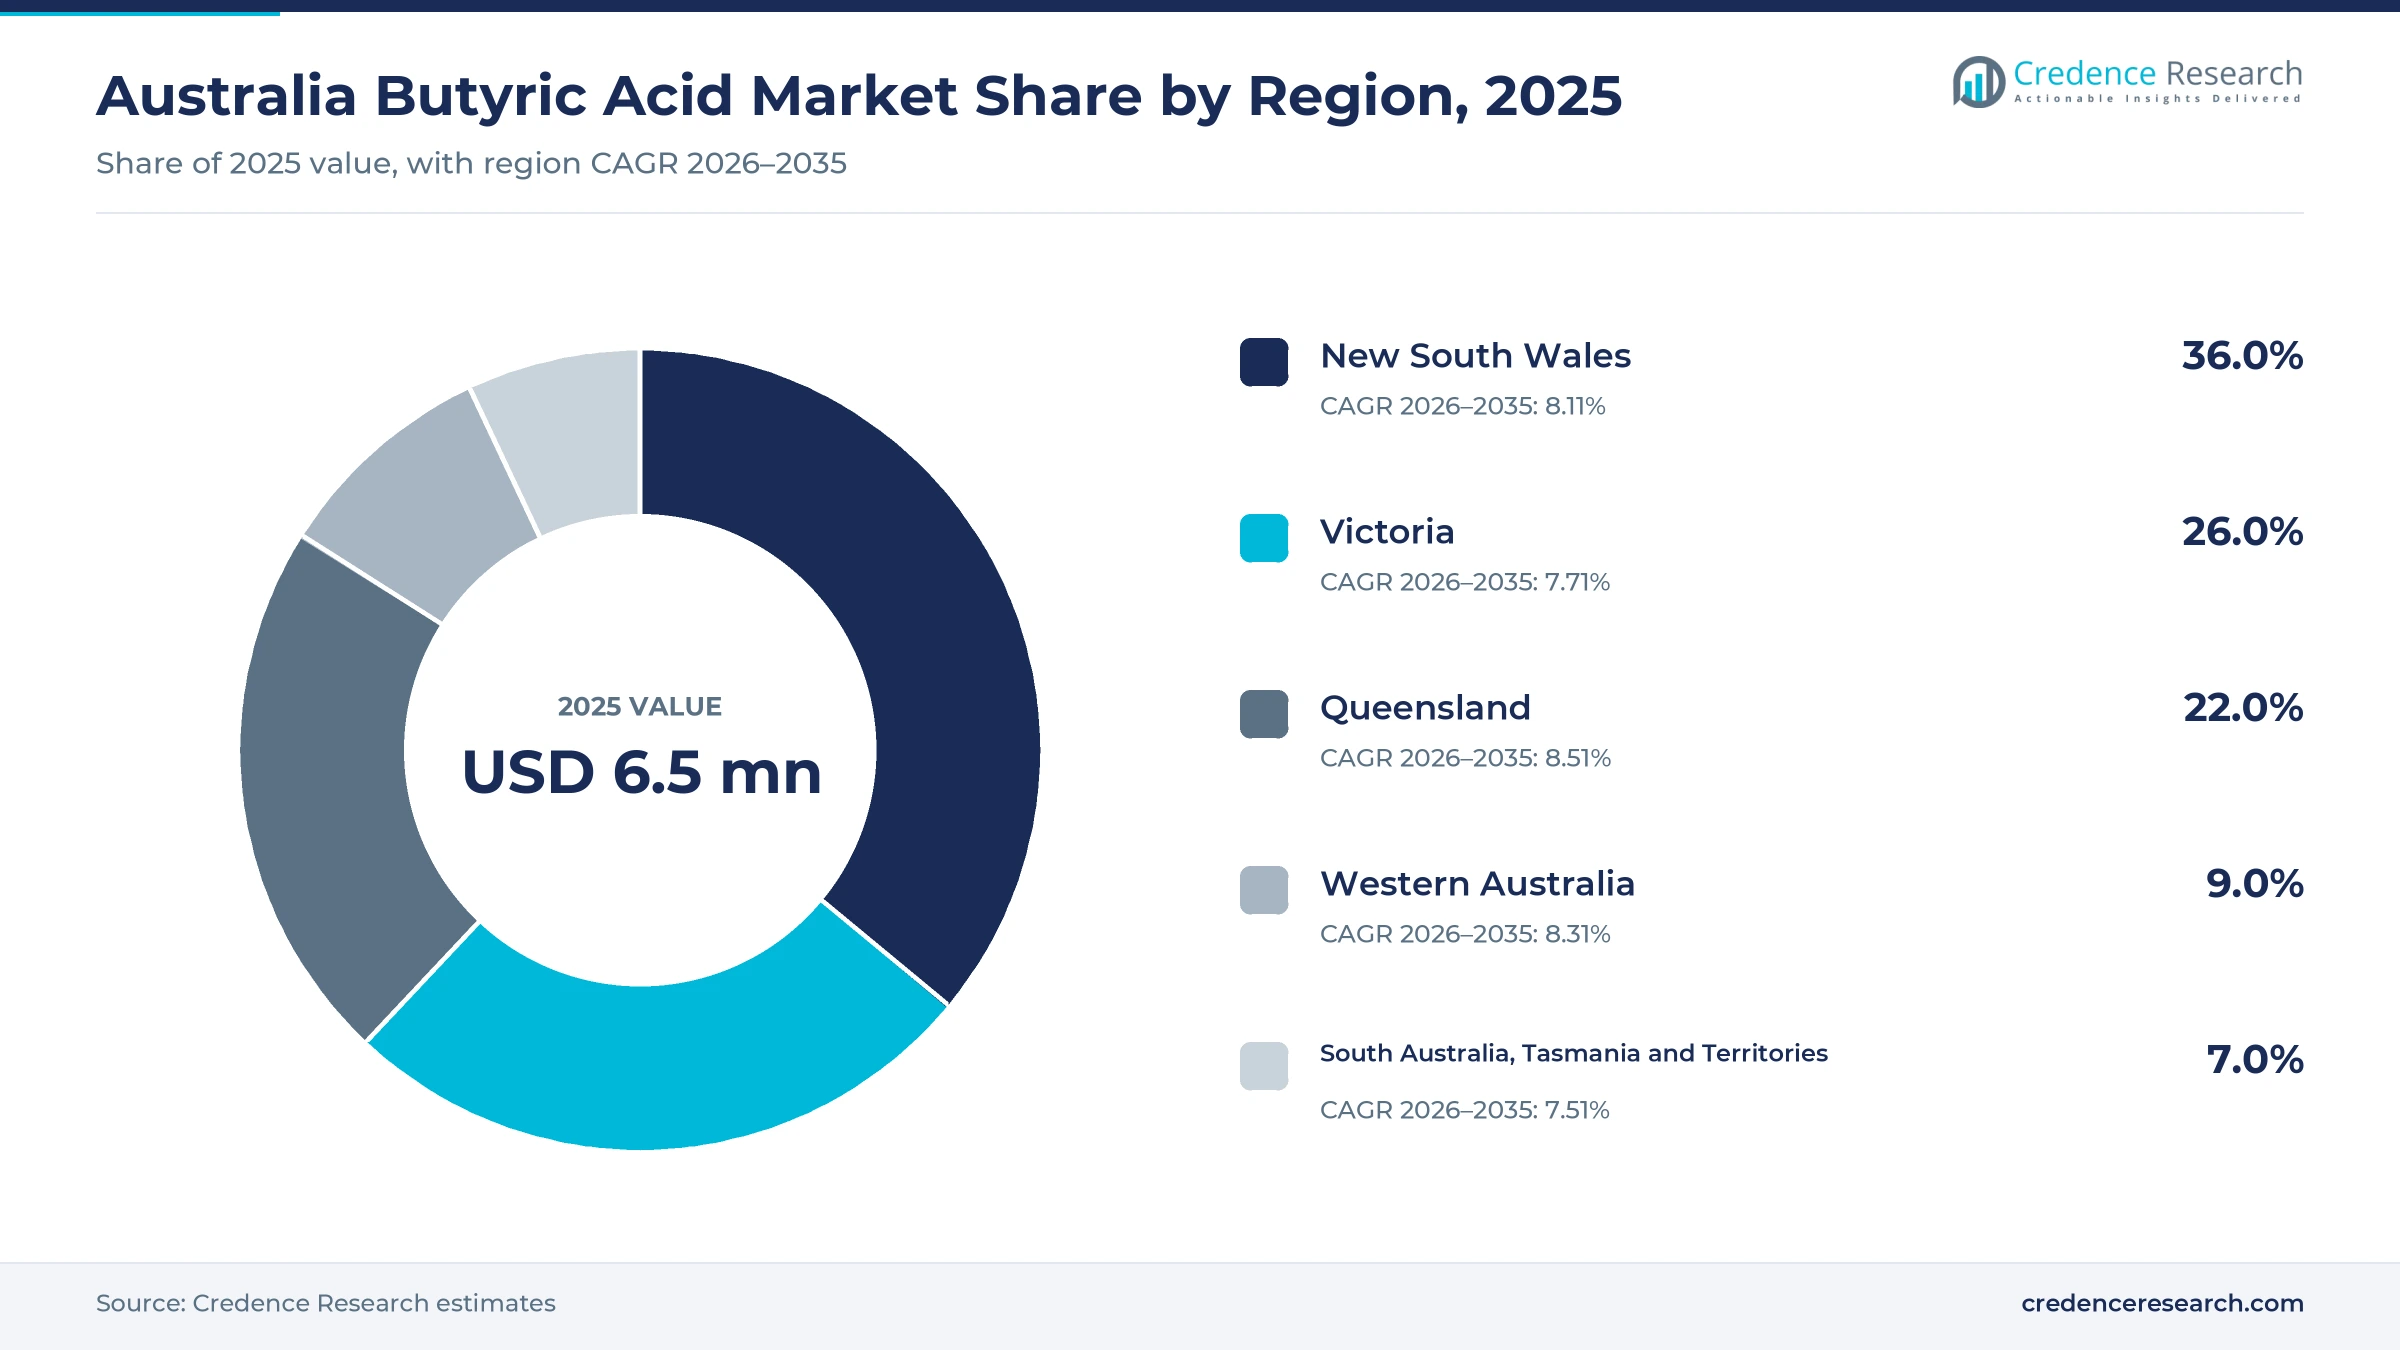
New South Wales leads as Queensland adds demand fastest
| Region | Value, 2025 (USD million) | Share, 2025 | CAGR, 2026–2035 |
|---|---|---|---|
| New South Wales | 2.3 | 36.0% | 8.11% |
| Victoria | 1.7 | 26.0% | 7.71% |
| Queensland | 1.4 | 22.0% | 8.51% |
| Western Australia | 0.6 | 9.0% | 8.31% |
| South Australia, Tasmania and Territories | 0.5 | 7.0% | 7.51% |
Why does New South Wales lead butyrate demand?
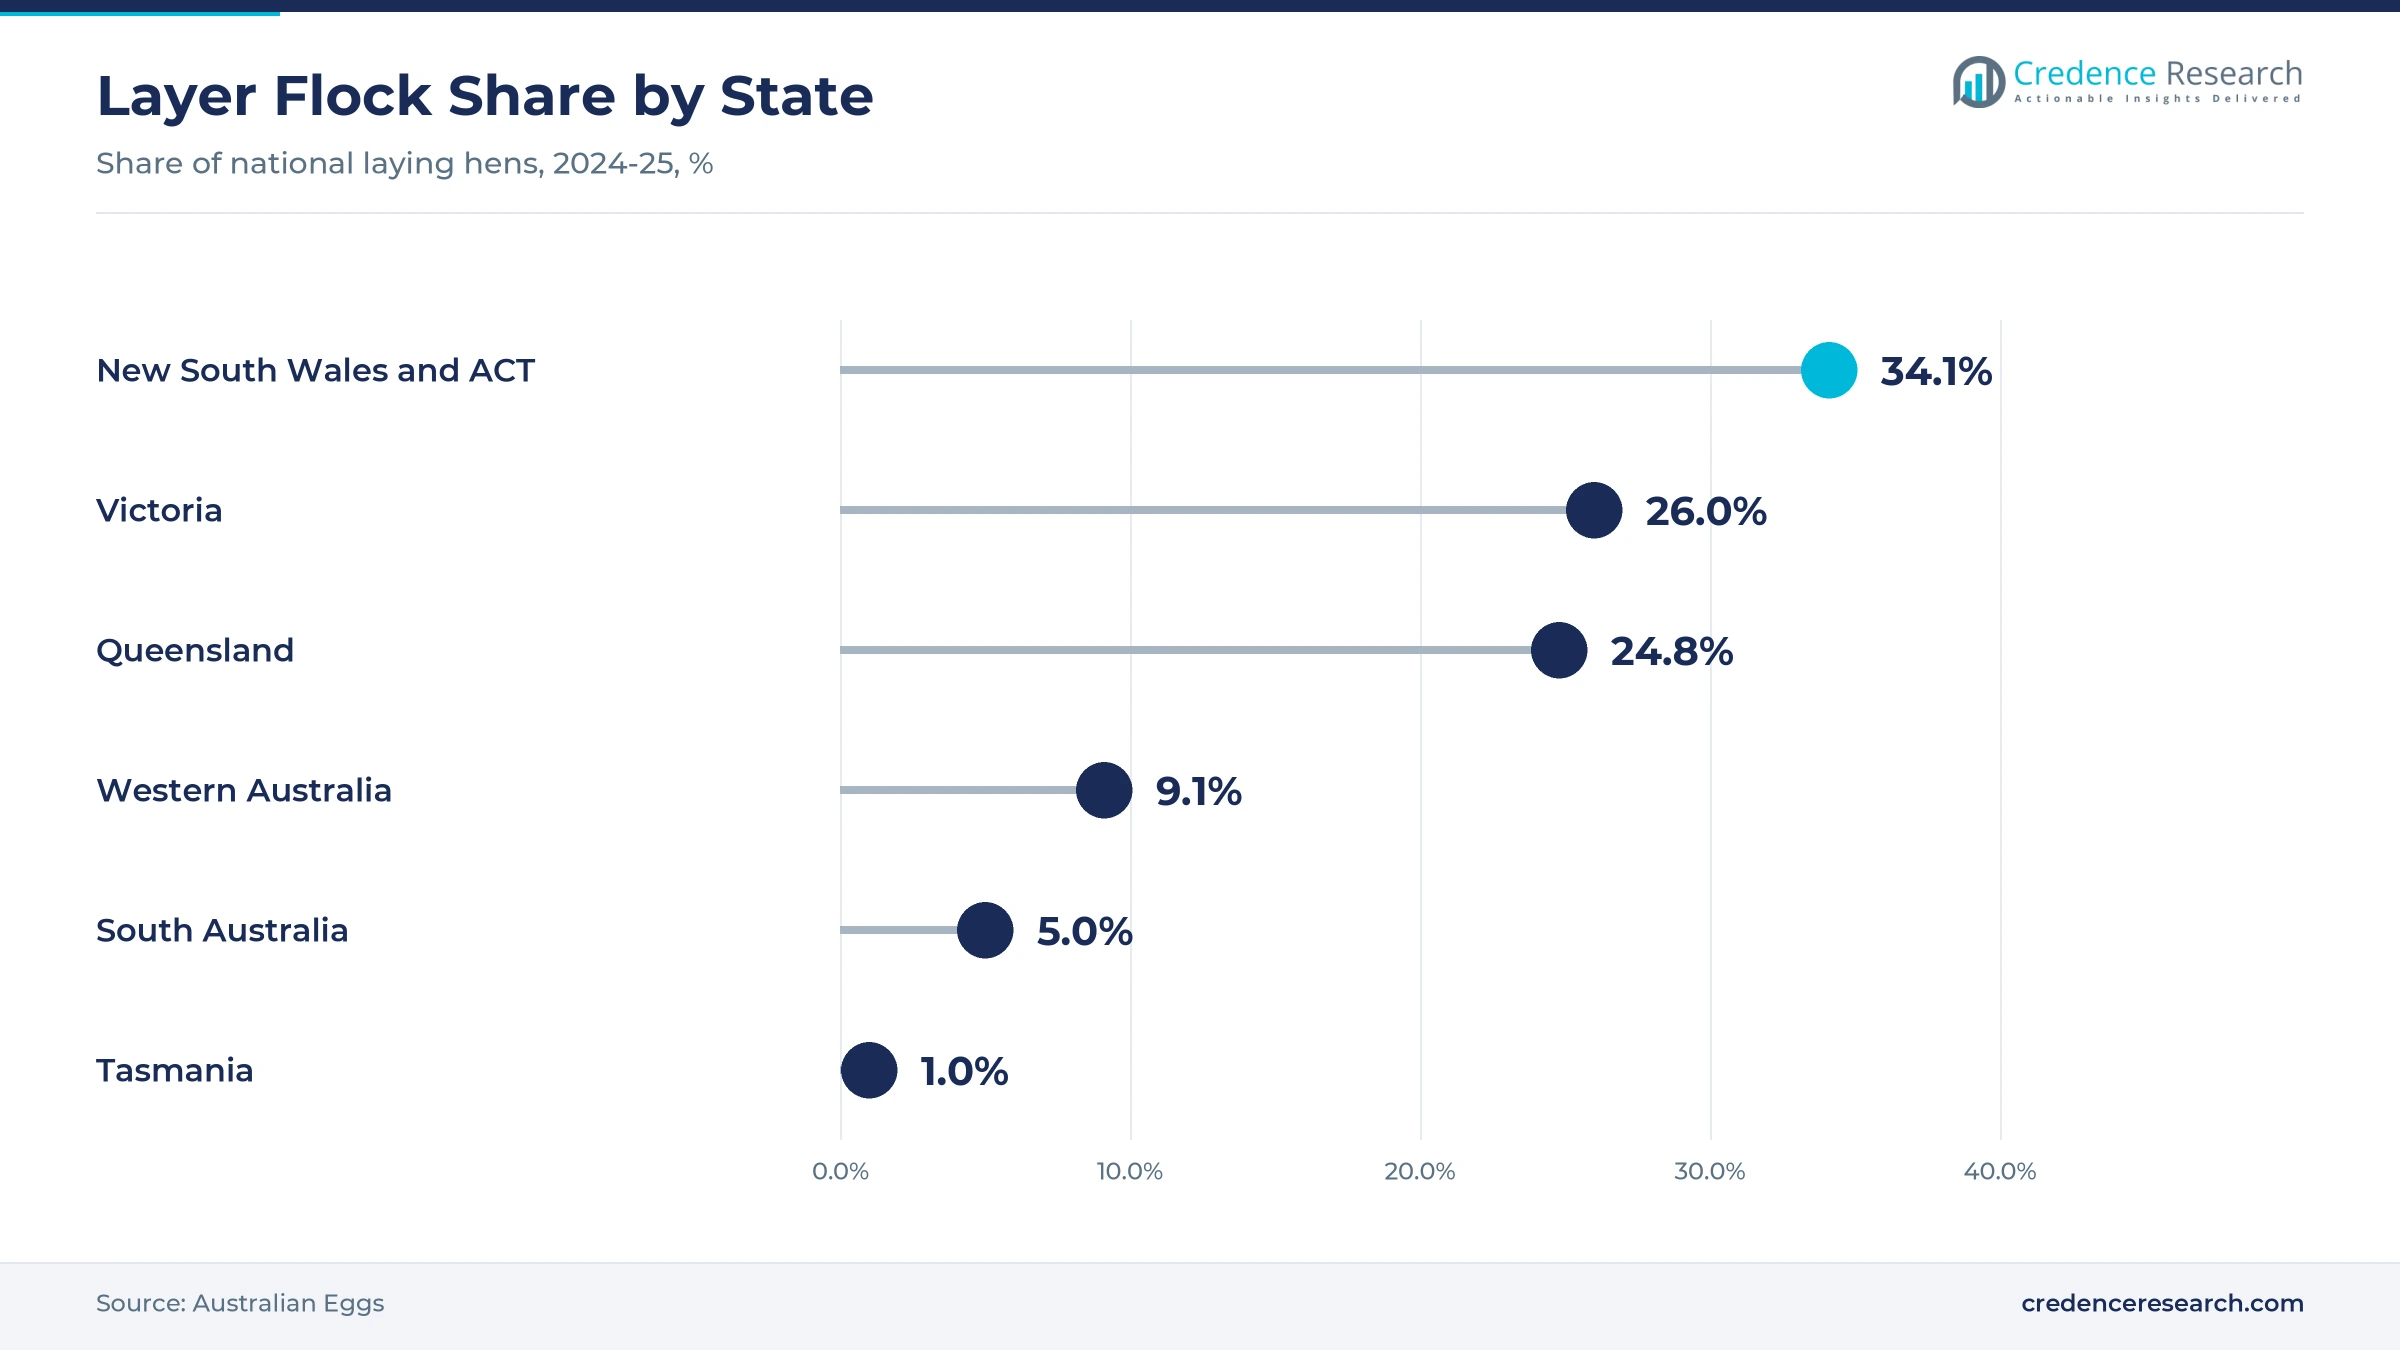
New South Wales held a 36.0% share of 2025 value and grows at 8.11% a year. The state produced 597,000 metric tons of chicken meat in 2024-25, or 39% of national output, and hosts large integrated operators. New South Wales and the ACT also held 34.1% of the national layer flock in 2024-25. As a result, the state keeps the largest share of poultry feed additive purchases through 2035.
How does Victoria rebuild feed additive demand?
Victoria held a 26.0% share of 2025 value and grows at 7.71% a year, because the state holds 26.0% of the national layer flock and large broiler farms. Avian influenza outbreaks in 2024 and 2025 cut bird numbers on several farms near Meredith, Terang and Euroa. Governments committed about AUD 116.49 million to the 2024 response, which shows the scale of flock losses in the state. Consequently, Victorian demand recovers as producers restock sheds and add gut health programs.
Why is Queensland the fastest-growing zone?
Queensland held a 22.0% share of 2025 value and grows fastest at 8.51% a year, because broiler and layer farms keep expanding in the southeast of the state. Queensland held 24.8% of the national layer flock in 2024-25, according to the national egg industry body. In turn, the state adds the most new demand for protected butyrate in layer and broiler diets.
How does Western Australia add demand?
Western Australia held 9.0% of 2025 value and grows at 8.31% a year. The state held 9.1% of the national layer flock in 2024-25, and its broiler farms supply Perth and regional towns. Therefore, local premix plants keep steady demand for butyrate salts and glycerides.
What role do South Australia, Tasmania and the territories play?
South Australia, Tasmania and the territories held 7.0% of 2025 value and grow at 7.51% a year. South Australia held 5.0% of the layer flock in 2024-25 and Tasmania 1.0%. As a result, demand here comes mainly from smaller feed mills, flavor users and laboratories.
Price moves, outbreaks and plant expansion from 2024 to 2026
| Development | Status and market relevance |
|---|---|
| In May 2024, avian influenza was confirmed on the first of eight commercial poultry properties in Victoria, where more than one million birds were later euthanized. | Raised biosecurity and gut health focus |
| In December 2024, OQ Chemicals announced butyric acid price increases effective Jan. 1, 2025. | Lifted imported raw material costs |
| In February 2025, Agriculture Victoria confirmed H7N8 avian influenza at a fourth Euroa poultry property. | Extended restocking needs in Victoria |
| In July 2025, the national egg industry body reported a layer flock of 24.89 million hens as at June 2025. | Sets the base for layer feed demand |
| In June 2024, H7N8 avian influenza was detected on two commercial poultry farms in the Hawkesbury region of New South Wales. | Emergency response concluded in January 2025 |
Encapsulation and esterification reshape butyrate supply
- Spray-freezing microencapsulation locks butyrate in a fat matrix, which hides odor and releases the acid along the intestine rather than in the stomach.
- Glycerol esterification binds butyric acid to glycerol to form mono-, di- and tributyrin, which are stable, odor-free and easy to blend into pelleted feed.
- Fat-coated butyrate salts protect sodium and calcium butyrate through pelleting heat, which keeps dosing accurate in broiler and pig diets.
- Combined gut health blends pair butyrate with zinc, medium-chain fatty acids or botanicals, which lets feed mills replace several additives with one product.
Need a Custom Version of This Report?
Tailor the scope, geography, or segments to your exact requirements.
- Custom geography or segment scope
- Direct access to our analyst team
Producers and distributors compete on release technology
Competition combines global oxo chemical producers, feed additive specialists and specialty chemical distributors. OQ Chemicals, formerly Oxea and Eastman Chemical Company produce butyric acid, and OQ Chemicals raised prices for customers outside Europe and North America from Jan. 1, 2025. Eastman makes a food and feed grade at Kingsport under good manufacturing practice. Perstorp, part of Petronas Chemicals Group since October 2022, sells the ProPhorce SR butyrin range, while Kemin encapsulates butyrate with MicroPEARLS spray-freezing in ButiPEARL products. Kemin also introduced ButiShield, a microencapsulated calcium butyrate for supplements, in October 2023. Companies compete on release technology, odor control, trial data, local stock and technical support for premix plants. Larger suppliers also bundle butyrate with other gut health additives, which helps them win whole feed programs with integrated poultry operators.
Companies profiled and their roles in this market
| Company | Type | Role in the market |
|---|---|---|
| OQ Chemicals (formerly Oxea) | Acid producer | Butyric acid price increase effective Jan. 1, 2025 |
| Eastman Chemical Company | Acid producer | Food and feed grade butyric acid made at Kingsport |
| Perstorp Holding AB | Ester producer | ProPhorce SR 130 butyrin; part of Petronas Chemicals Group |
| Kemin Industries | Feed additive formulator | MicroPEARLS spray-freezing in ButiPEARL Z and ButiShield |
Credence Research view on butyrate feed ingredients
Credence Research's view is that Australian butyrate demand will grow steadily through 2035, as poultry and egg producers keep gut health at the center of feed programs. Butyrate salts should keep the largest product share, while glyceryl butyrates gain most from odor-free, targeted release. Animal feed will remain the main end use, although supplement makers add a faster-growing niche. However, import reliance and feedstock price swings will reward suppliers that hold local inventory and support premix plants with trial data.
How the butyrate ingredient estimate was built
The report uses 2025 as the base year, with values in USD million at current prices. Market values come from the Credence Research model, which combines poultry and pig feed volumes, inclusion rates, import flows and price tiers. Regional shares and segment splits by product type, end-use industry, technology and sales channel are Credence Research estimates. Sources used are official statistics, state agency releases, industry body data, company statements and news reports, and no interviews or surveys were used.
Protected butyrates and poultry growth shape 2035
The market is expected to reach USD 26.1 million by 2035, an 8.07% CAGR during 2026–2035, as poultry output and protected ingredients keep demand rising. Growth should be strongest in glyceryl butyrates, esterified formulations and Queensland, while New South Wales keeps the largest share. New processing capacity and flock restocking will widen feed demand after 2026. In contrast, further avian influenza outbreaks or sharp feedstock price rises could slow additive spending and push buyers toward cheaper unprotected grades.
Frequently Asked Questions
How big is the Australia butyric acid market?
Which region leads butyrate demand?
Which region grows fastest?
Which product type holds the largest share?
Why do feed mills prefer protected butyrate?
Which product type grows fastest?
Who are the leading companies in this market?
What are the main risks to growth?
Table of Content
Chapter 1 Market Segmentation
- 1.1 Segmentation Framework
- 1.1.1 Product and Service Classification
- 1.1.2 Application and End-Use Classification
- 1.1.3 Technology and Solution Classification
- 1.1.4 Customer and Distribution Channel Classification
- 1.1.5 Geographic Segmentation
- 1.1.6 Market Segment Definitions and Boundaries
- 1.2 By Product Type
- 1.2.1 Free n-butyric acid
- 1.2.2 Butyrate salts
- 1.2.3 Glyceryl butyrates
- 1.2.4 Flavor esters
- 1.3 By End-Use Industry
- 1.3.1 Animal feed
- 1.3.2 Food and flavor manufacturing
- 1.3.3 Pharmaceutical and nutraceutical manufacturing
- 1.3.4 Chemical and laboratory supply
- 1.4 By Technology
- 1.4.1 Unprotected formulations
- 1.4.2 Protected formulations
- 1.4.3 Esterified formulations
- 1.5 By Sales Channel
- 1.5.1 Direct producer sales
- 1.5.2 Specialty chemical distribution
- 1.5.3 Feed additive distribution
- 1.5.4 Laboratory catalog sales
Chapter 2 Introduction
- 2.1 Report Objectives and Scope
- 2.2 Product Definition and Industry Terminology
- 2.3 Market Inclusions and Exclusions
- 2.4 Research Process
- 2.4.1 Primary Research and Expert Interviews
- 2.4.2 Secondary Research and Source Review
- 2.4.3 Top-Down and Bottom-Up Estimation
- 2.4.4 Data Triangulation and Verification
- 2.5 Market Size Measurement Basis
- 2.5.1 2025: USD 6.5 million → 2035: USD 26.1 million
- 2.6 Historical and Forecast Reference Periods
- 2.6.1 Historical Period: 2018-2025
- 2.6.2 Base Year: 2025
- 2.6.3 Forecast Period: 2025-2035
- 2.7 Research Assumptions and Limitations
Chapter 3 Executive Summary
- 3.1 Market Snapshot and Key Findings
- 3.2 Base-Year Market Size, 2025
- 3.3 Forecast Market Size, 2035
- 3.4 Revenue and Volume Growth Outlook
- 3.5 Key Demand and Supply Indicators
- 3.6 Leading Market Segments
- 3.7 Fastest-Growing Market Opportunities
- 3.8 Regional Performance Highlights
- 3.9 Technology and Industry Transformation
- 3.10 Competitive Landscape Summary
- 3.11 Analyst View and Strategic Implications
Chapter 4 Australia Butyric Acid Market Trends and Developments
- 4.1 Historical Industry Development, 2018-2025
- 4.2 Recent Market Trends and Developments
- 4.3 Demand and Customer Behavior Trends
- 4.4 Technology and Product Innovation
- 4.5 Artificial Intelligence, Automation and Digitalization
- 4.6 Local Manufacturing and Supply Chain Realignment
- 4.7 Industry Partnerships, Mergers and Acquisitions
- 4.8 Sustainability and Circular Economy Developments
- 4.9 Government and Private Sector Investment Trends
- 4.10 Emerging Business Models and Commercialization
- 4.11 Industry Developments and Announcements
Chapter 5 Australia Butyric Acid Market Production, Supply and Demand Analysis
- 5.1 Demand Trend and Consumption Analysis, 2018-2025
- 5.2 Demand Forecast, 2025-2035
- 5.3 Production and Output Trend, 2018-2025
- 5.4 Production and Output Forecast, 2025-2035
- 5.5 Installed Capacity and Capacity Utilization
- 5.6 Company-Wise Production Plants and Statistics
- 5.6.1 Installed Production Capacity
- 5.6.2 Actual Production
- 5.6.3 Planned Capacity and Expansion Targets
- 5.7 Supply Chain Structure and Procurement Trends
- 5.8 Supply-Demand Gap and Bottlenecks
- 5.9 Import Dependence and Sourcing Structure
- 5.10 Contract Manufacturing and Outsourcing
- 5.11 Regional Supply and Demand Concentration
Chapter 6 Australia Butyric Acid Market Pricing Analysis
- 6.1 Pricing Structure and Measurement
- 6.2 Historical Pricing Trends, 2018-2025
- 6.3 Pricing Outlook, 2025-2035
- 6.4 Average Selling Price and Unit Economics
- 6.5 Pricing by Product and Market Segment
- 6.6 Geographic Pricing Differences
- 6.7 Key Input, Energy, Labor and Logistics Costs
- 6.8 Contract Pricing and Purchasing Models
- 6.9 Pricing Sensitivity and Competitive Positioning
- 6.10 Price, Margin and Profitability Implications
Chapter 7 Australia Butyric Acid Market Dynamics
- 7.1 Market Growth Drivers
- 7.1.1 Demand-Side Drivers
- 7.1.2 Technology and Innovation Drivers
- 7.1.3 Infrastructure and Investment Drivers
- 7.1.4 Regulatory and Policy Drivers
- 7.2 Market Restraints
- 7.2.1 Cost and Affordability Constraints
- 7.2.2 Technology and Adoption Barriers
- 7.2.3 Supply Chain and Operational Constraints
- 7.3 Market Challenges
- 7.3.1 Competitive Pressure and Margin Erosion
- 7.3.2 Skills, Infrastructure and Implementation Gaps
- 7.4 Emerging Market Opportunities
- 7.5 Market Dynamics Impact and Time-Horizon Assessment
Chapter 8 Australia Butyric Acid Value Chain Analysis
- 8.1 Industry Value Chain Overview
- 8.2 Upstream Suppliers and Critical Inputs
- 8.3 Technology and Component Providers
- 8.4 Manufacturing or Service Delivery
- 8.5 Distribution, Channel Partners and Integrators
- 8.6 Downstream Applications and End Users
- 8.7 Value Addition and Profit Pools
- 8.8 Vertical Integration and Outsourcing
- 8.9 Supplier Concentration and Risk
- 8.10 Supply Chain Localization and Resilience
Chapter 9 Australia Butyric Acid Market Regulations and Policies
- 9.1 Relevant Laws, Standards and Compliance Frameworks
- 9.2 Product, Service, Safety and Quality Requirements
- 9.3 Government Policies, Incentives and Subsidies
- 9.4 Imports, Exports and Trade Barriers
- 9.5 Public Procurement and Local Content Requirements
- 9.6 Environmental and Sustainability Compliance
- 9.7 Upcoming Policy Changes and Market Implications
Chapter 10 Australia Butyric Acid Market Hotspots and Opportunities
- 10.1 Market Opportunity Mapping and Growth Hotspots
- 10.2 High-Growth Applications and Customer Groups
- 10.3 Underserved Markets and White-Space Opportunities
- 10.4 Emerging Technology and Product Opportunities
- 10.5 New Capacity and Investment Hotspots
- 10.6 Market Entry and Expansion Opportunities
- 10.7 Distribution and Partnership Opportunities
- 10.8 Near-Term and Long-Term Commercial Potential
- 10.9 Opportunity Attractiveness and Execution Risks
Chapter 11 Australia Butyric Acid Market Outlook, 2025-2035
- 11.1 Market Size and Analysis
- 11.1.1 Revenue (Market Measurement: 2025: USD 6.5 million → 2035: USD 26.1 million)
- 11.1.2 Market Volume and Quantity Sold
- 11.1.3 Historical Market Size, 2018-2025
- 11.1.4 Base-Year Market Size, 2025
- 11.2 Market Forecast, 2025-2035
- 11.2.1 Revenue Forecast to 2035
- 11.2.2 Volume Forecast to 2035
- 11.2.3 CAGR and Year-on-Year Growth
- 11.2.4 Incremental Revenue Opportunity
- 11.3 Forecast Assumptions and Scenario Analysis
- 11.3.1 Base-Case Forecast
- 11.3.2 Optimistic and Conservative Scenarios
- 11.3.3 Technology, Pricing and Policy Sensitivities
- 11.4 Market Attractiveness and Growth Outlook
Chapter 12 Australia Butyric Acid Market Segmentation and Outlook
- 12.1 Segmentation Summary and Market Shares, 2025
- 12.2 Largest and Fastest-Growing Segments
- 12.3 By Product Type - Market Size and Forecast, 2025-2035
- 12.3.1 Segment Definition and Scope
- 12.3.2 Historical Market Size, 2018-2025
- 12.3.3 Revenue Forecast, 2025-2035
- 12.3.4 Volume Forecast, 2025-2035
- 12.3.5 Base-Year Market Share, 2025
- 12.3.6 Segment CAGR and Growth Drivers
- 12.3.7 Subsegment Market Size and Forecast
- 12.3.7.1 Free n-butyric acid
- 12.3.7.2 Butyrate salts
- 12.3.7.3 Glyceryl butyrates
- 12.3.7.4 Flavor esters
- 12.3.8 Subsegment Pricing and Adoption Trends
- 12.3.9 Leading Suppliers and Competition
- 12.3.10 Regional Demand and Opportunities
- 12.4 By End-Use Industry - Market Size and Forecast, 2025-2035
- 12.4.1 Segment Definition and Scope
- 12.4.2 Historical Market Size, 2018-2025
- 12.4.3 Revenue Forecast, 2025-2035
- 12.4.4 Volume Forecast, 2025-2035
- 12.4.5 Base-Year Market Share, 2025
- 12.4.6 Segment CAGR and Growth Drivers
- 12.4.7 Subsegment Market Size and Forecast
- 12.4.7.1 Animal feed
- 12.4.7.2 Food and flavor manufacturing
- 12.4.7.3 Pharmaceutical and nutraceutical manufacturing
- 12.4.7.4 Chemical and laboratory supply
- 12.4.8 Subsegment Pricing and Adoption Trends
- 12.4.9 Leading Suppliers and Competition
- 12.4.10 Regional Demand and Opportunities
- 12.5 By Technology - Market Size and Forecast, 2025-2035
- 12.5.1 Segment Definition and Scope
- 12.5.2 Historical Market Size, 2018-2025
- 12.5.3 Revenue Forecast, 2025-2035
- 12.5.4 Volume Forecast, 2025-2035
- 12.5.5 Base-Year Market Share, 2025
- 12.5.6 Segment CAGR and Growth Drivers
- 12.5.7 Subsegment Market Size and Forecast
- 12.5.7.1 Unprotected formulations
- 12.5.7.2 Protected formulations
- 12.5.7.3 Esterified formulations
- 12.5.8 Subsegment Pricing and Adoption Trends
- 12.5.9 Leading Suppliers and Competition
- 12.5.10 Regional Demand and Opportunities
- 12.6 By Sales Channel - Market Size and Forecast, 2025-2035
- 12.6.1 Segment Definition and Scope
- 12.6.2 Historical Market Size, 2018-2025
- 12.6.3 Revenue Forecast, 2025-2035
- 12.6.4 Volume Forecast, 2025-2035
- 12.6.5 Base-Year Market Share, 2025
- 12.6.6 Segment CAGR and Growth Drivers
- 12.6.7 Subsegment Market Size and Forecast
- 12.6.7.1 Direct producer sales
- 12.6.7.2 Specialty chemical distribution
- 12.6.7.3 Feed additive distribution
- 12.6.7.4 Laboratory catalog sales
- 12.6.8 Subsegment Pricing and Adoption Trends
- 12.6.9 Leading Suppliers and Competition
- 12.6.10 Regional Demand and Opportunities
- 12.7 Segment Growth Comparison
- 12.8 Segment Attractiveness and Priority Matrix
Chapter 13 Australia Butyric Acid End-Use and Application Market Outlook
- 13.1 End-Use Industry and Customer Demand Structure
- 13.2 Leading Applications and Customer Groups
- 13.3 End-Use Market Size, Share and Forecast
- 13.4 Major End-Use Industry Deep Dives
- 13.4.1 Customer Requirements and Use Cases
- 13.4.2 Demand and Replacement Cycles
- 13.4.3 Technical and Regulatory Considerations
- 13.4.4 Purchasing and Procurement Models
- 13.4.5 Leading Vendors and Distribution Channels
- 13.4.6 Forecast and Commercial Opportunities
- 13.5 Emerging Applications and Cross-Segment Demand
- 13.6 End-Use Industry Investment Priorities
Chapter 14 Australia Butyric Acid Geographic Market Outlook, 2025-2035
- 14.1 Domestic Market Distribution and Demand Clusters
- 14.2 State- or Province-Wise Market Size and Forecast, 2025-2035
- 14.3 City and Metropolitan Market Outlook
- 14.4 Industrial, Manufacturing and Commercial Clusters
- 14.5 Geographic Concentration of Key End Users
- 14.6 Local Pricing and Purchasing Differences
- 14.7 Domestic Production Facilities and Capacity Map
- 14.8 Local Infrastructure and Project Pipeline
- 14.9 State-Level Policy and Incentive Differences
- 14.10 Subnational Investment Hotspots and Opportunities
- 14.11 Distribution and Logistics Networks
- 14.12 Domestic Competitive Footprint
Chapter 15 Australia Butyric Acid Technology, Innovation and Sustainability Outlook
- 15.1 Technology Landscape and Maturity
- 15.2 Product, Process and Service Innovation
- 15.3 AI, Automation and Digital Tools in the Industry
- 15.4 Technology Adoption and Performance Benchmarking
- 15.5 Innovation Pipeline and R&D Investment
- 15.6 Patent and Intellectual Property Trends
- 15.7 Energy Efficiency and Resource Management
- 15.8 Sustainability, Recycling and Circularity
- 15.9 Technology Roadmap, 2025-2035
- 15.10 Risks of Obsolescence and Technology Substitution
Chapter 16 Australia Butyric Acid Market Key Strategic Imperatives
- 16.1 Growth and Market Entry Priorities
- 16.2 High-Return Products and Segments
- 16.3 Pricing, Profitability and Cost Optimization
- 16.4 Technology Investment and Product Differentiation
- 16.5 Supply Chain Localization and Resilience
- 16.6 Distribution and Customer Acquisition
- 16.7 Partnership, Acquisition and Capacity Strategy
- 16.8 Regional Expansion Priorities
- 16.9 Short-, Medium- and Long-Term Actions
Chapter 17 Competition Outlook
- 17.1 Industry Competition Characteristics
- 17.2 Market Structure and Concentration
- 17.3 Market Share and Competitive Positioning, 2025
- 17.4 Company-Wise Revenue and Product Benchmarking
- 17.5 Production and Service Capacity Benchmarking
- 17.6 Technology, Pricing and Differentiation
- 17.7 Regional Footprint and Distribution Strength
- 17.8 Mergers, Acquisitions and Strategic Alliances
- 17.9 New Entrants and Competitive Threats
- 17.10 Porter's Five Forces and Industry Attractiveness
- 17.11 Competitive Outlook, 2025-2035
Chapter 18 Company Profiles
- 18.1 Company Coverage and Selection Criteria
- 18.2 Perstorp Holding AB
- 18.2.1 Business Description
- 18.2.2 Company Ownership and Geographic Presence
- 18.2.3 Product and Service Portfolio
- 18.2.4 Manufacturing and Operating Footprint
- 18.2.5 Production Capacity and Expansion Plans
- 18.2.6 Financial Performance and Investment
- 18.2.7 Market Share and Competitive Position
- 18.2.8 Technology and Innovation Capabilities
- 18.2.9 Strategic Alliances or Partnerships
- 18.2.10 Recent Developments
- 18.2.11 Growth Strategy and Outlook
- 18.3 Oxea GmbH
- 18.4 Eastman Chemical Company
- 18.5 Kemin Industries
- 18.6 Brenntag Australia
- 18.7 Other Relevant Market Participants
Note: Every listed company is profiled on the structure shown under the first company. The company list is preliminary and may change based on research findings, market developments, data availability and client requirements.
Chapter 19 Disclaimer
- 19.1 Research and Forecast Disclaimer
- 19.2 Data Source and Estimation Limitations
Note: The depth of individual sections depends on data availability for this market. Volume, capacity, trade and other unit-based metrics are included where applicable.

