
Career changers and employers fund intensive tech training
The Australia coding bootcamp market was valued at USD 86.5 million in 2025 and is projected to increase from USD 95.8 million in 2026 to USD 250.3 million by 2035, registering a CAGR of 11.26% during 2026–2035. Demand comes from career changers, early-career entrants and employed technical staff who buy short, intensive programs in software development, data science and AI, cybersecurity and UX/UI design, along with employers and state agencies that fund cohorts. New South Wales held the largest regional share, 30.9% in 2025, because Sydney hosts the largest technology workforce in the country and several provider campuses. Queensland is the fastest-growing region at 11.82% a year, as its technology workforce is projected to more than double by 2035. However, the provider mix changed in April 2026, when General Assembly stopped taking new consumer enrollments, which moved individual learners toward local specialists and university-partnered operators.
Which programs and fees does the estimate count?
The estimate counts tuition, employer contract fees, government training contract payments and placement fees earned by providers of short, intensive programs that prepare learners for software development, data science and AI, cybersecurity and UX/UI design roles. Programs run full-time, part-time or as custom enterprise cohorts, and they are delivered live online, in person or in hybrid formats across Australian states and territories.
The estimate excludes self-paced video courses without live instruction, university degrees, TAFE certificate courses taught outside intensive formats and in-house employer training. The value chain links curriculum designers, instructors, career coaches and hiring partners, while state agencies, employers and income-contingent loan schemes help many learners pay for their programs.
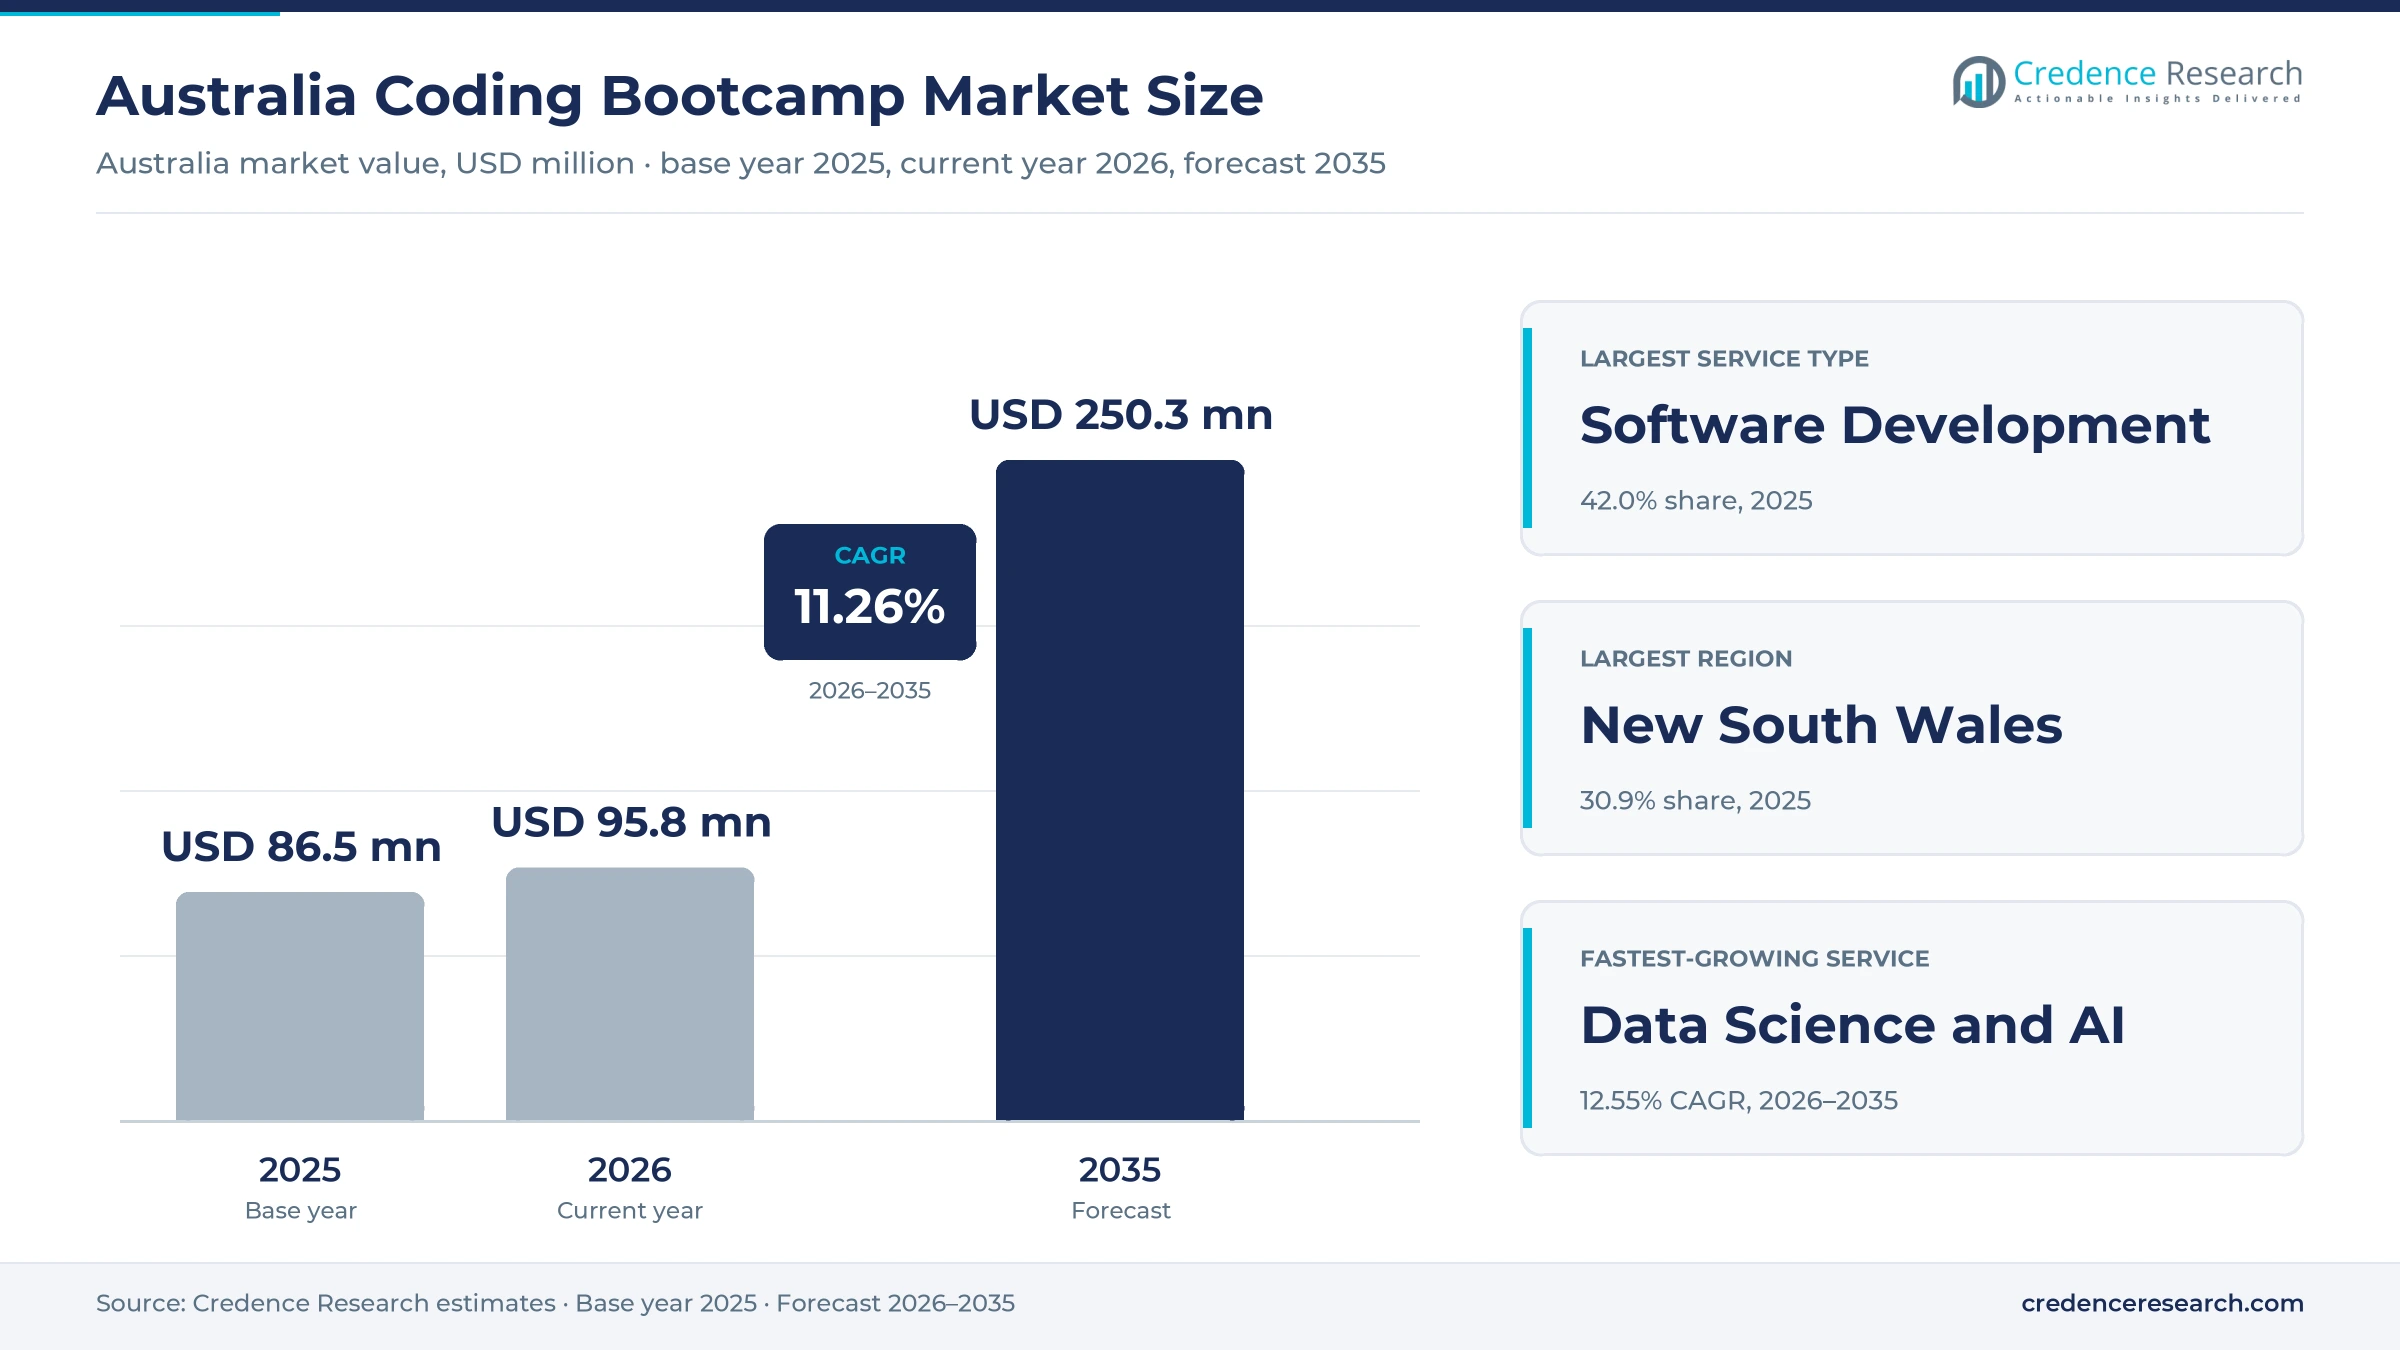
Australia Coding Bootcamp Market Insights
- The Australia coding bootcamp market was valued at USD 86.5 million in 2025 and is projected to reach USD 250.3 million by 2035, registering a CAGR of 11.26% during 2026–2035.
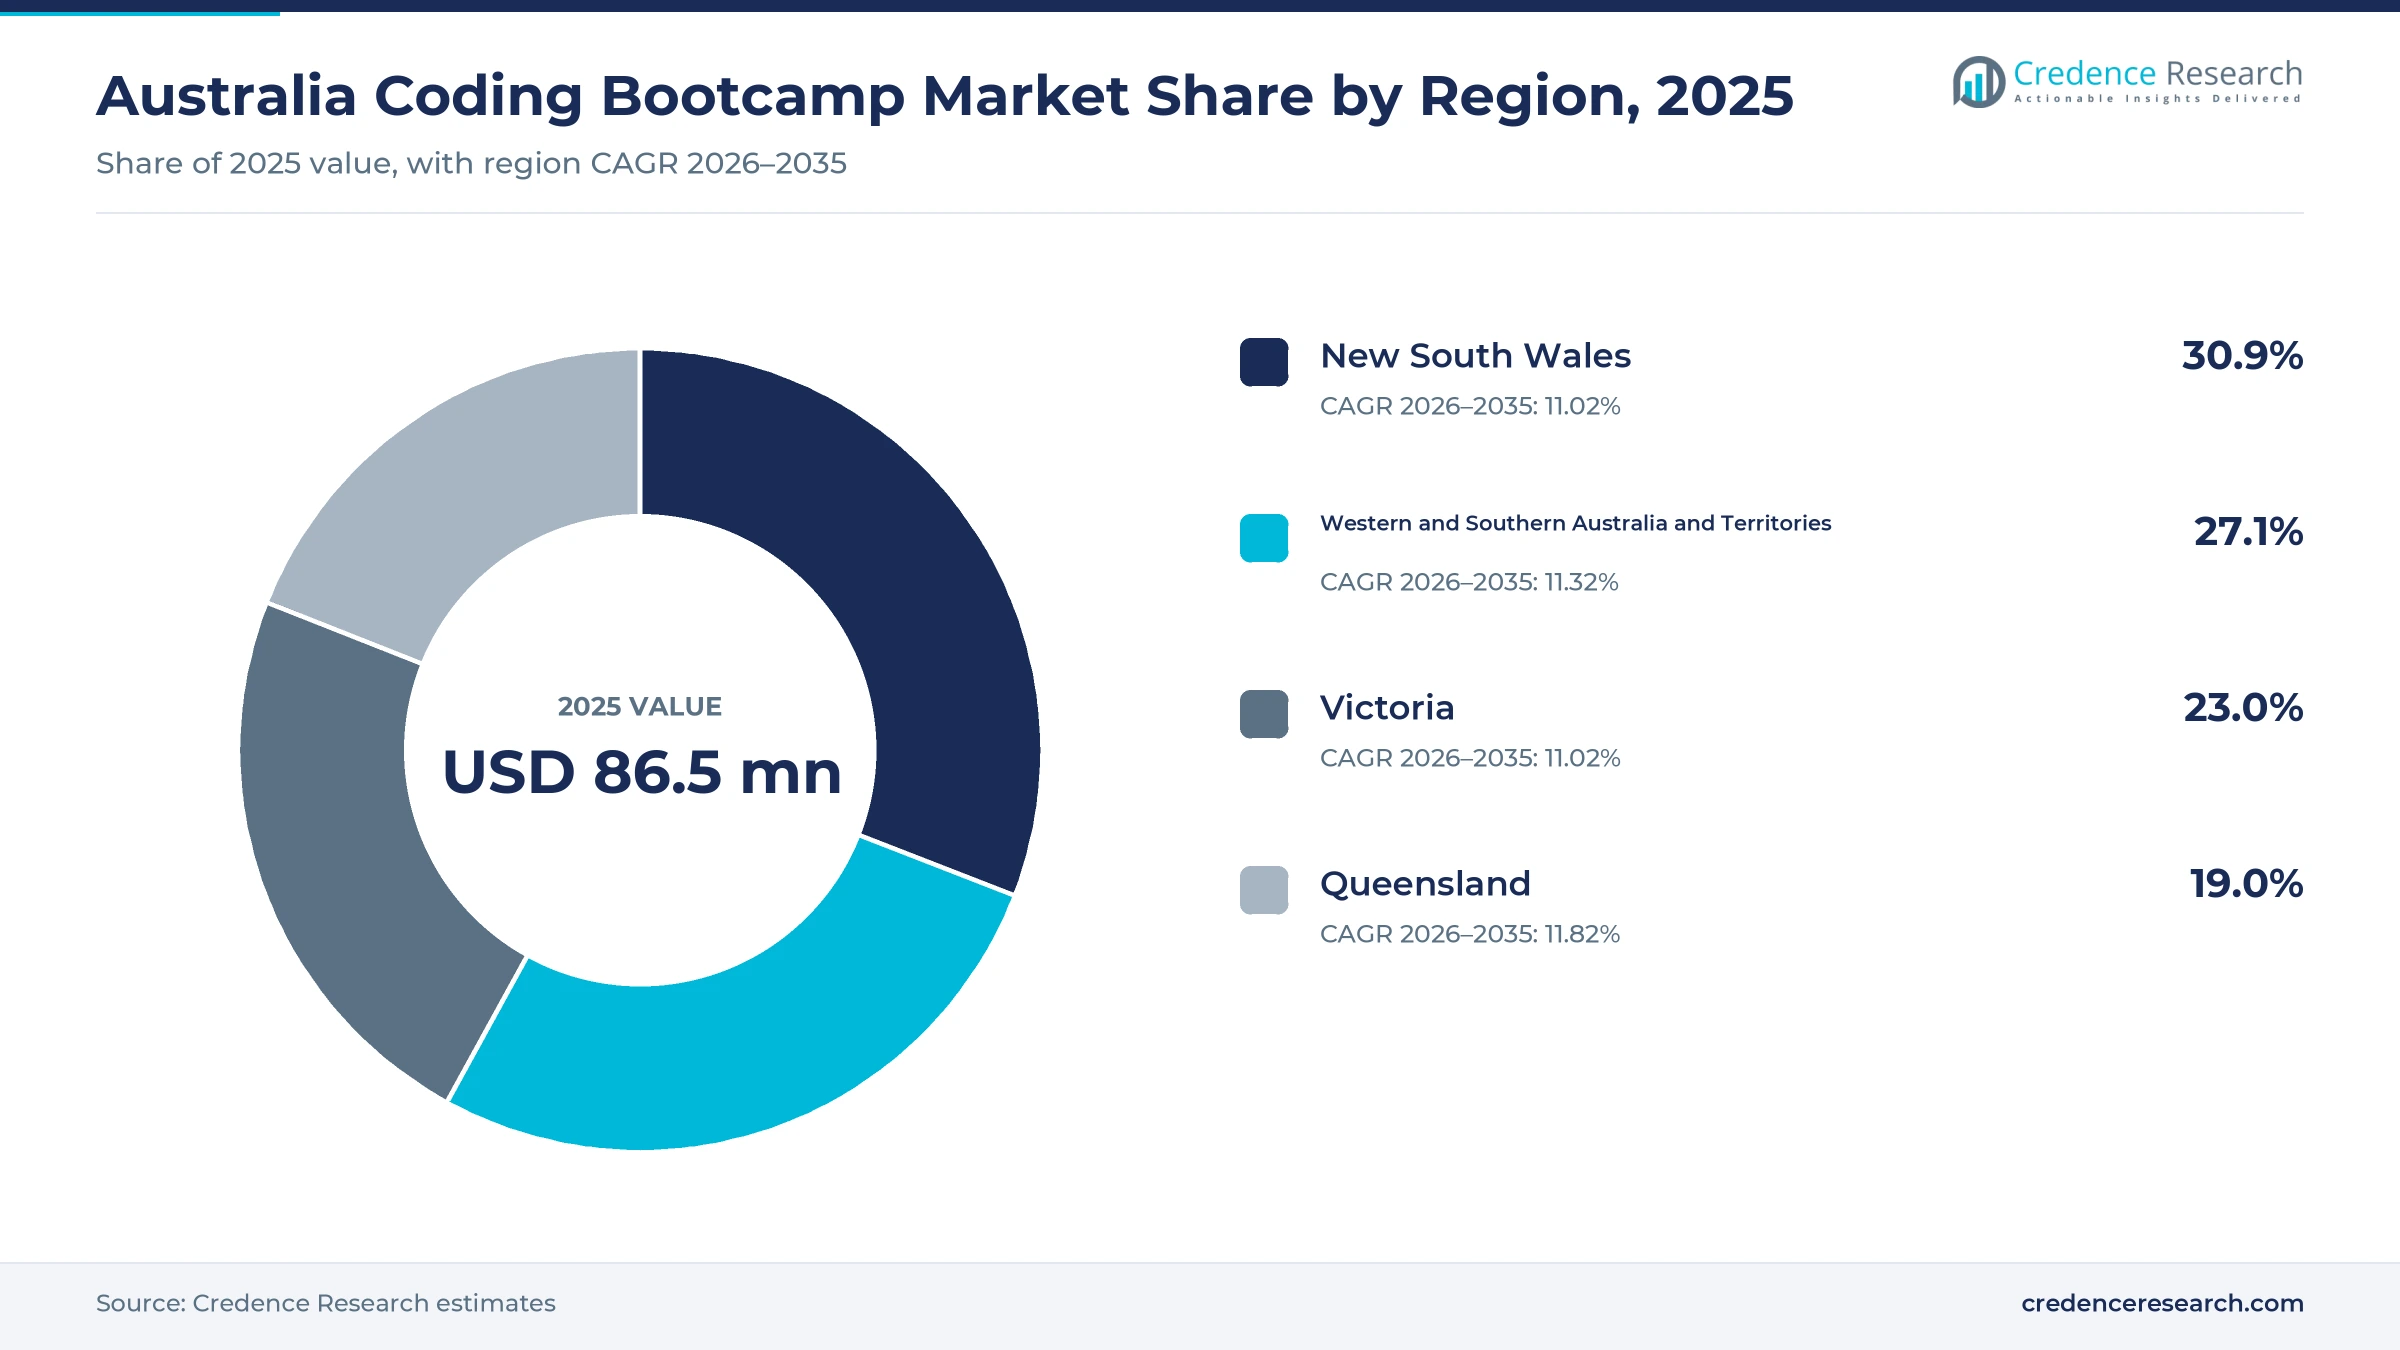
- New South Wales held a 30.9% share of 2025 value, because Sydney employs the largest technology workforce in the country and hosts several provider campuses.
- Software Development led service types with a 42.0% share of 2025 value, because web and software programs remain the first entry route most career changers choose.
- The national technology workforce fell 0.3% to about 967,000 in 2025, its first recorded decline, which pushes providers toward AI, data and cybersecurity curricula.
- Employer Contracts grow fastest at 12.52% a year during 2026–2035, as companies fund custom cohorts and alternative pathway hiring targets spread across states.
Software programs lead while data and AI grow fastest
Why do software programs still earn the largest fee pool?
Based on service type, the market is categorized into software development, data science and AI, cybersecurity and UX/UI design. Software Development led with a 42.0% share of 2025 value, because full-stack web programs remain the most common entry route for career changers. Data Science and AI grows fastest at 12.55% a year, as employers ask for machine learning, analytics and generative AI skills in new hires.
Which learners pay for most intensive programs?
Based on learner segment, the market is categorized into career changers, early-career entrants and employed technical professionals. Career Changers led with a 52.0% share of 2025 value, because many adults retrain after years in non-technical roles. Employed Technical Professionals grow fastest at 12.39% a year, as engineers and analysts add AI and security skills while staying in their current jobs.
Why does live online delivery reach the most learners?
Based on delivery model, the market is categorized into live online, in-person and hybrid delivery. Live Online led with a 46.0% share of 2025 value, because it lets learners outside Sydney and Melbourne join instructor-led cohorts. Hybrid grows fastest at 11.95% a year, as providers pair online classes with campus project days and employer showcases.
How do employer contracts change provider revenue?
Based on revenue model, the market is categorized into individual tuition, employer contracts, publicly funded training contracts and placement fees. Individual Tuition led with a 55.0% share of 2025 value, because most career changers still pay fees themselves or through payment plans. Employer Contracts grow fastest at 12.52% a year, as companies commission custom cohorts to reskill existing staff.
| Segment Group | Leading Sub-segment | Share, 2025 | Fastest-growing Sub-segment | CAGR, 2026–2035 |
|---|---|---|---|---|
| By Service Type | Software Development | 42.0% | Data Science and AI | 12.55% |
| By Learner Segment | Career Changers | 52.0% | Employed Technical Professionals | 12.39% |
| By Delivery Model | Live Online | 46.0% | Hybrid | 11.95% |
| By Revenue Model | Individual Tuition | 55.0% | Employer Contracts | 12.52% |
Request a Free Sample
Fill in your details and we'll send you a free sample report.
- Sample data tables & charts
- Research methodology
Career moves, flexible formats and AI skills lift demand
How does career transition demand sustain enrollments?
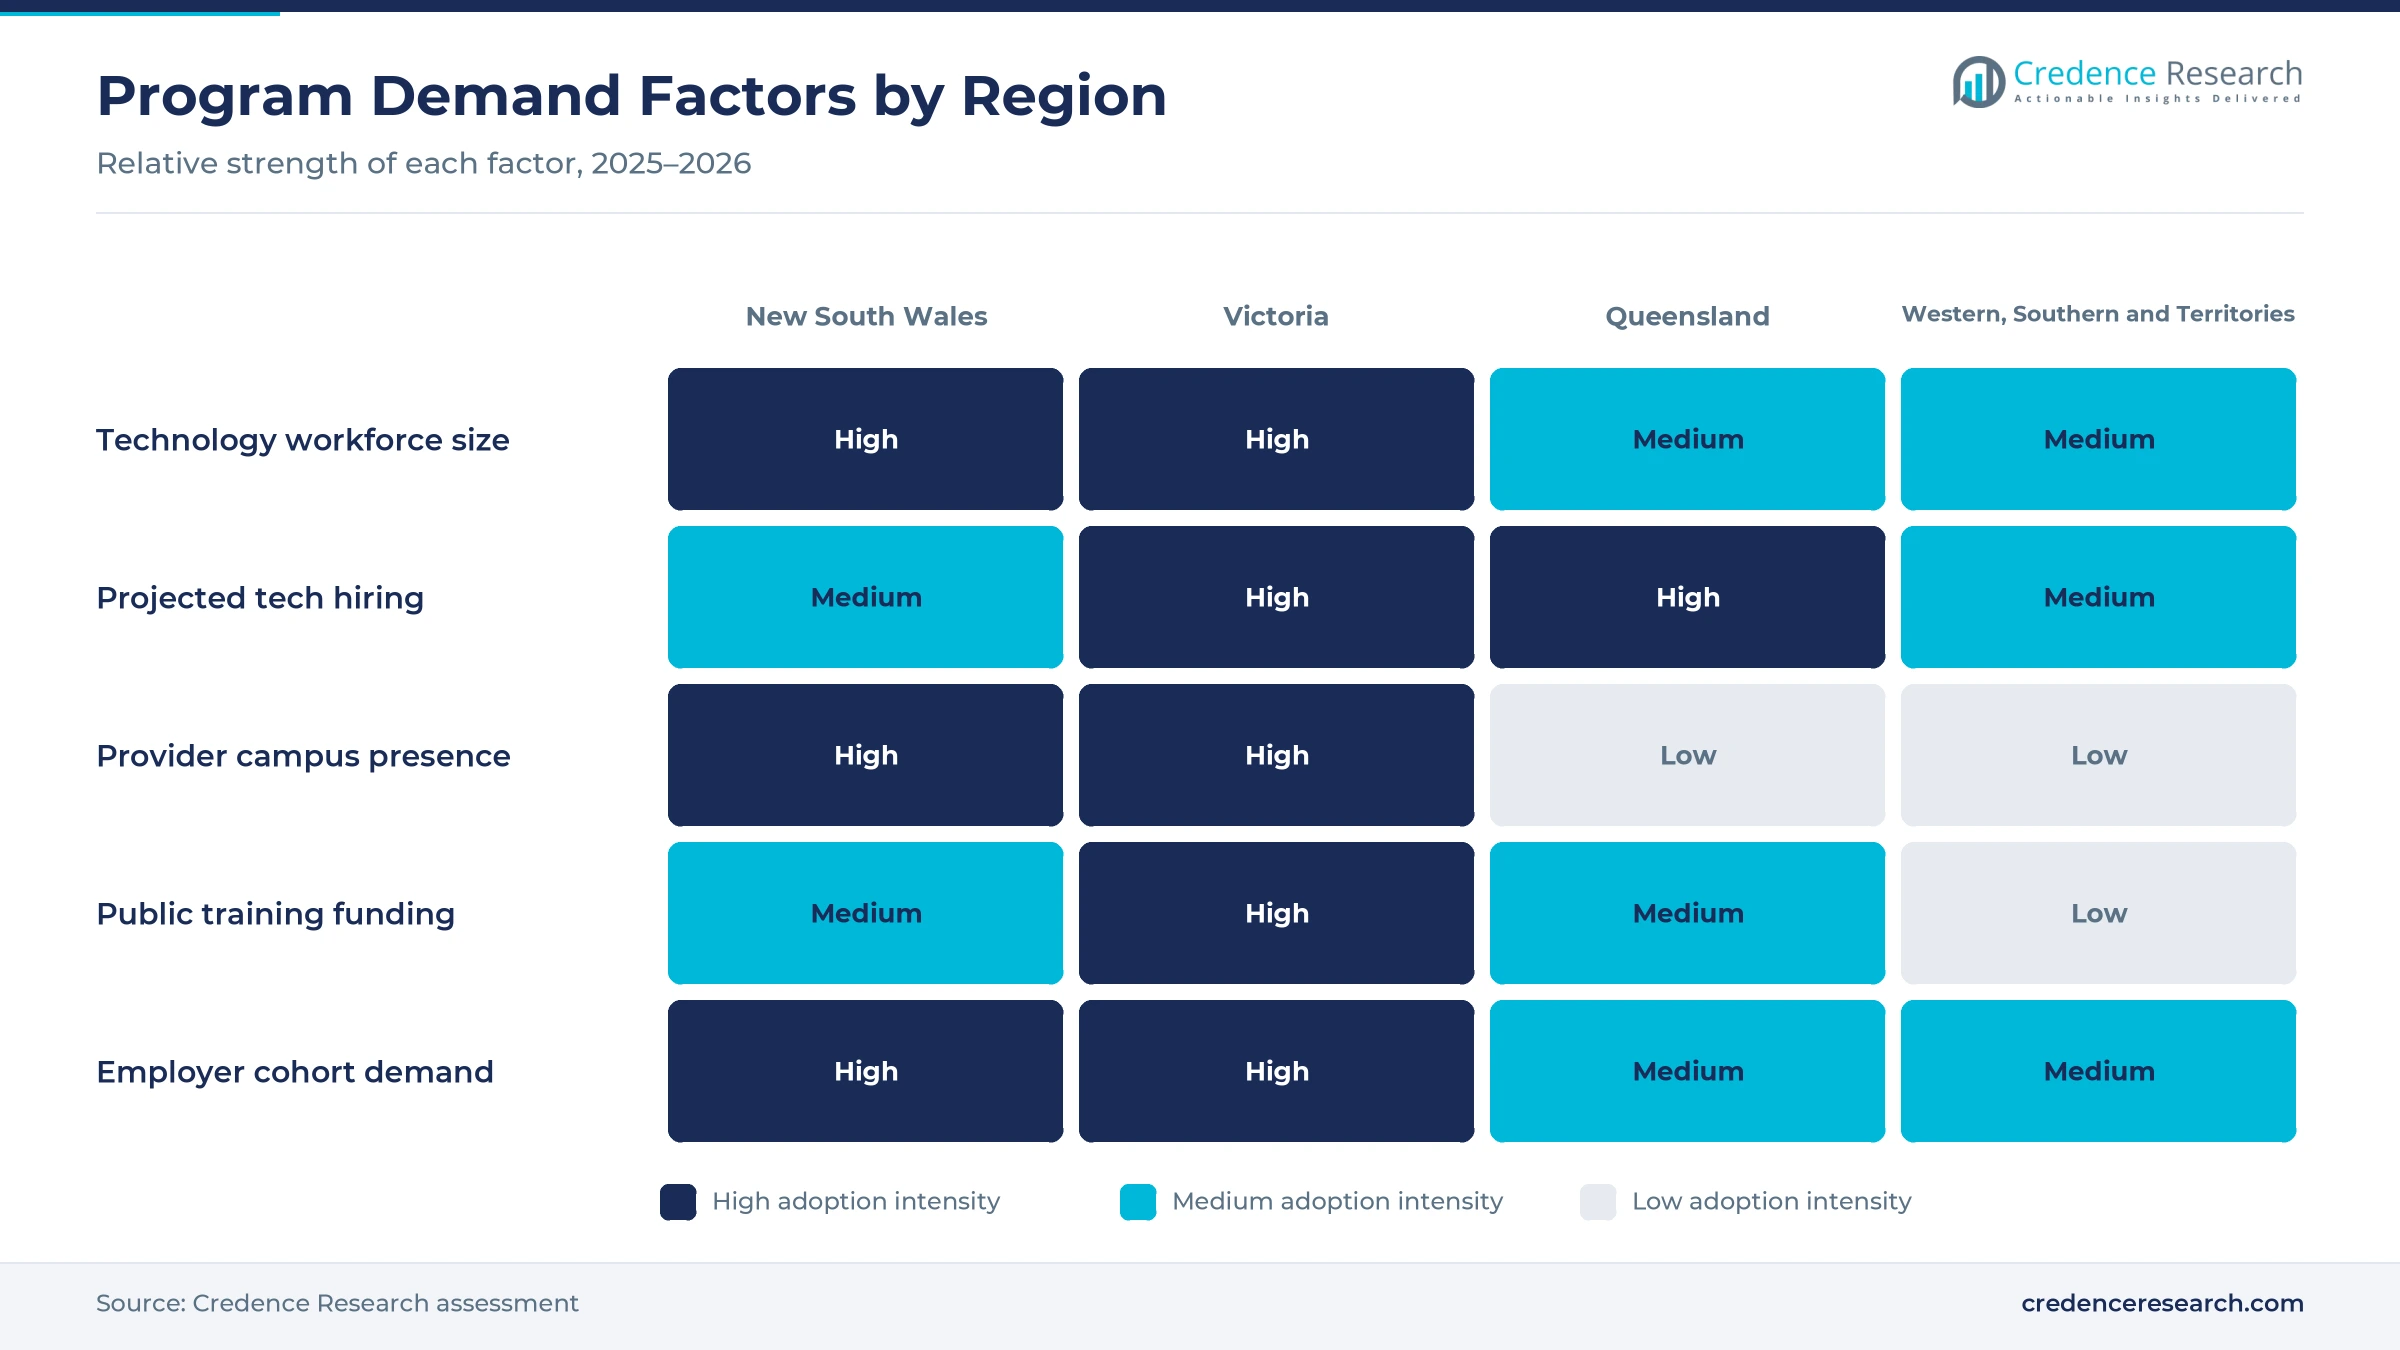
Roughly two in five new technology workers now arrive from other occupations rather than straight from university, which keeps a steady pool of adults shopping for retraining. About 40% of technology workforce entrants over the past five years came through alternative pathways, according to the Australian Computer Society. The same release says the national technology workforce fell 0.3% to about 967,000 in 2025, yet the country will need 259,000 additional technology workers by 2035. New South Wales' Digital Skills and Workforce Compact, launched in November 2023, asks employers to source 20% of entry-level digital hires through alternative pathways by 2030. As a result, career changers lead learner segments with 52.0% of 2025 value.
Why does flexible intensive delivery widen the buyer pool?
Many adults cannot leave paid work for three months of full-time study, so providers with part-time and online schedules reach a much larger group of buyers. Le Wagon runs its 400-hour Software & AI and Data Science & AI programs in Sydney and Melbourne as 10-week full-time or six-month part-time courses, with live classes on site or online. Institute of Data offers 12-week or 24-week formats with remote or in-person attendance through its university partners. Internet use reached about 96% of the population in 2024, according to the World Bank, which supports live online cohorts far from capital cities. In turn, live online delivery leads with 46.0% of 2025 value, while hybrid formats grow fastest.
How does applied data and AI teaching lift program value?
Employers now expect new hires to use machine learning, data science platforms and generative AI assistants in daily work, which raises the value of programs that teach these tools. About 70% of technology-worker time is affected by AI, yet only 7% of Australians demonstrate advanced AI literacy, according to the Australian Computer Society. The federal government released its National AI Plan on Dec. 2, 2025, directing more than A$460 million in existing programs toward AI research, innovation and workforce development. Coder Academy now pairs its data program with an accredited Higher Education Diploma of Data Science that runs for 10 months. As a result, data science and AI grows at 12.55% a year, the fastest service type during 2026–2035.
Why does the cyber workforce gap add new cohorts?
Employers and agencies still struggle to fill security roles even as general software hiring cools, which sends more learners and employer cohorts toward cyber programs. Cybersecurity engineers and cybersecurity operations coordinators remained in national shortage on the 2025 Occupation Shortage List, according to Information Age. Governance, risk and compliance specialists were in shortage in every jurisdiction except the Northern Territory, up from only New South Wales and Victoria a year earlier. A Nov. 12, 2025, Australian Computer Society release also estimates that the country will need 54,000 additional cyber professionals by 2030. In turn, cybersecurity programs grow faster than the market average, and Institute of Data teaches security courses with university partners in Sydney and Perth.
AI curricula and employer cohorts reshape providers
How is the shift to AI-native curricula reshaping programs?
Providers now rebuild software and data courses around AI assistants and model deployment rather than basic syntax. Le Wagon markets its core 400-hour web program as Software & AI, and its Sydney and Melbourne pages add a 200-hour Data Engineering course and 40-hour AI Product Builder and AI & Data Automation courses. Academy Xi lists AI Engineering courses at introductory, intermediate and advanced levels next to its software, data and design programs. The federal AI microskills program, announced in December 2025 by the National AI Centre with TAFE NSW, aims to give more than one million Australians free AI training. As a result, providers compete on applied projects rather than basic syntax, which keeps data science and AI ahead of other service types on growth.
Why is the rise of employer-funded cohorts changing revenue?
Companies often prefer to reskill existing staff than compete for scarce experienced hires, which moves provider revenue toward employer contracts. About 43% of New South Wales technology workers were reskilled into a technology role within their existing organization, according to the Australian Computer Society. General Assembly ceased new consumer enrollments on April 28, 2026, and is concluding consumer courses through a teach-out, according to its regulatory notice. Academy Xi also sells custom skills academies, workshops and pre-purchased training credits to organizations. In turn, employer contracts grow at 12.52% a year, the fastest revenue model during 2026–2035.
Can state-funded digital skills programs open new contracts?
Governments pay providers to retrain workers for local employers, which makes state agencies an important buyer group. Victoria's A$64 million Digital Jobs program combined 12 weeks of training with a 12-week internship, and host businesses received a A$5,000 wage subsidy per intern, according to a Nov. 10, 2021, release from the Premier of Victoria. Academy Xi says it partnered with the program to train 5,000 mid-career Victorians in front-end web development. The program now offers free training in AI, cybersecurity and data analytics to manufacturing and construction firms with fewer than 200 employees. As a result, publicly funded contracts remain a steady revenue source, especially in corporate upskilling for small firms.
Is there room to grow in Queensland's expanding tech base?
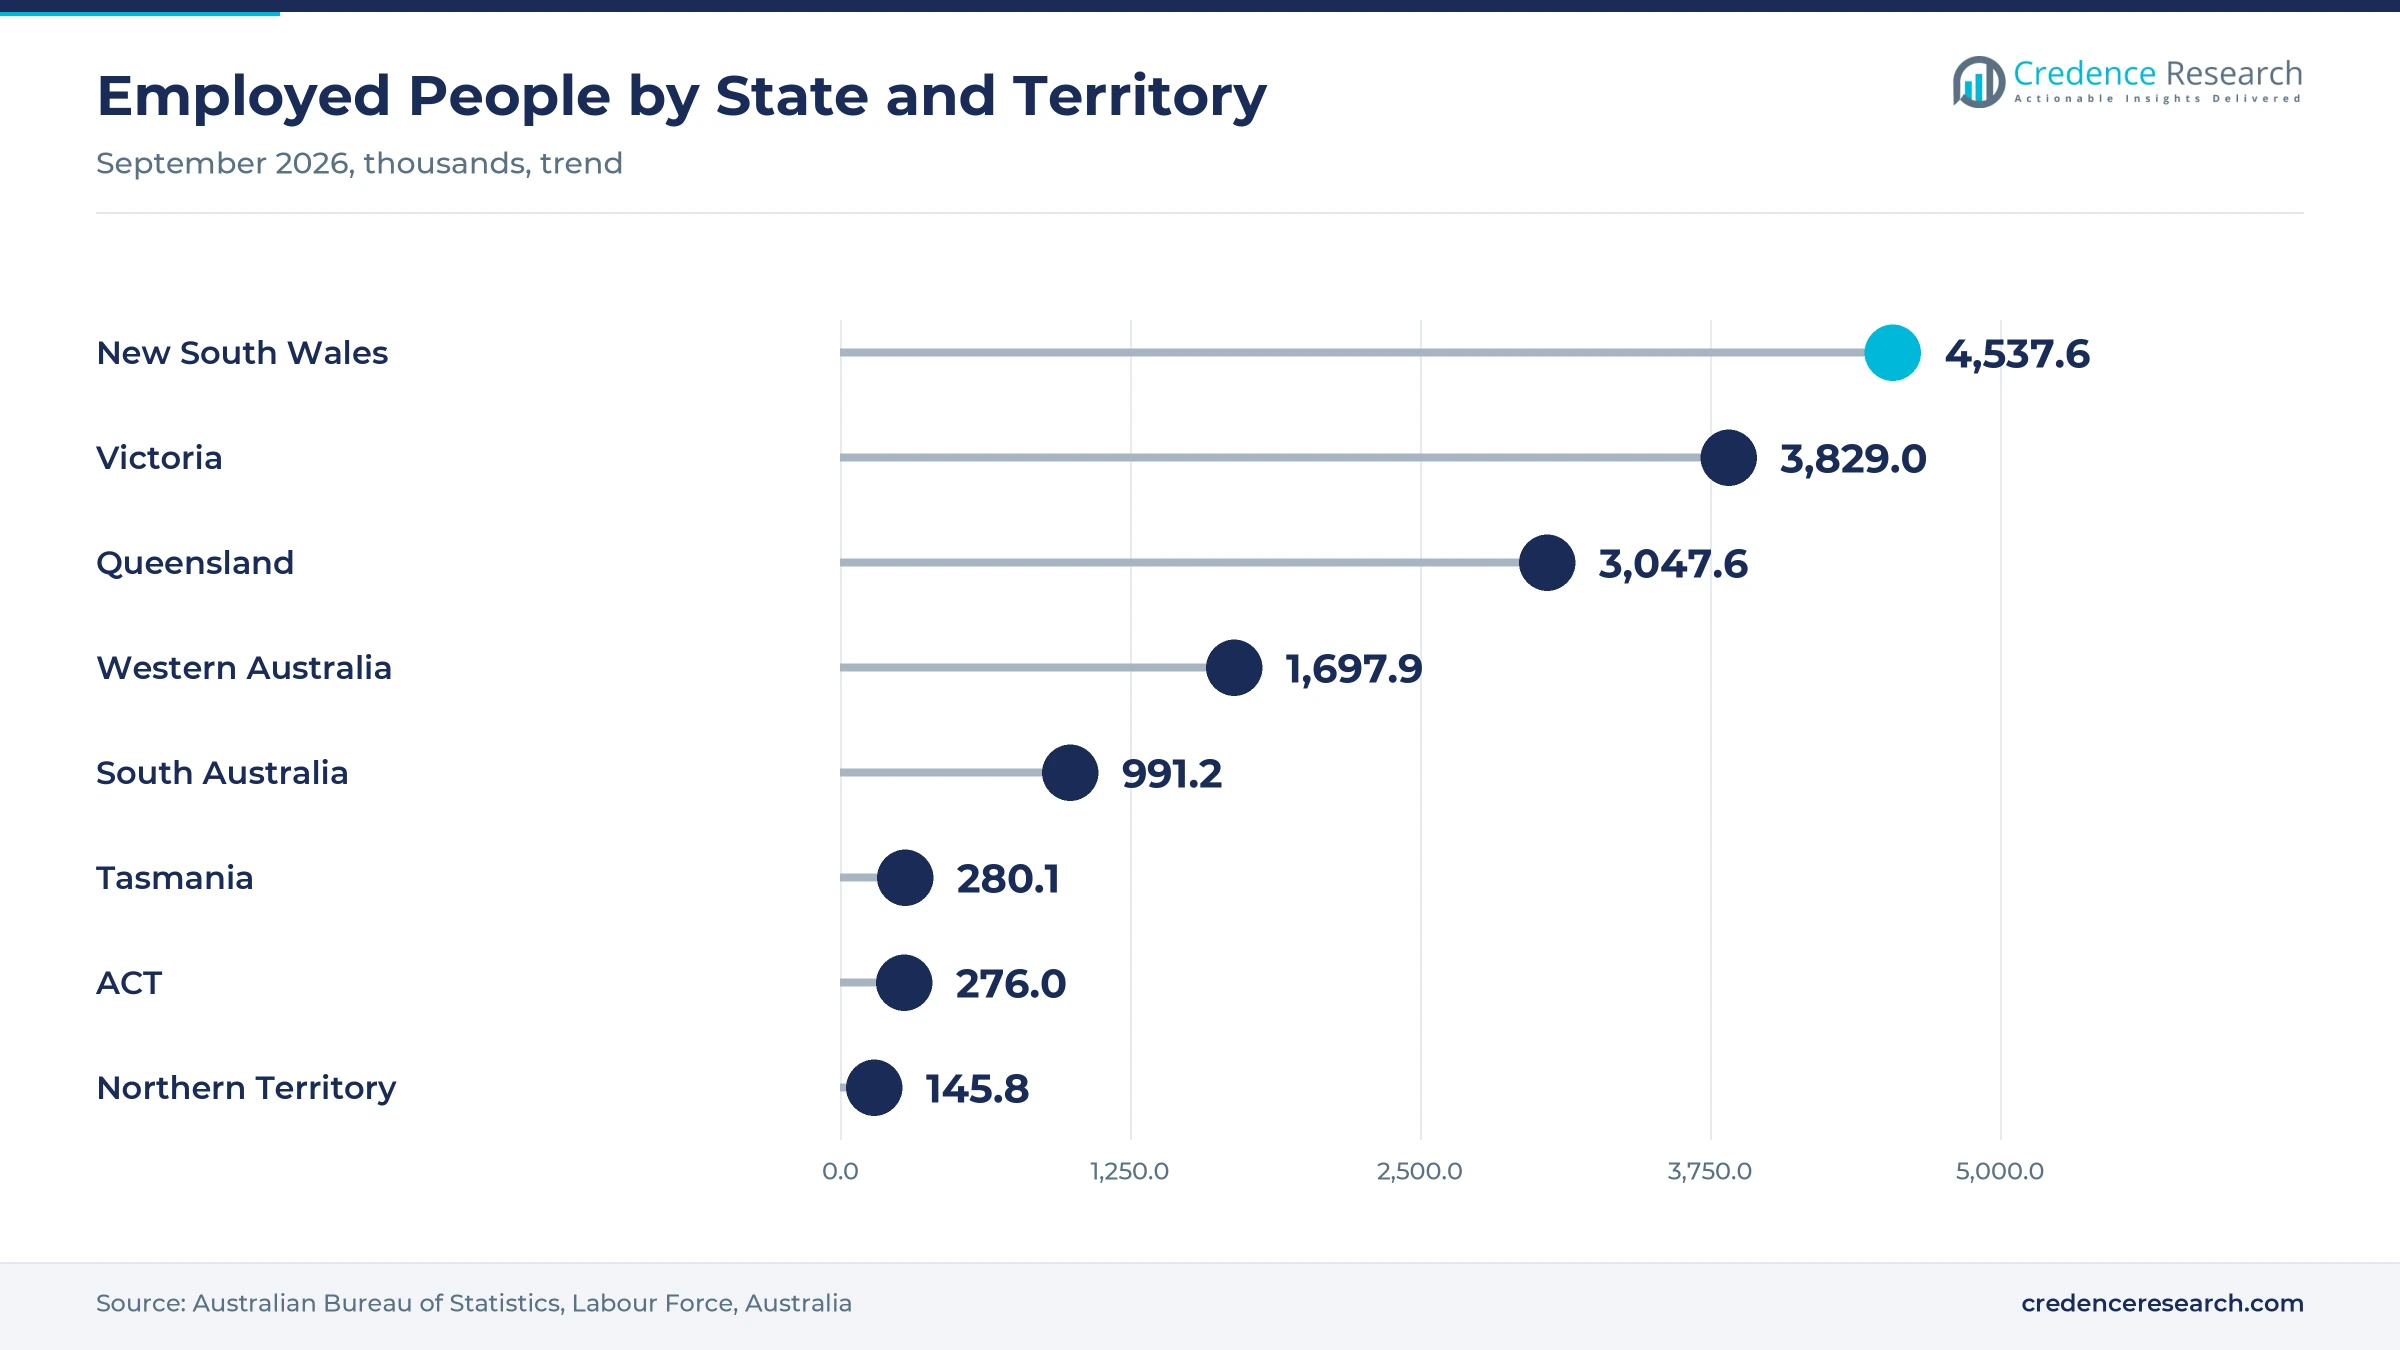
Queensland needs far more skilled technology workers than local universities alone can supply, which leaves a large opening for short programs. Its technology sector employs around 159,000 workers and contributes about A$15 billion to the state economy, according to a Nov. 12, 2025, Australian Computer Society release. The same release projects 201,800 additional technology roles by 2035, which could lift the state workforce above 360,000. Total employment in Queensland reached about 3.05 million people in September 2026, according to the Australian Bureau of Statistics, the third largest of any state. As a result, Queensland is the fastest-growing region in this report, as providers add online cohorts and employer partnerships in Brisbane.
Cooler junior hiring and degree filters slow placements
How does cooler junior software hiring weigh on demand?
Software engineers were not in shortage in any state or territory on the 2025 list, the first time since the study began in 2021, which cools junior developer hiring. As a result, career changers face more competition for entry-level developer roles, and some delay enrolling in web programs. Providers respond by adding AI, data and security modules and by building stronger hiring partnerships. This pressure mainly hits software development, the largest service type in the market.
Why do degree requirements limit graduate placements?
About 88% of technology job ads still ask for a university degree, according to a Nov. 12, 2025, Australian Computer Society release, which limits placements for graduates of short programs. In turn, graduates without degrees can struggle to pass automated screening, even with strong project portfolios. Providers respond with accredited diplomas, employer hiring partnerships and alternative pathway targets such as the New South Wales compact. This barrier eases slowly as more employers adopt skills-based hiring.
How do tuition costs and time pressure deter learners?
Full-time programs require months away from paid work and fees that many adults cannot pay upfront, which deters many potential learners. Workers surveyed in Victoria cited time pressure at 43% and training cost at 36% as barriers to upskilling, according to CFOtech Australia. Providers respond with part-time schedules, payment plans and income-contingent loans where diplomas qualify for VET Student Loans or FEE-HELP. This challenge favors providers that hold accredited courses with loan eligibility.
How does provider consolidation unsettle learners?
A provider wind-down can leave students and employers unsure about course quality, support and credentials, which makes buyers more cautious. General Assembly's decision to stop new consumer enrollments in April 2026 removed one of the best-known global brands from the individual learner market. As a result, learners now check accreditation, placement records and financial backing more closely before enrolling. Providers respond by publishing outcomes, such as Coder Academy's statement that 80% of eligible graduates in fiscal 2024 were placed or employed immediately after their programs.
New South Wales leads while Queensland grows fastest
| Region | Value, 2025 (USD million) | Share, 2025 | CAGR, 2026–2035 |
|---|---|---|---|
| New South Wales | 26.7 | 30.9% | 11.02% |
| Western and Southern Australia and Territories | 23.4 | 27.1% | 11.32% |
| Victoria | 19.9 | 23.0% | 11.02% |
| Queensland | 16.4 | 19.0% | 11.82% |
What makes Sydney the main hub for providers?
New South Wales held a 30.9% share of 2025 value and grows at 11.02% a year, because Sydney hosts the largest technology workforce and a dense cluster of campuses. The state had 352,800 technology workers in 2025, and demand that year included 38,800 programming and software roles and 20,100 data and analytics roles. Le Wagon, Coder Academy and Institute of Data, through its University of Technology Sydney partnership, all teach in Sydney. As a result, the state combines strong individual tuition with large employer cohorts.
Where does state retraining money matter most?
Victoria held a 23.0% share of 2025 value and grows at 11.02% a year, because Melbourne hosts a large technology workforce and campuses run by Le Wagon and Coder Academy. The state employed about 300,400 technology workers in 2025, according to CFOtech Australia, and 94% of them were upskilling. The state's Digital Jobs program has funded retraining since 2021, which gives publicly funded contracts a larger role in Victoria than in other zones. In turn, enrollment volumes there depend partly on state budget decisions.
What lifts provider growth around Brisbane?
Queensland held a 19.0% share of 2025 value and grows fastest at 11.82% a year, because its technology workforce is projected to more than double by 2035. The Australian Computer Society counts about 159,000 technology workers in the state and projects 201,800 additional roles over the next decade. Most provider campuses sit in Sydney and Melbourne, so Queensland learners often rely on live online cohorts and employer-run programs. As a result, online and hybrid formats are central to provider growth in Queensland over the forecast period.
Which employers drive demand across the western zone?
Western and Southern Australia and Territories held a 27.1% share of 2025 value and grow at 11.32% a year. Western Australia employed about 1.70 million people in September 2026, while South Australia employed about 991,200, according to the Australian Bureau of Statistics. Institute of Data teaches data science, cybersecurity and software engineering with Curtin University at its Bentley campus in Western Australia. In turn, resources and public-sector employers create steady demand for data and security cohorts across the zone.
Hiring compacts, AI policy and provider exits in focus
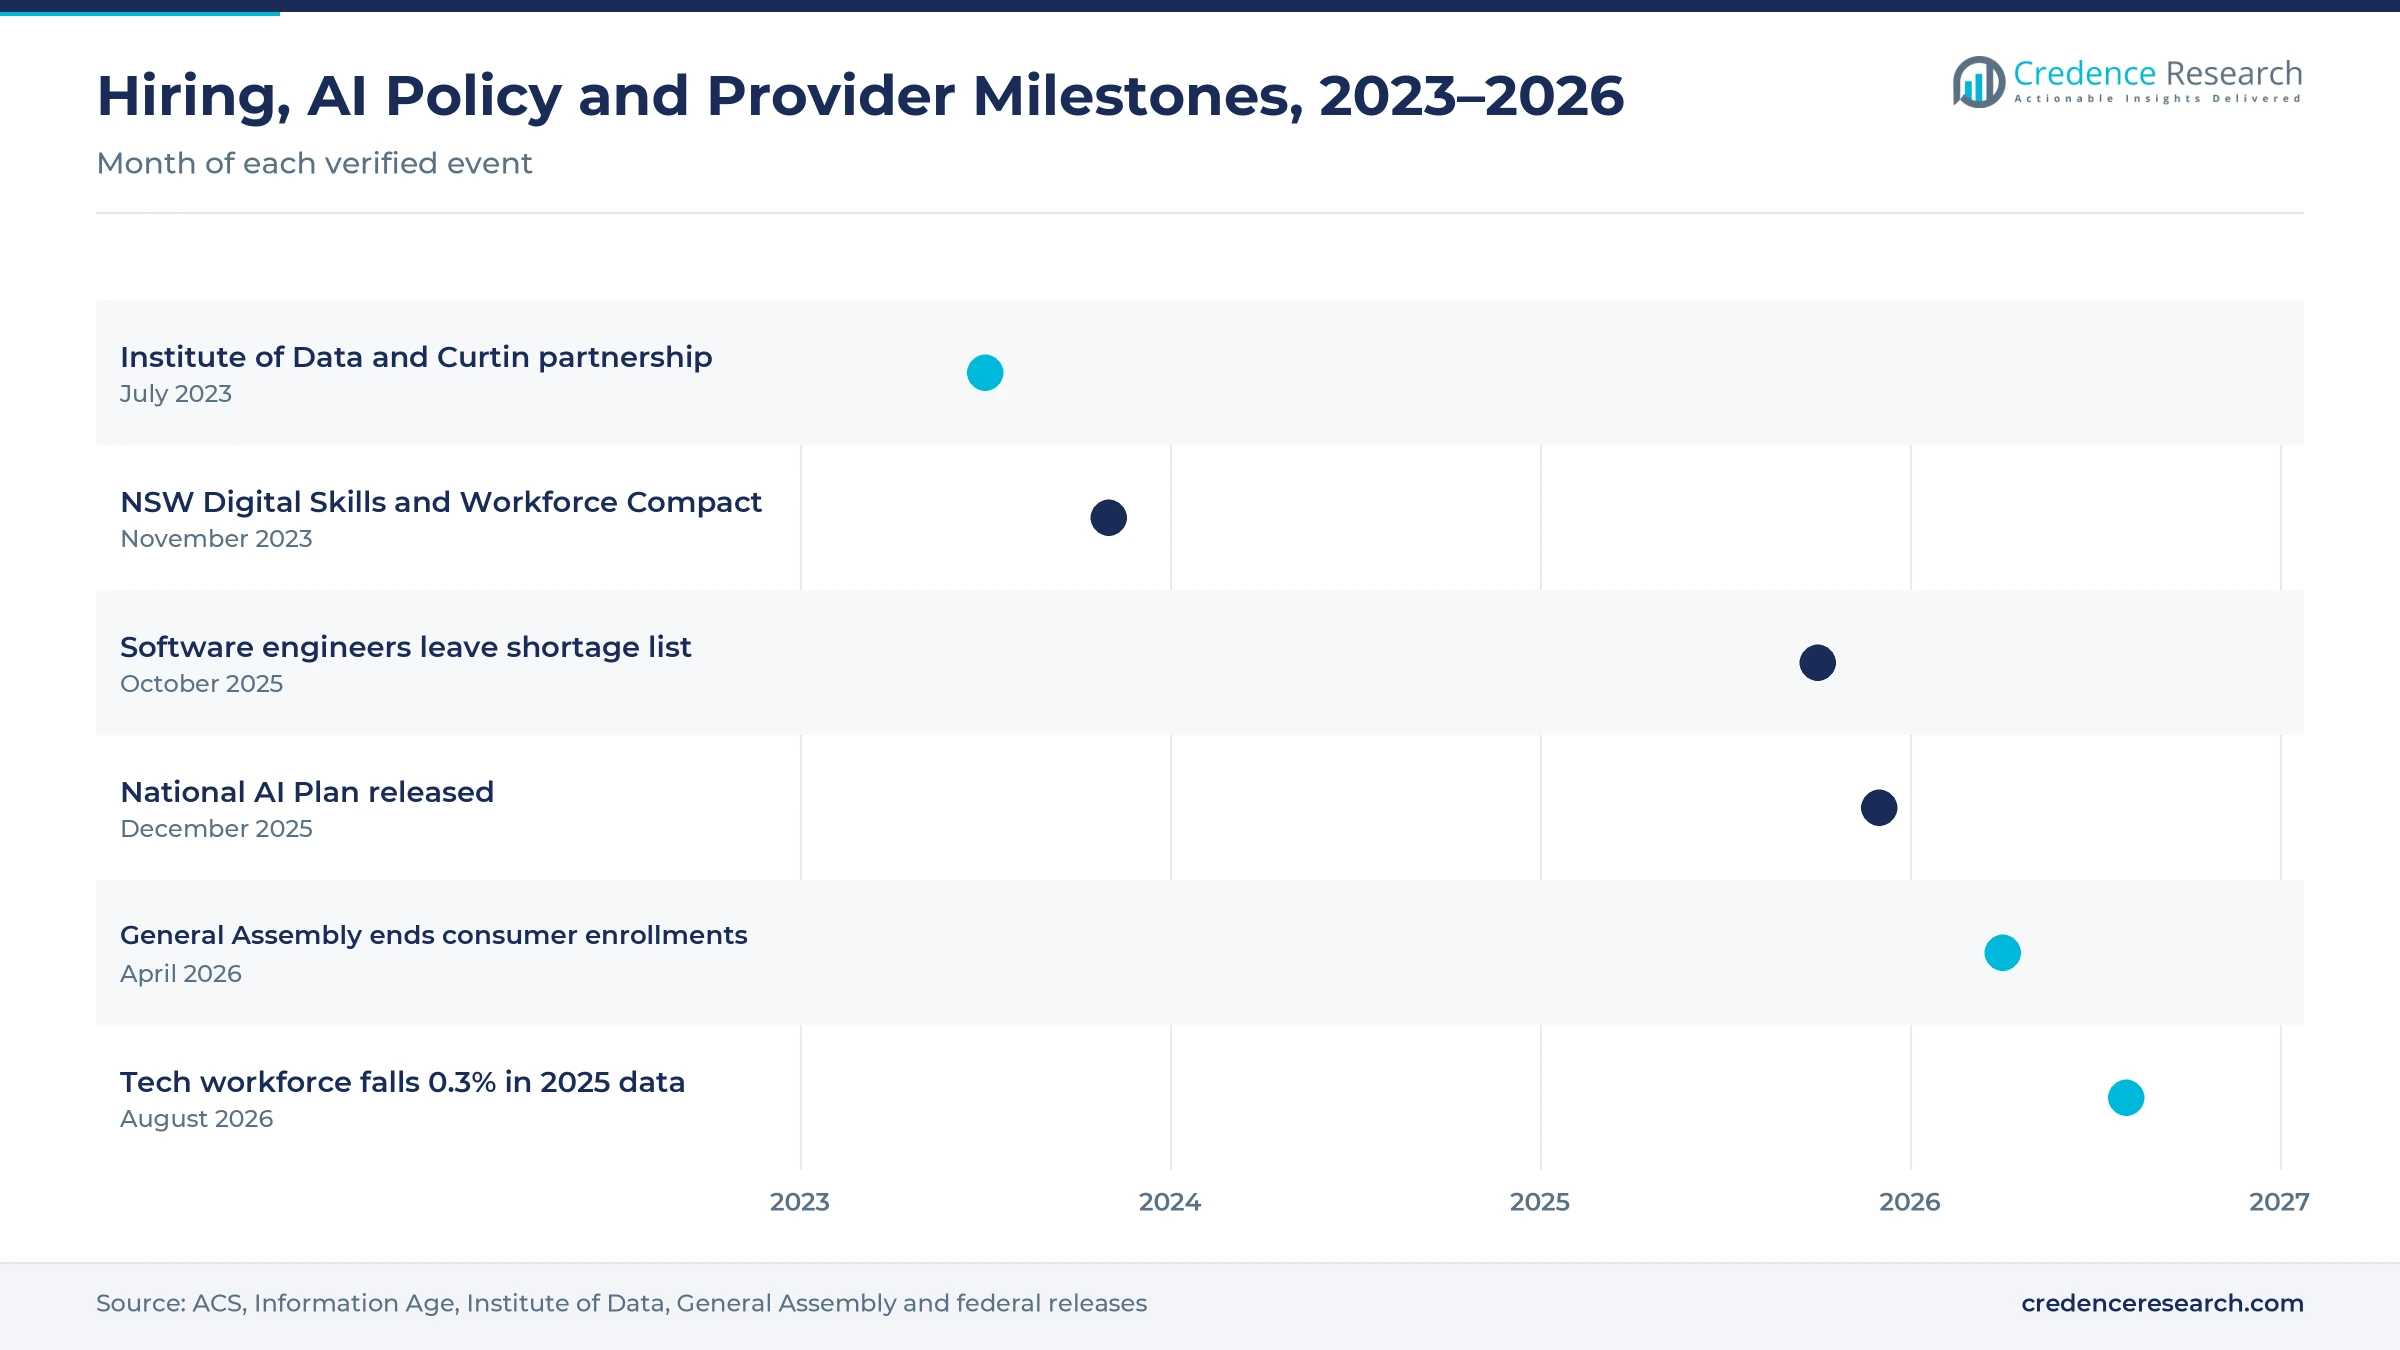
| Development | Status and market relevance |
|---|---|
| In July 2023, Institute of Data formed a partnership with Curtin University to deliver data science, cybersecurity and software engineering programs in Western Australia. | Added university-partnered capacity in Perth |
| In November 2023, New South Wales launched the Digital Skills and Workforce Compact, asking employers to source 20% of entry-level digital hires through alternative pathways by 2030. | Supports hiring of graduates from short programs |
| In October 2025, the national Occupation Shortage List removed software engineers from shortage while cybersecurity engineers stayed in national shortage. | Shifted learner demand toward security skills |
| In December 2025, the federal government released the National AI Plan, and free AI microskills training for more than one million Australians followed. | Raised demand for applied AI training |
| In April 2026, General Assembly ceased new consumer enrollments and began a teach-out for enrolled students. | Moved individual learners toward local providers |
Live classrooms and AI tools shape daily teaching
- Live virtual classrooms let instructors run cohort teaching, pair programming and code reviews in real time, which supports learners across states and time zones.
- Cloud development environments give each learner a ready workspace with databases and deployment tools, which cuts setup time and lets cohorts start building on the first day.
- AI coding assistants help learners write, test and explain code, which pushes providers to teach prompt design, code review and model integration alongside core syntax.
- Portfolio and capstone platforms record projects, version histories and demo videos, which give employers evidence of skills beyond a certificate during screening.
Need a Custom Version of This Report?
Tailor the scope, geography, or segments to your exact requirements.
- Custom geography or segment scope
- Direct access to our analyst team
Local specialists and university partners compete
Competition combines independent specialists, diversified private training groups and university-partnered operators that differ in accreditation, format and employer reach. Le Wagon runs Sydney and Melbourne campuses with 400-hour software, data science and data analytics programs in full-time or part-time formats. Coder Academy, a trading name of a registered higher education provider, links its programs to accredited diplomas and is an approved VET Student Loan and FEE-HELP provider. Institute of Data partners with universities such as the University of Technology Sydney and Curtin University to deliver 12-week or 24-week programs. Academy Xi sells online design, data, cybersecurity, software and AI courses, along with custom academies for employers. General Assembly stopped taking new consumer enrollments on April 28, 2026, and is teaching out its remaining consumer students. Rivals compete on accreditation, graduate outcomes, employer partnerships and price.
Which providers shape intensive tech training?
| Company | Type | Role in the market |
|---|---|---|
| Le Wagon | Independent bootcamp specialist | Runs Sydney and Melbourne campuses with live online options |
| Coder Academy | Accredited private provider | Links programs to higher education diplomas with FEE-HELP |
| Institute of Data | University-partnered operator | Delivers programs with UTS and Curtin University |
| Academy Xi | Independent bootcamp specialist | Sells online courses and custom employer academies |
| General Assembly | Global training operator | Ended new consumer enrollments in April 2026 |
Credence Research view on intensive tech training
Credence Research's view is that Australian intensive technology training will keep growing because employers need AI, data and security skills faster than degree programs can supply them. Software programs remain the largest fee pool, yet cooler junior developer hiring means growth now comes from data science and AI, cybersecurity and employer-funded cohorts. Providers with accredited courses, loan eligibility and strong hiring partners should gain share as learners grow more careful after the General Assembly consumer exit.
How the program fee estimate was built
The report uses 2025 as the base year on a calendar basis, and market values come from the Credence Research model. That model combines professional body workforce data, national labor force and internet use statistics, occupation shortage findings, government program releases and provider course pages. Zone shares, zone growth rates and segment splits are Credence Research estimates built from workforce and employment data. Sources used are government, statistical agency, professional body, regulator and company publications, and no interviews or surveys were used.
Employer funding and AI skills drive growth to 2035
The Australia coding bootcamp market is expected to reach USD 250.3 million by 2035, an 11.26% CAGR during 2026–2035, as career changers, employers and state agencies keep funding short routes into technology roles. Growth should be strongest in data science and AI, employer contracts and Queensland, because these areas gain most from AI adoption and new hiring. Local providers are likely to follow the employer-led model now visible in global immersive tech training, while degree filters and cooler junior hiring could slow placements.
Frequently Asked Questions
How big is the Australia coding bootcamp market?
Which service type leads program revenue?
Which region leads the market?
How many technology workers does Australia have?
Are software engineers still in shortage in Australia?
What happened to General Assembly in 2026?
Who are the leading companies in the market?
What are the main challenges for providers?
Table of Content
Chapter 1 Market Segmentation
- 1.1 Segmentation Framework
- 1.1.1 Product and Service Classification
- 1.1.2 Application and End-Use Classification
- 1.1.3 Technology and Solution Classification
- 1.1.4 Customer and Distribution Channel Classification
- 1.1.5 Geographic Segmentation
- 1.1.6 Market Segment Definitions and Boundaries
- 1.2 By Service Type
- 1.2.1 Software Development
- 1.2.2 Data Science and AI
- 1.2.3 Cybersecurity
- 1.2.4 UX/UI Design
- 1.3 By Learner Segment
- 1.3.1 Career Changers
- 1.3.2 Early-Career Entrants
- 1.3.3 Employed Technical Professionals
- 1.4 By Delivery Model
- 1.4.1 Live Online
- 1.4.2 In-Person
- 1.4.3 Hybrid
- 1.5 By Revenue Model
- 1.5.1 Individual Tuition
- 1.5.2 Employer Contracts
- 1.5.3 Publicly Funded Training Contracts
- 1.5.4 Placement Fees
Chapter 2 Introduction
- 2.1 Report Objectives and Scope
- 2.2 Product Definition and Industry Terminology
- 2.3 Market Inclusions and Exclusions
- 2.4 Research Process
- 2.4.1 Primary Research and Expert Interviews
- 2.4.2 Secondary Research and Source Review
- 2.4.3 Top-Down and Bottom-Up Estimation
- 2.4.4 Data Triangulation and Verification
- 2.5 Market Size Measurement Basis
- 2.5.1 2025: USD 86.5 million → 2035: USD 250.3 million
- 2.6 Historical and Forecast Reference Periods
- 2.6.1 Historical Period: 2018-2025
- 2.6.2 Base Year: 2025
- 2.6.3 Forecast Period: 2025-2035
- 2.7 Research Assumptions and Limitations
Chapter 3 Executive Summary
- 3.1 Market Snapshot and Key Findings
- 3.2 Base-Year Market Size, 2025
- 3.3 Forecast Market Size, 2035
- 3.4 Revenue and Volume Growth Outlook
- 3.5 Key Demand and Supply Indicators
- 3.6 Leading Market Segments
- 3.7 Fastest-Growing Market Opportunities
- 3.8 Regional Performance Highlights
- 3.9 Technology and Industry Transformation
- 3.10 Competitive Landscape Summary
- 3.11 Analyst View and Strategic Implications
Chapter 4 Australia Coding Bootcamp Market Trends and Developments
- 4.1 Historical Industry Development, 2018-2025
- 4.2 Recent Market Trends and Developments
- 4.3 Demand and Customer Behavior Trends
- 4.4 Technology and Product Innovation
- 4.5 Artificial Intelligence, Automation and Digitalization
- 4.6 Local Manufacturing and Supply Chain Realignment
- 4.7 Industry Partnerships, Mergers and Acquisitions
- 4.8 Sustainability and Circular Economy Developments
- 4.9 Government and Private Sector Investment Trends
- 4.10 Emerging Business Models and Commercialization
- 4.11 Industry Developments and Announcements
Chapter 5 Australia Coding Bootcamp Market Production, Supply and Demand Analysis
- 5.1 Demand Trend and Consumption Analysis, 2018-2025
- 5.2 Demand Forecast, 2025-2035
- 5.3 Production and Output Trend, 2018-2025
- 5.4 Production and Output Forecast, 2025-2035
- 5.5 Installed Capacity and Capacity Utilization
- 5.6 Company-Wise Production Plants and Statistics
- 5.6.1 Installed Production Capacity
- 5.6.2 Actual Production
- 5.6.3 Planned Capacity and Expansion Targets
- 5.7 Supply Chain Structure and Procurement Trends
- 5.8 Supply-Demand Gap and Bottlenecks
- 5.9 Import Dependence and Sourcing Structure
- 5.10 Contract Manufacturing and Outsourcing
- 5.11 Regional Supply and Demand Concentration
Chapter 6 Australia Coding Bootcamp Market Pricing Analysis
- 6.1 Pricing Structure and Measurement
- 6.2 Historical Pricing Trends, 2018-2025
- 6.3 Pricing Outlook, 2025-2035
- 6.4 Average Selling Price and Unit Economics
- 6.5 Pricing by Product and Market Segment
- 6.6 Geographic Pricing Differences
- 6.7 Key Input, Energy, Labor and Logistics Costs
- 6.8 Contract Pricing and Purchasing Models
- 6.9 Pricing Sensitivity and Competitive Positioning
- 6.10 Price, Margin and Profitability Implications
Chapter 7 Australia Coding Bootcamp Market Dynamics
- 7.1 Market Growth Drivers
- 7.1.1 Demand-Side Drivers
- 7.1.2 Technology and Innovation Drivers
- 7.1.3 Infrastructure and Investment Drivers
- 7.1.4 Regulatory and Policy Drivers
- 7.2 Market Restraints
- 7.2.1 Cost and Affordability Constraints
- 7.2.2 Technology and Adoption Barriers
- 7.2.3 Supply Chain and Operational Constraints
- 7.3 Market Challenges
- 7.3.1 Competitive Pressure and Margin Erosion
- 7.3.2 Skills, Infrastructure and Implementation Gaps
- 7.4 Emerging Market Opportunities
- 7.5 Market Dynamics Impact and Time-Horizon Assessment
Chapter 8 Australia Coding Bootcamp Value Chain Analysis
- 8.1 Industry Value Chain Overview
- 8.2 Upstream Suppliers and Critical Inputs
- 8.3 Technology and Component Providers
- 8.4 Manufacturing or Service Delivery
- 8.5 Distribution, Channel Partners and Integrators
- 8.6 Downstream Applications and End Users
- 8.7 Value Addition and Profit Pools
- 8.8 Vertical Integration and Outsourcing
- 8.9 Supplier Concentration and Risk
- 8.10 Supply Chain Localization and Resilience
Chapter 9 Australia Coding Bootcamp Market Regulations and Policies
- 9.1 Relevant Laws, Standards and Compliance Frameworks
- 9.2 Product, Service, Safety and Quality Requirements
- 9.3 Government Policies, Incentives and Subsidies
- 9.4 Imports, Exports and Trade Barriers
- 9.5 Public Procurement and Local Content Requirements
- 9.6 Environmental and Sustainability Compliance
- 9.7 Data Protection, AI and Cybersecurity Compliance
- 9.8 Upcoming Policy Changes and Market Implications
Chapter 10 Australia Coding Bootcamp Market Hotspots and Opportunities
- 10.1 Market Opportunity Mapping and Growth Hotspots
- 10.2 High-Growth Applications and Customer Groups
- 10.3 Underserved Markets and White-Space Opportunities
- 10.4 Emerging Technology and Product Opportunities
- 10.5 New Capacity and Investment Hotspots
- 10.6 Market Entry and Expansion Opportunities
- 10.7 Distribution and Partnership Opportunities
- 10.8 Near-Term and Long-Term Commercial Potential
- 10.9 Opportunity Attractiveness and Execution Risks
Chapter 11 Australia Coding Bootcamp Market Outlook, 2025-2035
- 11.1 Market Size and Analysis
- 11.1.1 Revenue (Market Measurement: 2025: USD 86.5 million → 2035: USD 250.3 million)
- 11.1.2 Market Volume and Quantity Sold
- 11.1.3 Historical Market Size, 2018-2025
- 11.1.4 Base-Year Market Size, 2025
- 11.2 Market Forecast, 2025-2035
- 11.2.1 Revenue Forecast to 2035
- 11.2.2 Volume Forecast to 2035
- 11.2.3 CAGR and Year-on-Year Growth
- 11.2.4 Incremental Revenue Opportunity
- 11.3 Forecast Assumptions and Scenario Analysis
- 11.3.1 Base-Case Forecast
- 11.3.2 Optimistic and Conservative Scenarios
- 11.3.3 Technology, Pricing and Policy Sensitivities
- 11.4 Market Attractiveness and Growth Outlook
Chapter 12 Australia Coding Bootcamp Market Segmentation and Outlook
- 12.1 Segmentation Summary and Market Shares, 2025
- 12.2 Largest and Fastest-Growing Segments
- 12.3 By Service Type - Market Size and Forecast, 2025-2035
- 12.3.1 Segment Definition and Scope
- 12.3.2 Historical Market Size, 2018-2025
- 12.3.3 Revenue Forecast, 2025-2035
- 12.3.4 Volume Forecast, 2025-2035
- 12.3.5 Base-Year Market Share, 2025
- 12.3.6 Segment CAGR and Growth Drivers
- 12.3.7 Subsegment Market Size and Forecast
- 12.3.7.1 Software Development
- 12.3.7.2 Data Science and AI
- 12.3.7.3 Cybersecurity
- 12.3.7.4 UX/UI Design
- 12.3.8 Subsegment Pricing and Adoption Trends
- 12.3.9 Leading Suppliers and Competition
- 12.3.10 Regional Demand and Opportunities
- 12.4 By Learner Segment - Market Size and Forecast, 2025-2035
- 12.4.1 Segment Definition and Scope
- 12.4.2 Historical Market Size, 2018-2025
- 12.4.3 Revenue Forecast, 2025-2035
- 12.4.4 Volume Forecast, 2025-2035
- 12.4.5 Base-Year Market Share, 2025
- 12.4.6 Segment CAGR and Growth Drivers
- 12.4.7 Subsegment Market Size and Forecast
- 12.4.7.1 Career Changers
- 12.4.7.2 Early-Career Entrants
- 12.4.7.3 Employed Technical Professionals
- 12.4.8 Subsegment Pricing and Adoption Trends
- 12.4.9 Leading Suppliers and Competition
- 12.4.10 Regional Demand and Opportunities
- 12.5 By Delivery Model - Market Size and Forecast, 2025-2035
- 12.5.1 Segment Definition and Scope
- 12.5.2 Historical Market Size, 2018-2025
- 12.5.3 Revenue Forecast, 2025-2035
- 12.5.4 Volume Forecast, 2025-2035
- 12.5.5 Base-Year Market Share, 2025
- 12.5.6 Segment CAGR and Growth Drivers
- 12.5.7 Subsegment Market Size and Forecast
- 12.5.7.1 Live Online
- 12.5.7.2 In-Person
- 12.5.7.3 Hybrid
- 12.5.8 Subsegment Pricing and Adoption Trends
- 12.5.9 Leading Suppliers and Competition
- 12.5.10 Regional Demand and Opportunities
- 12.6 By Revenue Model - Market Size and Forecast, 2025-2035
- 12.6.1 Segment Definition and Scope
- 12.6.2 Historical Market Size, 2018-2025
- 12.6.3 Revenue Forecast, 2025-2035
- 12.6.4 Volume Forecast, 2025-2035
- 12.6.5 Base-Year Market Share, 2025
- 12.6.6 Segment CAGR and Growth Drivers
- 12.6.7 Subsegment Market Size and Forecast
- 12.6.7.1 Individual Tuition
- 12.6.7.2 Employer Contracts
- 12.6.7.3 Publicly Funded Training Contracts
- 12.6.7.4 Placement Fees
- 12.6.8 Subsegment Pricing and Adoption Trends
- 12.6.9 Leading Suppliers and Competition
- 12.6.10 Regional Demand and Opportunities
- 12.7 Segment Growth Comparison
- 12.8 Segment Attractiveness and Priority Matrix
Chapter 13 Australia Coding Bootcamp Geographic Market Outlook, 2025-2035
- 13.1 Domestic Market Distribution and Demand Clusters
- 13.2 State- or Province-Wise Market Size and Forecast, 2025-2035
- 13.3 City and Metropolitan Market Outlook
- 13.4 Industrial, Manufacturing and Commercial Clusters
- 13.5 Geographic Concentration of Key End Users
- 13.6 Local Pricing and Purchasing Differences
- 13.7 Domestic Production Facilities and Capacity Map
- 13.8 Local Infrastructure and Project Pipeline
- 13.9 State-Level Policy and Incentive Differences
- 13.10 Subnational Investment Hotspots and Opportunities
- 13.11 Distribution and Logistics Networks
- 13.12 Domestic Competitive Footprint
Chapter 14 Australia Coding Bootcamp Technology, Innovation and Sustainability Outlook
- 14.1 Technology Landscape and Maturity
- 14.2 Product, Process and Service Innovation
- 14.3 AI, Automation and Digital Tools in the Industry
- 14.4 Technology Adoption and Performance Benchmarking
- 14.5 Innovation Pipeline and R&D Investment
- 14.6 Patent and Intellectual Property Trends
- 14.7 Energy Efficiency and Resource Management
- 14.8 Sustainability, Recycling and Circularity
- 14.9 Technology Roadmap, 2025-2035
- 14.10 Risks of Obsolescence and Technology Substitution
Chapter 15 Australia Coding Bootcamp Market Key Strategic Imperatives
- 15.1 Growth and Market Entry Priorities
- 15.2 High-Return Products and Segments
- 15.3 Pricing, Profitability and Cost Optimization
- 15.4 Technology Investment and Product Differentiation
- 15.5 Supply Chain Localization and Resilience
- 15.6 Distribution and Customer Acquisition
- 15.7 Partnership, Acquisition and Capacity Strategy
- 15.8 Regional Expansion Priorities
- 15.9 Short-, Medium- and Long-Term Actions
Chapter 16 Competition Outlook
- 16.1 Industry Competition Characteristics
- 16.2 Market Structure and Concentration
- 16.3 Market Share and Competitive Positioning, 2025
- 16.4 Company-Wise Revenue and Product Benchmarking
- 16.5 Production and Service Capacity Benchmarking
- 16.6 Technology, Pricing and Differentiation
- 16.7 Regional Footprint and Distribution Strength
- 16.8 Mergers, Acquisitions and Strategic Alliances
- 16.9 New Entrants and Competitive Threats
- 16.10 Porter's Five Forces and Industry Attractiveness
- 16.11 Competitive Outlook, 2025-2035
Chapter 17 Company Profiles
- 17.1 Company Coverage and Selection Criteria
- 17.2 General Assembly
- 17.2.1 Business Description
- 17.2.2 Company Ownership and Geographic Presence
- 17.2.3 Product and Service Portfolio
- 17.2.4 Manufacturing and Operating Footprint
- 17.2.5 Production Capacity and Expansion Plans
- 17.2.6 Financial Performance and Investment
- 17.2.7 Market Share and Competitive Position
- 17.2.8 Technology and Innovation Capabilities
- 17.2.9 Strategic Alliances or Partnerships
- 17.2.10 Recent Developments
- 17.2.11 Growth Strategy and Outlook
- 17.3 Academy Xi
- 17.4 Coder Academy
- 17.5 Le Wagon
- 17.6 Institute of Data
- 17.7 Other Relevant Market Participants
Note: Every listed company is profiled on the structure shown under the first company. The company list is preliminary and may change based on research findings, market developments, data availability and client requirements.
Chapter 18 Disclaimer
- 18.1 Research and Forecast Disclaimer
- 18.2 Data Source and Estimation Limitations
Note: The depth of individual sections depends on data availability for this market. Volume, capacity, trade and other unit-based metrics are included where applicable.

